Abstract
Background/Objectives: Alveolar macrophages represent the main path of defense in the peripheral pulmonary tissue, though their role in chronic inflammatory lung diseases shows that their protective function can turn pathological. This study focused on developing a system to passively target the release of the pro-inflammatory cytokine TNF-α through the local delivery of siRNA. Methods: An inhalable aspherical microparticle made up of mesoporous silica nanoparticles, crosslinked by an electrostatic LbL-system embedding the siRNA, was developed. Results: Through testing with the NGI, adequate aerodynamic properties with an MMAD as low as 3.37 µm could be determined, with a GSD as low as 1.46, suggesting a relatively small size distribution even during inhalation. To further understand the interaction of the microrods with the lung parenchyma and the resident cells, the disintegration of the rods in different simulant body fluids, their toxicity, and the cell uptake through dTHP-1 and A549 were observed. This showed slow but continuous disintegration, no toxicity in A549 cells, and high microrod uptake by dTHP-1 cells. To demonstrate the effect of the delivered siRNA on the release of TNF-α, ELISAs were carried out, establishing an inhibitory effect of the siRNA-carrying microcarrier system compared to those without siRNA or loaded with scrambled siRNA. To increase the efficacy of the siRNA, chloroquine as an endosomal escape-enhancing compound was loaded onto the mesoporous silica nanoparticles. This resulted in a significant improvement in siRNA inhibition. Conclusions: The developed formulation is able to reach the targeted structure and inhibit the secretion of TNF-α, with CQ increasing the inhibitory effect of the siRNA.
1. Introduction
Acute inflammation in the lung tissue is a protective reaction by the immune system with the purpose of fighting pathogens and removing harmful substances [1,2]. It is when acute inflammation turns into chronic inflammation that a previously beneficial process turns harmful and can impede the lung’s physiological function long-term. The most common diseases associated with this pathology are chronic respiratory diseases, like cystic fibrosis, COPD, and asthma, leading to persistent inflammation and inducing lung tissue remodeling, which eventually causes decreased lung functionality. Chronic respiratory diseases are currently one of the five diseases (outside of transmissible diseases) showing the highest mortality and morbidity globally [3,4]. The global prevalence of COPD is estimated to be 10.3% (95% CI 8.2–12.8) among the 30–79-year-old population (this equates 391.9 million people), with a conceivable chance of higher numbers due to underdiagnosis [5,6,7]. Especially in low- and middle-income regions, there is a growing concern about increased risk factors like smoking and air pollution, among others. In Europe and the US, a decrease in overall COPD prevalence within the last few years could be observed. Though this extends only to men, COPD prevalence in women is increasing globally, but also specifically in high-income countries. This might be due to increasing tobacco use in women and anatomical differences decreasing the resistance against air pollution [8,9]. With 3.2 million deaths each year, COPD is now the fourth leading cause of death among non-communicable diseases [10,11,12]. With the uncertain long-term consequences of increased e-cigarette use, the lasting implications of past COVID-19 infections, and the effects of climate change on our lungs, the possible risk factors seem to be ever-expanding.
At physiological conditions, alveolar macrophages (AM) represent the main path of defense in the peripheral parts of the lung. Pathologically, they are thought to be central to the inflammatory processes and most of the associated changes in the lung tissue of chronic inflammatory diseases [13,14]. A correlation between the number of macrophages and COPD severity [15,16], as well as a shift in morphological subpopulations [17,18] and alterations in their abilities of clearing apoptotic cells [19] and bacterial pathogens [20], has been observed. TNF-α plays an important role in the activation and sustentation of inflammation by AM. Unfortunately, in contrast to macrophages in other tissues, AM found in COPD patients exhibit a resistance towards the inhibition of cytokine release by glucocorticoids, leading to decreased therapeutic success [21,22], which indicates the need for alternative avenues of cytokine (and, thus, AM) inhibition. The emergence of siRNA offers exactly this kind of alternative and promising path, though the successful delivery of RNA-based medication is known to be a bottleneck in its success as a broad-ranging API.
In this work, we explore an inhalable siRNA delivery system to treat chronic inflammatory diseases. A local delivery of APIs through inhalation increases the local potency of drugs and decreases the side effects present in systemic application [23,24]. Additionally, in this case, it decreases the risk of RNA degradation by limiting the contact risk and time between siRNA and RNAses, ubiquitous in blood and other body fluids [25,26]. To reach the targeted peripheral parts of the lung, a nanostructured aspherical microparticle was developed. Through their rod-like shape, they have the ability to align with the air stream, making it possible to travel into the deeper parts of the lung. At the same time, the shape presents the possibility of increasing the delivered volume and surface area compared to spherical microparticles, even with a similar front-facing diameter. Furthermore, the modified phagocytotic behavior of macrophages can be exploited to extend the retention in the lung and thereby prolong the therapeutic time frame [27,28].
The microrods are produced with a template-based approach [29,30] and use mesoporous silica nanoparticles (mSNPs) to construct the scaffolding. In recent years, mSNPs have received increased recognition as possible drug delivery systems due to their many positive characteristics relating to their high surface area and pore volume, enabling high drug loading and the ability to load poorly soluble drugs [31,32,33], with the porous structure improving biocompatibility compared to solid silica nanoparticles [34,35]. mSNPs have been used for a variety of drugs, including macromolecules like proteins [34,36,37,38], DNA [39,40], and the type of API used here, RNA [41,42,43,44,45,46], while also employing varying nanoparticle shapes [47,48,49]. Bukara et al. first demonstrated improved in vivo drug delivery by mSNPs in humans [50], laying the groundwork for all its future use as a drug delivery system.
The mSNPs are crosslinked with a thin film based on a layer-by-layer (LbL) system composed of oppositely charged polyelectrolytes. This establishes a needed cohesion of the nanoparticles, and, in addition, it provides a structure electrostatically embedding siRNA (Figure 1).
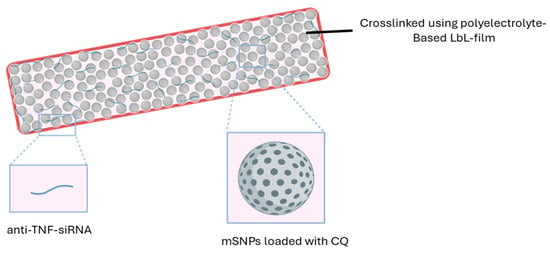
Figure 1.
Morphology of the delivery system.
In previous systems developed by our group, the effect of the delivered siRNA was lower than expected [51,52]. A possible reason was the lack of endosomal escape that the siRNA experienced once taken up by the macrophages. This is an often-reported issue in the therapeutic application of siRNA [53,54]. Rather than being released into the cytoplasm where the targeted structure, the mRNA, is located, the siRNA was stranded in the endosome and was degraded by endosomal and lysosomal enzymes. To combat this, we used chloroquine (CQ), loaded in the pores of mSNPs, to improve the endosomal escape. This characteristic of chloroquine has recently received a lot of attention, bringing chloroquine once again to the focus of new research [55,56,57].
To summarize, the aim of this project is the preparation of an inhalable drug delivery system for anti-TNF-α siRNA to target alveolar macrophages responsible for inflammatory processes and subsequent complications in chronic inflammatory lung diseases, like COPD. The chosen pharmaceutical formulation is based on an aspherical microparticle, made up of mesoporous silica nanoparticles loaded with CQ to support the endosomal escape of the siRNA. The siRNA is loaded into an LbL thin film that simultaneously is used to crosslink the mSNPs and to preserve the rod-like structure.
2. Materials and Methods
2.1. Materials
Mesoporous silica nanoparticles with a diameter of 200 nm and 4 nm pore size (758161-5G), as well as hexadecyltrimethylammonium bromide (CTAB) (H5882-100G), tetraethyl orthosilicate (TEOS) (131903-250ML), chloroquine diphosphate (C6628-25G), rhodamine B (83689-1G), L-leucine (L8000-50G), RPMI-1640 medium (R8758-500ML), Dulbecco’s Phosphate-Buffered Saline (RNBN0899), phorbol 12-myristate 13-acetate (PMA) (P1585-5MG), 3-(4,5-dimethylthiazol-2-yl)-2,5diphenyltetrazolium bromide (MTT) (M5655-1G), paraformaldehyde (PFA) (P-6148), 4′,6-diamidino-2-phenylindol solution (DAPI) (D9542-1MG), glutaraldehyde solution 25% in water (GA) (G6257-10ML), lipopolysaccharides from Escherichia coli O55:B5 (LPS) (L6529-1MG), potassium chloride (P5405-250G), sodium hydroxide, and 2-(N-morpholino)ethanesulfonic acid (MES) (M2933-1KG) were purchased from Sigma Aldrich (Merck, Darmstadt, Germany). IpPORE Track Etched membranes with a pore size of 3 µm, 1 × 106 cm−2 pore density, and 12 µm thickness were customized and purchased from it4ip S.A. (Louvain-la-Neuve, Belgium). DEAE-dextran 20 and dextran sulfate 10 HS were purchased from TdB Labs (Uppsala, Sweden). Tetrahydrofuran (THF) (T/0706/PB17), sodium chloride (S/3160/60), concanavalin A, Alexa Fluor 488 conjugate (C1152), dimethyl sulfoxide (DMSO) (348445000), human TNF alpha uncoated ELISA kit (88-7346-88), Fetal bovine serum (FCS) (10270-106), Hanks’ Balanced Salt Solution (HBSS) (14025-050), Silencer® Pre-designed siRNA (sequences: Sense (5′GACCUCACCUAGAAAUUGAtt-3′); Antisense (5′-UCAAUUUCUAGGUGAGGUCtt-3′)) (AM16706), SilencerTM Select Negative Control No. 1 siRNA (sequences: Sense (5′-UAACGACGCGACGACGUAAtt-3′); Antisense (5′-UUACGUCGUCGCGUCGUUAtt-3′)), and UltraPureTM DNase-/RNase-free distilled water (10977-035) were purchased from different brands of Thermo Fisher Scientific Inc. (Waltham, MA, USA). Sodium dihydrogen phosphate (BD151438-500g) was purchased from BLD Pharmatech GmbH (Reinbek, Germany). Calcium chloride (HN04.1), potassium phthalate (P750.1), glycine (3908.2), diethyldicarbonate (DEPC) (K028.3), and ethidium bromide (2218.1) were purchased from Carl Roth (Karlsruhe, Germany). Acetonitrile (ACN) (20060.3), ethyl acetate (83621.320), magnesium chloride (25109.298), and d-glucose (24369.29) were purchased from VWR International (Radnor, PA, USA).
2.2. Preparation of Mesoporous Silica Nanoparticles (mSNPs)
To prepare MCM-41 mesoporous silica nanoparticles (mSNP) with the desired properties, a slightly adjusted protocol based on the work of Castillo et al. [58] was used. A basic cetrimonium bromide solution was prepared and kept at 60 °C while continuously stirred at 800 rpm. Tetraethyl orthosilicate (TEOS) was added at a constant rate via syringe pump (Harvard Bioscience Inc., Holliston, MA, USA). The resulting emulsion was kept at the same temperature and stirring speed for 2 h for the reaction to fully take place. Towards the end of the 2 h, 1M HCl is added to stop the reaction from continuing, thereby decreasing the chance of aggregation during washing and purification steps. The suspension was centrifuged in water (2×) and ethanol (2×) at 10,000× g for 10 min. To remove CTAB from the pores, the nanoparticles were resuspended with a mixture of 95:5 methanol and acidic 10 g/L NaH2PO4 solution and kept under reflux for 3 h. The particles were centrifuged down, and the reflux process was repeated. To purify a final time, the nanoparticles were once again centrifuged and resuspended with water (2×) and methanol (2×). The mSNPs were stored in a dry state.
2.3. Characterization of mSNPs
mSNPs were characterized by several different parameters. DLS and zeta potential measurements were performed with a Zetasizer Ultra (Malvern Panalytical, Malvern, UK) by measuring a diluted suspension in MilliQ water. The dilution was chosen to obtain an approximate attenuator of 6. The morphology of mSNPs was imaged by Transmission Electron Microscopy (TEM, JEOL JEM-2100, JEOL, Tokyo, Japan). Images were captured in bright field using a Gatan Orius SC1000 camera (Gatan Inc., Pleasanton, CA, USA). Samples were prepared by adding a drop of highly diluted mSNP suspension in MilliQ water on a carbon-coated copper grid and left to dry at room temperature with sufficient air exchange.
2.4. Deprotonation and Loading of mSNPs with Chloroquine
Chloroquine (CQ) was purchased as a diphosphate salt, so deprotonation was necessary to obtain the free base. To achieve this, chloroquine salt was dissolved in MilliQ water and subsequently precipitated by adding a surplus of sodium hydroxide solution. To extract the chloroquine, multiple extraction cycles with ethyl acetate (EA) were performed. To remove excess water, subsequent extraction cycles with saturated sodium chloride solutions followed. After sodium sulfate was added, the supernatant was moved to a rotary evaporator (Rotavapor R-100, Büchi Labortechnik, Flawil, Switzerland) and the EA was evaporated under decreased pressure and elevated temperatures.
CQ is loaded into the pores of mSNPs by the solvent evaporation method, which was reported to be the most convenient method for lipophilic drug loading in mSNPs due to its simplicity and adequate loading efficiency [59]. Then, 2% CQ was dissolved in acetonitrile (ACN), and mSNPs in a ratio of 1:10 (mSNP-to-CQ solution) were added. To ensure the homogenous dispersion of mSNPs, the suspension was put in an ultrasonic bath for twenty minutes. In the next step, the ACN was evaporated by heating the suspension to 90 °C while being continuously stirred until all the solvent evaporated. The mSNPs were then washed with slightly basic MilliQ water (3×) and subsequently lyophilized.
2.5. Preparation of Rods
The preparation of the microrods was similar to the method previously described in [51,60]. The aspherical microparticles are produced using a tailor-made polycarbonate membrane in which the pores act as a mold for the resulting microrods and thereby limit deviation from the desired shape. Therefore, the pore properties correspond to the properties of the produced rods; the thickness of the membrane determines the length, and the diameter of the pores determines the width of the rods. In the case of this work, the pores of the utilized membranes were approximately 12 µm in thickness and had a diameter of 3 µm. Previous work from our group demonstrated how to realize rods with differing properties [61]. The mSNPs served as scaffolding for the microparticle structure. In these experiments, two kinds of mSNPs were used: the self-made MCM-41 (as previously described) and commercial mSNPs (purchased from Merck). The particles were crosslinked with an LbL-film using oppositely charged polyelectrolytes [29].
To infiltrate the nanoparticles into the membrane pores, the membrane was placed on top of a drop of nanoparticle suspension. The capillary forces present caused the nanoparticles to deposit in the pores (Figure 2). The excess nanoparticles on the surface were cleaned off with a damp lint-free tissue once all the liquid had dried. This procedure was repeated eight times, alternating the downward-facing side of the membrane.
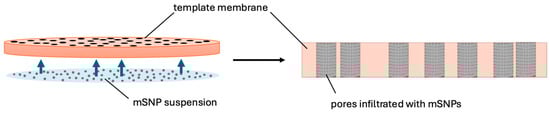
Figure 2.
Schematic of the infiltration process exploiting capillary forces to move the colloidal suspension into the pores.
The nanoparticles within the pores exhibited the morphology of the future microrod. To enable the nanoparticles to remain in this structure without confinement of the pores, the nanoparticles needed to be crosslinked. For this, an LbL-film was prepared by alternately applying a 2% diethylaminoethyl dextran and 2% dextran sulfate solution containing sodium chloride with a lint-free tissue onto the membrane (3×). When loading siRNA, one step of the dextran sulfate solution was replaced by a 0.05% siRNA solution. Between each crosslinking step, the membrane was cleaned with MilliQ water.
Finally, the polycarbonate membrane was dissolved in tetrahydrofuran (THF). The resulting suspension was centrifuged at 200× g. The pellet was resuspended in THF, centrifuged, and resuspended two more times to ensure polycarbonate removal. When using CQ-loaded mSNPs, 2% chloroquine was dissolved in the THF to avoid premature release during loading due to a lower concentration gradient.
2.6. Microrod Characterization
Particle morphology was determined by Zeiss Evo HD 15 Electron Microscope (Carl Zeiss, Jena, Germany) equipped with a Lanthanum hexaboride (LaB6) cathode. A drop of microrod suspension was added to a silica wafer, and the water was evaporated at a slightly increased temperature and with circulating air in a drying chamber. A Quorum Q150R ES coater (Quorum Technologies, East Grinstead, UK) was used to cover the surface with an approximately 10 nm thick gold layer to increase the conductivity of the sample and thereby the quality of the picture obtained. Acceleration voltages of 5.00 and 10.00 kV were used.
To visualize the morphology of the microparticles after the aerosolization procedure and deposition, the surface of an adhesive carbon disk fixed to an SEM pin stub was placed on top of a particle cluster in the individual NGI stages and then removed. Afterwards, the sample was sputter-coated as described above.
Length analysis was carried out by CLSM/Fiji and Flow Image Microscopy with multiple batches. For CLSM, rhodamine-labeled microrods [35] were imaged by CLSM and later individually measured with FIJI software (Version 2.14.0/1.54f). For the Flow Imaging Microscopy approach, a FlowCam® 8000 series (Fluid Imaging Technologies, Scarborough, ME, USA) was used with its integrated system to analyze the particle population, similar to the method described before [61].
2.7. Disintegration Behavior in Different Media
To ensure the effective uptake by alveolar macrophages, adequate stability after inhalation was essential, thus requiring insight into the disintegration behavior of the formulation. Given the different physiological compartments that the microrods would be exposed to during application, three different simulated body fluids (SBF) were chosen as suspension fluid for the experiments. Simulated lung fluid (SLF) with a pH of 7.4 represented the interstitial fluid found in the lung [62,63], simulated endosomal fluid (SEF) with a pH of 5.5 [63,64] and artificial lysosomal fluid (ALF) with a pH of 4.55 [65] represented the endosomal and lysosomal environment, respectively.
Briefly, 1 mg/mL microrod suspensions were prepared and placed in a thermal shaker at 37 °C and 800 rpm. At fixed time points, a sample was taken and diluted to a concentration of 0.05 mg/mL to reduce the risk of blockage in the FlowCam® capillary. The suspension was then fed into the FlowCam® capillary, which determined how many intact rods were present based mostly on the following parameters: length, width, circularity, and intensity. An intact rod was hereby defined as a microparticle with a length larger than 9 µm. The number of rods recovered at time point 0 h was set as 100%; each following sample representing later time points was calculated in proportion to the starting point.
2.8. Release Studies
CQ and siRNA release were studied in multiple simulated body fluids (SBF) as in the disintegration experiment to reflect different acceptor media present during application. Briefly, 1 mg of microrods was added to 1 mL of SBF and kept at 37 °C and constant shaking (800 rpm) with the supernatant extracted at several time points (1, 2, 3, 4, 5, 24 and 48 h for CQ; 3, 6, 24, 48, 120 and 196 h for siRNA).
CQ release was analyzed by fluorescence measurement with a microplate spectrophotometer (TecanReader® infinite M200, Tecan, Männedorf, Switzerland) at exc./em. 565/625 nm.
To measure siRNA release, the supernatant was mixed with 5 µg/mL ethidium bromide (EtBr) in TNE buffer in a well plate [66]. Ethidium bromide is an intercalating agent [67], most often used to stain DNA in agarose gel electrophoresis [68], but it has also been utilized to quantify siRNA [67,69]. It is widely available and very cost-effective. A 30 min incubation time under constant shaking was chosen to ensure sufficient time for EtBr intercalation into siRNA. The fluorescence was then measured with a microplate spectrophotometer (TecanReader SparkCyto, Tecan, Männedorf, Switzerland) at exc./em. 302/509 nm and 10 nm bandwidth.
2.9. Analysis of Aerodynamic Properties
The aim of the project is targeted alveolar macrophage inhibition, so sufficient delivery to the target structure is essential. To understand the aerodynamic properties of the formulation, measurements with a New Generation Impactor (NGI; Copley Scientific, Nottingham, UK) were performed. Rhodamine B-labeled microrods were resuspended in MilliQ water or leucine solution to attain different leucine-to-microrod ratios (0%, 0.5%, 1% and 2%), and subsequently freeze-dried to produce a thin layer of leucine around individual microrods. Leucine is an established excipient in pulmonary formulations due to its physicochemical properties [70,71]. The aim in this formulation was to enhance flowability and redispersibility by forming a hydrophobic shell around the microrods [72,73]. This also reduced hygroscopicity, which increased storage stability.
For NGI analysis, approximately 3 mg of the dry formulation was placed in a size 3 hard gelatin capsule. The NGI was set up to apply a flow rate of 60 L/min for 4 s during the experiment. A HandiHaler® (Boehringer Ingelheim, Ingelheim am Rhein, Germany) was chosen as the inhalation device and used according to the user manual provided by Boehringer Ingelheim.
To quantify the deposited particles, the NGI parts were rinsed with specific volumes of MilliQ water. The attained dispersion was pipetted into a microplate and detected through fluorescence spectrometry with the help of a microplate spectrometer (TecanReader® infinite M200, Tecan, Männedorf, Switzerland) at exc./em. 565/725 nm.
2.10. Cell Culture
Differentiated THP-1 (dTHP-1) cells represent a model for the targeted cells, alveolar macrophages. A549 is a cell line derived from adenocarcinomic lung cells [74] and is used as a model for alveolar epithelial cells [75]. Within these experiments, they are intended to represent healthy non-target cells found in the surrounding area of the target.
THP-1 (TIB-202™) and A549 (CCL-185™) cells were grown in RPMI 1640 medium enriched with 10% fetal bovine serum and incubated under a humidified atmosphere of 37 °C and 5% CO2.
2.11. Differentiation of THP-1 Cells into M0 Macrophage-like Cells
For viability and cellular uptake studies, M0 macrophage-like cells, differentiated from human monocytes (THP-1) [76,77,78,79] as origin cells, were utilized. Initially, the cells were incubated in RPMI 1640 medium, enriched with 10% fetal bovine serum at 37 °C and 5% CO2 atmosphere. To provoke differentiation, 50 ng/mL phorbol-12-myristate-13-acetate (PMA) was added to the medium and incubated with THP-1 cells for 48 h. After 48 h, the cells were washed and given a 24 h rest period in RPMI-1640 + 10% FCS medium without the addition of PMA [80]. The successful differentiation was ascertained by light microscopy using a Zeiss Avio Vert. A1 (Carl Zeiss, Jena, Germany). THP-1 cells were round and suspended in the media, while dTHP-1 cells adhered to the flask’s surface and presented as polygonal and often exhibited extended pseudopodia [81]. All incubation steps were carried out in the aforementioned conditions (Section 2.10).
2.12. Viability Testing with MTT Assay
To test cell proliferation after exposure to the microrod formulation, MTT assays with dTHP-1 and A549 cells were performed. The MTT assay is an established cell viability test that measures the reduction of the eponymous 3-(4,5-di methyl thiazol-2-yl)-2,5-diphenyltetrazolium bromide (MTT) to formazan by light absorption [82]. The reduction is understood to be facilitated by several enzymes, mostly within the cells [83,84,85], with the amount of MTT converted in a specified time frame corresponding to the number of metabolically active cells.
In order to test the viability of dTHP-1 cells, 50,000 THP-1 cells were seeded in each well of a 96-well plate and differentiated according to the aforementioned protocol. For testing with A549 cells, 20,000 cells were seeded and rested for 24 h in RPMI 1640 + 10% FCS medium before testing started. Once the resting period passed, cell morphology was checked with a light microscope, then both cell lines were incubated with suspensions containing different concentrations of microrods (10, 50 and 100 µg/mL) for 24 h. After the respective incubation times, cells were washed with PBS, then 0.5 mg/mL of MTT in HBSS was added. The cells were incubated with MTT reagent for 4 h to give an appropriate time for the reaction to take place. Lastly, the reagent was removed without additional washing steps. DMSO was added to dissolve the formazan crystals, and the plate was incubated for 15 min to ensure full solubilization. Subsequently, the absorption was measured at 550 nm by a TecanReader® infinite M200.
2.13. Cellular Uptake
To further understand how the targeted and non-targeted cells interacted with the formulation, particle uptake studies were initiated.
In total, 50,000 THP-1 cells were seeded in each well of an 8-well µ-slide and differentiated as previously described. Additionally, 20,000 A549 cells were also seeded in an 8-well µ-slide and utilized after a 24 h resting period.
Both cell lines were incubated with rhodamine B-labeled microrod suspensions with the same concentrations used in previous MTT assays for different time periods. Four time periods (1 h, 4 h, 9 h and 24 h) were chosen to enable the observation of microrod uptake by the cells over time. In addition to looking at the influence of microrod concentration on the cell uptake, the influence of surface charge on the microrods was also examined. This was determined by using microrods with opposing polyelectrolytes as the outermost layer, thereby reversing the surface charge.
For CLSM analysis, cells were washed three times with HBSS and subsequently fixed with 2% paraformaldehyde for 30 min at 4 °C. After washing again with HBSS, a staining protocol with 4′,6-diamidin-2-phenylindol (DAPI) for DNA and Concanavalin A for cell surface staining was performed. Both fluorescent stains were incubated subsequently with the cells at room temperature for 40 min. To remove unbound dye, the cells were washed three times with HBSS. Once the staining was completed, the cells were visualized through confocal laser scanning microscopy (LSM710, Carl Zeiss, Jena, Germany) using a 63× water immersion objective. Images at various arbitrary locations within the well were taken. All images were processed with the FIJI software [86]. To quantify the uptake, internalized rods and the overall number of cells were counted in the processed images, and their ratio was calculated.
For further visualization of microrod uptake, SEM images were obtained. To ensure stable cell morphology even through necessary dehydration steps, a slightly adjusted fixation protocol was utilized. Once the last washing step with HBSS was finished, the cells were incubated with a solution of 2% glutaraldehyde and 2% paraformaldehyde in PBS for 20 min at 4 °C [87]. Subsequently, the cells were washed 3× with room temperature HBSS and dehydrated with a 10-step ethanol series. To fully remove the remaining ethanol, the cells were put in a heating chamber at 37 °C and left overnight to ensure sufficient evaporation. The sample was prepared for SEM and imaged as previously described.
2.14. Evaluation of TNF-α Release from Macrophages
In total, 300,000 THP-1 cells were seeded in a 24-well plate and differentiated as previously described. The 300,000 cells per 24 wells corresponds to the previously used 50,000 cells per 96 wells in terms of cells/surface area ratio. Once the 24 h resting period was completed, the cells were incubated with 10, 50, and 100 µg/mL microrod suspensions for 48 h. Different microrod formulations were used, varying in CQ loading, to understand the impact of the presence and location of CQ within the system on the release of TNF-α. Furthermore, a sample containing no siRNA was added to serve as a control for the inhibiting impact of the siRNA mechanism. After 48 h, the cells were washed with HBSS and subsequently incubated with RPMI 1640 + 10% FCS medium containing 200 ng/mL LPS for 6 h to stimulate cytokine release mimicking the inflammation. As a negative control, cells that had not been incubated with a formulation previously were incubated with pure RPMI 1640 + 10% FCS medium, and a positive control consisted of cells that had been left untreated beforehand and were then incubated with LPS as well.
After 6 h, the supernatants were centrifuged to remove impurities like cell fragments and then used in the sandwich ELISA assay based on 3,3′,5,5′-tetramethylbenzidine (TMB) as an enzymatic marker. The ELISA assay was carried out as described by the manufacturer.
2.15. Statistical Analysis
All statistical analyses were performed with GraphPad 10.4.2. Significance and non-significance were established with one-way ANOVA for non-grouped and two-way ANOVA for grouped data, and with a subsequent Tukey’s range test for multiple comparisons. Confirmation of significance was determined at p < 0.05 (* represents 0.05, while **, ***, and **** represent 0.01, 0.001, and 0.0001, respectively).
3. Results and Discussion
3.1. Characterization of Mesoporous Silica Nanoparticles
Synthesis of mSNPs resulted in a colloidal suspension. Through DLS, the z-average was determined to be 251.35 ± 19.17 nm with a PdI of 0.1947 ± 0.0670. The particles possessed sizes suited for filling the template membrane and were easily dispersible. For further use as a scaffold for the microrods, the nanoparticles did not need to be monodisperse; therefore, a PDI of around 0.2 was sufficient. The measured zeta potential of −28.82 ± 1.34 mV suggests the possibility of the nanoparticles forming a stable suspension, which is an important property for successful microrod preparation. TEM images (Figure 3b) show nicely spherical nanoparticles with a clearly defined inner porous structure. This is in tune with the classification of the MCM-41 mSNP [88,89]. The hexagonal structure formed by CTAB in solution [58] can be found in the distribution pattern of the pores within the nanoparticles. The pores can also be seen running through the entire nanoparticles (Figure S1).
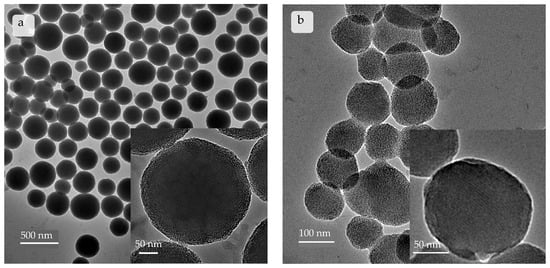
Figure 3.
Images taken by transmission electron microscope depicting (a) commercial mSNPs and (b) self-made mSNPs. Self-made mSNPs show a more ordered inner structure, with parallel arranged pores clearly visible.
The commercial mSNPs (Figure 3a) showed a slightly higher z-average of 303.4 ± 18.9 nm with a PDI of 0.1481 ± 0.0827. The zeta potential was also similar with a value of −30.44 ± 1.10 mV. TEM images showed spherical particles with a distinctly different porous structure. The density of the nanoparticles’ cores did not allow for tracking individual pores. Rather, a disorganized distribution pattern of pores reaching inwards can be observed (Figure 3a).
Both nanoparticle populations were suitable for microparticle preparation.
3.2. Microrod Characterization
Microrods were produced with a template-based approach using commercially available and self-made mSNPs. The width and length of the microrods corresponded to the properties of the template membrane pores as expected. This was determined by several techniques. CLSM images depicted rods made up of rhodamine B-labeled mSNPs, and SEM images depicted unlabeled microrods (Figure 4), highlighting the rod shape. The SEM images gave further insight into the morphology of the particles; the individual nanoparticles can be observed as being nicely stacked in the microrods, with the commercial nanoparticles being considerably bigger (Figure 4b) than their self-made counterparts (Figure 4a). The LbL-film serving as a crosslinker between individual nanoparticles could not be distinguished, suggesting that every nanoparticle became coated independently, and the crosslinking between the nanoparticles occurred due to the proximity of the nanoparticles within the microparticle. Both samples showed distinct non-agglomerated microparticles with a small particle size distribution, as seen in the images with a lower magnification.
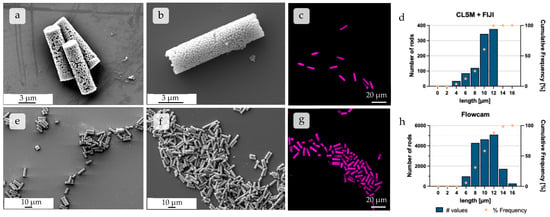
Figure 4.
SEM images of individual microparticles constructed from (a) self-made and (b) commercial mSNPs at higher magnification, respectively. SEM image showing an overview of multiple microrods made up of (e) self-made and (f) commercial mSNPs, respectively, at approximately 1.5 k magnification. CLSM images displaying rods made up of (c) commercial and (g) self-made mSNPs, representing the images used for further length analysis seen in (d). (d) Histogram of the number distribution of different rod lengths, extracted from CLSM images using FIJI. (h) Flow Image Microscopy (FlowCam®) analysis, which, by comparison, featured much higher individual rod numbers used in analysis.
To quantify the particle size distribution, length analyses via CLSM, combined with FIJI processing [86], as well as Flow Imaging Microscopy, using the FlowCam®, were performed [61]. The results of both methods showed similar results as expected, with the respective length averages being 10.01 µm and 10.35 µm, and the medians being even closer in length at 10.68 µm and 10.70 µm, respectively (Figure 4d,h). The biggest cohort in both analysis methods was confirmed as particles of 10–12 µm length, thus being in the expected range due to the geometry of the template membrane. Both methods led to similar results, the difference mostly being in the number of analyzed particles, with 961 analyzed rods for the CLSM + FIJI method and 16,984 analyzed rods for the FlowCam® method.
In conclusion, microparticles were prepared with the predicted nanoparticle framework, and the desired length could be confirmed by two different quantitative analysis methods.
3.3. Disintegration Behavior of Microparticles
The disintegration of the microparticles was measured in three separate simulant body fluids to depict differing compartments that the formulation was expected to encounter throughout its application. Simulant lung fluid (pH 7.4) was used to simulate interstitial lung fluid [62,63], simulant endosomal fluid (pH 5.5) modeled the maturing endosome [63,64,90,91,92], and artificial lysosomal fluid (pH 4.55) represented the lysosome once the maturation from endosome to lysosome had taken place [65,93].
The starting point was determined from three fresh samples, defining 100%. Disintegration was seen in all three simulant body fluids, with SLF (pH 7.4) showing the highest degradation. The number of intact rods in the neutral buffer decreased to almost 20% of the starting point. SEF (pH 5.5) showed similar disintegration, with around 30% being the final number of intact rods after 48 h. The disintegration in ALF (pH 4.55) showed considerably lower disintegration; only 30% of rods were unable to be recovered after 48 h.
The disintegration defined by a change in the length of the objects is thought to be based almost exclusively on a weakening of the LbL film, resulting in shorter fragments of the rods. Silica degradation can be ruled out during the observed time frame. So, the interaction of the polyelectrolyte films with the biological fluids was crucial for their disintegration. Considering the structure of DEAE-dextran, the lower disintegration at pH 5.5 and 4.55 can be explained by the tertiary amino group with a pKa of 5.5 [94], which became protonated within the endosomal maturation process and the development of the lysosome, and thus led to higher electrostatic forces between different layers of the LbL system. This led to lower disintegration, as seen in the FlowCam® data.
When comparing the median particle length, a similar trend can be observed (Figure 5b). The final median being 7 µm at the lowest point might seem unexpected, but this may be due to the particle analysis system of the FlowCam®, whose particle recognition is restricted to a minimum of 2–3 µm, thereby discriminating against smaller particles.
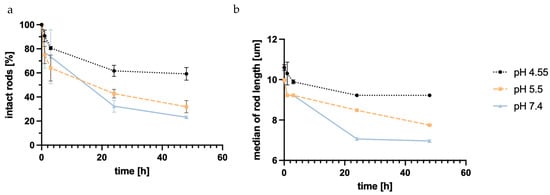
Figure 5.
Number of intact rods measured with Flow Imaging Microscopy (FlowCam®) in different simulant body fluids normalized to the starting point over time (a); median length of the measured rods in the different SBFs plotted against time (b). pH 7.4 shows the highest grade of degradation, with pH 5.5 only showing slightly less degradation, while pH 4.55 demonstrates much lower degradation, possibly due to the structure of DEAE-dextran.
The increased disintegration at higher pH is favorable when looking at the long-term retention outside of the targeted alveolar macrophage cells. When the macrophages’ uptake of rods does not occur in a timely manner, the rods disintegrate in the extracellular lung space, while microrods that are taken up keep their shape for an extended period of time.
It is crucial to note that this experiment only focuses on the influence of pH and electrolyte composition; the addition of enzymes present in the cell that target structures within the polyelectrolytes might increase the speed of disintegration, especially in the maturing endosome and lysosome. Furthermore, the experiment was conducted in an environment with a high surplus of SBF. This is not necessarily to be expected in a physiological environment, specifically in the environment representing the intestinal lung fluids prior to cell uptake. The pulmonary extracellular space is known for its low solvent volume [73,95], possibly slowing down degradation outside of the targeted cells.
3.4. Release of CQ from Microrods
Chloroquine was used to increase endosomal escape and, thereby, facilitate an increased effect of the simultaneously loaded siRNA. When loading the mSNPs, CQ’s free base was used for loading from organic solvents. This was also advantageous regarding the proposed mechanism of the endosomal escape enhancement [55,96,97].
Release over 48 h was observed in the same three simulant body fluids described in the degradation study. Regardless of pH and electrolyte environment, a burst release was observed within 1 h. Further CQ was released after the first hour, but the release slowed down. As seen in Figure 6a, the release inversely correlates with the pH value of the acceptor media. ALF at pH 4.55 showed the highest total release at 0.26 mg CQ per mg of rods, while SEF at pH 5.5 and SLF at pH 7.4 showed a lower overall release of 0.22 and 0.20 mg CQ per mg of rods, respectively. This was expected given the basic chemical structure of CQ, indicating higher solubility due to the protonation of the amino group. This is beneficial for later application, considering the site of action was within the endosome and lysosome. For the intended application, a release in the endosome was needed. Therefore, a change in pH during the experiment mimicking the acidification of the endosome should foster further release of CQ.
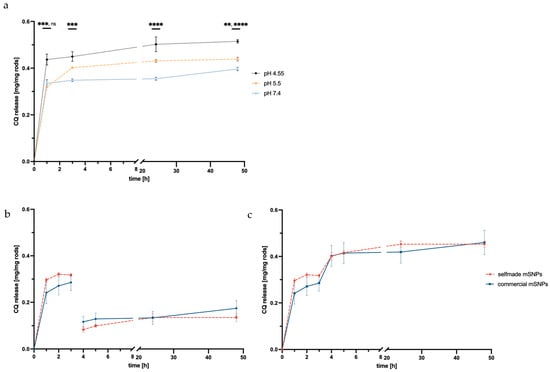
Figure 6.
pH dependence of CQ release from microrods made up of self-made mSNPs plotted against time in one continuous acceptor media (a) showing the highest amount released in ALF at pH 4.55. Non-cumulative (b) and cumulative release (c) of CQ with the exchange of acceptor media from SLF to ALF after 3 h (indicated by red line) plotted against time, comparing rods made up from self-made mSNPs and commercial mSNPs. Confirmation of significance was determined at p < 0.05 (while **, ***, and **** represent 0.01, 0.001, and 0.0001, respectively).
For this, the experiment was also performed exchanging SLF medium during the experiment with ALF (after 3 h). As predicted, a second release of CQ was observed, suggesting that further CQ release would take place once the microrod was taken up by the macrophage and acidification takes place. This is immensely important for the application as an endosomal escape enhancer.
A comparison of the two mSNP systems (self-made and commercial) showed a slightly higher release in self-made mSNPs, but no significant difference, though the higher burst release by microrods made up of self-made mSNPs might suggest higher surface loading versus in-pore-loading compared to the commercial mSNPs.
3.5. Release of siRNA from Microrods
Small interfering RNAs (siRNAs) are naturally occurring in organisms and used by cells to inhibit gene expression from unwanted genes [98,99], specifically genes introduced by pathogens [100]. They act by intercepting the translation process through binding with multiple proteins as a complex to mRNA, thus making it unavailable to translation by ribosomes and leading to its degradation. It has become a promising tool as a therapeutic avenue for RNA interference in an inhibitory manner [101,102]. Its ability to downregulate the production of certain unwanted proteins in disease without a permanent knock out has been studied intensively, with two siRNA therapeutics gaining market approval [103,104].
SiRNA uptake into the cell is the initial step needed for successful mRNA interference, with endosomal escape being the following step. Therefore, release kinetics were investigated in the appropriate acceptor media, SEF (pH 5.5) and ALF (pH 4.55). Release depended on the electrostatic forces between siRNA and the polycation layer of the LbL system, similar to what was already described in the disintegration study. Hence, the release of siRNA from the rods showed a similar pH dependency as the disintegration, resulting in slightly higher release at pH 5.5 than at pH 4.55 (Figure 7).
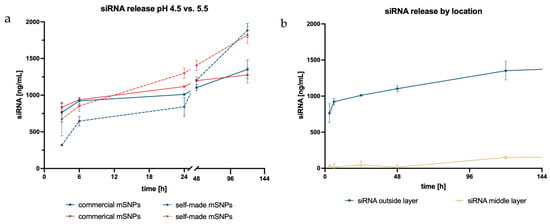
Figure 7.
siRNA release plotted against time with different acceptor media: blue representing SEF at pH 5.5 and red displaying ALF at pH 4.55 (a); siRNA release based on siRNA location within the LbL system plotted against time (b).
Additionally, the influence of mSNP type was also examined. Samples in both acceptor media initially displayed a higher release from rods made up of commercial mSNPs. This trend reversed after 24 h. Afterwards, release from rods comprising self-made mSNPs increased, and the total release showed a corresponding 1.4× higher amount of siRNA. The difference in total release might be explained by the higher surface area to which the siRNA could bind when using self-made compared to commercial mSNPs due to their smaller size. Because the polyelectrolytes, and, consequently, also the siRNA, bind to the surface of the mSNPs, the loading capacity is directly correlated to the available surface area. All these results were based on siRNA located on the outermost layer of the rods, making it easily accessible for release.
The unrestricted accessibility, however, increased the chance for undesired degradation, which led to the question of whether situating the siRNA in the middle layer would demonstrate similar release while simultaneously better protecting the siRNA from outer influences. However, the siRNA amount released from the inner layer was barely measurable. It was only after 120 h that an increase in the released siRNA was seen. The delayed release was likely based on the accessibility of the siRNA to the surrounding acceptor media, while the siRNA in the outer layer could be released once the electrostatic effects of the second layer had weakened. The current hypothesis is that, in order for siRNA to be released from the middle layer, the outer layer of the LbL film had to significantly disintegrate, thereby exposing the siRNA to the acceptor media, and the electrostatic effects of the following layer had to have weakened for the siRNA to be released. This would take a longer time and therefore alter the release kinetics.
3.6. Aerodynamic Properties
For pulmonary application with alveolar macrophages as the target cells, a sufficient deposition in the alveolar region is necessary. The aerodynamic diameter commonly described as desirable for this is usually defined from 1 µm to 5 µm [73,105]. Though the length of the rods was far larger than this desired range, the relevant parameter for evaluation, in the case of the present study, is the diameter of the microrods, which was around 3 µm. The assumption is that the microrods would align with the airstream to fall within this range despite their length of 10 µm. This is due to the drag forces orienting the particles along the air flow direction, making the rod diameter the relevant dimension [106]. To decrease the hygroscopicity and agglomeration of the dry particles, leucine was added at different mass-to-mass ratios to produce coated microparticles. SEM pictures (Figure S3) showed that higher percentages, specifically 2%, seem to lead to more unbound leucine that forms sheets that span over multiple micrometers. These might hinder the later escape from the capsule during inhalation. A layer of leucine around the microparticles could not be seen in the images, though the particles were less agglomerated and more dispersed on the silica disk than in comparable particles without leucine coating. This suggests that one of the proposed advantages of the leucine coating could be confirmed.
When looking at the results of the NGI analysis (Table 1), a trend can be seen in both rod types showing improved aerodynamic properties in samples with 0.5 to 1% leucine (m/m). In general, the Mass Median Aerodynamic Diameter (MMAD) of rods made from commercial mSNPs with 0.5 and 1% leucine were in the desired size range. Also, GSDs at 1.59 and 1.64, respectively, and fine particle fractions of 42.4 and 40.6% were very satisfactory for aspherical microparticles. In rods made up of self-made mSNPs, the sample containing 1% was within the 1–5 µm size range. GSD at 2.29 was also adequate, and the FPF of 58.8% was very high compared to results from similar microparticles [51,61]. These results showed that adequate lung deposition using this formulation in combination with 0.5–1% of leucine is possible. Further increases in leucine content had a negative effect on the aerodynamic properties, which might be connected with the resulting morphology of the formulation (Figure S2). To ensure that particles in later stages of the NGI were fully intact microrods, and not merely fractions of particles, particles were transferred from the NGI stage directly onto a carbon disk and imaged with SEM. The results can be seen in Figure 8 and show that, even at stage 4 (Figure 8c) with a cut-off of 2.82 µm, the microrods were still intact and nicely dispersed.

Table 1.
Aerodynamic properties of rods containing different ratios of leucine, comparing rods made up of self-made and commercially available mSNPs.
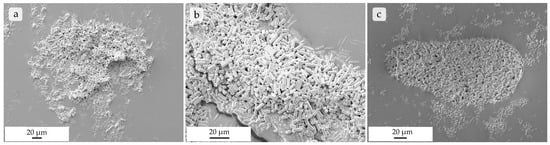
Figure 8.
SEM images of rods made up of commercial mSNPs on a carbon disk after being transferred from stage 2 with a cut-off at 8.02 µm (a), stage 3 with a 4.46 µm cut-off (b), and stage 4 with a 2.82 µm cut-off (c) after NGI separation, showing fully intact, non-agglomerated microrods.
To summarize, the addition of leucine showed an improvement of aerodynamic behavior at more than 0.1% (w/w) but below 2% leucine added. The rods were able to show aerodynamic deposition in the desired NGI stages while depositing fully intact. Aerodynamic diameters substantially lower than 10 µm also suggest that the microrods did align with the airstream and, therefore, deposited deeper than a sphere, exhibiting a corresponding length. This phenomenon has also been previously assessed.
3.7. Viability Testing Through MTT Assay
To determine the acute cytotoxicity of the formulation, MTT assays were performed. The assay based on the reduction of the tetrazolium dye by enzymes available in living cells has long been established as one of the leading assays to measure cell proliferation, and thereby the cell toxicity of applied substances and formulations [83,84].
When looking at the proliferation of dTHP-1 cells exposed to microrod formulation (Figure 9), a concentration-dependent decrease could be seen, in which rods made up of self-made mSNPs tended to show a lower cytotoxic effect. With the exception of one formulation (50 µg/mL, commercial mSNPs, CQ-loaded), all formulations in the concentrations of 10 and 50 µg/mL demonstrated above 80% viability, often considered the threshold for non-cytotoxicity [107]. Loading of siRNA onto the microparticles did not show an effect on cell viability, as expected. The replacement of one anionic layer was not expected to change the properties of the microparticles significantly, and the targeted nature of siRNA reduced the chance of off-target effects. CQ, on the other hand, seemed to have the strongest effect on proliferation in dTHP-1 cells, specifically at a concentration of 100 µg/mL. This must be taken into account for subsequent experiments.
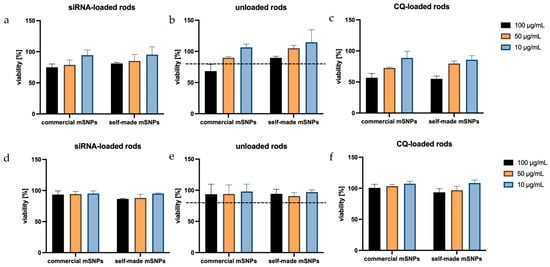
Figure 9.
Viability of dTHP-1 cells (a–c) and A549 cells (d–f), after exposure to several formulations, shows a very good tolerance by A549, representing the non-targeted cells, while dTHP-1 shows a decreased viability in comparison. In particular, the addition of CQ leads to an increased cytotoxicity in the macrophage model cell (c), which has been previously reported.
In A549 cells, all formulations seemed to have very little effect on cell proliferation. This can be explained by the non-phagocytizing nature of A549 cells, meaning the cells were more likely to only interact with the formulation on the outside rather than take up the microrods and target intracellular structures. This is beneficial, assuming that this indicates the absence of toxicity to the surrounding lung epithelium represented by the A549 cells.
3.8. Cellular Uptake of Microrods
Due to the targeted structure being in the cytoplasm [108], a sufficient uptake by alveolar macrophages is essential to the success of the formulation. To determine cell uptake, the number of rods inside the examined cells (Figure 10) was counted at different incubation time points and divided by the available cells, as was similarly performed before [61]. dTHP-1, the model of target cells, and the surrounding non-targeted cells (A549) were used in this experiment with the expectation of seeing a significantly higher uptake in the phagocytotic dTHP-1 cell line. The dTHP-1 cell line revealed a well-observable time-dependent cellular uptake, as expected by a macrophage-mimicking cell line (Figure 11a). When observing the particle more closely, even at early time points, certain cells phagocytized multiple rods while others required more time to start particle uptake or ended up phagocytizing no rods at all. At later time points and at higher concentrations, almost all available dTHP-1 cells were observed with multiple ingested microrods, with a maximum of 4.8 rods/cell after 24 h. Throughout the observed time frame, a preferential uptake of negatively charged microrods could be seen throughout all time points. In samples with negatively charged microrods, the number of phagocytized microrods was 1.5, 1.67, and 1.37 times higher compared to those with positively charged microrods from the lowest to highest concentrations, showing a significant increase in phagocytosis compared to positively charged microrods (Figure 11). It has been reported before that phagocyting cells, like macrophages, and, in this case, dTHP-1, show a preference for negatively charged cells, while non-phagocyting cells, like monocytes or non-differentiated THP-1 cells, show the opposite preference [109,110]. However, microrod concentration still displayed the biggest influence on particle uptake.
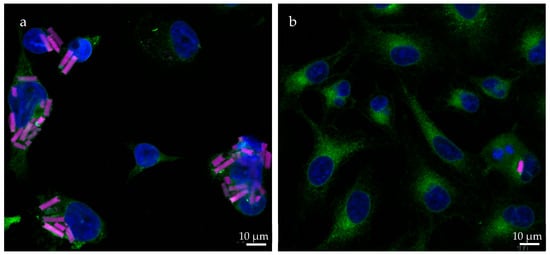
Figure 10.
CLSM images showing the uptake of rhodamine-labeled rods (pink) in (a) dTHP-1 and (b) A549 cells after 24 h. The cell nuclei are displayed in blue (DAPI) and the concanavalin A staining is shown in green. DTHP-1 cells exhibit uptake of multiple rods in most cells, while most A549 cells show no uptake of microparticles. This is mostly due to the difference in their ability of phagocytosis. Differentiated THP-1 cells demonstrate similar phagocytotic behavior to that of macrophages.
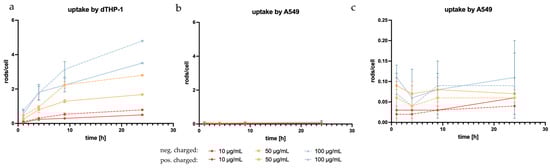
Figure 11.
Microrod uptake by the model target cell, dTHP-1 (a), and A549, on a large scale (b) and small scale (c), showing the expected higher uptake by the macrophage-like cells compared to the non-phagocyting epithelial cells. In dTHP-1 cells, a preference for negatively charged particles can be observed (dashed lines) compared to positively charged particles (solid lines). There is also a clear concentration dependence in the uptake by dTHP-1 cells that is not as pronounced in A549.
Regarding microrod uptake by A549, none of the aforementioned trends were observed. Comparatively, the uptake by A549 cells was negligible, with the maximum reaching 0.11 rod/cell (Figure 11b,c). The lack of time dependence within the observed time brings into question whether the rods were, in fact, phagocytized or were merely interacting with the cells, thus appearing ingested in the two-dimensional image of fluorescence microscopy [111]. Further to this point, the accompanying SEM images suggested surface interaction rather than phagocytosis (Figure 12b).
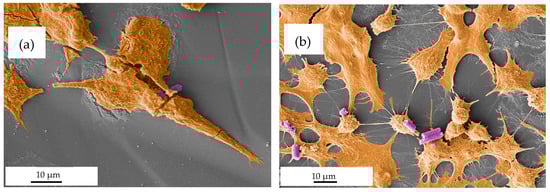
Figure 12.
SEM images (pseudo-colored for better readability, with brown visualizing the cell and purple visualizing the microrods) depicting the interactions between microrods and cells. (a) Microrods seemingly phagocytized by dTHP-1 cells. (b) A549 cells are seen interacting with microrods. Though the interaction appears to be merely by surface adhesion, suggesting that microrods are not taken up by the cell.
As expected, dTHP-1 cells were shown to have significantly higher particle uptake compared to A549 cells. In dTHP-1 cells, a time-dependent increase in microrod uptake was evident, which was not observed in A549 cells. Surface charge and microrod concentration also had a significant impact on the number of phagocytized rods.
3.9. Testing of siRNA Activity for Different Microrod Formulations
To ultimately test the efficacy of the formulations, an ELISA assay was performed. This assay quantifies the amount of TNF-α released from stimulated dTHP-1, with and without treatment. A variety of formulations were tested to examine the influence of chloroquine amount and location, as well as siRNA location. To verify the effectiveness of the target siRNA, a formulation containing scrambled siRNA was used as a control. In order to account for the slight cytotoxic effect of CQ, the scrambled siRNA control formulation was made up of CQ-loaded mSNPs and adsorbed CQ, hence having the maximum amount of CQ tested in other formulations. Another set of microrod formulations with siRNA as a middle layer was applied to test the influence of siRNA location.
The top row of Figure 13 displays the influence of CQ and siRNA on TNF-α suppression. Throughout the different microrod concentrations, a decrease in TNF-α secretion can be observed with increasing CQ concentration. The black bar representing siRNA-loaded rods without additional CQ loading shows a lower decrease in TNF-α secretion compared to other siRNA-loaded rod samples containing additional CQ (orange, light blue, and pink). The biggest decrease in TNF-α secretion was seen in rods containing both adsorbed CQ and CQ loaded in the mSNPs (pink bars). This suggests that an increase in the loaded CQ amount had a positive effect on TNF-α suppression induced by delivered siRNA. The slightly lower TNF-α suppression in samples containing only the adsorbed CQ compared to those containing only CQ in mSNPs might be due to the location and accessibility of the CQ. The CQ only adsorbed to the microrods is closer to the surface and might have an increased interaction with the medium prior to cell uptake. This can lead to a lower overall delivery to the endosome, where the effect of CQ takes place. However, the difference in TNF-α suppression was not significant among any of the samples containing 0.05 mg/mg and 0.09 mg/mg. The efficacy of siRNA compared to scrambled siRNA was evidently independent of the loaded CQ amount. Rods containing scrambled RNA (dark blue) showed only a small decrease in TNF-α secretion compared to the positive control (+LPS), indicating little to no influence on the released TNF-α, while siRNA-containing samples showed a consistently higher decrease. The slightly lower TNF-α release in the scrambled siRNA formulations compared to the positive control was likely a result of the slight cytotoxicity of CQ decreasing the number of TNF-α secreting cells.
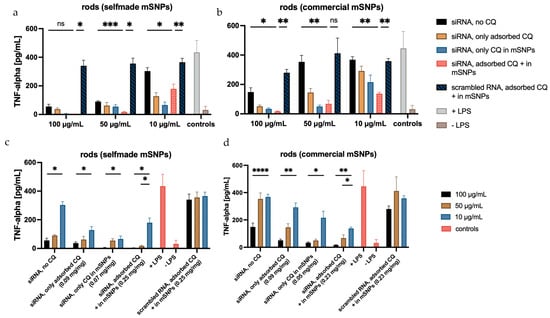
Figure 13.
Amount of TNF-α released from dTHP-1, measured with sandwich ELISA, displayed in two different arrangements. The top row illustrates the influence of CQ on TNF-α release, showing a decrease in the released TNF-α from no CQ (black) to the highest CQ concentration (pink). The bottom row shows the influence of rod concentration on the inhibition of TNF-α release, with clear concentration dependence visible. The TNF-α repression is more pronounced in microrods with self-made mSNPs (a,c) compared to those with commercial mSNPs (b,d), probably due to the higher amounts of loaded siRNA. The concentrations listed are the amount of CQ per mg of rods. Statistical analysis is displayed in the top row between “siRNA, no loaded CQ” and “siRNA, adsorbed CQ + in mSNPs” to highlight the effect of CQ, and between “siRNA, adsorbed CQ + in mSNPs” and “scrambled RNA, adsorbed CQ + in mSNPs” to show the effect of siRNA. Further statistical analysis is shown in Figure S4. N = 3. Significance was determined at p < 0.05 (* represents 0.05, while **, ***, and **** represent 0.01, 0.001, and 0.0001, respectively).
The bottom row of Figure 13 illustrates the aspect of microrod concentration on TNF-α suppression, showing a significant decrease by increasing the microrod concentration 10-fold. The 5-fold increase in microrod concentration also led to a decrease in secreted TNF-α; however, this was only statistically significant in the samples containing the maximum amount of CQ.
When looking at the formulations containing siRNA as the middle layer, the effect is less pronounced (Figure 14). This matches the release experiments, indicating a lower siRNA release within the experimental time frame. However, an effect is still apparent at higher concentrations, with a decrease of secreted TNF-α of up to 80% compared to formulations containing scrambled RNA. Considering the quantifiable effects using the highest microrod concentration, increased siRNA release seems to happen under these more complex intracellular conditions. As previously mentioned, the current hypothesis requires the degradation of the outer layer for siRNA to be released from the middle layer. The ELISA results suggest that this is possible in a shorter time frame (given the incubation time of 48 h) than previously assessed in the release experiments, where a noticeable release was not seen before 120 h. The more complex composition of the endosomal fluid and the possible presence of enzymes in the cell that might target the integrity of the LbL system seem to increase the degradation speed, leading to earlier release, also indicating the limitations of such release tests. Compared to siRNA embedded in the top layer, the effect is still reduced, but it is possible that observing the TNF-α release after longer incubation times would increase the effect of microrods containing siRNA in the middle layer further by allowing for more time for the outer layer to be disintegrated. Similar effects have been shown in plasmid transfection [60]. This would enable the use of siRNA embedment within rather than on top of the LbL film, thereby increasing the protection against RNA-degrading influences, like RNAses, found everywhere in the human body, including the lungs.
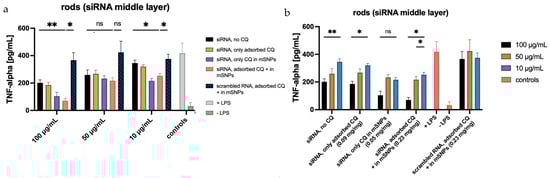
Figure 14.
TNF-α secreted by dTHP-1 cells after LPS stimulation, following previous incubation with different formulations. (a) displays the influence of CQ loading, while (b) visualizes the influence of microrod concentrations on the amount of TNF-alpha release. Statistical analysis is equivalent to Figure 13. Confirmation of significance was determined at p < 0.05 (* represents 0.05, while ** represent 0.01).
4. Conclusions
The emergence of COVID-19 has reminded the public of the consequences of diseases targeting the long-term health of our lungs. It is not just pandemics, like SARS-CoV-2, but also many other scenarios that are linked to excessive inflammatory responses in the lungs [3,4] that cause long-term damage in lung tissue. It is important that we find new and improved ways to combat this group of diseases that has a great impact not only on the patients that suffer from them, but also on limited healthcare resources [3,112,113,114].
Using the pores of a polycarbonate membrane, we were able to successfully produce cylindrical microparticles loaded with anti-TNF-α siRNA using two different types of mesoporous silica nanoparticles. Despite the higher volume of our carrier compared to a spherical microparticle with a similar diameter, sufficient deposition in the peripheral areas of the lung was possible by using leucine as an additional excipient. Crosslinking with a polyelectrolyte-based layer-by-layer film provided enough stability during the inhalation process, while also ensuring a timely disintegration, important for the release of siRNA and avoiding long-term retention in the lung’s parenchyma. We were also able to show a high uptake of microrods by the dTHP-1 cells, favoring a negatively charged surface. In combination with the absence of toxic effects, the negligible uptake by A549 showed a lack of effect on the surrounding cells, thereby decreasing the risk of negative side effects on healthy tissue. By using ethidium bromide in a fluorescence assay, continuous release of siRNA from the layer-by-layer film was detected, showing a comparable pH dependence as seen in the disintegration study. The effect of the released siRNA was then observed in an ELISA, showing a decreased production of TNF-α in dTHP-1 cells. To increase the inhibitory effect on the release of TNF-α, the endosomal escape-enhancing compound, chloroquine, was loaded on the mesoporous silica nanoparticles. The release of CQ was conversely correlated to the pH present in the release media. This is helpful for the release in the endosomal milieu, known for its acidic pH. Rods additionally loaded with CQ were able to significantly decrease the release of TNF-α further, suggesting that the endosomal escape-enhancing effect of CQ was successfully exploited.
This study shows that investment in non-traditional carrier systems can provide desired properties in the aim of treating a group of diseases, impacting the lives of many patients and the resources of our healthcare system. Further research on the effect of other endosomal-enhancing compounds as possible excipients, as well as using a more biodegradable nanoparticle system in this carrier geometry, would be of interest. There also needs to be further insight gained into the behavior of THP-1 cells as a model for human alveolar macrophages when interacting with this delivery system, specifically the effect of elongated particles on phagocytosis.
Supplementary Materials
The following supporting information can be downloaded at: https://www.mdpi.com/article/10.3390/pharmaceutics18020154/s1, Figure S1: TEM images showing self-made mesoporous silica nanoparticles: (a) red lines mark the parallel pores running through the particle; (b) the hexagonal pattern of the pore structures, exemplified by the red markings; Figure S2: Loaded siRNA on microrods stained using EtBr; Table S1: The phosphorus concentration, the RNA concentration calculated from this, and the resulting total amount of RNA per mg of microrods; Figure S3: SEM images showing microrods made up of commercial mSNPs with additional leucine for NGI analysis: (a) with 0.5% leucine, (b) with 1% leucine, and (c) with 2% leucine. Red arrows indicate sheets of free leucine; Figure S4: Full statistical analysis of TNF-alpha secretion in dTHP-1cells after incubation with rods made up of (a) commercial mSNPs and (b) self-made mSNPs.
Author Contributions
Conceptualization, E.H. and M.S.; methodology, E.H. and A.H.; software, E.H. and A.H.; validation, E.H. and M.S.; formal analysis, E.H. and M.S.; investigation, E.H., A.H., R.K. and M.S.; resources, M.S.; data curation, E.H., A.H. and M.S.; writing—original draft preparation, E.H.; writing—review and editing, E.H., A.H., R.K. and M.S.; visualization, E.H.; supervision, M.S.; project administration, M.S. All authors have read and agreed to the published version of the manuscript.
Funding
ICP-QQQ instrumentation for this work was provided by the Elemental Analysis Group, with financial support from Saarland University and the German Science Foundation (project number INST 256/553-1).
Institutional Review Board Statement
Not applicable.
Informed Consent Statement
Not applicable.
Data Availability Statement
Data is contained within the article or Supplementary Material. Other Data of this article will be made available by the authors upon request.
Conflicts of Interest
The authors declare no conflicts of interest.
Abbreviations
The following abbreviations are used in this manuscript:
| ACN | acetonitrile |
| ALF | artificial lysosomal fluid |
| AM | alveolar macrophage |
| API | active pharmaceutic ingredient |
| CLSM | confocal laser scanning microscopy |
| ConA | Concanavalin A |
| COPD | chronic obstructive pulmonary disease |
| CQ | chloroquine |
| CTAB | cetrimonium bromide |
| DAPI | 4′,6-diamidino-2-phenylindole |
| DEAE | diethylethanolamine |
| DLS | dynamic light scattering |
| DMSO | dimethyl sulfoxide |
| dTHP-1 | differentiated THP-1 |
| EA | ethyl acetate |
| ELISA | enzyme-linked immunosorbent assay |
| EtBr | ethidium bromide |
| FCS | fetal calf serum |
| FPF | fine particle fraction |
| GSD | geometric standard deviation |
| HBSS | Hanks’ balanced salt solution |
| HCl | hydrochloric acid |
| LbL | layer-by-layer |
| LPS | lipopolysaccharide |
| MMAD | mass median aerodynamic diameter |
| mSNP | mesoporous silica nanoparticle |
| MTT | 3-(4,5-di methyl thiazol-2-yl)-2,5-diphenyltetrazolium bromide |
| NGI | new generation impactor |
| PBS | phosphate-buffered saline |
| PDI | Polydispersity Index |
| PMA | phorbol 12-myristate 13-acetate |
| SBF | simulant body fluid |
| SEF | simulant endosomal fluid |
| SEM | scanning electron microscopy |
| siRNA | small interfering RNA |
| SLF | simulant lung fluid |
| TEM | transmission electron microscopy |
| TEOS | tetraethyl orthosilicate |
| THF | tetrahydrofuran |
| TMB | 3,3′,5,5′-Tetramethylbenzidine |
| TNE | tris-sodium chloride-EDTA |
References
- Spinelli Oliveira, E.; Hancock, J.T.; Hermes-Lima, M.; Isola, D.A.; Ochs, M.; Yu, J.; Wilhem Filho, D. Implications of Dealing with Airborne Substances and Reactive Oxygen Species: What Mammalian Lungs, Animals, and Plants Have to Say? Integr. Comp. Biol. 2007, 47, 578–591. [Google Scholar] [CrossRef] [PubMed]
- Moldoveanu, B.; Otmishi, P.; Jani, P.; Walker, J.; Sarmiento, X.; Guardiola, J.; Saad, M.; Yu, J. Inflammatory Mechanisms in the Lung. J. Inflamm. Res. 2008, 2, 1–11. [Google Scholar] [CrossRef]
- Soriano, J.B.; Kendrick, P.J.; Paulson, K.R.; Gupta, V.; Gebremeskel, G.G.; Gezae, K.E.; Ghoshal, A.G.; Hay, S.I.; Hoang, C.L.; Horita, N.; et al. Prevalence and Attributable Health Burden of Chronic Respiratory Diseases, 1990–2017: A Systematic Analysis for the Global Burden of Disease Study 2017. Lancet Respir. Med. 2020, 8, 585–596. [Google Scholar] [CrossRef] [PubMed]
- Gould, G.S.; Hurst, J.R.; Trofor, A.; Alison, J.A.; Fox, G.; Kulkarni, M.M.; Wheelock, C.E.; Clarke, M.; Kumar, R. Recognising the Importance of Chronic Lung Disease: A Consensus Statement from the Global Alliance for Chronic Diseases (Lung Diseases Group). Respir. Res. 2023, 24, 15. [Google Scholar] [CrossRef] [PubMed]
- Adeloye, D.; Song, P.; Zhu, Y.; Campbell, H.; Sheikh, A.; Rudan, I. Global, Regional, and National Prevalence of, and Risk Factors for, Chronic Obstructive Pulmonary Disease (COPD) in 2019: A Systematic Review and Modelling Analysis. Lancet Respir. Med. 2022, 10, 447. [Google Scholar] [CrossRef] [PubMed]
- Richie, R.C. Morbidity and Mortality Associated with Chronic Obstructive Pulmonary Disease (COPD). J. Insur. Med. 2023, 49, 230–243. [Google Scholar] [CrossRef]
- 2025 GOLD Report. Global Initiative for Chronic Obstructive Lung Disease—GOLD. Available online: https://goldcopd.org/wp-content/uploads/2024/11/GOLD-2025-Report-v1.0-15Nov2024_WMV.pdf (accessed on 20 January 2026).
- Bhatt, S.P.; Bodduluri, S.; Nakhmani, A.; Kim, Y.; Reinhardt, J.M.; Hoffman, E.A.; Motahari, A.; Wilson, C.G.; Humphries, S.M.; Regan, E.A.; et al. Sex Differences in Airways at Chest CT: Results from the COPDGene Cohort. Radiology 2022, 305, 699–708. [Google Scholar] [CrossRef]
- Adeloye, D.; Chua, S.; Lee, C.; Basquill, C.; Papana, A.; Theodoratou, E.; Nair, H.; Gasevic, D.; Sridhar, D.; Campbell, H.; et al. Global and Regional Estimates of COPD Prevalence: Systematic Review and Meta–Analysis. J. Glob. Health 2015, 5, 020415. [Google Scholar] [CrossRef]
- Soriano, J.B.; Abajobir, A.A.; Abate, K.H.; Abera, S.F.; Agrawal, A.; Ahmed, M.B.; Aichour, A.N.; Aichour, I.; Aichour, M.T.E.; Alam, K.; et al. Global, Regional, and National Deaths, Prevalence, Disability-Adjusted Life Years, and Years Lived with Disability for Chronic Obstructive Pulmonary Disease and Asthma, 1990–2015: A Systematic Analysis for the Global Burden of Disease Study 2015. Lancet Respir. Med. 2017, 5, 691–706. [Google Scholar] [CrossRef]
- GBD 2013 Mortality and Causes of Death Collaborators. Regional, and National Age-Sex Specific All-Cause and Cause-Specific Mortality for 240 Causes of Death, 1990–2013: A Systematic Analysis for the Global Burden of Disease Study 2013. Lancet 2014, 385, 117. [Google Scholar] [CrossRef]
- Adeloye, D.; Agarwal, D.; Barnes, P.J.; Bonay, M.; Van Boven, J.F.; Bryant, J.; Caramori, G.; Dockrell, D.; D’Urzo, A.; Ekström, M.; et al. Research Priorities to Address the Global Burden of Chronic Obstructive Pulmonary Disease (COPD) in the next Decade. J. Glob. Health 2021, 11, 15003. [Google Scholar] [CrossRef]
- Barnes, P.J.; Shapiro, S.D.; Pauwels, R.A. Chronic Obstructive Pulmonary Disease: Molecular and Cellularmechanisms. Eur. Respir. J. 2003, 22, 672–688. [Google Scholar] [CrossRef] [PubMed]
- Shapiro, S.D. The Macrophage in Chronic Obstructive Pulmonary Disease. Am. J. Respir. Crit. Care Med. 1999, 160, S29–S32. [Google Scholar] [CrossRef] [PubMed]
- Di Stefano, A.; Capelli, A.; Lusuardi, M.; Balbo, P.; Vecchio, C.; Maestrelli, P.; Mapp, C.E.; Fabbri, L.M.; Donner, C.F.; Saetta, M. Severity of Airflow Limitation Is Associated with Severity of Airway Inflammation in Smokers. Am. J. Respir. Crit. Care Med. 1998, 158, 1277–1285. [Google Scholar] [CrossRef] [PubMed]
- Hogg, J.C.; Chu, F.; Utokaparch, S.; Woods, R.; Elliott, W.M.; Buzatu, L.; Cherniack, R.M.; Rogers, R.M.; Sciurba, F.C.; Coxson, H.O.; et al. The Nature of Small-Airway Obstruction in Chronic Obstructive Pulmonary Disease. N. Engl. J. Med. 2004, 350, 2645–2653. [Google Scholar] [CrossRef] [PubMed]
- Frankenberger, M.; Eder, C.; Hofer, T.P.; Heimbeck, I.; Skokann, K.; Kaßner, G.; Weber, N.; Möller, W.; Ziegler-Heitbrock, L. Chemokine Expression by Small Sputum Macrophages in COPD. Mol. Med. 2011, 17, 762–770. [Google Scholar] [CrossRef] [PubMed]
- Dewhurst, J.A.; Lea, S.; Hardaker, E.; Dungwa, J.V.; Ravi, A.K.; Singh, D. Characterisation of Lung Macrophage Subpopulations in COPD Patients and Controls. Sci. Rep. 2017, 7, 7143. [Google Scholar] [CrossRef] [PubMed]
- Hodge, S.; Hodge, G.; Scicchitano, R.; Reynolds, P.N.; Holmes, M. Alveolar Macrophages from Subjects with Chronic Obstructive Pulmonary Disease Are Deficient in Their Ability to Phagocytose Apoptotic Airway Epithelial Cells. Immunol. Cell Biol. 2003, 81, 289–296. [Google Scholar] [CrossRef]
- Berenson, C.S.; Kruzel, R.L.; Eberhardt, E.; Sethi, S. Phagocytic Dysfunction of Human Alveolar Macrophages and Severity of Chronic Obstructive Pulmonary Disease. J. Infect. Dis. 2013, 208, 2036–2045. [Google Scholar] [CrossRef]
- Ito, K.; Lim, S.; Caramori, G.; Chung, K.F.; Barnes, P.J.; Adcock, I.M. Cigarette Smoking Reduces Histone Deacetylase 2 Expression, Enhances Cytokine Expression, and Inhibits Glucocorticoid Actions in Alveolar Macrophages. FASEB J. 2001, 15, 1110–1112. [Google Scholar] [CrossRef]
- Culpitt, S.V.; Rogers, D.F.; Shah, P.; De Matos, C.; Russell, R.E.K.; Donnelly, L.E.; Barnes, P.J. Impaired Inhibition by Dexamethasone of Cytokine Release by Alveolar Macrophages from Patients with Chronic Obstructive Pulmonary Disease. Am. J. Respir. Crit. Care Med. 2003, 167, 24–31. [Google Scholar] [CrossRef]
- Haettig, E.; Schneider, M. Oral Inhalers. In Essentials of Industrial Pharmacy; Khan, S.A., Ed.; Springer International Publishing: Cham, Switzerland, 2022; pp. 123–149. [Google Scholar]
- Anderson, S.; Atkins, P.; Bäckman, P.; Cipolla, D.; Clark, A.; Daviskas, E.; Disse, B.; Entcheva-Dimitrov, P.; Fuller, R.; Gonda, I.; et al. Inhaled Medicines: Past, Present, and Future. Pharmacol. Rev. 2022, 74, 48–118. [Google Scholar] [CrossRef] [PubMed]
- Blank, A.; Dekker, C.A. Ribonucleases of Human Serum, Urine, Cerebrospinal Fluid, and Leukocytes. Activity Staining Following Electrophoresis in Sodium Dodecyl Sulfate-Polyacrylamide Gels. Biochemistry 1981, 20, 2261–2267. [Google Scholar] [CrossRef] [PubMed]
- Durcan, N.; Murphy, C.; Cryan, S.-A. Inhalable siRNA: Potential as a Therapeutic Agent in the Lungs. Mol. Pharm. 2008, 5, 559–566. [Google Scholar] [CrossRef]
- Mathaes, R.; Winter, G.; Besheer, A.; Engert, J. Influence of Particle Geometry and PEGylation on Phagocytosis of Particulate Carriers. Int. J. Pharm. 2014, 465, 159–164. [Google Scholar] [CrossRef] [PubMed]
- Champion, J.A.; Katare, Y.K.; Mitragotri, S. Particle Shape: A New Design Parameter for Micro- and Nanoscale Drug Delivery Carriers. J. Control. Release 2007, 121, 3–9. [Google Scholar] [CrossRef] [PubMed]
- Kohler, D.; Schneider, M.; Krüger, M.; Lehr, C.-M.; Möhwald, H.; Wang, D. Template-Assisted Polyelectrolyte Encapsulation of Nanoparticles into Dispersible, Hierarchically Nanostructured Microfibers. Adv. Mater. 2011, 23, 1376–1379. [Google Scholar] [CrossRef]
- Daum, N.; Tscheka, C.; Neumeyer, A.; Schneider, M. Novel Approaches for Drug Delivery Systems in Nanomedicine: Effects of Particle Design and Shape. Wiley Interdiscip. Rev. Nanomed. Nanobiotechnol. 2012, 4, 52–65. [Google Scholar] [CrossRef] [PubMed]
- Le, T.-T.; Elzhry Elyafi, A.K.; Mohammed, A.R.; Al-Khattawi, A. Delivery of Poorly Soluble Drugs via Mesoporous Silica: Impact of Drug Overloading on Release and Thermal Profiles. Pharmaceutics 2019, 11, 269. [Google Scholar] [CrossRef] [PubMed]
- Mellaerts, R.; Mols, R.; Jammaer, J.A.G.; Aerts, C.A.; Annaert, P.; Van Humbeeck, J.; Van den Mooter, G.; Augustijns, P.; Martens, J.A. Increasing the Oral Bioavailability of the Poorly Water Soluble Drug Itraconazole with Ordered Mesoporous Silica. Eur. J. Pharm. Biopharm. 2008, 69, 223–230. [Google Scholar] [CrossRef] [PubMed]
- van Speybroeck, M.; Mellaerts, R.; Thi, T.D.; Martens, J.A.; Van Humbeeck, J.; Annaert, P.; Van den Mooter, G.; Augustijns, P. Preventing Release in the Acidic Environment of the Stomach via Occlusion in Ordered Mesoporous Silica Enhances the Absorption of Poorly Soluble Weakly Acidic Drugs. J. Pharm. Sci. 2011, 100, 4864–4876. [Google Scholar] [CrossRef] [PubMed]
- Rocío Hernández, A.; Bogdanova, E.; Campos Pacheco, J.E.; Kocherbitov, V.; Ekström, M.; Pilkington, G.; Valetti, S. Disordered Mesoporous Silica Particles: An Emerging Platform to Deliver Proteins to the Lungs. Drug Deliv. 2024, 31, 2381340. [Google Scholar] [CrossRef]
- Narayan, R.; Nayak, U.Y.; Raichur, A.M.; Garg, S. Mesoporous Silica Nanoparticles: A Comprehensive Review on Synthesis and Recent Advances. Pharmaceutics 2018, 10, 118. [Google Scholar] [CrossRef] [PubMed]
- Slowing, I.I.; Trewyn, B.G.; Lin, V.S.-Y. Mesoporous Silica Nanoparticles for Intracellular Delivery of Membrane-Impermeable Proteins. J. Am. Chem. Soc. 2007, 129, 8845–8849. [Google Scholar] [CrossRef] [PubMed]
- Deodhar, G.V.; Adams, M.L.; Trewyn, B.G. Controlled Release and Intracellular Protein Delivery from Mesoporous Silica Nanoparticles. Biotechnol. J. 2017, 12, 1600408. [Google Scholar] [CrossRef]
- Liu, H.-J.; Xu, P. Smart Mesoporous Silica Nanoparticles for Protein Delivery. Nanomaterials 2019, 9, 511. [Google Scholar] [CrossRef] [PubMed]
- Park, I.Y.; Kim, I.Y.; Yoo, M.K.; Choi, Y.J.; Cho, M.-H.; Cho, C.S. Mannosylated Polyethylenimine Coupled Mesoporous Silica Nanoparticles for Receptor-Mediated Gene Delivery. Int. J. Pharm. 2008, 359, 280–287. [Google Scholar] [CrossRef] [PubMed]
- Tao, C.; Zhu, Y.; Xu, Y.; Zhu, M.; Morita, H.; Hanagata, N. Mesoporous Silica Nanoparticles for Enhancing the Delivery Efficiency of Immunostimulatory DNA Drugs. Dalton Trans. 2014, 43, 5142–5150. [Google Scholar] [CrossRef]
- Lin, D.; Cheng, Q.; Jiang, Q.; Huang, Y.; Yang, Z.; Han, S.; Zhao, Y.; Guo, S.; Liang, Z.; Dong, A. Intracellular Cleavable Poly(2-Dimethylaminoethyl Methacrylate) Functionalized Mesoporous Silica Nanoparticles for Efficient siRNA Delivery in Vitro and in Vivo. Nanoscale 2013, 5, 4291–4301. [Google Scholar] [CrossRef] [PubMed]
- Möller, K.; Müller, K.; Engelke, H.; Bräuchle, C.; Wagner, E.; Bein, T. Highly Efficient siRNA Delivery from Core–Shell Mesoporous Silica Nanoparticles with Multifunctional Polymer Caps. Nanoscale 2016, 8, 4007–4019. [Google Scholar] [CrossRef]
- Hanafi-Bojd, M.Y.; Ansari, L.; Malaekeh-Nikouei, B. Codelivery of Anticancer Drugs and siRNA By Mesoporous Silica Nanoparticles. Ther. Deliv. 2016, 7, 649–655. [Google Scholar] [CrossRef] [PubMed]
- Chen, A.M.; Zhang, M.; Wei, D.; Stueber, D.; Taratula, O.; Minko, T.; He, H. Co-Delivery of Doxorubicin and Bcl-2 siRNA by Mesoporous Silica Nanoparticles Enhances the Efficacy of Chemotherapy in Multidrug-Resistant Cancer Cells. Small 2009, 5, 2673–2677. [Google Scholar] [CrossRef]
- Meng, H.; Liong, M.; Xia, T.; Li, Z.; Ji, Z.; Zink, J.I.; Nel, A.E. Engineered Design of Mesoporous Silica Nanoparticles to Deliver Doxorubicin and P-Glycoprotein siRNA to Overcome Drug Resistance in a Cancer Cell Line. ACS Nano 2010, 4, 4539–4550. [Google Scholar] [CrossRef]
- Ma, X.; Teh, C.; Zhang, Q.; Borah, P.; Choong, C.; Korzh, V.; Zhao, Y. Redox-Responsive Mesoporous Silica Nanoparticles: A Physiologically Sensitive Codelivery Vehicle for siRNA and Doxorubicin. Antioxid. Redox Signal. 2014, 21, 707–722. [Google Scholar] [CrossRef] [PubMed]
- Fang, W.; Yu, K.; Zhang, S.; Jiang, L.; Zheng, H.; Huang, Q.; Li, F. Shape Matters: Impact of Mesoporous Silica Nanoparticle Morphology on Anti-Tumor Efficacy. Pharmaceutics 2024, 16, 632. [Google Scholar] [CrossRef] [PubMed]
- Chen, M.; Lu, J.; Hou, J.; Zhao, Y. Fabrication of Hybrid Rod-like Mesoporous Silica Nanocarriers for Responsive Drug Release and Combined Photo-Chemotherapy. Colloids Surf. Physicochem. Eng. Asp. 2022, 648, 129227. [Google Scholar] [CrossRef]
- Borzęcka, W.; Pereira, P.M.R.; Fernandes, R.; Trindade, T.; Torres, T.; Tomé, J.P.C. Spherical and Rod Shaped Mesoporous Silica Nanoparticles for Cancer-Targeted and Photosensitizer Delivery in Photodynamic Therapy. J. Mater. Chem. B 2022, 10, 3248–3259. [Google Scholar] [CrossRef] [PubMed]
- Bukara, K.; Schueller, L.; Rosier, J.; Martens, M.A.; Daems, T.; Verheyden, L.; Eelen, S.; Van Speybroeck, M.; Libanati, C.; Martens, J.A.; et al. Ordered Mesoporous Silica to Enhance the Bioavailability of Poorly Water-Soluble Drugs: Proof of Concept in Man. Eur. J. Pharm. Biopharm. 2016, 108, 220–225. [Google Scholar] [CrossRef] [PubMed]
- Fischer, T.; Winter, I.; Drumm, R.; Schneider, M. Cylindrical Microparticles Composed of Mesoporous Silica Nanoparticles for the Targeted Delivery of a Small Molecule and a Macromolecular Drug to the Lungs: Exemplified with Curcumin and siRNA. Pharmaceutics 2021, 13, 844. [Google Scholar] [CrossRef]
- Fischer, T.; Tschernig, T.; Drews, F.; Brix, K.; Meier, C.; Simon, M.; Kautenburger, R.; Schneider, M. siRNA Delivery to Macrophages Using Aspherical, Nanostructured Microparticles as Delivery System for Pulmonary Administration. Eur. J. Pharm. Biopharm. 2021, 158, 284–293. [Google Scholar] [CrossRef]
- Chatterjee, S.; Kon, E.; Sharma, P.; Peer, D. Endosomal Escape: A Bottleneck for LNP-Mediated Therapeutics. Proc. Natl. Acad. Sci. USA 2024, 121, e2307800120. [Google Scholar] [CrossRef] [PubMed]
- Dowdy, S.F.; Setten, R.L.; Cui, X.-S.; Jadhav, S.G. Delivery of RNA Therapeutics: The Great Endosomal Escape! Nucleic Acid Ther. 2022, 32, 361–368. [Google Scholar] [CrossRef]
- Cheng, J.; Zeidan, R.; Mishra, S.; Liu, A.; Pun, S.H.; Kulkarni, R.P.; Jensen, G.S.; Bellocq, N.C.; Davis, M.E. Structure−Function Correlation of Chloroquine and Analogues as Transgene Expression Enhancers in Nonviral Gene Delivery. J. Med. Chem. 2006, 49, 6522–6531. [Google Scholar] [CrossRef] [PubMed]
- Du Rietz, H.; Hedlund, H.; Wilhelmson, S.; Nordenfelt, P.; Wittrup, A. Imaging Small Molecule-Induced Endosomal Escape of siRNA. Nat. Commun. 2020, 11, 1809. [Google Scholar] [CrossRef] [PubMed]
- Juliano, R.L. Chemical Manipulation of the Endosome Trafficking Machinery: Implications for Oligonucleotide Delivery. Biomedicines 2021, 9, 512. [Google Scholar] [CrossRef] [PubMed]
- Castillo, R.R.; de la Torre, L.; García-Ochoa, F.; Ladero, M.; Vallet-Regí, M. Production of MCM-41 Nanoparticles with Control of Particle Size and Structural Properties: Optimizing Operational Conditions during Scale-Up. Int. J. Mol. Sci. 2020, 21, 7899. [Google Scholar] [CrossRef] [PubMed]
- Riikonen, J.; Xu, W.; Lehto, V.-P. Mesoporous Systems for Poorly Soluble Drugs—Recent Trends. Int. J. Pharm. 2018, 536, 178–186. [Google Scholar] [CrossRef]
- Möhwald, M.; Pinnapireddy, S.R.; Wonnenberg, B.; Pourasghar, M.; Jurisic, M.; Jung, A.; Fink-Straube, C.; Tschernig, T.; Bakowsky, U.; Schneider, M. Aspherical, Nanostructured Microparticles for Targeted Gene Delivery to Alveolar Macrophages. Adv. Healthc. Mater. 2017, 6, 1700478. [Google Scholar] [CrossRef] [PubMed]
- Pioch, T.; Fischer, T.; Schneider, M. Aspherical, Nano-Structured Drug Delivery System with Tunable Release and Clearance for Pulmonary Applications. Pharmaceutics 2024, 16, 232. [Google Scholar] [CrossRef]
- Garger, E.K.; Meisenberg, O.; Odintsov, O.; Shynkarenko, V.; Tschiersch, J. Solubility of Hot Fuel Particles from Chernobyl—Influencing Parameters for Individual Radiation Dose Calculations. Talanta 2013, 115, 40–46. [Google Scholar] [CrossRef] [PubMed]
- Innes, E.; Yiu, H.H.P.; McLean, P.; Brown, W.; Boyles, M. Simulated Biological Fluids—A Systematic Review of Their Biological Relevance and Use in Relation to Inhalation Toxicology of Particles and Fibres. Crit. Rev. Toxicol. 2021, 51, 217–248. [Google Scholar] [CrossRef] [PubMed]
- Müller, K.H.; Kulkarni, J.; Motskin, M.; Goode, A.; Winship, P.; Skepper, J.N.; Ryan, M.P.; Porter, A.E. pH-Dependent Toxicity of High Aspect Ratio ZnO Nanowires in Macrophages Due to Intracellular Dissolution. ACS Nano 2010, 4, 6767–6779. [Google Scholar] [CrossRef]
- Stefaniak, A.B.; Guilmette, R.A.; Day, G.A.; Hoover, M.D.; Breysse, P.N.; Scripsick, R.C. Characterization of Phagolysosomal Simulant Fluid for Study of Beryllium Aerosol Particle Dissolution. Toxicol. In Vitro 2005, 19, 123–134. [Google Scholar] [CrossRef]
- Gallagher, S.R. Quantification of DNA and RNA with Absorption and Fluorescence Spectroscopy. Curr. Protoc. Cell Biol. 2000, 7, A.3D.1–A.3D.8. [Google Scholar] [CrossRef]
- Le Pecq, J.-B.; Paoletti, C. A New Fluorometric Method for RNA and DNA Determination. Anal. Biochem. 1966, 17, 100–107. [Google Scholar] [CrossRef]
- Vardevanyan, P.O.; Antonyan, A.P.; Parsadanyan, M.A.; Davtyan, H.G.; Karapetyan, A.T. The Binding of Ethidium Bromide with DNA: Interaction with Single- and Double-Stranded Structures. Exp. Mol. Med. 2003, 35, 527–533. [Google Scholar] [CrossRef]
- Bonasera, V.; Alberti, S.; Sacchetti, A. Protocol for High-Sensitivity/Long Linear-Range Spectrofluorimetric DNA Quantification Using Ethidium Bromide. BioTechniques 2007, 43, 173–176. [Google Scholar] [CrossRef]
- Alhajj, N.; O’Reilly, N.J.; Cathcart, H. Leucine as an Excipient in Spray Dried Powder for Inhalation. Drug Discov. Today 2021, 26, 2384–2396. [Google Scholar] [CrossRef]
- Mangal, S.; Meiser, F.; Tan, G.; Gengenbach, T.; Denman, J.; Rowles, M.R.; Larson, I.; Morton, D.A.V. Relationship between Surface Concentration of L-Leucine and Bulk Powder Properties in Spray Dried Formulations. Eur. J. Pharm. Biopharm. 2015, 94, 160–169. [Google Scholar] [CrossRef] [PubMed]
- Raula, J.; Thielmann, F.; Naderi, M.; Lehto, V.-P.; Kauppinen, E.I. Investigations on Particle Surface Characteristics vs. Dispersion Behaviour of l-Leucine Coated Carrier-Free Inhalable Powders. Int. J. Pharm. 2010, 385, 79–85. [Google Scholar] [CrossRef]
- Stella, J.; Germann, A.; Janka, O.; Wagner, S.; Schneider, M. Development of an Inhalable Dry Powder Formulation for Inhibition of SARS-CoV-2. Int. J. Pharm. X 2025, 10, 100346. [Google Scholar] [CrossRef] [PubMed]
- Giard, D.J.; Aaronson, S.A.; Todaro, G.J.; Arnstein, P.; Kersey, J.H.; Dosik, H.; Parks, W.P. In Vitro Cultivation of Human Tumors: Establishment of Cell Lines Derived From a Series of Solid Tumors2. JNCI J. Natl. Cancer Inst. 1973, 51, 1417–1423. [Google Scholar] [CrossRef]
- Foster, K.A.; Oster, C.G.; Mayer, M.M.; Avery, M.L.; Audus, K.L. Characterization of the A549 Cell Line as a Type II Pulmonary Epithelial Cell Model for Drug Metabolism. Exp. Cell Res. 1998, 243, 359–366. [Google Scholar] [CrossRef] [PubMed]
- Daigneault, M.; Preston, J.A.; Marriott, H.M.; Whyte, M.K.B.; Dockrell, D.H. The Identification of Markers of Macrophage Differentiation in PMA-Stimulated THP-1 Cells and Monocyte-Derived Macrophages. PLoS ONE 2010, 5, e8668. [Google Scholar] [CrossRef] [PubMed]
- Aldo, P.B.; Craveiro, V.; Guller, S.; Mor, G. Effect of Culture Conditions on the Phenotype of THP-1 Monocyte Cell Line. Am. J. Reprod. Immunol. 2013, 70, 80–86. [Google Scholar] [CrossRef] [PubMed]
- Cui, H.S.; Joo, S.Y.; Cho, Y.S.; Kim, J.-B.; Seo, C.H. CPEB1 or CPEB4 Knockdown Suppresses the TAK1 and Smad Signalings in THP-1 Macrophage-like Cells and Dermal Fibroblasts. Arch. Biochem. Biophys. 2020, 683, 108322. [Google Scholar] [CrossRef] [PubMed]
- Mohd Yasin, Z.N.; Mohd Idrus, F.N.; Hoe, C.H.; Yvonne-Tee, G.B. Macrophage Polarization in THP-1 Cell Line and Primary Monocytes: A Systematic Review. Differentiation 2022, 128, 67–82. [Google Scholar] [CrossRef] [PubMed]
- Browne, E.; Kavanagh, S.; Devery, S. The Cytotoxicity of Phorbol 12- Myristate 13-Acetate and Lipopolysaccharide on THP-1 Cells and an Optimized Differentiation Protocol. Med. Sci. Forum 2022, 11, 5. [Google Scholar] [CrossRef]
- Liu, T.; Huang, T.; Li, J.; Li, A.; Li, C.; Huang, X.; Li, D.; Wang, S.; Liang, M. Optimization of Differentiation and Transcriptomic Profile of THP-1 Cells into Macrophage by PMA. PLoS ONE 2023, 18, e0286056. [Google Scholar] [CrossRef]
- Mosmann, T. Rapid Colorimetric Assay for Cellular Growth and Survival: Application to Proliferation and Cytotoxicity Assays. J. Immunol. Methods 1983, 65, 55–63. [Google Scholar] [CrossRef] [PubMed]
- Burdon, R.H.; Gill, V.; Rice-evans, C. Reduction of a Tetrazolium Salt and Superoxide Generation in Human Tumor Cells (HeLa). Free Radic. Res. Commun. 1993, 18, 369–380. [Google Scholar] [CrossRef] [PubMed]
- Stockert, J.C.; Horobin, R.W.; Colombo, L.L.; Blázquez-Castro, A. Tetrazolium Salts and Formazan Products in Cell Biology: Viability Assessment, Fluorescence Imaging, and Labeling Perspectives. Acta Histochem. 2018, 120, 159–167. [Google Scholar] [CrossRef]
- Berridge, M.V.; Herst, P.M.; Tan, A.S. Tetrazolium Dyes as Tools in Cell Biology: New Insights into Their Cellular Reduction. In Biotechnology Annual Review; Elsevier: Amsterdam, The Netherlands, 2005; Volume 11, pp. 127–152. [Google Scholar]
- Schindelin, J.; Arganda-Carreras, I.; Frise, E.; Kaynig, V.; Longair, M.; Pietzsch, T.; Preibisch, S.; Rueden, C.; Saalfeld, S.; Schmid, B.; et al. Fiji: An Open-Source Platform for Biological-Image Analysis. Nat. Methods 2012, 9, 676–682. [Google Scholar] [CrossRef]
- Nalezinková, M.; Loskot, J.; Myslivcová Fučíková, A. The Use of Scanning Electron Microscopy and Fixation Methods to Evaluate the Interaction of Blood with the Surfaces of Medical Devices. Sci. Rep. 2024, 14, 4622. [Google Scholar] [CrossRef]
- Kresge, C.T.; Leonowicz, M.E.; Roth, W.J.; Vartuli, J.C.; Beck, J.S. Ordered Mesoporous Molecular Sieves Synthesized by a Liquid-Crystal Template Mechanism. Nature 1992, 359, 710–712. [Google Scholar] [CrossRef]
- Li, Z.; Zhang, Y.; Feng, N. Mesoporous Silica Nanoparticles: Synthesis, Classification, Drug Loading, Pharmacokinetics, Biocompatibility, and Application in Drug Delivery. Expert Opin. Drug Deliv. 2019, 16, 219–237. [Google Scholar] [CrossRef]
- Casey, J.R.; Grinstein, S.; Orlowski, J. Sensors and Regulators of Intracellular pH. Nat. Rev. Mol. Cell Biol. 2010, 11, 50–61. [Google Scholar] [CrossRef]
- Hu, Y.-B.; Dammer, E.B.; Ren, R.-J.; Wang, G. The Endosomal-Lysosomal System: From Acidification and Cargo Sorting to Neurodegeneration. Transl. Neurodegener. 2015, 4, 18. [Google Scholar] [CrossRef] [PubMed]
- Weisz, O.A. Acidification and Protein Traffic. In International Review of Cytology; Academic Press: Cambridge, MA, USA, 2003; Volume 226, pp. 259–319. [Google Scholar]
- Maxfield, F.R.; Yamashiro, D.J. Endosome Acidification and the Pathways of Receptor-Mediated Endocytosis. In Immunobiology of Proteins and Peptides IV; Atassi, M.Z., Ed.; Advances in Experimental Medicine and Biology; Springer: Boston, MA, USA, 1987; Volume 225, pp. 189–198. [Google Scholar]
- DEAE-Dextran Is a Polycation Used as a Component/Adjuvant. Available online: https://dextran.com/dextran-chemistry/pharmacosmos-deae-dextran (accessed on 20 January 2026).
- Zillen, D.; Beugeling, M.; Hinrichs, W.L.J.; Frijlink, H.W.; Grasmeijer, F. Natural and Bioinspired Excipients for Dry Powder Inhalation Formulations. Curr. Opin. Colloid Interface Sci. 2021, 56, 101497. [Google Scholar] [CrossRef]
- Hajimolaali, M.; Mohammadian, H.; Torabi, A.; Shirini, A.; Khalife Shal, M.; Barazandeh Nezhad, H.; Iranpour, S.; Baradaran Eftekhari, R.; Dorkoosh, F. Application of Chloroquine as an Endosomal Escape Enhancing Agent: New Frontiers for an Old Drug. Expert Opin. Drug Deliv. 2021, 18, 877–889. [Google Scholar] [CrossRef]
- Debisschop, A.; Bogaert, B.; Muntean, C.; De Smedt, S.C.; Raemdonck, K. Beyond Chloroquine: Cationic Amphiphilic Drugs as Endosomal Escape Enhancers for Nucleic Acid Therapeutics. Curr. Opin. Chem. Biol. 2024, 83, 102531. [Google Scholar] [CrossRef]
- Fire, A.; Xu, S.; Montgomery, M.K.; Kostas, S.A.; Driver, S.E.; Mello, C.C. Potent and Specific Genetic Interference by Double-Stranded RNA in Caenorhabditis Elegans. Nature 1998, 391, 806–811. [Google Scholar] [CrossRef]
- Fire, A. RNA-Triggered Gene Silencing. Trends Genet. 1999, 15, 358–363. [Google Scholar] [CrossRef]
- Hammond, S.M.; Caudy, A.A.; Hannon, G.J. Post-Transcriptional Gene Silencing by Double-Stranded RNA. Nat. Rev. Genet. 2001, 2, 110–119. [Google Scholar] [CrossRef] [PubMed]
- Elbashir, S.M.; Harborth, J.; Lendeckel, W.; Yalcin, A.; Weber, K.; Tuschl, T. Duplexes of 21-Nucleotide RNAs Mediate RNA Interference in Cultured Mammalian Cells. Nature 2001, 411, 494–498. [Google Scholar] [CrossRef]
- Caplen, N.J.; Parrish, S.; Imani, F.; Fire, A.; Morgan, R.A. Specific Inhibition of Gene Expression by Small Double-Stranded RNAs in Invertebrate and Vertebrate Systems. Proc. Natl. Acad. Sci. USA 2001, 98, 9742–9747. [Google Scholar] [CrossRef]
- Setten, R.L.; Rossi, J.J.; Han, S. The Current State and Future Directions of RNAi-Based Therapeutics. Nat. Rev. Drug Discov. 2019, 18, 421–446. [Google Scholar] [CrossRef] [PubMed]
- Hu, B.; Zhong, L.; Weng, Y.; Peng, L.; Huang, Y.; Zhao, Y.; Liang, X.-J. Therapeutic siRNA: State of the Art. Signal Transduct. Target. Ther. 2020, 5, 101. [Google Scholar] [CrossRef] [PubMed]
- Artmann, M.; Staudinger, J. Inhalationstherapie bei Asthma und COPD aus physiotherapeutischer Sicht. MMW-Fortschritte Med. 2021, 163, 56–64. [Google Scholar] [CrossRef]
- Koenneke, A.; Pourasghar, M.; Schneider, M. Nano-Structured Microparticles for Inhalation. In Delivery of Drugs; Elsevier: Amsterdam, The Netherlands, 2020; pp. 119–160. [Google Scholar]
- López-García, J.; Lehocký, M.; Humpolíček, P.; Sáha, P. HaCaT Keratinocytes Response on Antimicrobial Atelocollagen Substrates: Extent of Cytotoxicity, Cell Viability and Proliferation. J. Funct. Biomater. 2014, 5, 43–57. [Google Scholar] [CrossRef]
- Soni, D.M. Strategies and Approaches for siRNA Delivery. J. Drug Deliv. Ther. 2020, 10, 239–250. [Google Scholar] [CrossRef]
- Fröhlich, E. The Role of Surface Charge in Cellular Uptake and Cytotoxicity of Medical Nanoparticles. Int. J. Nanomed. 2012, 7, 5577–5591. [Google Scholar] [CrossRef]
- Lunov, O.; Syrovets, T.; Loos, C.; Beil, J.; Delacher, M.; Tron, K.; Nienhaus, G.U.; Musyanovych, A.; Mailänder, V.; Landfester, K.; et al. Differential Uptake of Functionalized Polystyrene Nanoparticles by Human Macrophages and a Monocytic Cell Line. ACS Nano 2011, 5, 1657–1669. [Google Scholar] [CrossRef] [PubMed]
- Tscheka, C.; Hittinger, M.; Lehr, C.-M.; Schneider-Daum, N.; Schneider, M. Macrophage Uptake of Cylindrical Microparticles Investigated with Correlative Microscopy. Eur. J. Pharm. Biopharm. 2015, 95, 151–155. [Google Scholar] [CrossRef] [PubMed]
- Duan, K.I.; Birger, M.; Au, D.H.; Spece, L.J.; Feemster, L.C.; Dieleman, J.L. Health Care Spending on Respiratory Diseases in the United States, 1996–2016. Am. J. Respir. Crit. Care Med. 2023, 207, 183–192. [Google Scholar] [CrossRef] [PubMed]
- Chen, S.; Kuhn, M.; Prettner, K.; Yu, F.; Yang, T.; Bärnighausen, T.; Bloom, D.E.; Wang, C. The Global Economic Burden of Chronic Obstructive Pulmonary Disease for 204 Countries and Territories in 2020–50: A Health-Augmented Macroeconomic Modelling Study. Lancet Glob. Health 2023, 11, e1183–e1193. [Google Scholar] [CrossRef]
- May, S.M.; Li, J.T.C. Burden of Chronic Obstructive Pulmonary Disease: Healthcare Costs and Beyond. Allergy Asthma Proc. 2015, 36, 4–10. [Google Scholar] [CrossRef]
Disclaimer/Publisher’s Note: The statements, opinions and data contained in all publications are solely those of the individual author(s) and contributor(s) and not of MDPI and/or the editor(s). MDPI and/or the editor(s) disclaim responsibility for any injury to people or property resulting from any ideas, methods, instructions or products referred to in the content. |
© 2026 by the authors. Licensee MDPI, Basel, Switzerland. This article is an open access article distributed under the terms and conditions of the Creative Commons Attribution (CC BY) license.