


Material-Sparing Feasibility Screening for Hot Melt Extrusion


Abstract
1. Introduction
2. Materials and Methods
2.1. Materials
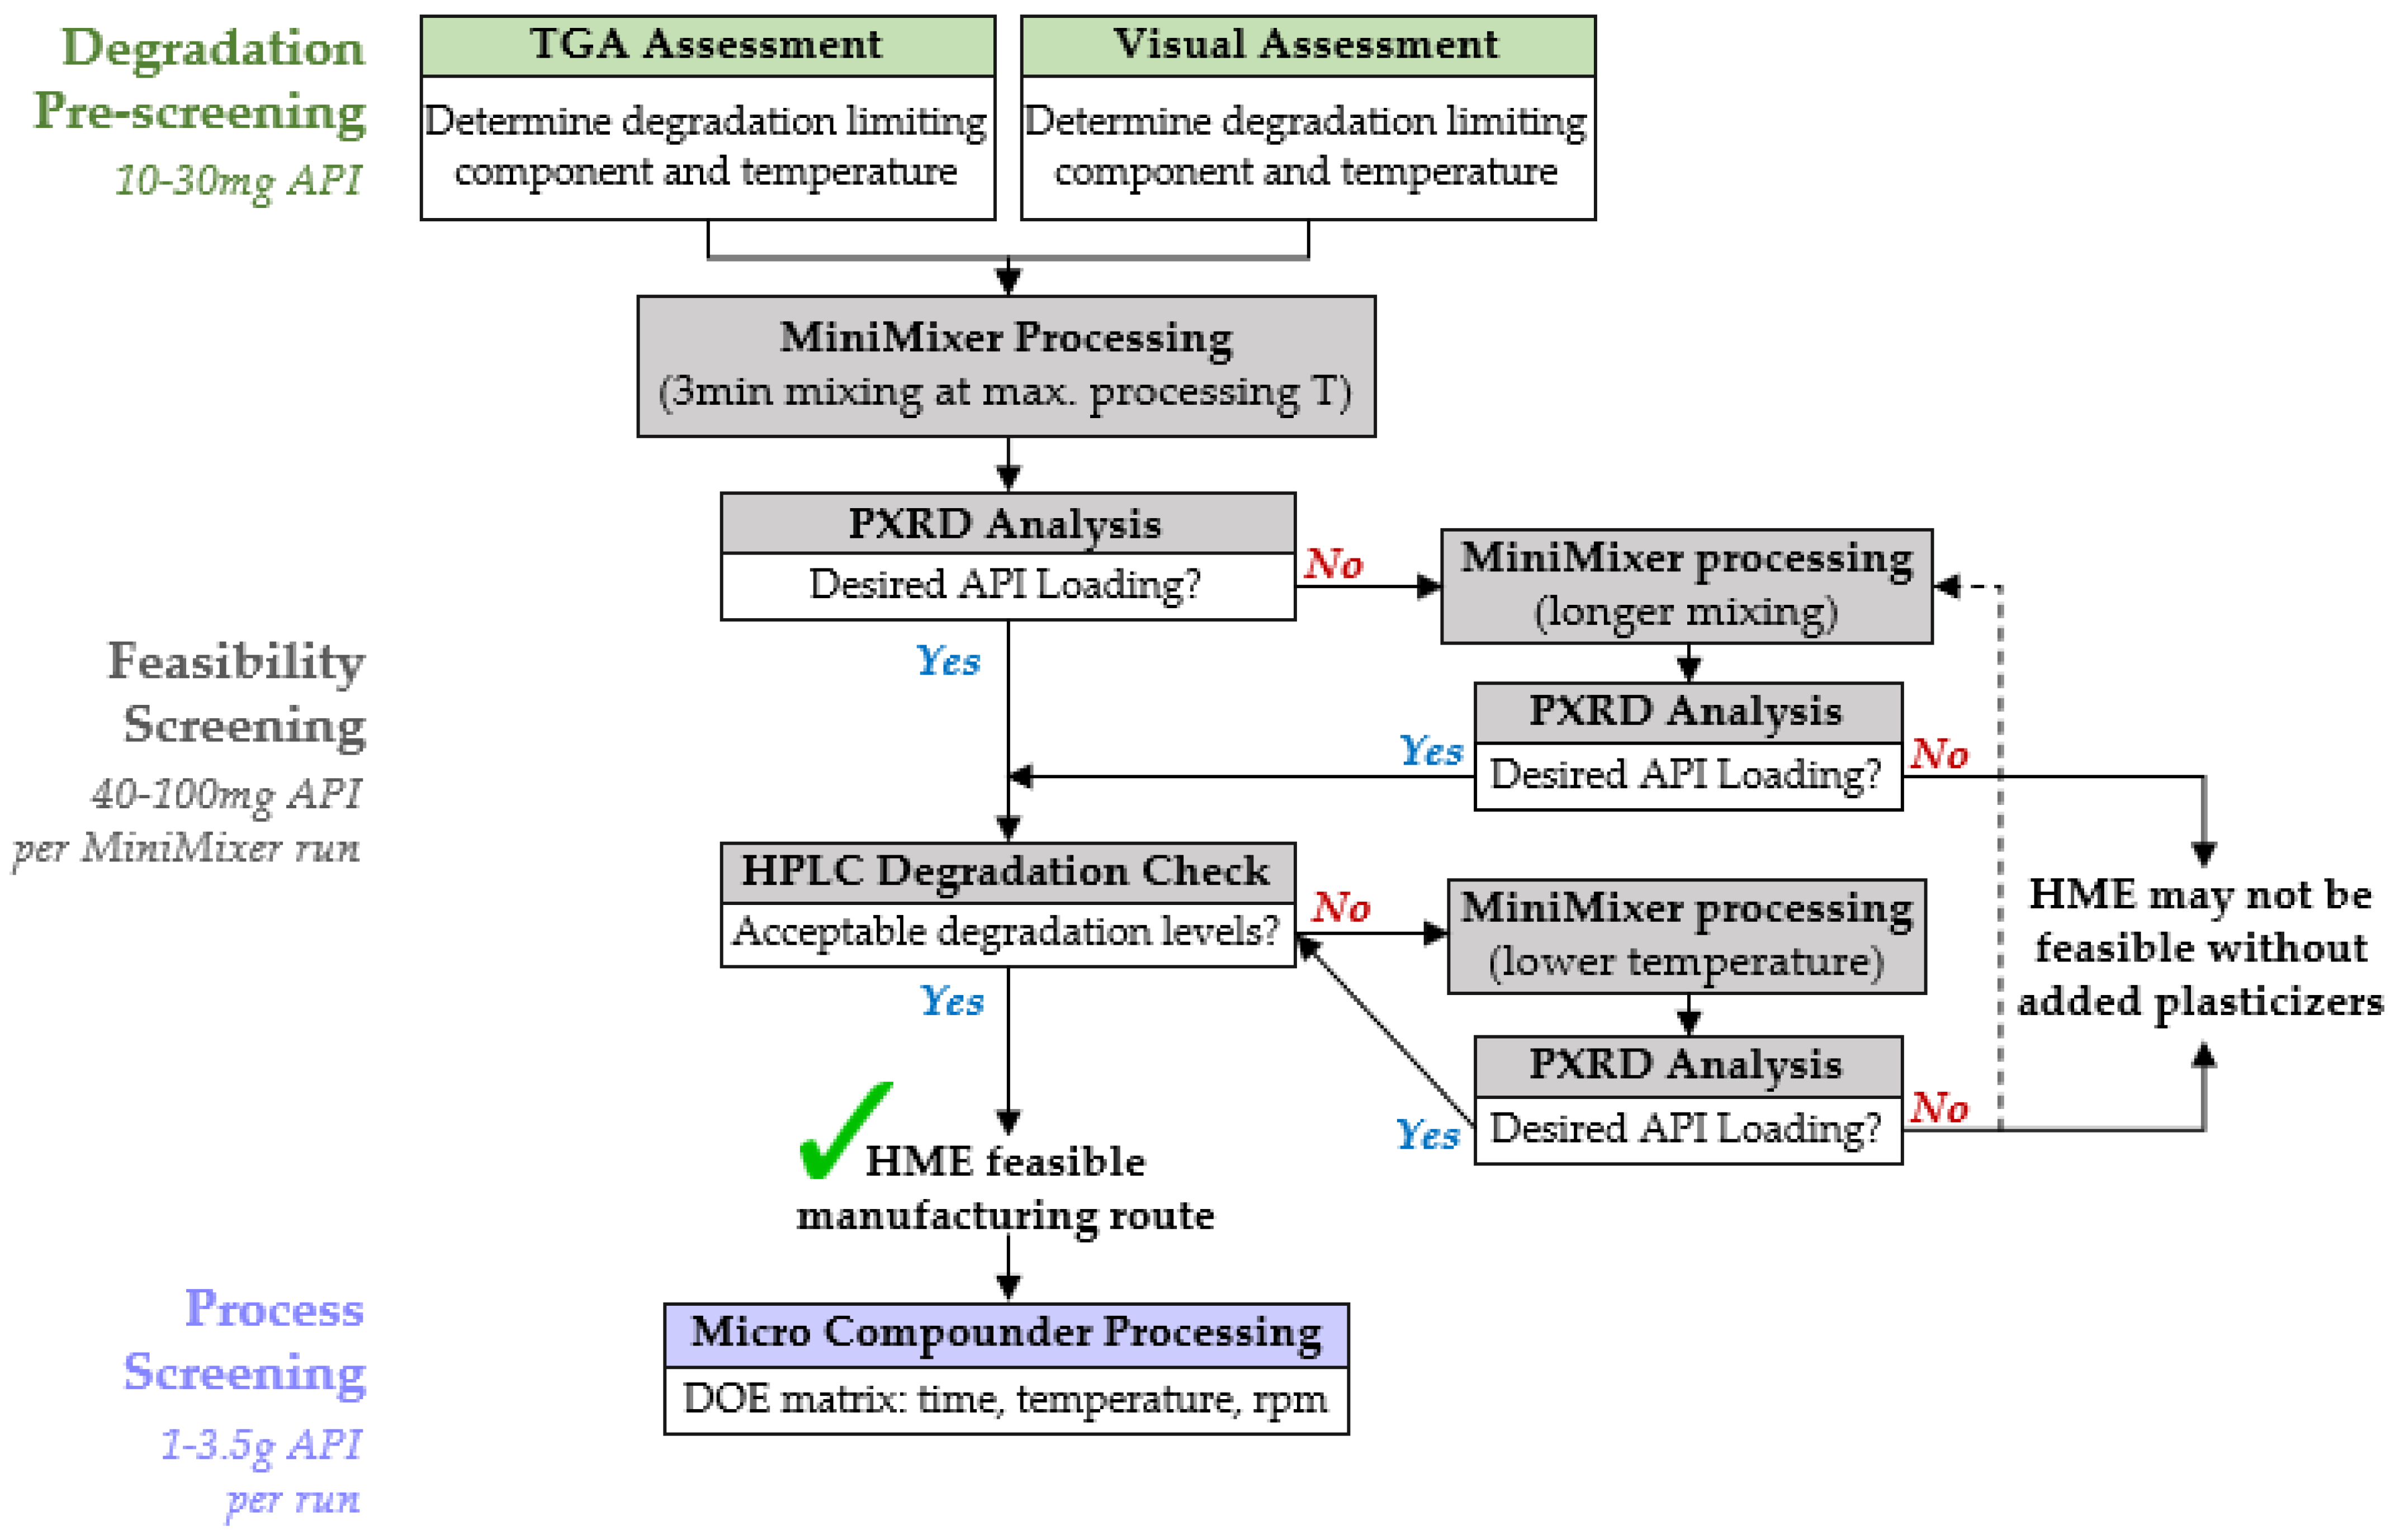
2.2. Degradation Prescreening
2.2.1. Gravimetric Degradation Assessment
2.2.2. Visual Degradation Assessment
2.3. Feasibility Screening
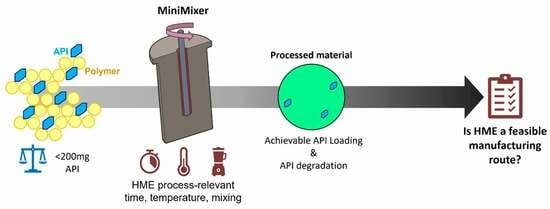
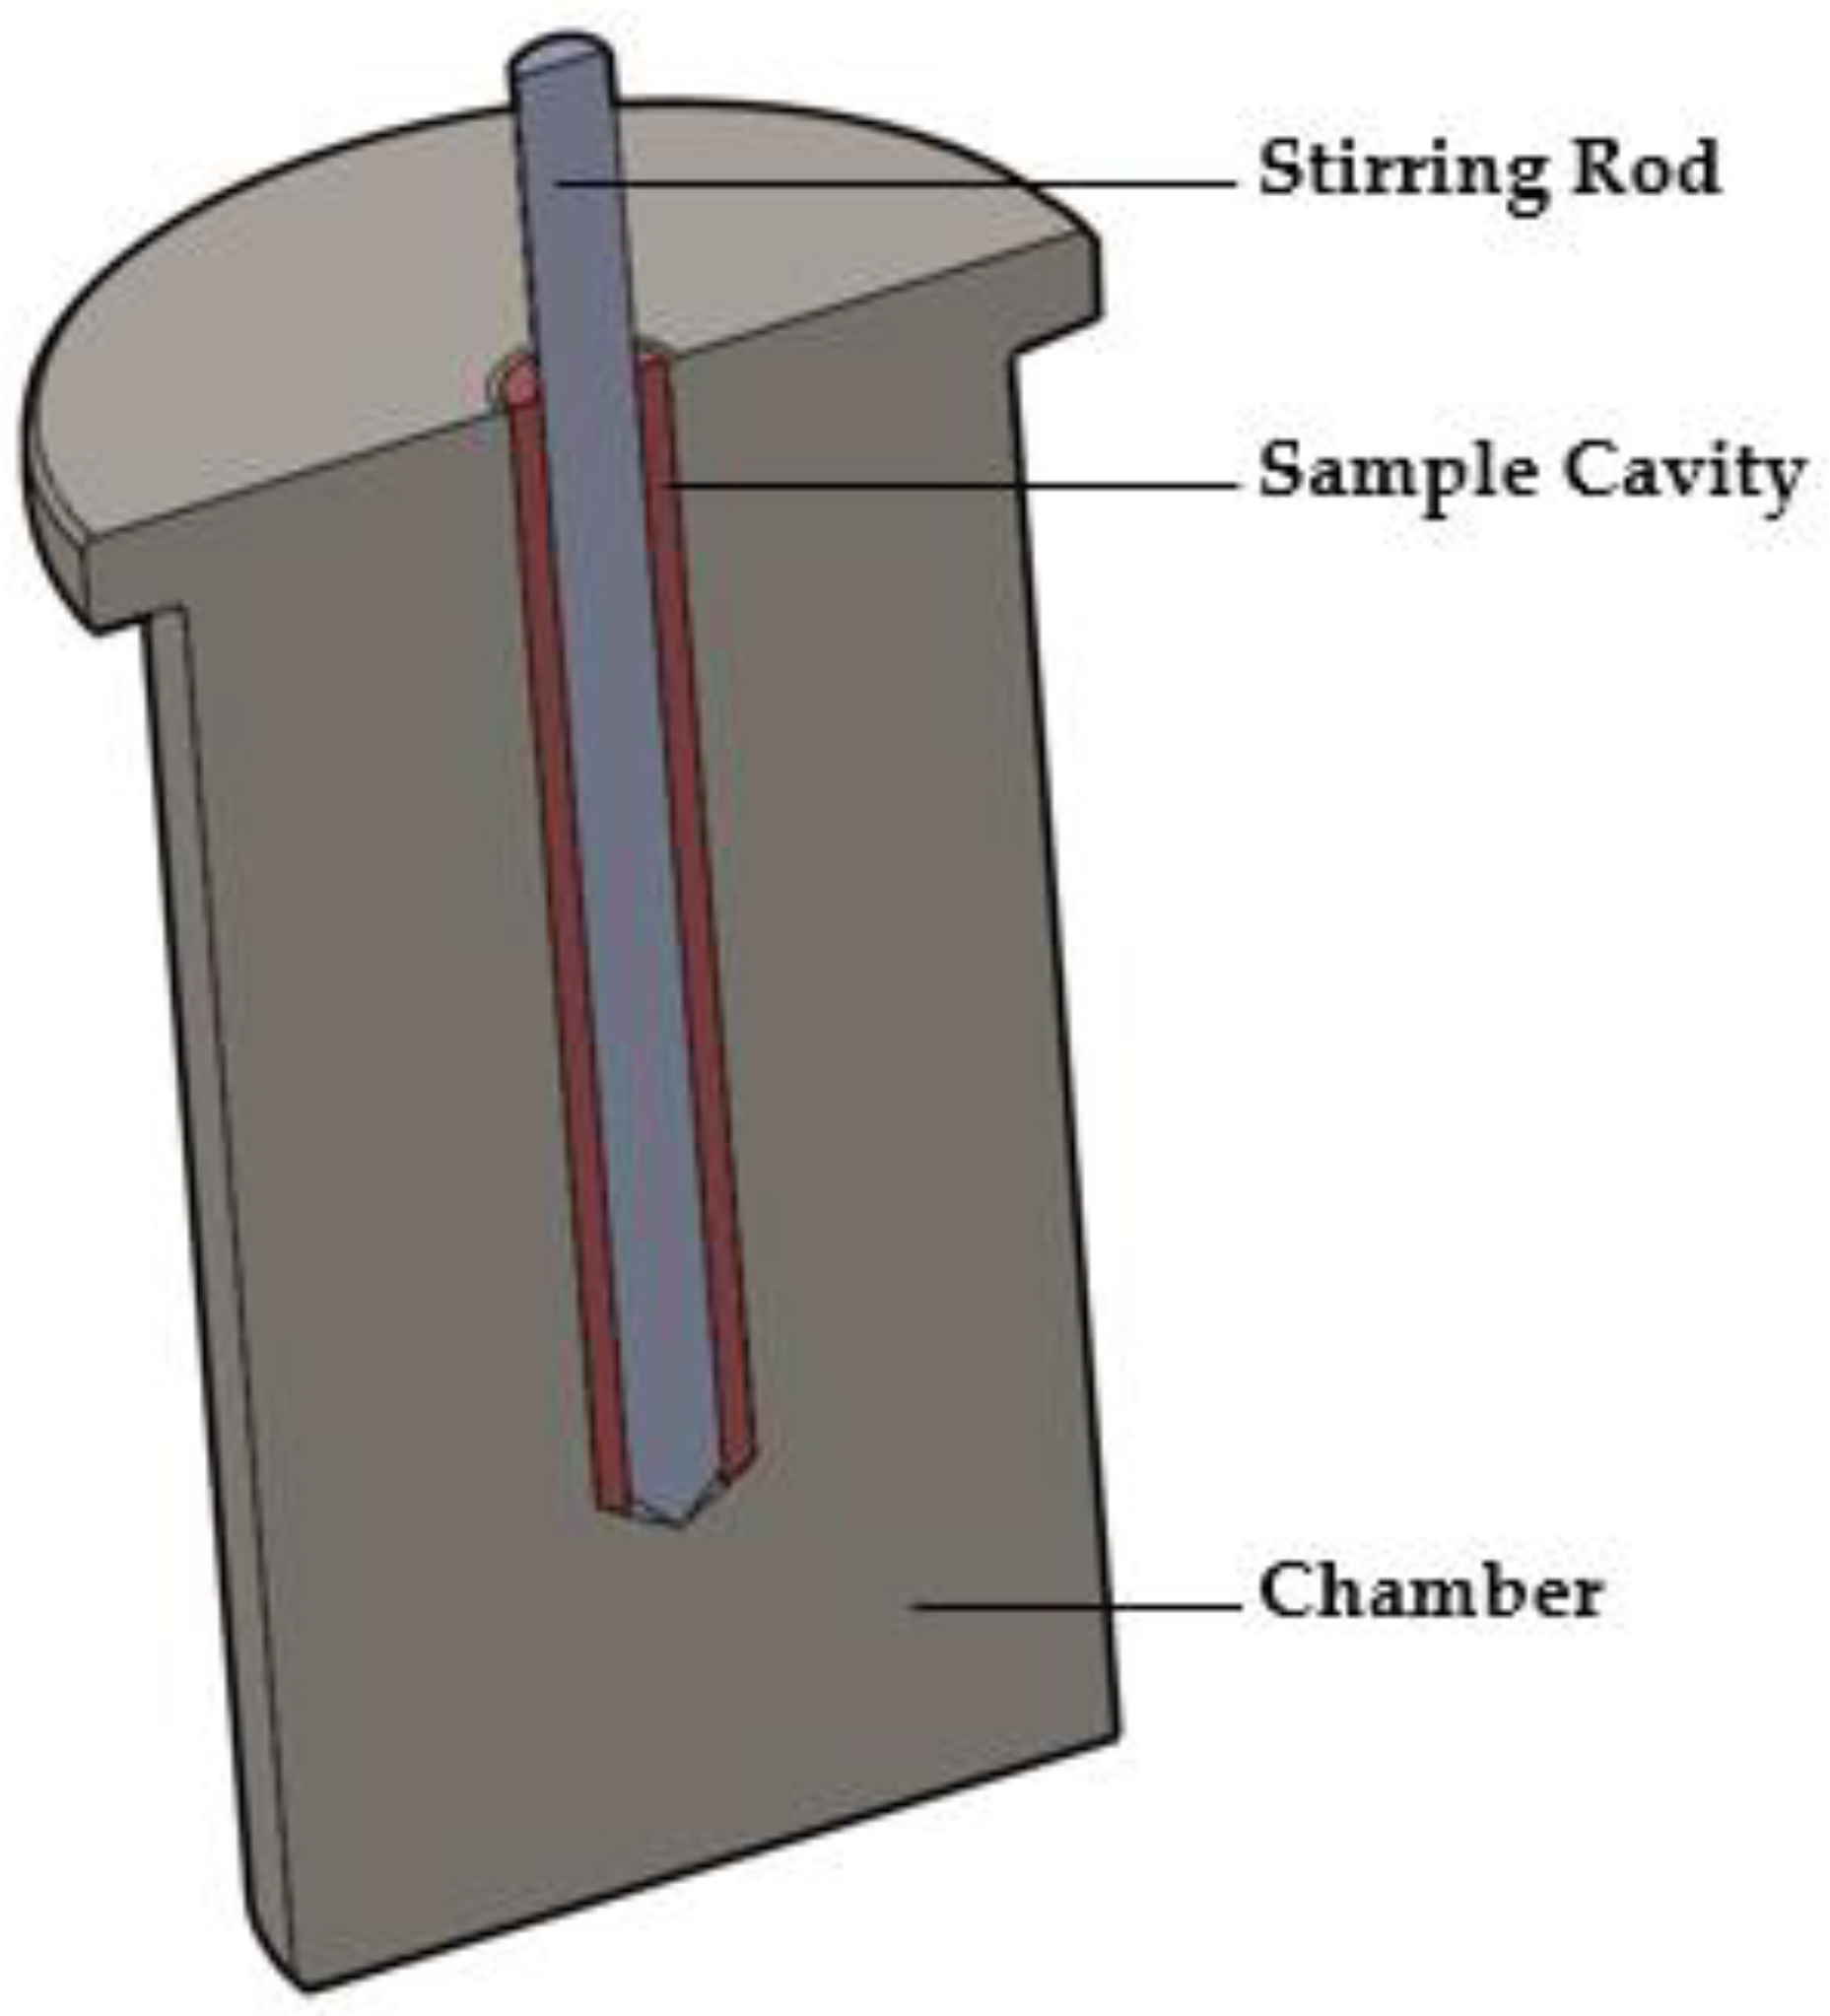
2.3.1. The MiniMixer Device
2.3.2. Processing Procedure
- The entire device is equilibrated to the desired temperature.
- Physical mixture (roughly 200 mg) is loaded into the sample cavity.
- Spinning of the stirring rod is initiated as it is fully into the sample cavity.
- Stirring is maintained for the desired time, in 30 s intervals with a 10 s delay between each.
- At the completion of mixing, the direction of the drill is reversed while the stirring rod is removed, which will be encased by the bulk of the processed sample. This is immediately placed into a liquid nitrogen-filled mortar.
- A razor blade is used to remove the sample from the stirring rod. Any sample remaining in the cavity is scraped out using a hooked spatula and added to the liquid nitrogen.
- After the liquid nitrogen evaporates, the sample is hand-ground with a mortar and pestle, quickly recovered, and allowed to equilibrate to room temperature prior to analysis.
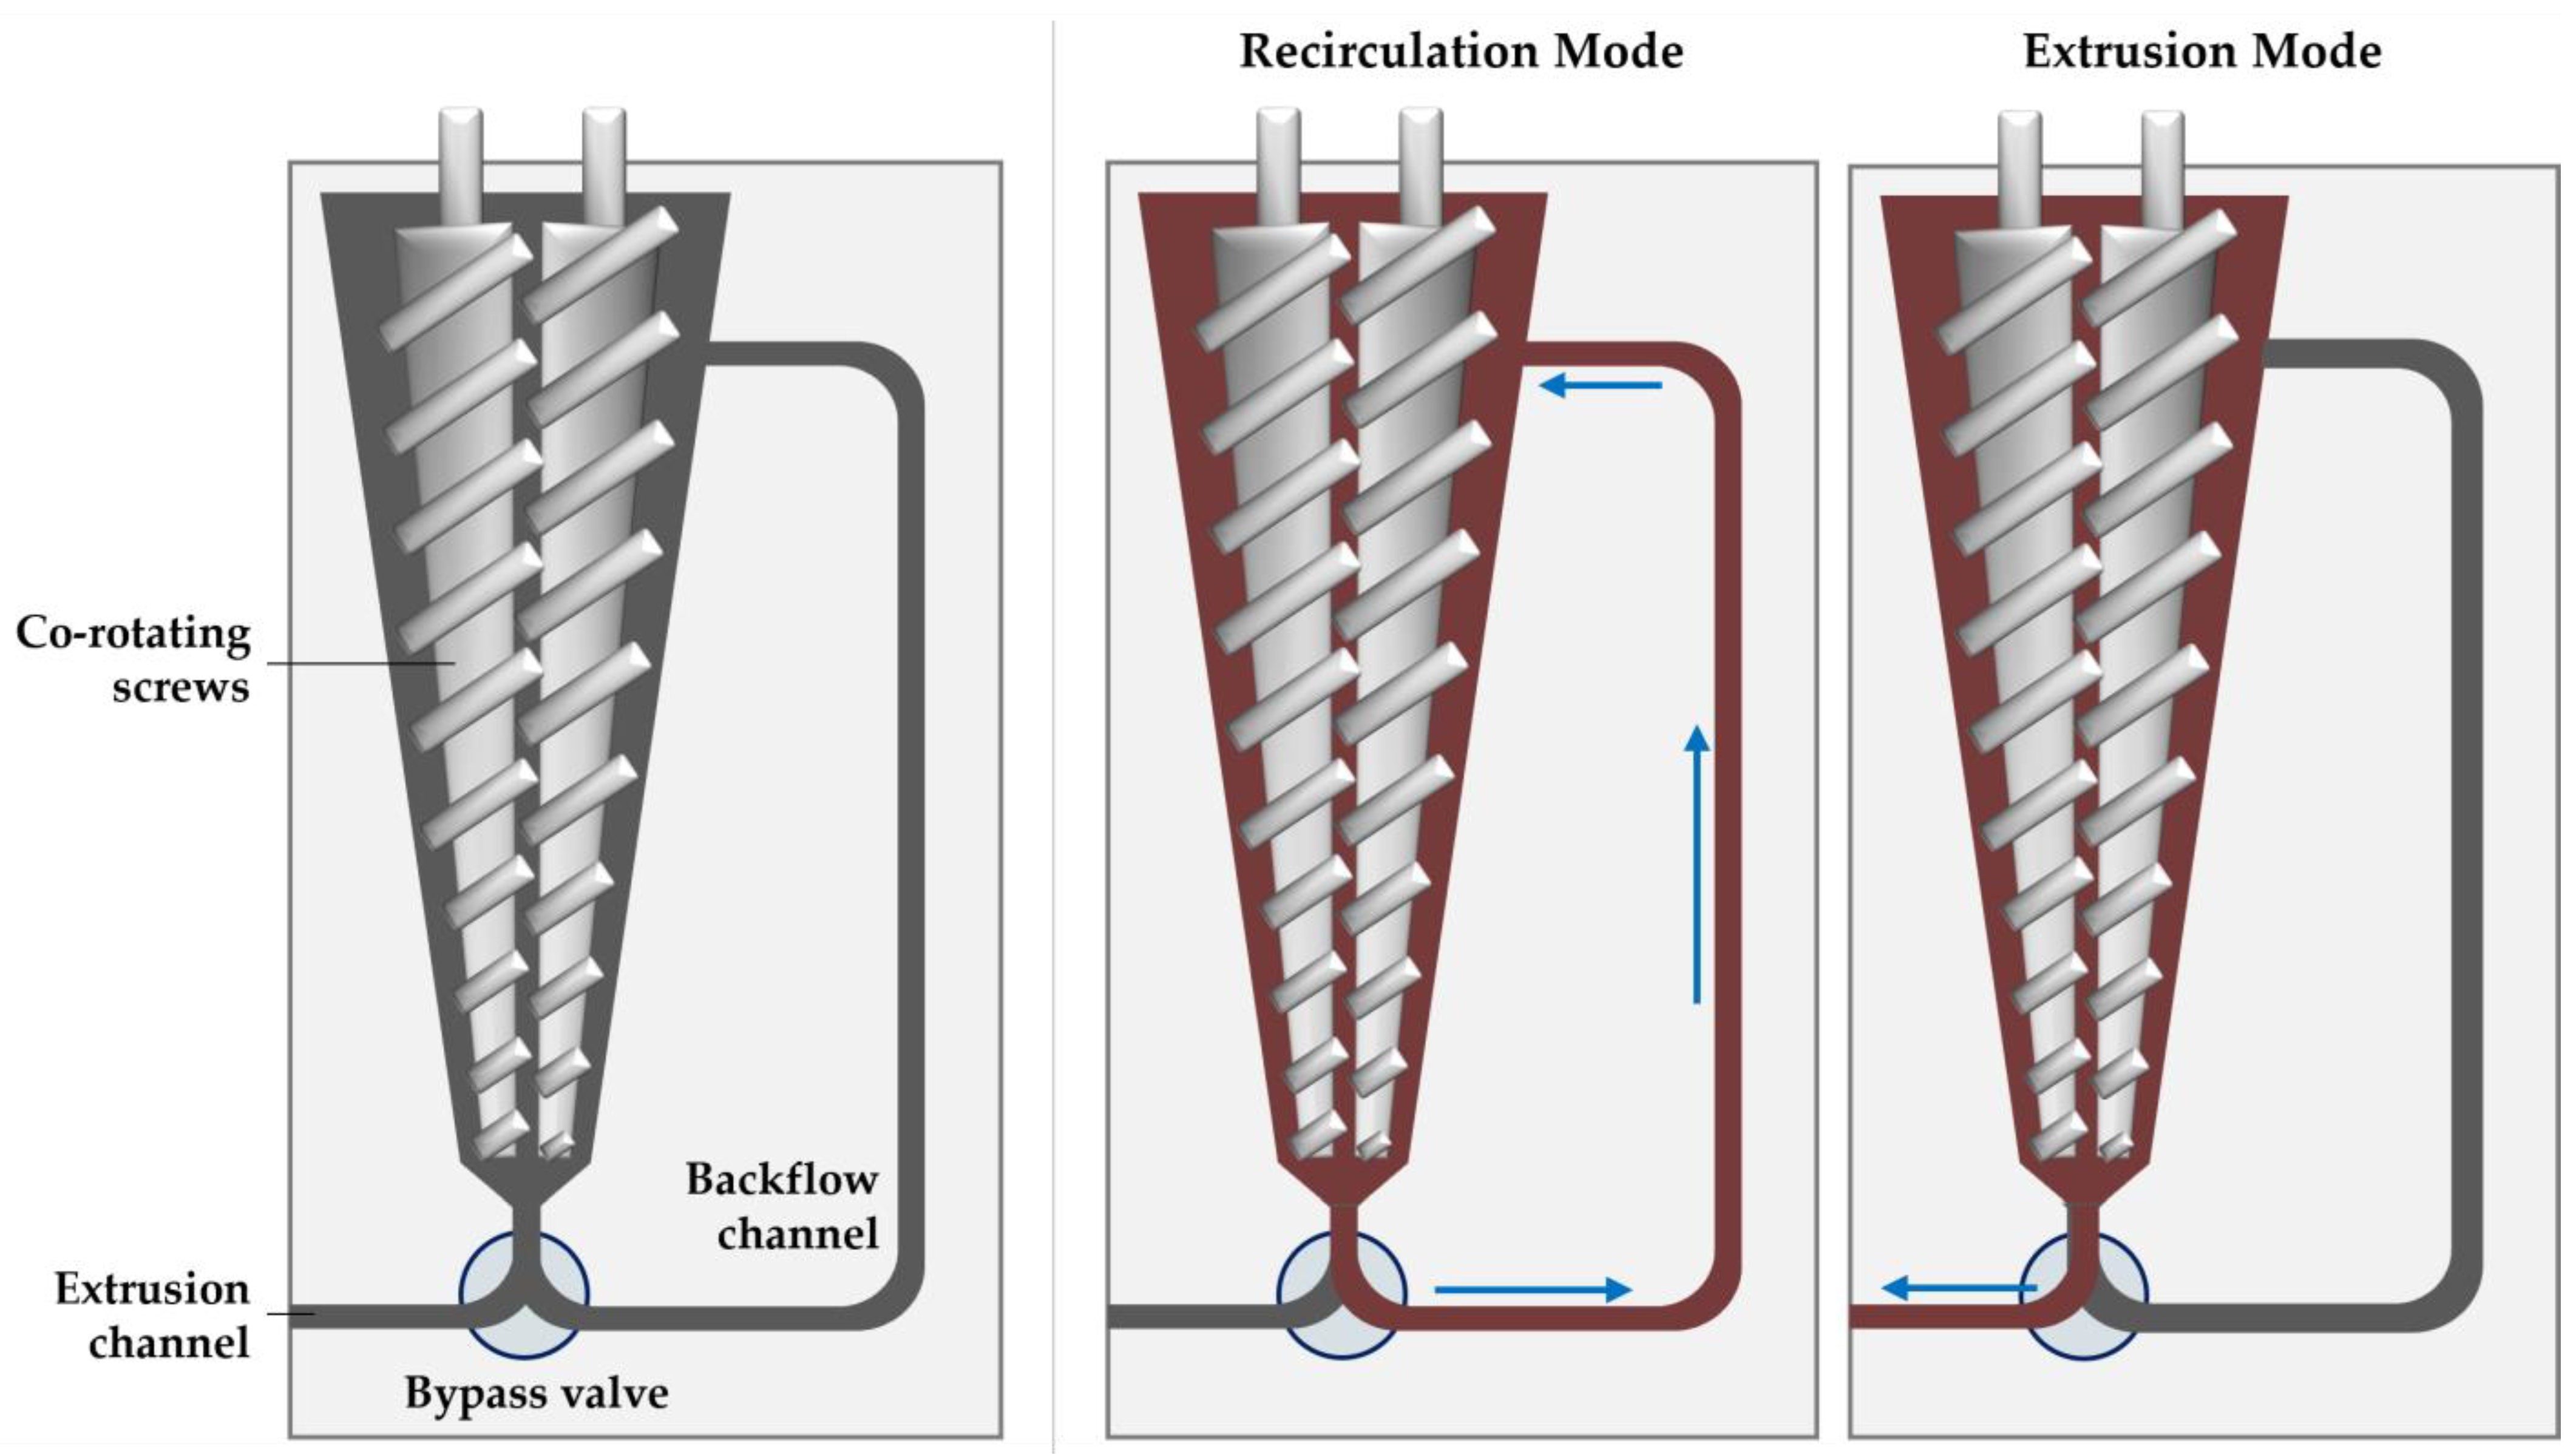
2.4. Micro Compounder Extrusion Processing
2.5. Summary of Processed Samples
2.5.1. MiniMixer and Micro Compounder Trials
2.5.2. Unmixed Isothermal Holds
2.6. PXRD
2.7. Purity
2.7.1. Ritonavir
2.7.2. Piroxicam
2.7.3. Phenytoin
3. Results
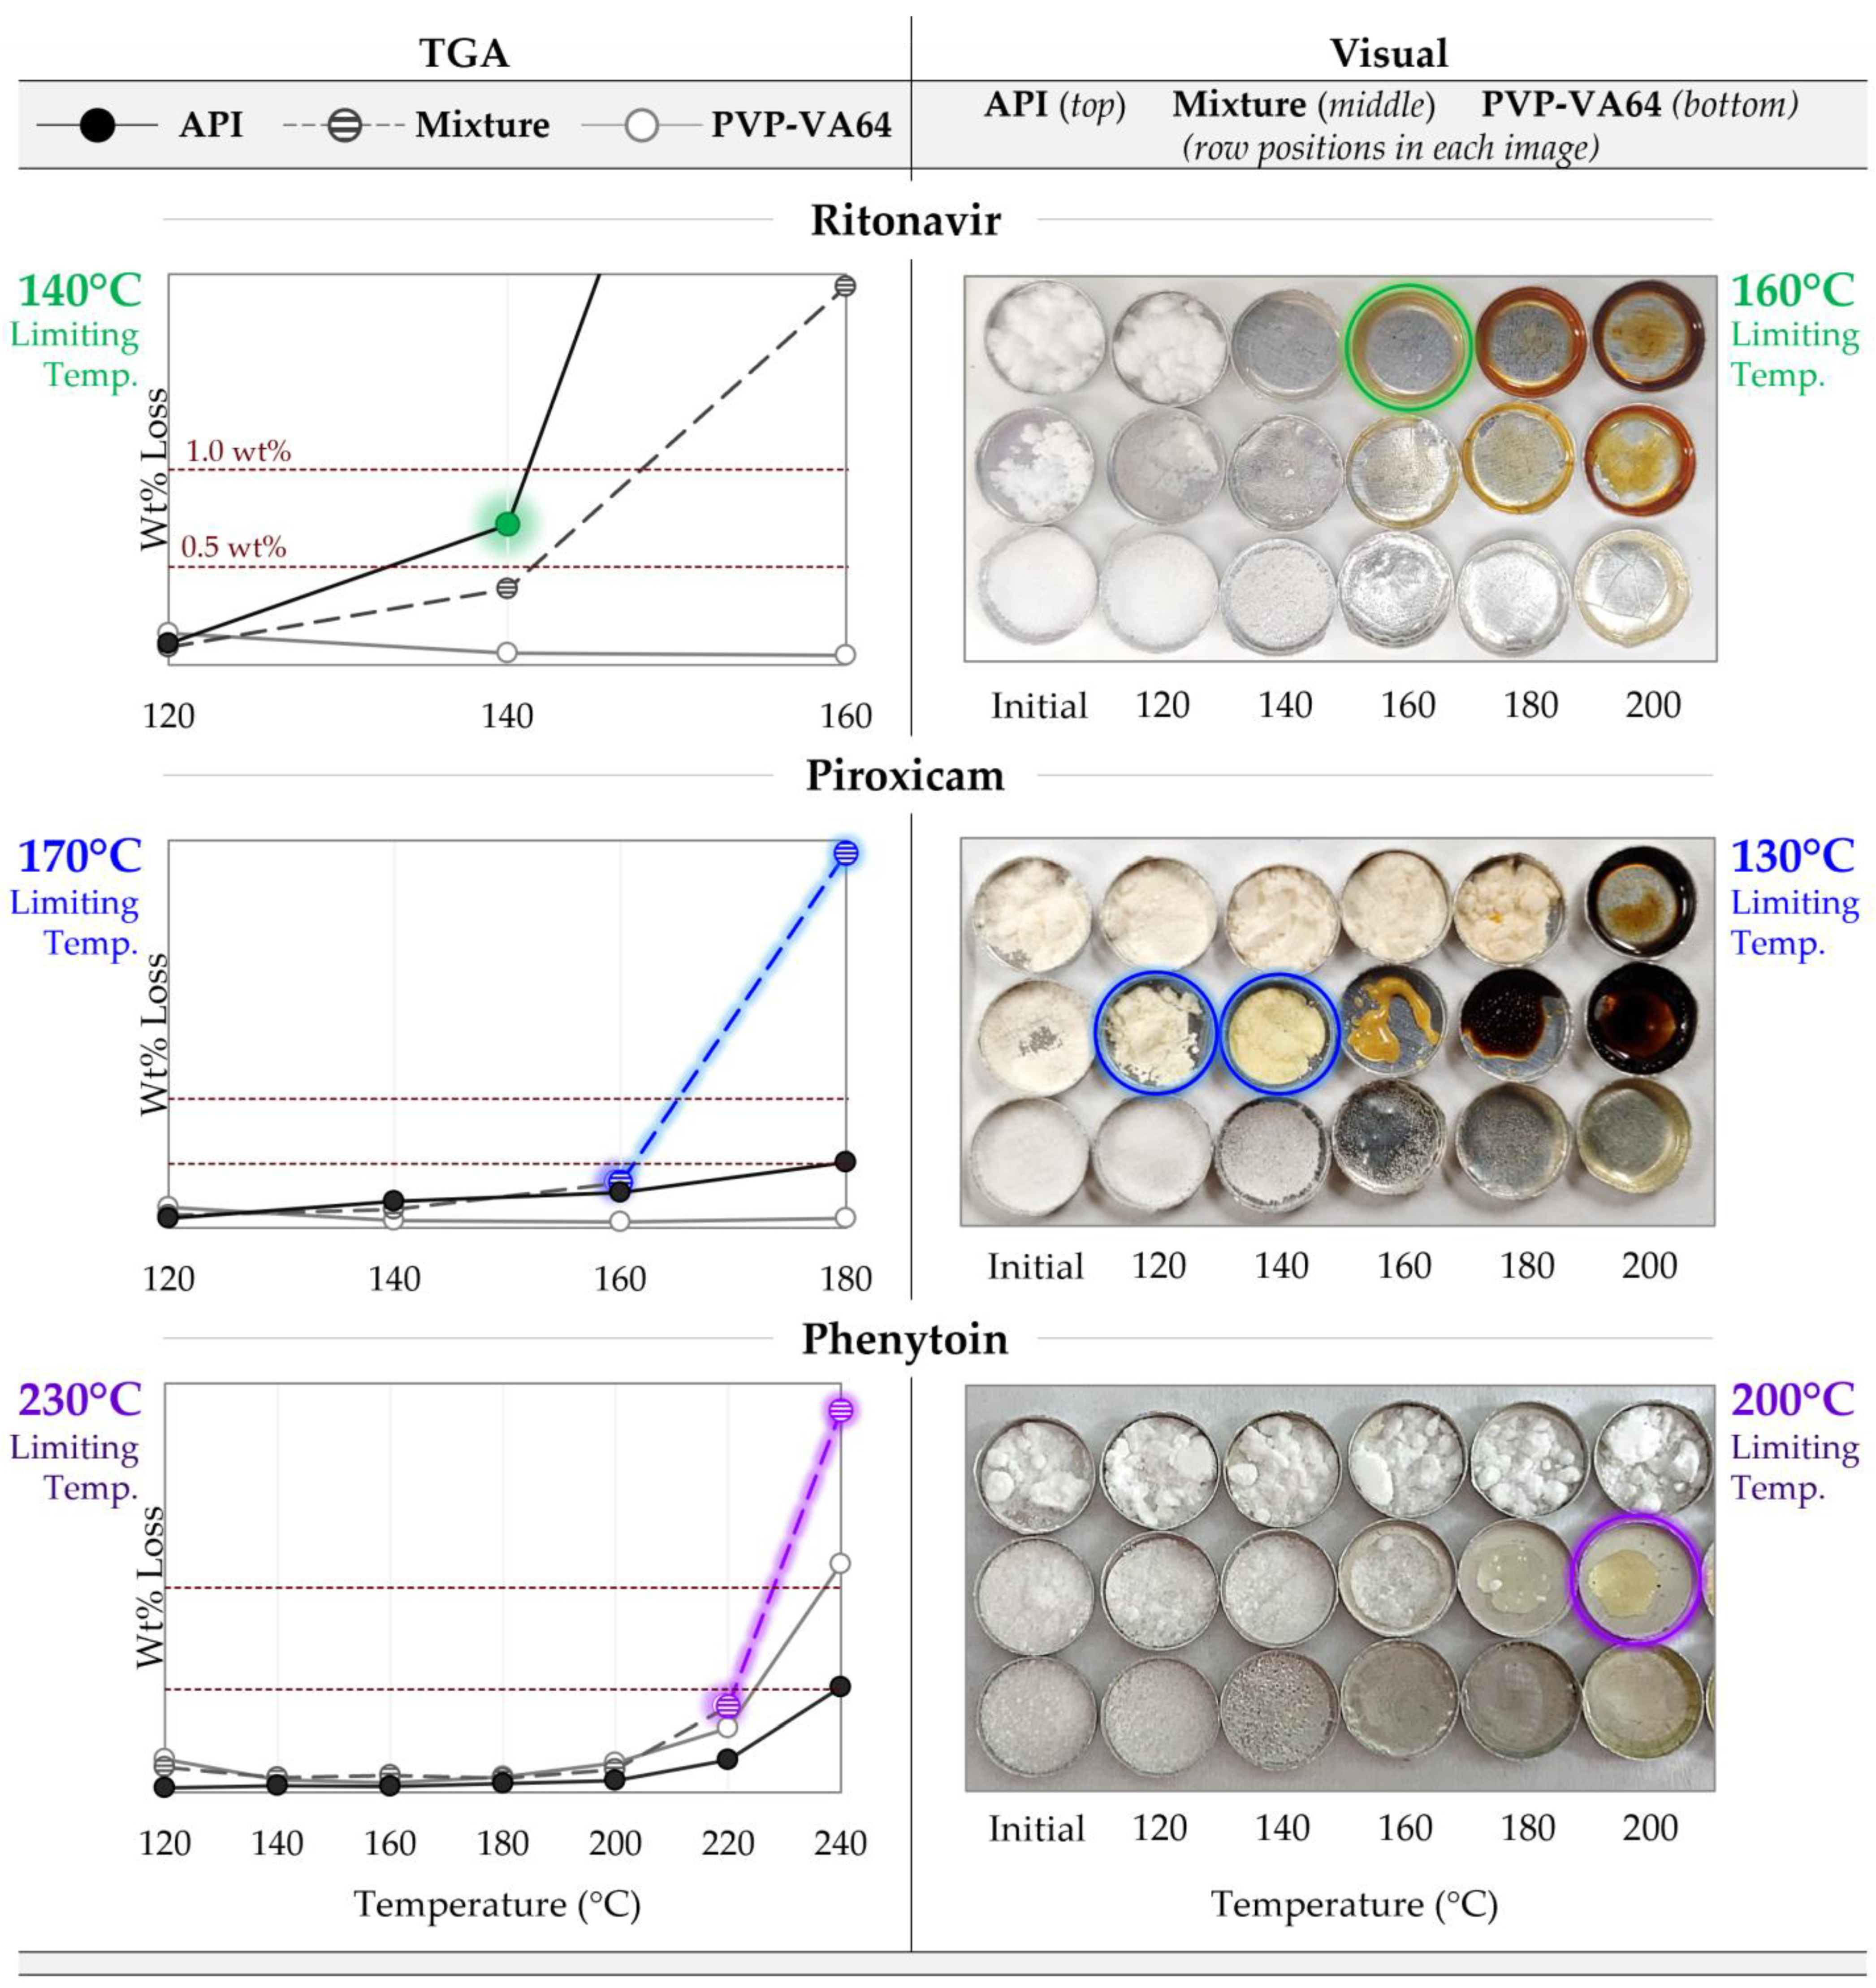
3.1. Maximum Processing Temperature
3.2. MiniMixer: Small-Scale HME Screening Device
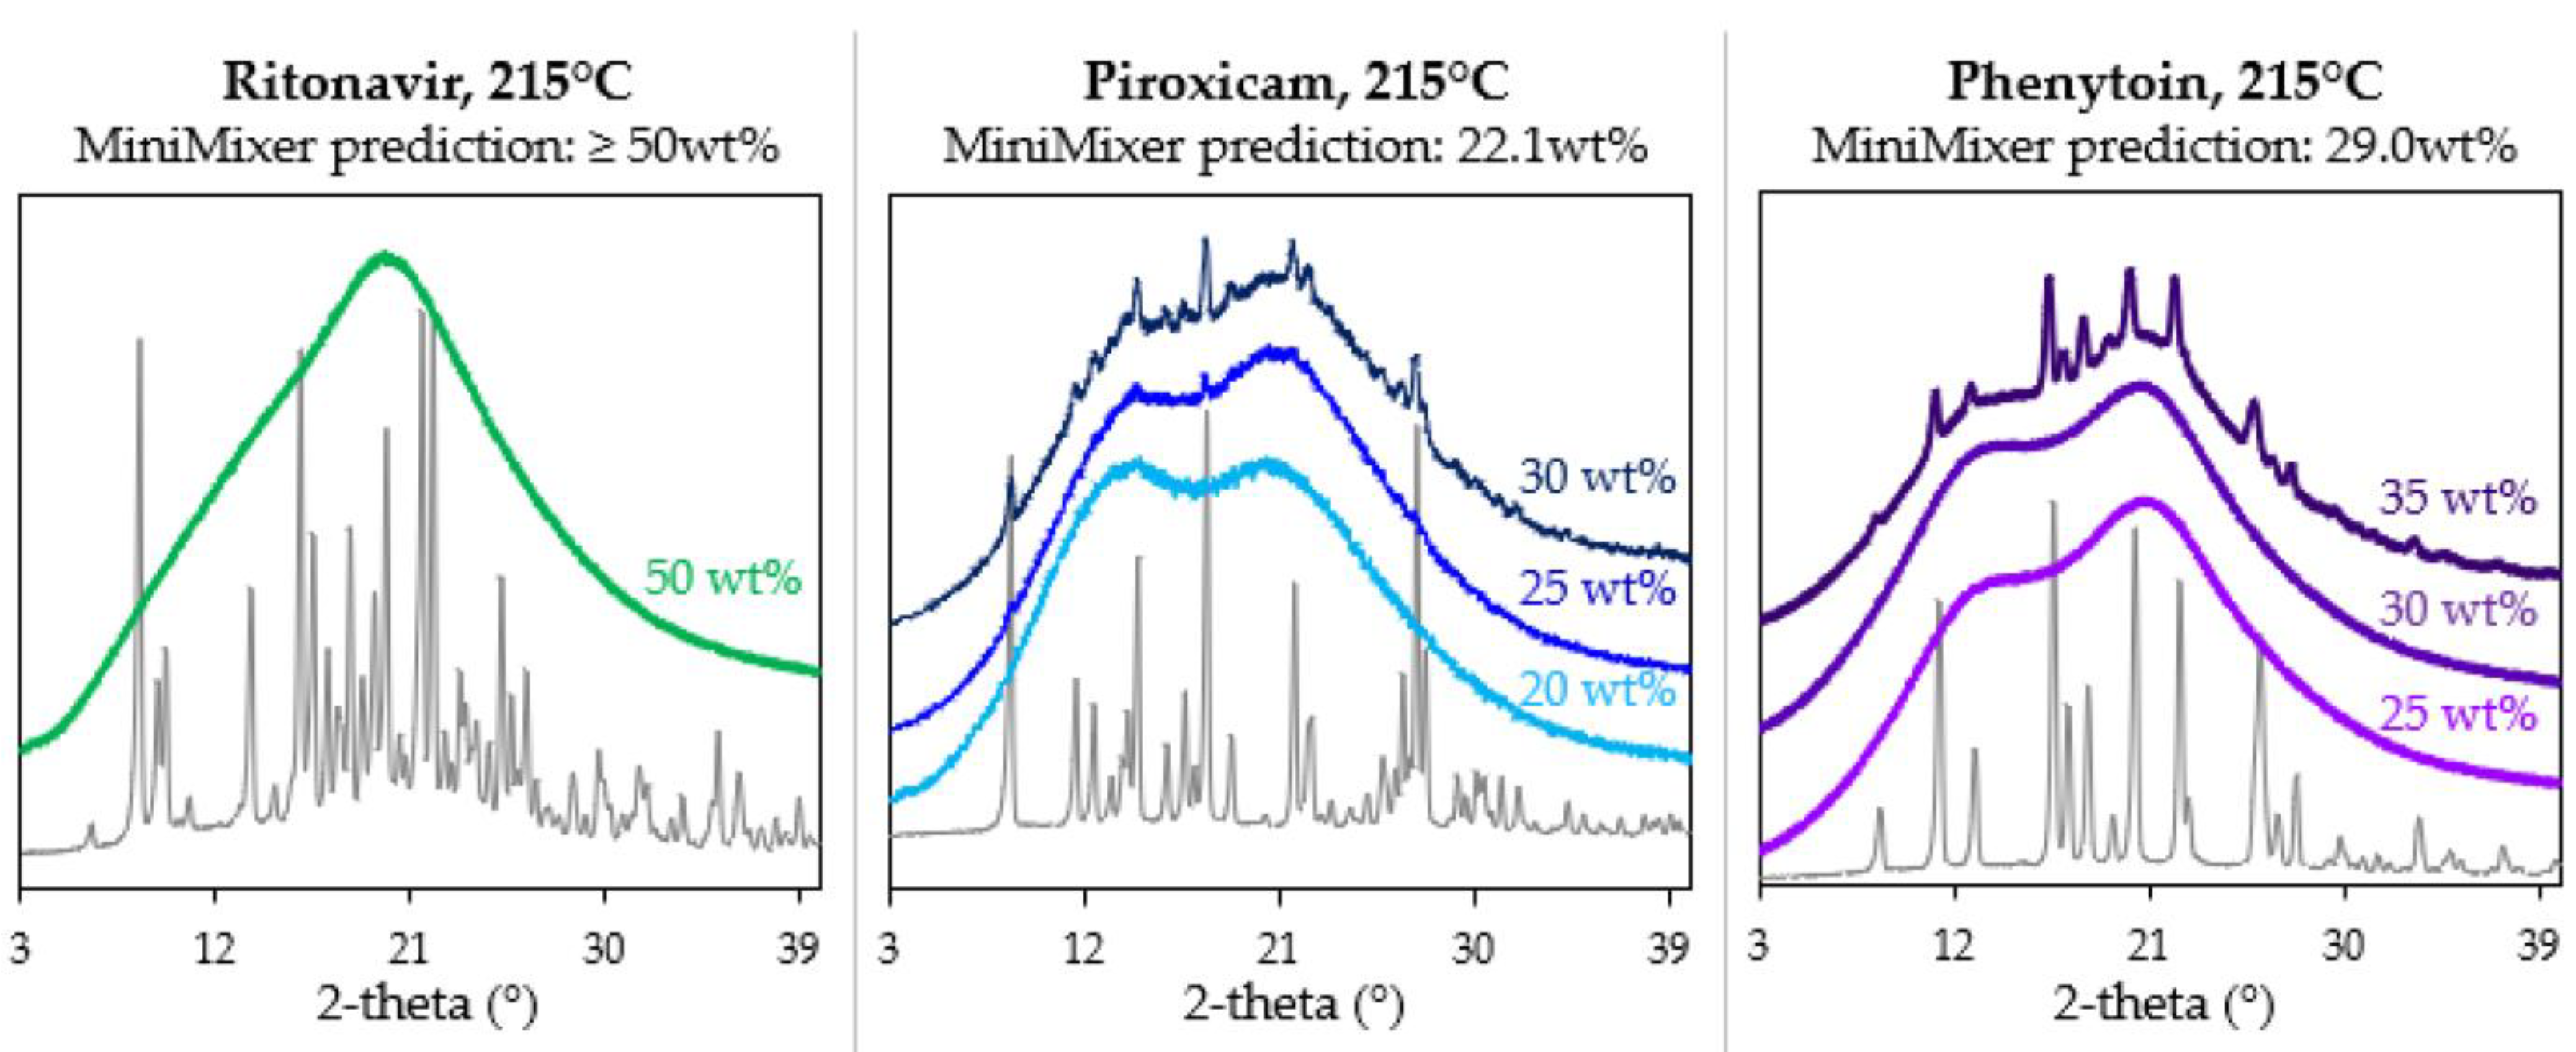
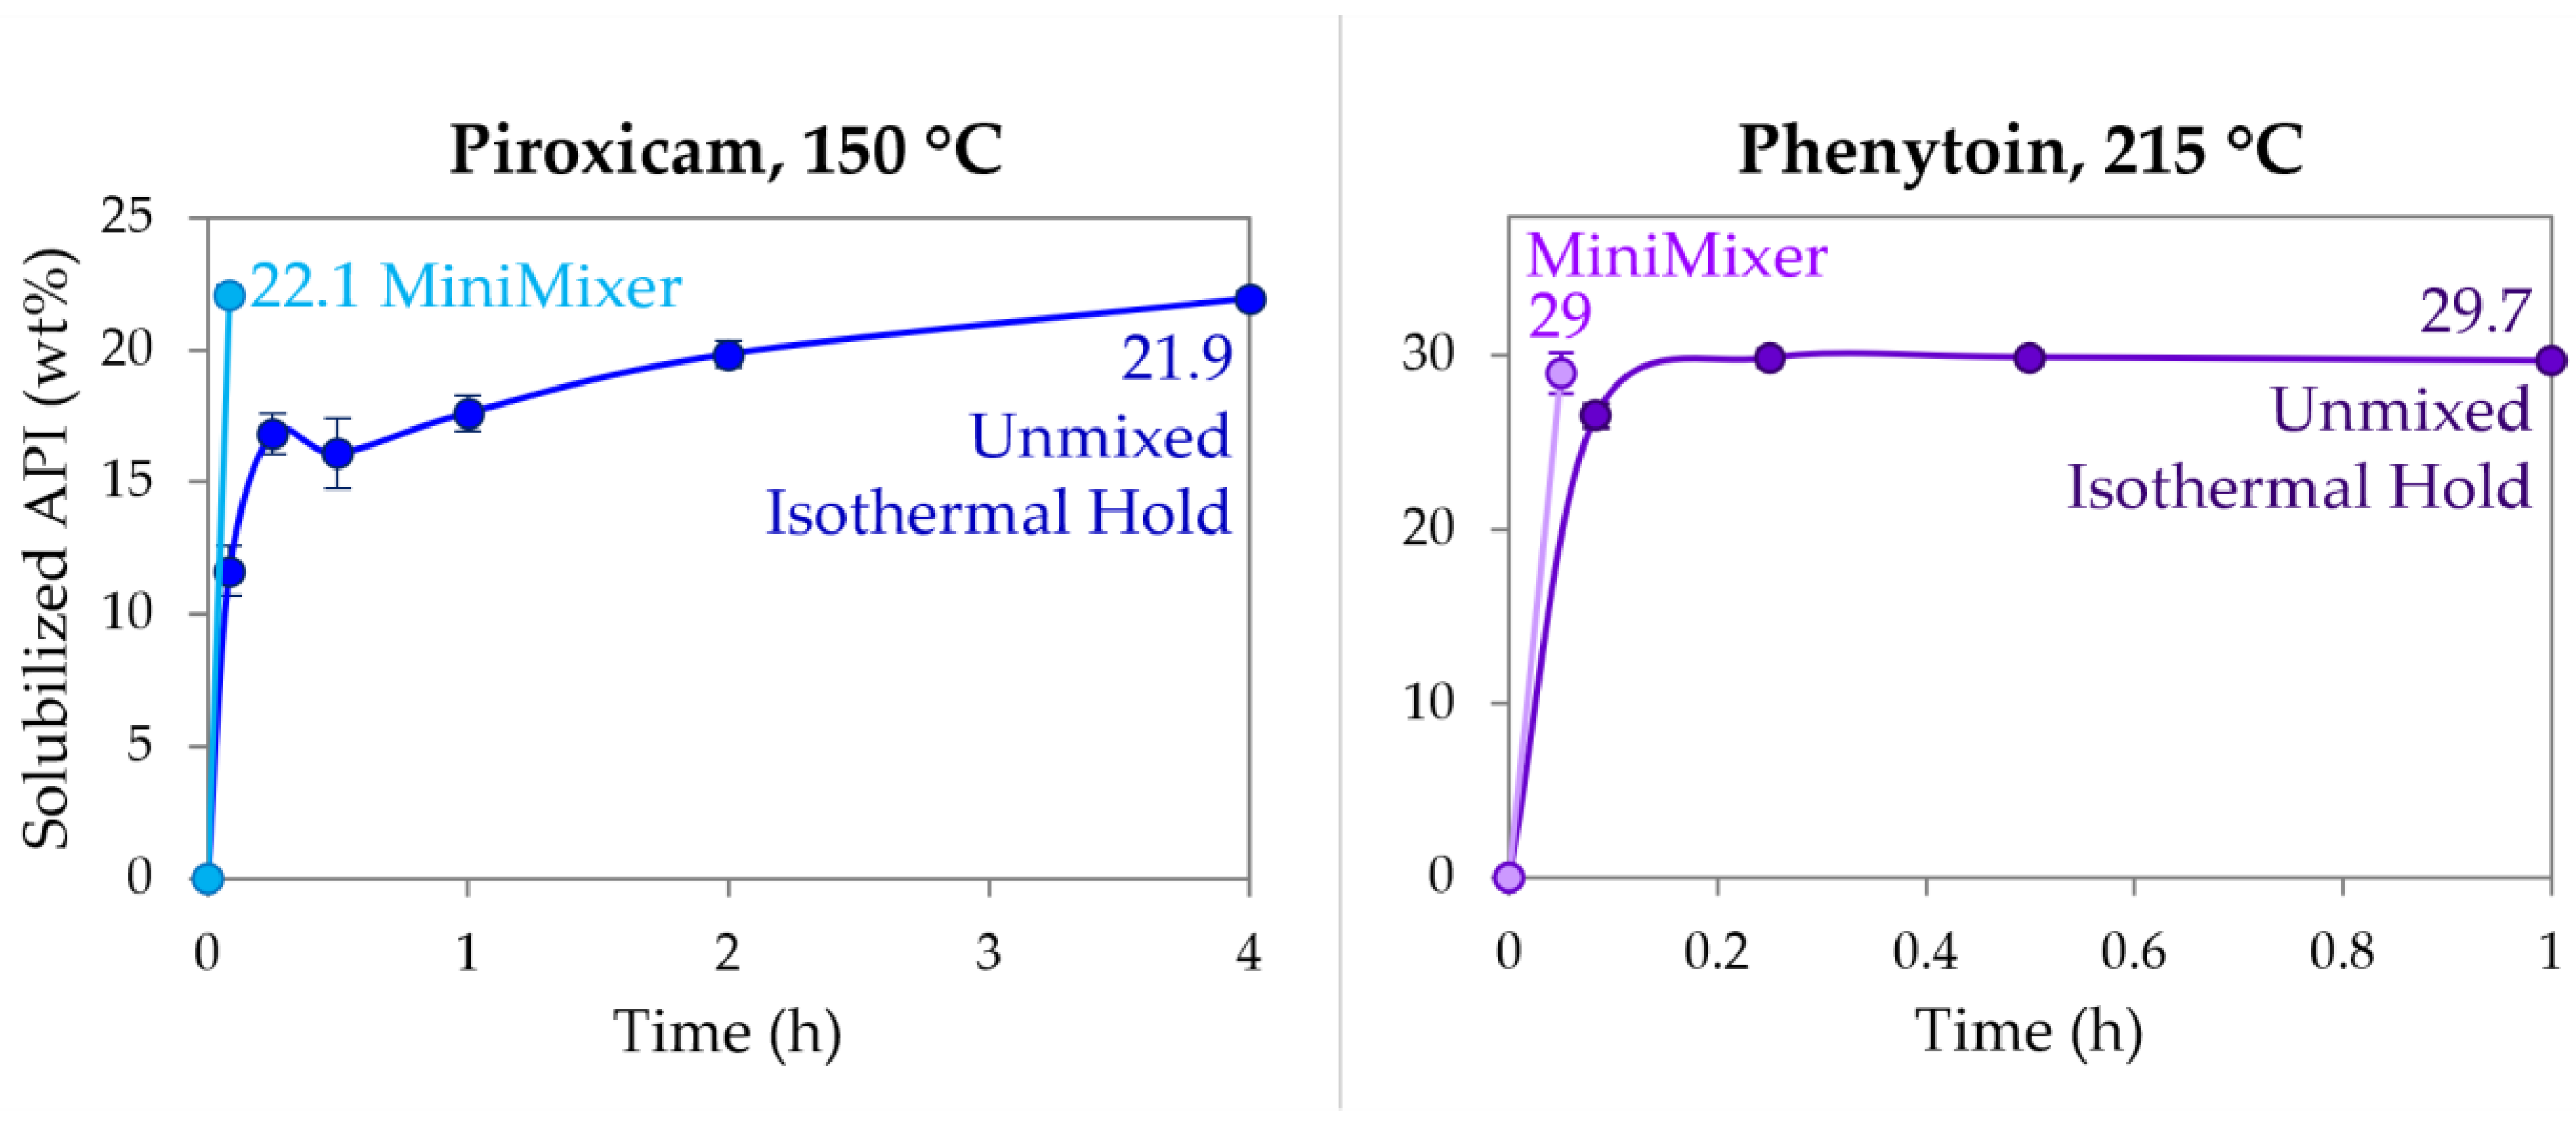
3.3. Achievable API Loadings
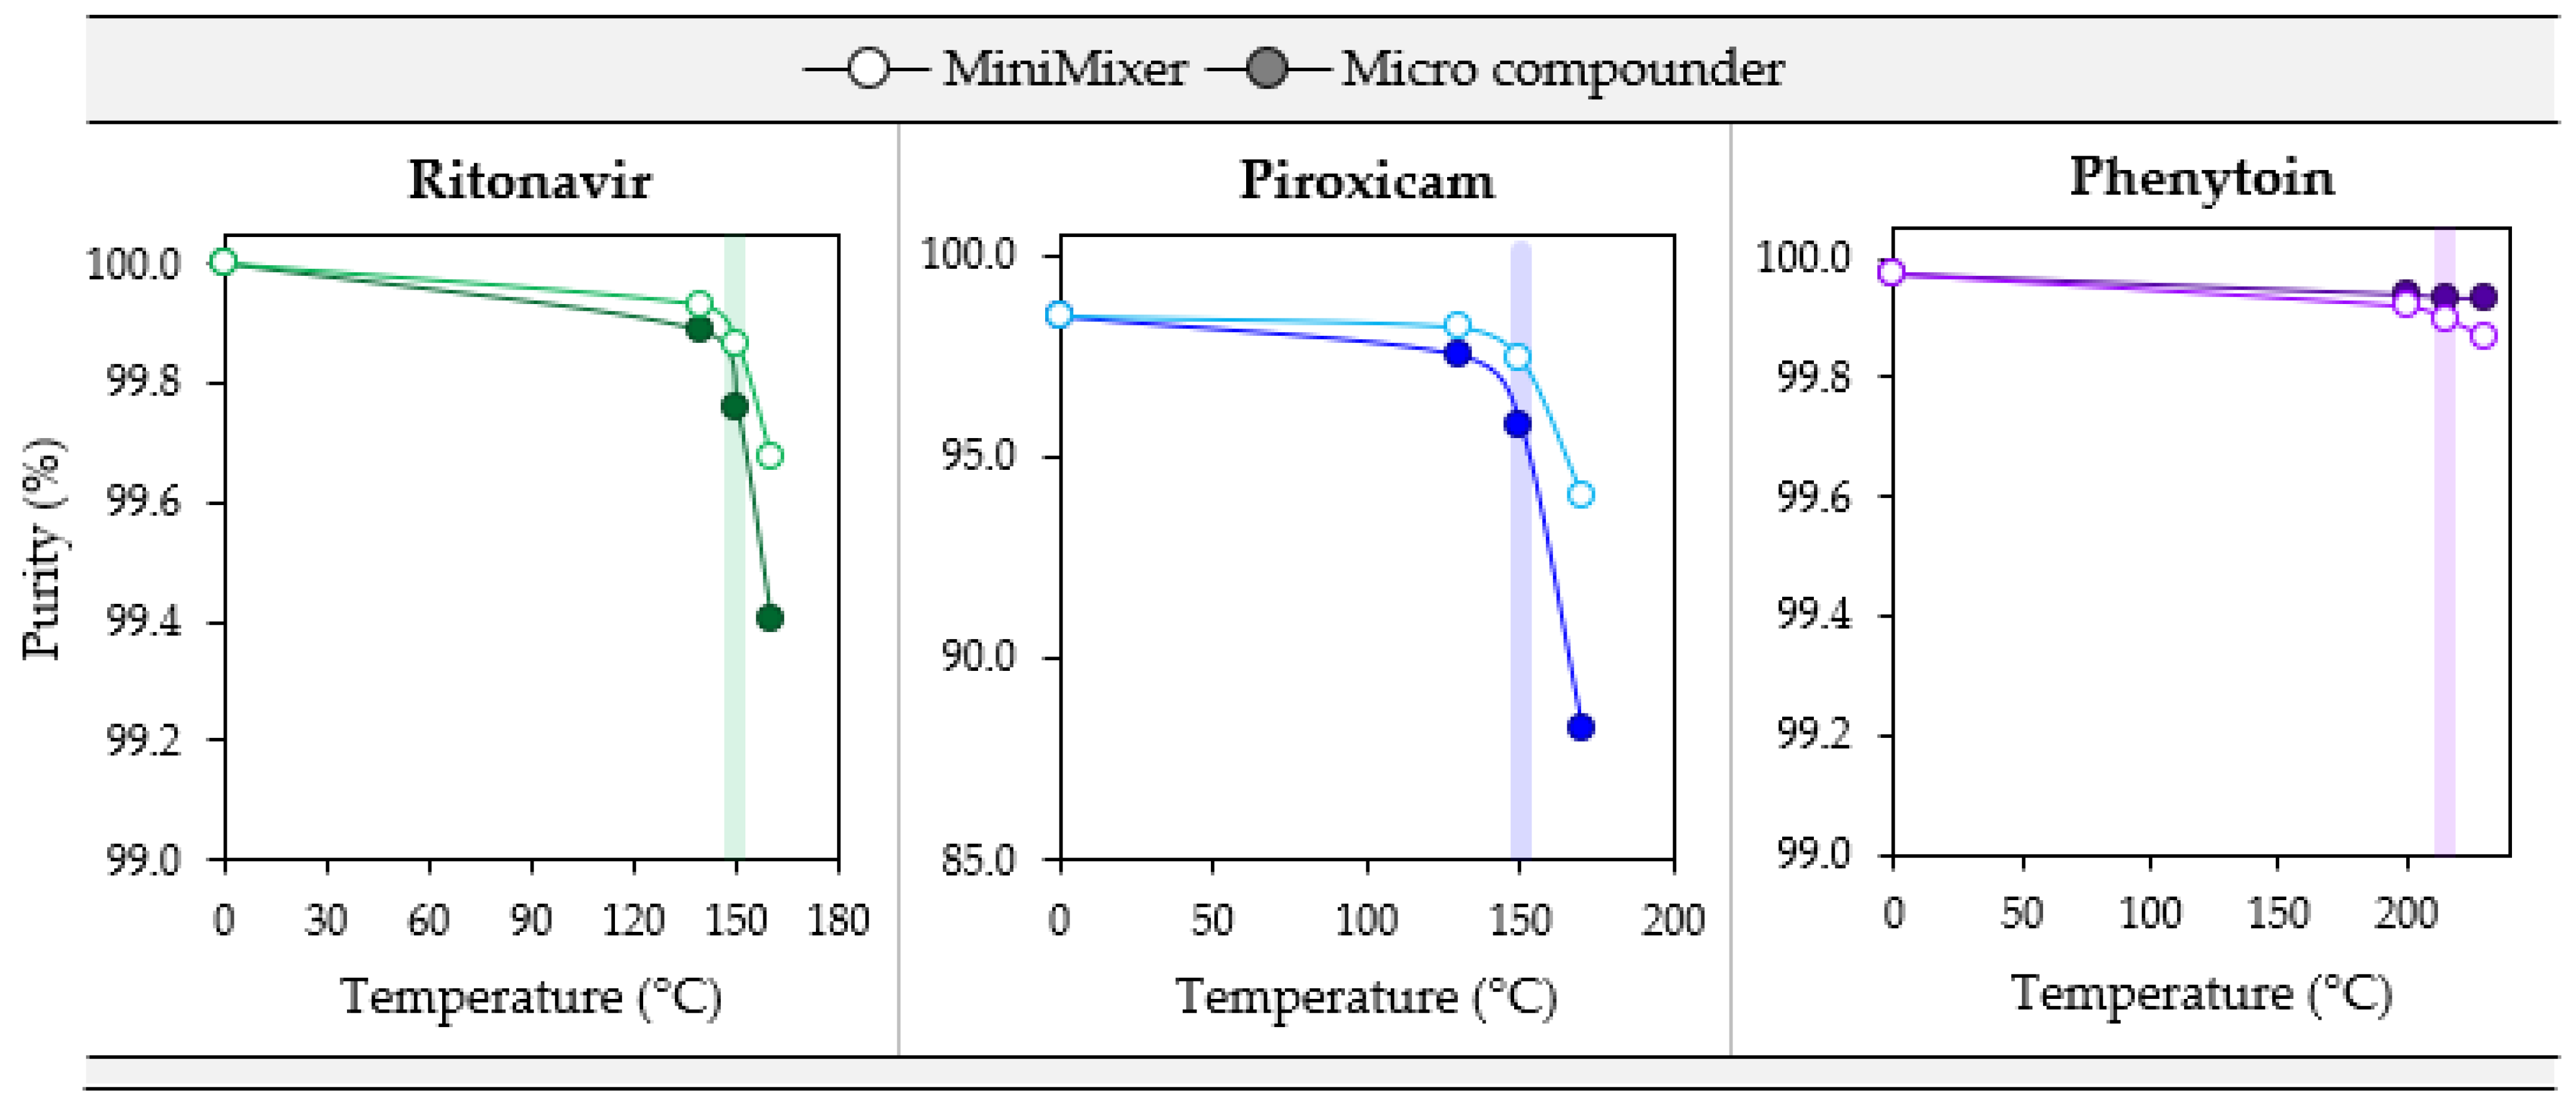
3.4. Degradation
4. Discussion
4.1. Degradation Prescreening
4.2. MiniMixer Predictability
4.3. HME Screening Procedure
4.3.1. Degradation Prescreening
4.3.2. Feasibility Screening
4.3.3. Process Screening
5. Conclusions
Supplementary Materials
Author Contributions
Funding
Institutional Review Board Statement
Data Availability Statement
Acknowledgments
Conflicts of Interest
References
- LaFountaine, J.S.; McGinity, J.W.; Williams, R.O. Challenges and Strategies in Thermal Processing of Amorphous Solid Dispersions: A Review. AAPS PharmSciTech 2016, 17, 43–55. [Google Scholar] [CrossRef] [PubMed]
- Lipinski, C.A.; Lombardo, F.; Dominy, B.W.; Feeney, P.J. Experimental and computational approaches to estimate solubility and permeability in drug discovery and development settings. Adv. Drug Deliv. Rev. 2001, 46, 3–26. [Google Scholar] [CrossRef] [PubMed]
- Pandi, P.; Bulusu, R.; Kommineni, N.; Khan, W.; Singh, M. Amorphous solid dispersions: An update for preparation, characterization, mechanism on bioavailability, stability, regulatory considerations and marketed products. Int. J. Pharm. 2020, 586, 119560. [Google Scholar] [CrossRef] [PubMed]
- Patil, H.; Tiwari, R.V.; Repka, M.A. Hot-Melt Extrusion: From Theory to Application in Pharmaceutical Formulation. AAPS PharmSciTech 2016, 17, 20–42. [Google Scholar] [CrossRef] [PubMed]
- Reitz, E.; Podhaisky, H.; Ely, D.; Thommes, M. Residence time modeling of hot melt extrusion processes. Eur. J. Pharm. Biopharm. 2013, 85, 1200–1205. [Google Scholar] [CrossRef] [PubMed]
- Matić, J.; Paudel, A.; Bauer, H.; Garcia, R.A.L.; Biedrzycka, K.; Khinast, J.G. Developing HME-Based Drug Products Using Emerging Science: A Fast-Track Roadmap from Concept to Clinical Batch. AAPS PharmSciTech 2020, 21, 176. [Google Scholar] [CrossRef]
- Thakkar, R.; Thakkar, R.; Pillai, A.; Ashour, E.A.; Repka, M.A. Systematic screening of pharmaceutical polymers for hot melt extrusion processing: A comprehensive review. Int. J. Pharm. 2020, 576, 118989. [Google Scholar] [CrossRef]
- Matić, J.; Alva, C.; Eder, S.; Reusch, K.; Paudel, A.; Khinast, J. Towards predicting the product quality in hot-melt extrusion: Pilot plant scale extrusion. Int. J. Pharm. X 2021, 3, 100084. [Google Scholar] [CrossRef]
- Matić, J.; Alva, C.; Witschnigg, A.; Eder, S.; Reusch, K.; Paudel, A.; Khinast, J. Towards predicting the product quality in hot-melt extrusion: Small scale extrusion. Int. J. Pharm. X 2020, 2, 100062. [Google Scholar] [CrossRef]
- Zecevic, D.E.; Evans, R.C.; Paulsen, K.; Wagner, K.G. From benchtop to pilot scale–experimental study and computational assessment of a hot-melt extrusion scale-up of a solid dispersion of dipyridamole and copovidone. Int. J. Pharm. 2018, 537, 132–139. [Google Scholar] [CrossRef]
- Tian, Y.; Caron, V.; Jones, D.S.; Healy, A.M.; Andrews, G.P. Using Flory-Huggins phase diagrams as a pre-formulation tool for the production of amorphous solid dispersions: A comparison between hot-melt extrusion and spray drying. J. Pharm. Pharmacol. 2014, 66, 256–274. [Google Scholar] [CrossRef]
- Zecevic, D.E.; Wagner, K.G. Rational Development of Solid Dispersions via Hot-Melt Extrusion Using Screening, Material Characterization, and Numeric Simulation Tools. J. Pharm. Sci. 2013, 102, 2297–2310. [Google Scholar] [CrossRef] [PubMed]
- Hengsawas Surasarang, S.H.; Keen, J.M.; Huang, S.; Zhang, F.; McGinity, J.W.; Williams, R.O., 3rd. Hot melt extrusion versus spray drying: Hot melt extrusion degrades albendazole. Drug Dev. Ind. Pharm. 2017, 43, 797–811. [Google Scholar] [CrossRef]
- Moseson, D.E.; Taylor, L.S. The application of temperature-composition phase diagrams for hot melt extrusion processing of amorphous solid dispersions to prevent residual crystallinity. Int. J. Pharm. 2018, 553, 454–466. [Google Scholar] [CrossRef]
- Repka, M.A.; Bandari, S.; Kallakunta, V.R.; Vo, A.Q.; McFall, H.; Pimparade, M.B.; Bhagurkar, A.M. Melt extrusion with poorly soluble drugs—An integrated review. Int. J. Pharm. 2018, 535, 68–85. [Google Scholar] [CrossRef] [PubMed]
- Rask, M.B.; Knopp, M.M.; Olesen, N.E.; Holm, R.; Rades, T. Comparison of two DSC-based methods to predict drug-polymer solubility. Int. J. Pharm. 2018, 540, 98–105. [Google Scholar] [CrossRef] [PubMed]
- Kyeremateng, S.O.; Pudlas, M.; Woehrle, G.H. A Fast and Reliable Empirical Approach for Estimating Solubility of Crystalline Drugs in Polymers for Hot Melt Extrusion Formulations. J. Pharm. Sci. 2014, 103, 2847–2858. [Google Scholar] [CrossRef] [PubMed]
- Sun, Y.; Tao, J.; Zhang, G.G.Z.; Yu, L. Solubilities of Crystalline Drugs in Polymers: An Improved Analytical Method and Comparison of Solubilities of Indomethacin and Nifedipine in PVP, PVP/VA, and PVAc. J. Pharm. Sci. 2010, 99, 4023–4031. [Google Scholar] [CrossRef]
- Tian, Y.; Booth, J.; Meehan, E.; Jones, D.S.; Li, S.; Andrews, G.P. Construction of drug-polymer thermodynamic phase diagrams using Flory-Huggins interaction theory: Identifying the relevance of temperature and drug weight fraction to phase separation within solid dispersions. Mol. Pharm. 2013, 10, 236–248. [Google Scholar] [CrossRef]
- Knopp, M.M.; Tajber, L.; Tian, Y.; Olesen, N.E.; Jones, D.S.; Kozyra, A.; Löbmann, K.; Paluch, K.; Brennan, C.M.; Holm, R.; et al. Comparative Study of Different Methods for the Prediction of Drug–Polymer Solubility. Mol. Pharm. 2015, 12, 3408–3419. [Google Scholar] [CrossRef]
- Mahieu, A.; Willart, J.-F.; Dudognon, E.; Danède, F.; Descamps, M. A New Protocol to Determine the Solubility of Drugs into Polymer Matrixes. Mol. Pharm. 2013, 10, 560–566. [Google Scholar] [CrossRef] [PubMed]
- Marsac, P.J.; Shamblin, S.L.; Taylor, L.S. Theoretical and practical approaches for prediction of drug-polymer miscibility and solubility. Pharm. Res. 2006, 23, 2417–2426. [Google Scholar] [CrossRef] [PubMed]
- Tao, J.; Sun, Y.; Zhang, G.G.Z.; Yu, L. Solubility of Small-Molecule Crystals in Polymers: D-Mannitol in PVP, Indomethacin in PVP/VA, and Nifedipine in PVP/VA. Pharm. Res. 2009, 26, 855–864. [Google Scholar] [CrossRef] [PubMed]
- Yang, M.; Wang, P.; Suwardie, H.; Gogos, C. Determination of acetaminophen’s solubility in poly(ethylene oxide) by rheological, thermal and microscopic methods. Int. J. Pharm. 2011, 403, 83–89. [Google Scholar] [CrossRef] [PubMed]
- Moseson, D.E.; Parker, A.S.; Gilpin, C.J.; Stewart, A.A.; Beaudoin, S.P.; Taylor, L.S. Dissolution of Indomethacin Crystals into a Polymer Melt: Role of Diffusion and Fragmentation. Cryst. Growth Des. 2019, 19, 3315–3328. [Google Scholar] [CrossRef]
- Agrawal, A.M.; Dudhedia, M.S.; Zimny, E. Hot Melt Extrusion: Development of an Amorphous Solid Dispersion for an Insoluble Drug from Mini-scale to Clinical Scale. AAPS PharmSciTech 2016, 17, 133–147. [Google Scholar] [CrossRef]
- Yang, F.; Su, Y.; Zhang, J.; DiNunzio, J.; Leone, A.; Huang, C.; Brown, C.D. Rheology Guided Rational Selection of Processing Temperature To Prepare Copovidone–Nifedipine Amorphous Solid Dispersions via Hot Melt Extrusion (HME). Mol. Pharm. 2016, 13, 3494–3505. [Google Scholar] [CrossRef]
- Yang, F.; Su, Y.; Brown, C.D.; DiNunzio, J. Solubilizing temperature of crystalline drug in polymer carrier: A rheological investigation on a posaconazole-copovidone system with low drug load. Eur. J. Pharm. Biopharm. 2021, 164, 28–35. [Google Scholar] [CrossRef]
- Solanki, N.G.; Gumaste, S.G.; Shah, A.V.; Serajuddin, A.T.M. Effects of Surfactants on Itraconazole-Hydroxypropyl Methylcellulose Acetate Succinate Solid Dispersion Prepared by Hot Melt Extrusion. II: Rheological Analysis and Extrudability Testing. J. Pharm. Sci. 2019, 108, 3063–3073. [Google Scholar] [CrossRef]
- Aho, J.; Edinger, M.; Botker, J.; Baldursdottir, S.; Rantanen, J. Oscillatory Shear Rheology in Examining the Drug-Polymer Interactions Relevant in Hot Melt Extrusion. J. Pharm. Sci. 2016, 105, 160–167. [Google Scholar] [CrossRef]
- Solanki, N.; Gupta, S.S.; Serajuddin, A.T.M. Rheological analysis of itraconazole-polymer mixtures to determine optimal melt extrusion temperature for development of amorphous solid dispersion. Eur. J. Pharm. Sci. 2018, 111, 482–491. [Google Scholar] [CrossRef] [PubMed]
- Censi, R.; Gigliobianco, M.R.; Casadidio, C.; Di Martino, P. Hot Melt Extrusion: Highlighting Physicochemical Factors to Be Investigated While Designing and Optimizing a Hot Melt Extrusion Process. Pharmaceutics 2018, 10, 89. [Google Scholar] [CrossRef] [PubMed]
- Chokshi, R.J.; Sandhu, H.K.; Iyer, R.M.; Shah, N.H.; Malick, A.; Zia, H. Characterization of physico-mechanical properties of indomethacin and polymers to assess their suitability for hot-melt extrusion processs as a means to manufacture solid dispersion/solution. J. Pharm. Sci. 2005, 94, 2463–2474. [Google Scholar] [CrossRef]
- Maru, S.M.; de Matas, M.; Kelly, A.; Paradkar, A. Characterization of thermal and rheological properties of zidovidine, lamivudine and plasticizer blends with ethyl cellulose to assess their suitability for hot melt extrusion. Eur. J. Pharm. Sci. 2011, 44, 471–478. [Google Scholar] [CrossRef] [PubMed]
- Cox, W.P.; Merz, E.H. Correlation of dynamic and steady flow viscosities. J. Polym. Sci. 1958, 28, 619–622. [Google Scholar] [CrossRef]
- Parikh, T.; Gupta, S.S.; Meena, A.K.; Vitez, I.; Mahajan, N.; Serajuddin, A.T. Application of film-casting technique to investigate drug-polymer miscibility in solid dispersion and hot-melt extrudate. J. Pharm. Sci. 2015, 104, 2142–2152. [Google Scholar] [CrossRef] [PubMed]
- Auch, C.; Harms, M.; Mäder, K. Melt-based screening method with improved predictability regarding polymer selection for amorphous solid dispersions. Eur. J. Pharm. Sci. 2018, 124, 339–348. [Google Scholar] [CrossRef]
- Weuts, I.; Van Dycke, F.; Voorspoels, J.; De Cort, S.; Stokbroekx, S.; Leemans, R.; Brewster, M.E.; Xu, D.; Segmuller, B.; Turner, Y.T.A.; et al. Physicochemical properties of the amorphous drug, cast films, and spray dried powders to predict formulation probability of success for solid dispersions: Etravirine. J. Pharm. Sci. 2011, 100, 260–274. [Google Scholar] [CrossRef]
- Lauer, M.E.; Maurer, R.; De Paepe, A.T.; Stillhart, C.; Jacob, L.; James, R.; Kojima, Y.; Rietmann, R.; Kissling, T.; Van den Ende, J.A.; et al. A Miniaturized Extruder to Prototype Amorphous Solid Dispersions: Selection of Plasticizers for Hot Melt Extrusion. Pharmaceutics 2018, 10, 58. [Google Scholar] [CrossRef]
- Shadambikar, G.; Kipping, T.; Di-Gallo, N.; Elia, A.-G.; Knüttel, A.-N.; Treffer, D.; Repka, M.A.A. Vacuum Compression Molding as a Screening Tool to Investigate Carrier Suitability for Hot-Melt Extrusion Formulations. Pharmaceutics 2020, 12, 1019. [Google Scholar] [CrossRef]
- Treffer, D.; Troiss, A.; Khinast, J. A novel tool to standardize rheology testing of molten polymers for pharmaceutical applications. Int. J. Pharm. 2015, 495, 474–481. [Google Scholar] [CrossRef] [PubMed]
- Cossé, A.; König, C.; Lamprecht, A.; Wagner, K.G. Hot Melt Extrusion for Sustained Protein Release: Matrix Erosion and In Vitro Release of PLGA-Based Implants. AAPS PharmSciTech 2017, 18, 15–26. [Google Scholar] [CrossRef] [PubMed]
- Agrawal, A.M.; Dudhedia, M.S.; Patel, A.D.; Raikes, M.S. Characterization and performance assessment of solid dispersions prepared by hot melt extrusion and spray drying process. Int. J. Pharm. 2013, 457, 71–81. [Google Scholar] [CrossRef] [PubMed]
- Sakai, T.; Thommes, M. Investigation into mixing capability and solid dispersion preparation using the DSM Xplore Pharma Micro Extruder. J. Pharm. Pharmacol. 2013, 66, 218–231. [Google Scholar] [CrossRef] [PubMed]
- Dedroog, S.; Huygens, C.; Van den Mooter, G. Chemically identical but physically different: A comparison of spray drying, hot melt extrusion and cryo-milling for the formulation of high drug loaded amorphous solid dispersions of naproxen. Eur. J. Pharm. Biopharm. 2019, 135, 1–12. [Google Scholar] [CrossRef]
- Arnfast, L.; van Renterghem, J.; Aho, J.; Bøtker, J.; Raijada, D.; Baldursdóttir, S.; De Beer, T.; Rantanen, J. Exploring the Complexity of Processing-Induced Dehydration during Hot Melt Extrusion Using In-Line Raman Spectroscopy. Pharmaceutics 2020, 12, 116. [Google Scholar] [CrossRef]
- Bhardwaj, V.; Trasi, N.S.; Zemlyanov, D.Y.; Taylor, L.S. Surface area normalized dissolution to study differences in itraconazole-copovidone solid dispersions prepared by spray-drying and hot melt extrusion. Int. J. Pharm. 2018, 540, 106–119. [Google Scholar] [CrossRef]
- Wilson, M.R.; Jones, D.S.; Andrews, G.P. The development of sustained release drug delivery platforms using melt-extruded cellulose-based polymer blends. J. Pharm. Pharmacol. 2016, 69, 32–42. [Google Scholar] [CrossRef]
- Guns, S.; Mathot, V.; Martens, J.A.; Van den Mooter, G. Upscaling of the hot-melt extrusion process: Comparison between laboratory scale and pilot scale production of solid dispersions with miconazole and Kollicoat® IR. Eur. J. Pharm. Biopharm. 2012, 81, 674–682. [Google Scholar] [CrossRef]
- Amidon, G.L.; Lennernäs, H.; Shah, V.P.; Crison, J.R. A theoretical basis for a biopharmaceutic drug classification: The correlation of in vitro drug product dissolution and in vivo bioavailability. Pharm. Res. 1995, 12, 413–420. [Google Scholar] [CrossRef]
- Matecka, D. NDA 22-417 [NORVIR® (ritonavir) Tablets, 100 mg]. In CDER; FDA: Silver Spring, MD, USA, 2010. [Google Scholar]
- Baird, J.A.; Van Eerdenbrugh, B.; Taylor, L.S. A Classification System to Assess the Crystallization Tendency of Organic Molecules from Undercooled Melts. J. Pharm. Sci. 2010, 99, 3787–3806. [Google Scholar] [CrossRef] [PubMed]
- Papich, M.G.; Martinez, M.N. Applying Biopharmaceutical Classification System (BCS) Criteria to Predict Oral Absorption of Drugs in Dogs: Challenges and Pitfalls. AAPS J. 2015, 17, 948–964. [Google Scholar] [CrossRef]
- Piroxicam. Available online: https://pubchem.ncbi.nlm.nih.gov/compound/Piroxicam (accessed on 22 November 2022).
- Phenytoin. Available online: https://pubchem.ncbi.nlm.nih.gov/compound/Phenytoin (accessed on 22 November 2022).
- Berton, I.; Castellani, R.; Sardo, L.; Valette, R.; Vergnes, B. Theoretical and experimental study of the flow of a molten polymer in a micro compounder. Polym. Eng. Sci. 2021, 61, 3135–3146. [Google Scholar] [CrossRef]
- Vergnes, B. Average Shear Rates in the Screw Elements of a Corotating Twin-Screw Extruder. Polymers 2021, 13, 304. [Google Scholar] [CrossRef] [PubMed]
- Newman, J.A.; Schmitt, P.D.; Toth, S.J.; Deng, F.; Zhang, S.; Simpson, G.J. Parts per Million Powder X-ray Diffraction. Anal. Chem. 2015, 87, 10950–10955. [Google Scholar] [CrossRef] [PubMed]
- Moseson, D.E.; Jordan, M.A.; Shah, D.D.; Corum, I.D.; Alvarenga, B.R., Jr.; Taylor, L.S. Application and limitations of thermogravimetric analysis to delineate the hot melt extrusion chemical stability processing window. Int. J. Pharm. 2020, 590, 119916. [Google Scholar] [CrossRef]
- Sheth, A.R.; Lubach, J.W.; Munson, E.J.; Muller, F.X.; Grant, D.J.W. Mechanochromism of Piroxicam Accompanied by Intermolecular Proton Transfer Probed by Spectroscopic Methods and Solid-Phase Changes. J. Am. Chem. Soc. 2005, 127, 6641–6651. [Google Scholar] [CrossRef]
- Kollidon® VA 64: Optimized Copovidone for HME. Available online: https://pharma.basf.com/files/one-page-promotions/optimized-for-hot-melt-extrusion-kollidon.pdf (accessed on 22 November 2022).
- Auch, C.; Harms, M.; Mäder, K. How changes in molecular weight and PDI of a polymer in amorphous solid dispersions impact dissolution performance. Int. J. Pharm. 2019, 556, 372–382. [Google Scholar] [CrossRef]
- Anderson, M.; Pluntze, A. Impacts of polymer thermal degradation on in vitro performance of amorphous solid dispersions [Poster]. In AAPS PharmSci 360; AAPS: Boston, MA, USA, 2022. [Google Scholar]
- Alvarenga, B.R.D.; Moseson, D.E.; Carneiro, R.L.; Taylor, L.S. Impact of Polymer Type on Thermal Degradation of Amorphous Solid Dispersions Containing Ritonavir. Mol. Pharm. 2022, 19, 332–344. [Google Scholar] [CrossRef]
- Huang, S.; O’Donnell, K.P.; de Vaux, S.M.D.; O’Brien, J.; Stutzman, J.; Williams, R.O. Processing thermally labile drugs by hot-melt extrusion: The lesson with gliclazide. Eur. J. Pharm. Biopharm. 2017, 119, 56–67. [Google Scholar] [CrossRef]
- Chmiel, K.; Knapik-Kowalczuk, J.; Paluch, M. How does the high pressure affects the solubility of the drug within the polymer matrix in solid dispersion systems. Eur. J. Pharm. Biopharm. 2019, 143, 8–17. [Google Scholar] [CrossRef] [PubMed]
- Wu, C.-J.; You, J.-Z.; Wang, X.-J. Thermal decomposition mechanism of piroxicam. J. Therm. Anal. Calorim. 2018, 134, 2041–2048. [Google Scholar] [CrossRef]
- Schlindwein, W.; Bezerra, M.; Almeida, J.; Berghaus, A.; Owen, M.; Muirhead, G. In-Line UV-Vis Spectroscopy as a Fast-Working Process Analytical Technology (PAT) during Early Phase Product Development Using Hot Melt Extrusion (HME). Pharmaceutics 2018, 10, 166. [Google Scholar] [CrossRef] [PubMed]
- Wang, Y.; Abrahamsson, B.; Lindfors, L.; Brasseur, J.G. Comparison and Analysis of Theoretical Models for Diffusion-Controlled Dissolution. Mol. Pharm. 2012, 9, 1052–1066. [Google Scholar] [CrossRef]


| Category | Description | Material Needs | Uses In-Going API Form | HME Relevant Time at Temperature | Applies Mixing or Shear | Ability to Assess Process-Relevant Degradation |
|---|---|---|---|---|---|---|
| Modeling | Flory Huggins, PC-SAFT, solubility parameters, etc. | None-mg | Yes 1 | No | No | No |
| Analytical | DSC | mg | Yes | No 2 | No | No 4 |
| Thermal microscopy | mg | Yes | No 2 | No | No 4 | |
| Rheology | mg—g | Yes | No 2 | Yes 3 | No 4 | |
| Film casting | mg—g | No | No | No | No | |
| Devices | Miniaturized extruder prototype | mg | No | No | Partially | No |
| Vacuum compression molding | mg—g | No | No | No | No | |
| Micro compounders | g | Yes | Yes | Yes | Yes | |
| Small-scale extruders | g | Yes | Yes | Yes | Yes |
| Compound | Structure | BCS Class | Tm (°C) |
|---|---|---|---|
| Ritonavir (RTV) | 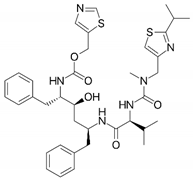 | IV [51] | 126 [52] |
| Piroxicam (PXCM) |  | II [53] | 198–200 [54] |
| Phenytoin (PHY) | 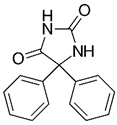 | II [53] | 295–298 [55] |
| Processing Round | API | Temperature (°C) | API in Ingoing Physical Mixture (wt%) | |
|---|---|---|---|---|
| MiniMixer | Micro Compounder | |||
| 1 | RTV | 150 | 50 | 50 |
| 2 | 140 | 50 | 50 | |
| 2 | 160 | 50 | 50 | |
| 1 | PXCM | 150 | 20 | 20, 25, 30 |
| 2 | 130 | 20 | 20 | |
| 2 | 170 | 20 | 20 | |
| 1 | PHY | 215 | 25 1, 35 1 | 25, 30, 35 |
| 2 | 200 | 25 | 25 | |
| 2 | 230 | 25 | 25 | |
| API | API in Ingoing Physical Mixture (wt%) | Temperature (°C) | Time (h) |
|---|---|---|---|
| RTV | 50 | 150 | 0.08, 025, 0.5 1, 2, 4 |
| PXCM | 25 | 150 | |
| PHY | 35 | 215 |
| Time (Min) | Mobile Phase A (%) | Mobile Phase B (%) |
|---|---|---|
| 0 | 75 | 25 |
| 10 | 75 | 25 |
| 30 | 25 | 75 |
| 40 | 25 | 75 |
| 40.01 | 75 | 25 |
| 45 | 75 | 25 |
| 0 | 75 | 25 |
| RTV | PXCM | PHY | |||||
|---|---|---|---|---|---|---|---|
| TGA | Visual | TGA | Visual | TGA | Visual | ||
| Limiting Temperature (°C) | API | 140 * | 160 * | 190 | 180 | 240 | >220 |
| Mixture | 150 | 160 | 170 * | 130 * | 230 * | 200 * | |
| PVP-VA64 | 230 | 200 | 230 | 200 | 230 | 200 | |
| Maximum processing temperature (°C) | 150 | 150 | 215 | ||||
| Degradation-limiting component | API | Mixture | Mixture | ||||
| API | Temperature (°C) | MiniMixer | Micro Compounder |
|---|---|---|---|
| RTV | 150 | ≥50 | ≥50 |
| PXCM | 150 | 22.1 ± 0.3 | 24.4 ± 0.2 (25 wt% sample) |
| 27.6 ± 0.4 (30 wt% sample) | |||
| PHY | 215 | 29 ± 1 | 30.8 ± 0.7 (35 wt% sample) |
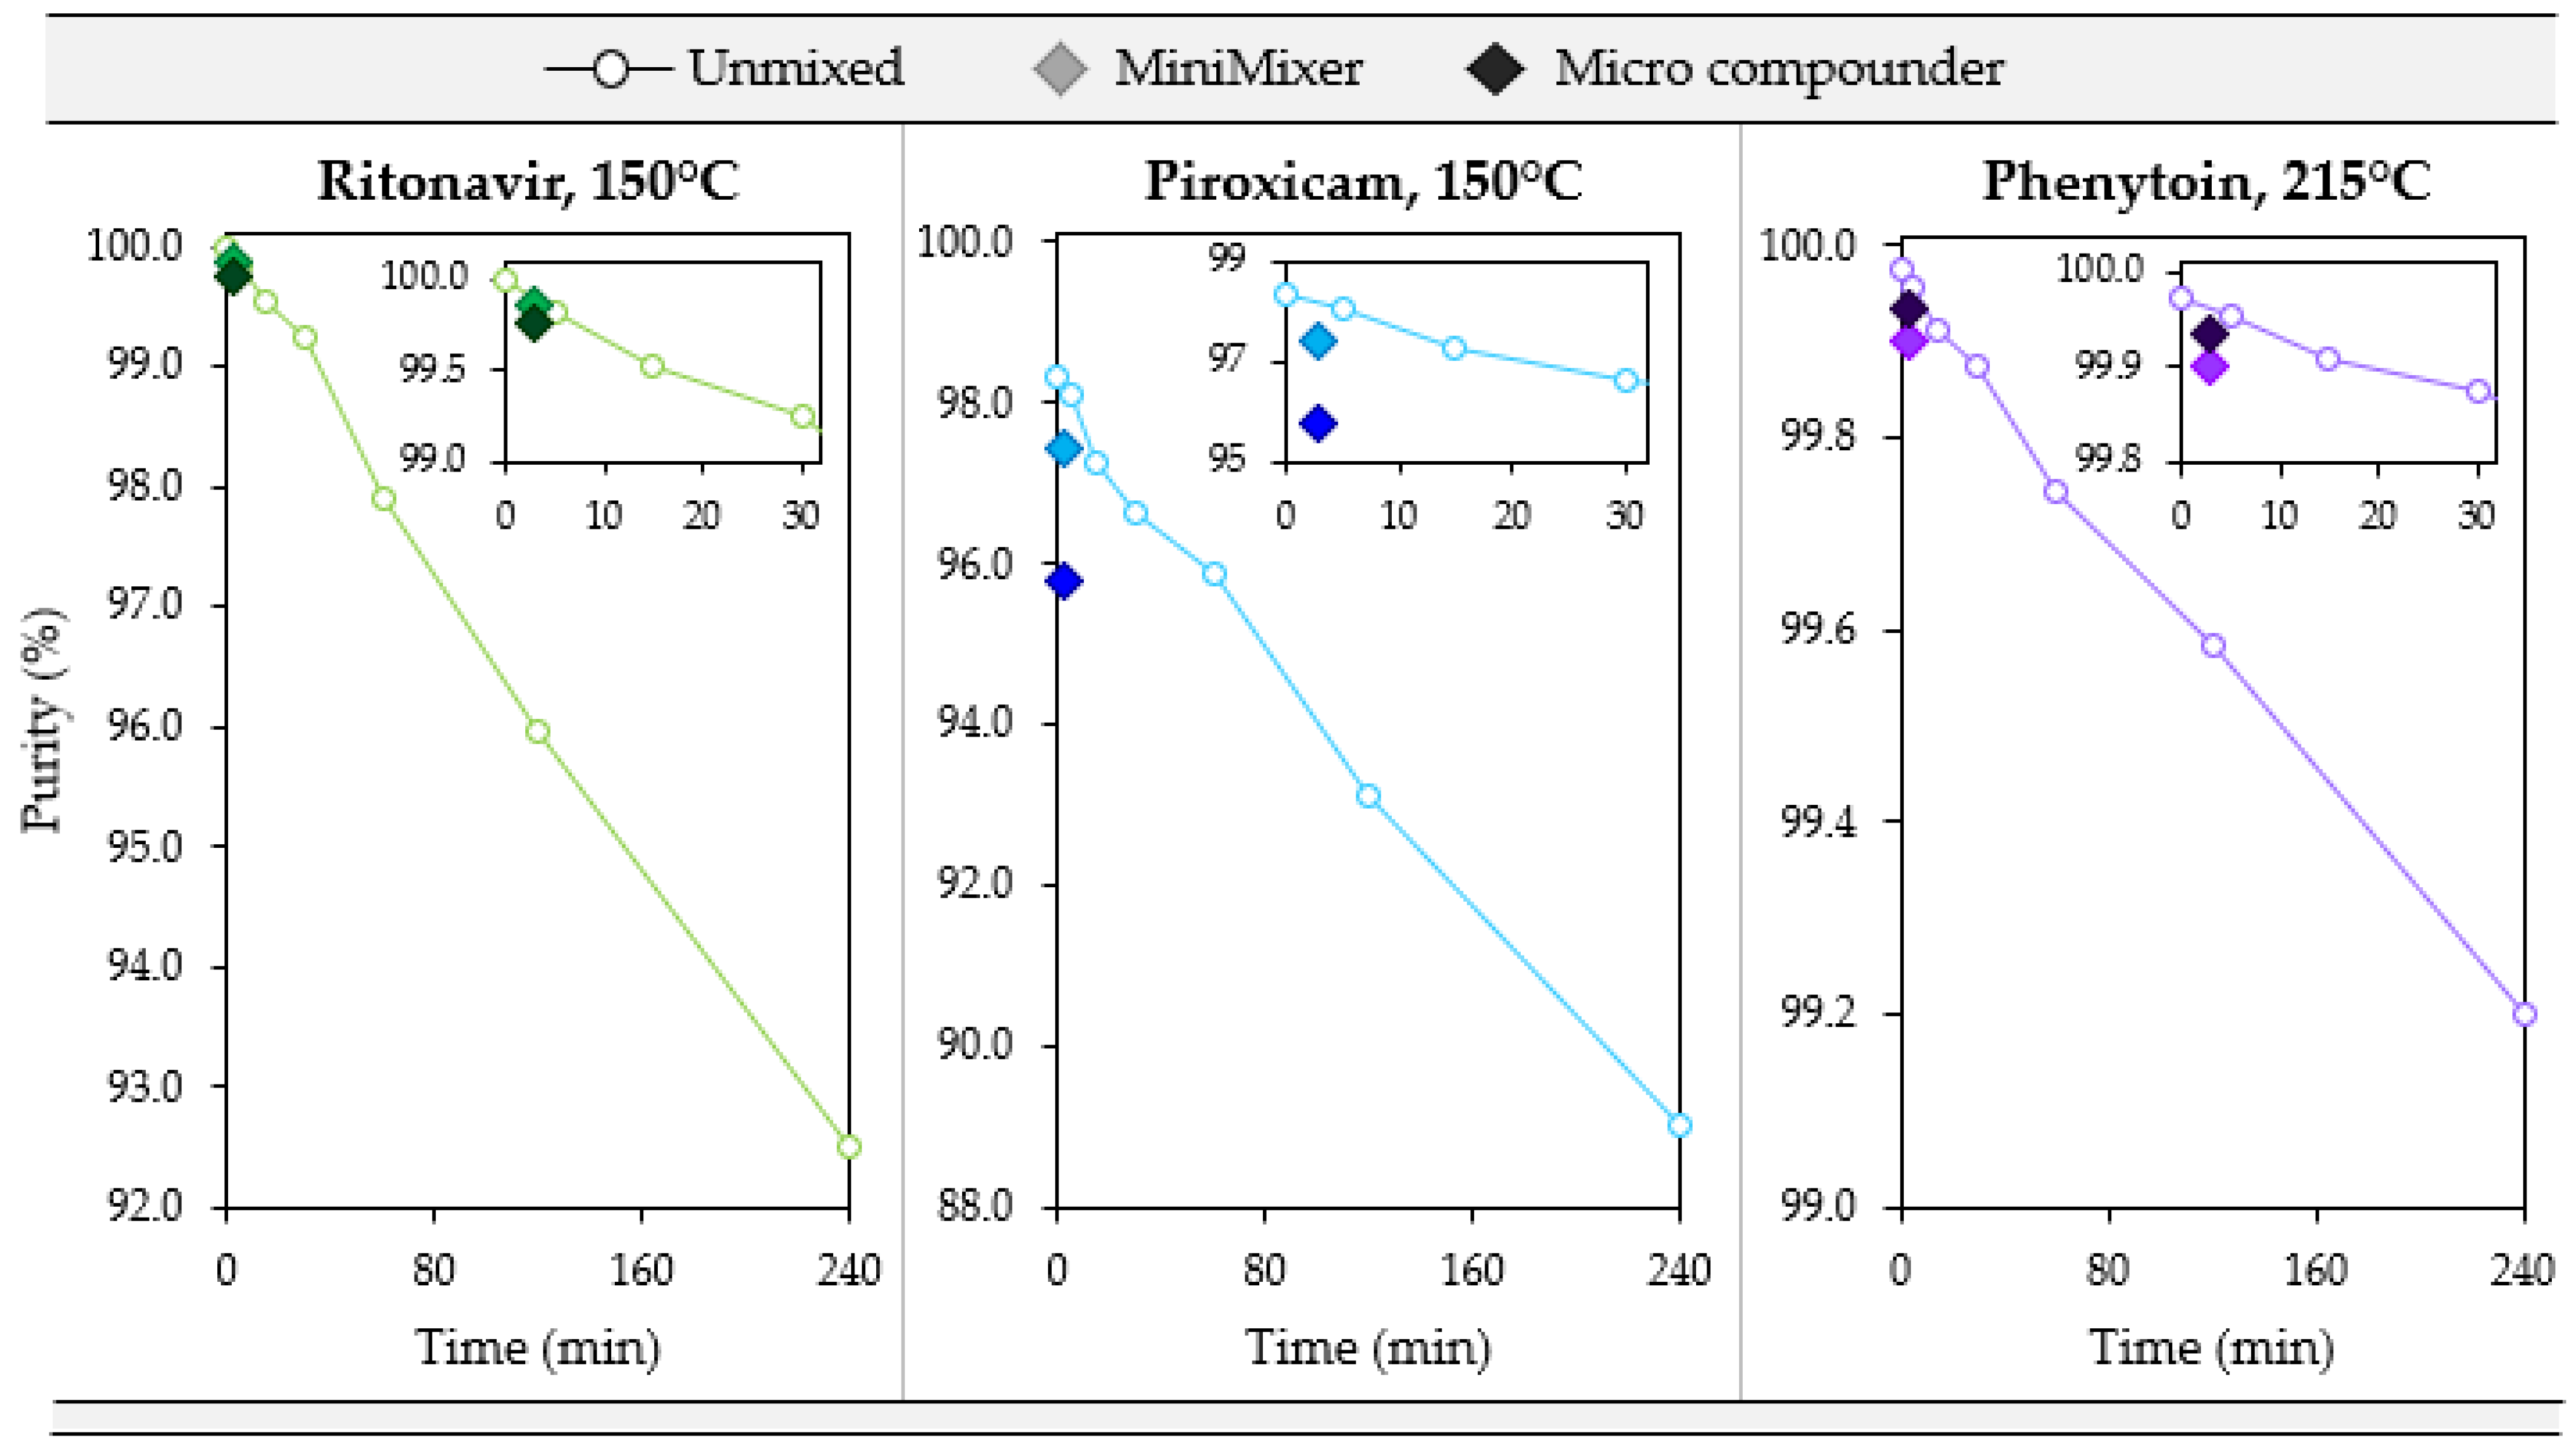
| API (Starting Purity) | Processing Temperature (°C) | API Purity (3 min) | % Error w.r.t. Micro Compounder | |||
|---|---|---|---|---|---|---|
| Micro Compounder | MiniMixer | Unmixed | MiniMixer | Unmixed | ||
| RTV(100) | 140 | 99.89 | 99.93 | — | +0.04 | — |
| 150 | 99.76 | 99.87 | 99.89 | +0.11 | +0.13 | |
| 160 | 99.40 | 99.68 | — | +0.28 | — | |
| PXCM(98.4) | 130 | 97.53 | 98.22 | — | +0.71 | — |
| 150 | 95.78 | 97.44 | 97.94 | +1.7 | +2.3 | |
| 170 | 88.28 | 94.00 | — | +6.5 | — | |
| PHY(99.97) | 200 | 99.94 | 99.92 | — | −0.02 | — |
| 215 | 99.94 | 99.90 | 99.95 | −0.04 | +0.02 | |
| 230 | 99.94 | 99.87 | — | −0.07 | — | |
Disclaimer/Publisher’s Note: The statements, opinions and data contained in all publications are solely those of the individual author(s) and contributor(s) and not of MDPI and/or the editor(s). MDPI and/or the editor(s) disclaim responsibility for any injury to people or property resulting from any ideas, methods, instructions or products referred to in the content. |
© 2024 by the authors. Licensee MDPI, Basel, Switzerland. This article is an open access article distributed under the terms and conditions of the Creative Commons Attribution (CC BY) license (https://creativecommons.org/licenses/by/4.0/).
Share and Cite
Pluntze, A.; Beecher, S.; Anderson, M.; Wright, D.; Mudie, D. Material-Sparing Feasibility Screening for Hot Melt Extrusion. Pharmaceutics 2024, 16, 76. https://doi.org/10.3390/pharmaceutics16010076
Pluntze A, Beecher S, Anderson M, Wright D, Mudie D. Material-Sparing Feasibility Screening for Hot Melt Extrusion. Pharmaceutics. 2024; 16(1):76. https://doi.org/10.3390/pharmaceutics16010076
Chicago/Turabian StylePluntze, Amanda, Scott Beecher, Maria Anderson, Dillon Wright, and Deanna Mudie. 2024. "Material-Sparing Feasibility Screening for Hot Melt Extrusion" Pharmaceutics 16, no. 1: 76. https://doi.org/10.3390/pharmaceutics16010076
APA StylePluntze, A., Beecher, S., Anderson, M., Wright, D., & Mudie, D. (2024). Material-Sparing Feasibility Screening for Hot Melt Extrusion. Pharmaceutics, 16(1), 76. https://doi.org/10.3390/pharmaceutics16010076