
Glial Fibrillary Acidic Protein: A Biomarker and Drug Target for Alzheimer’s Disease

 and
and 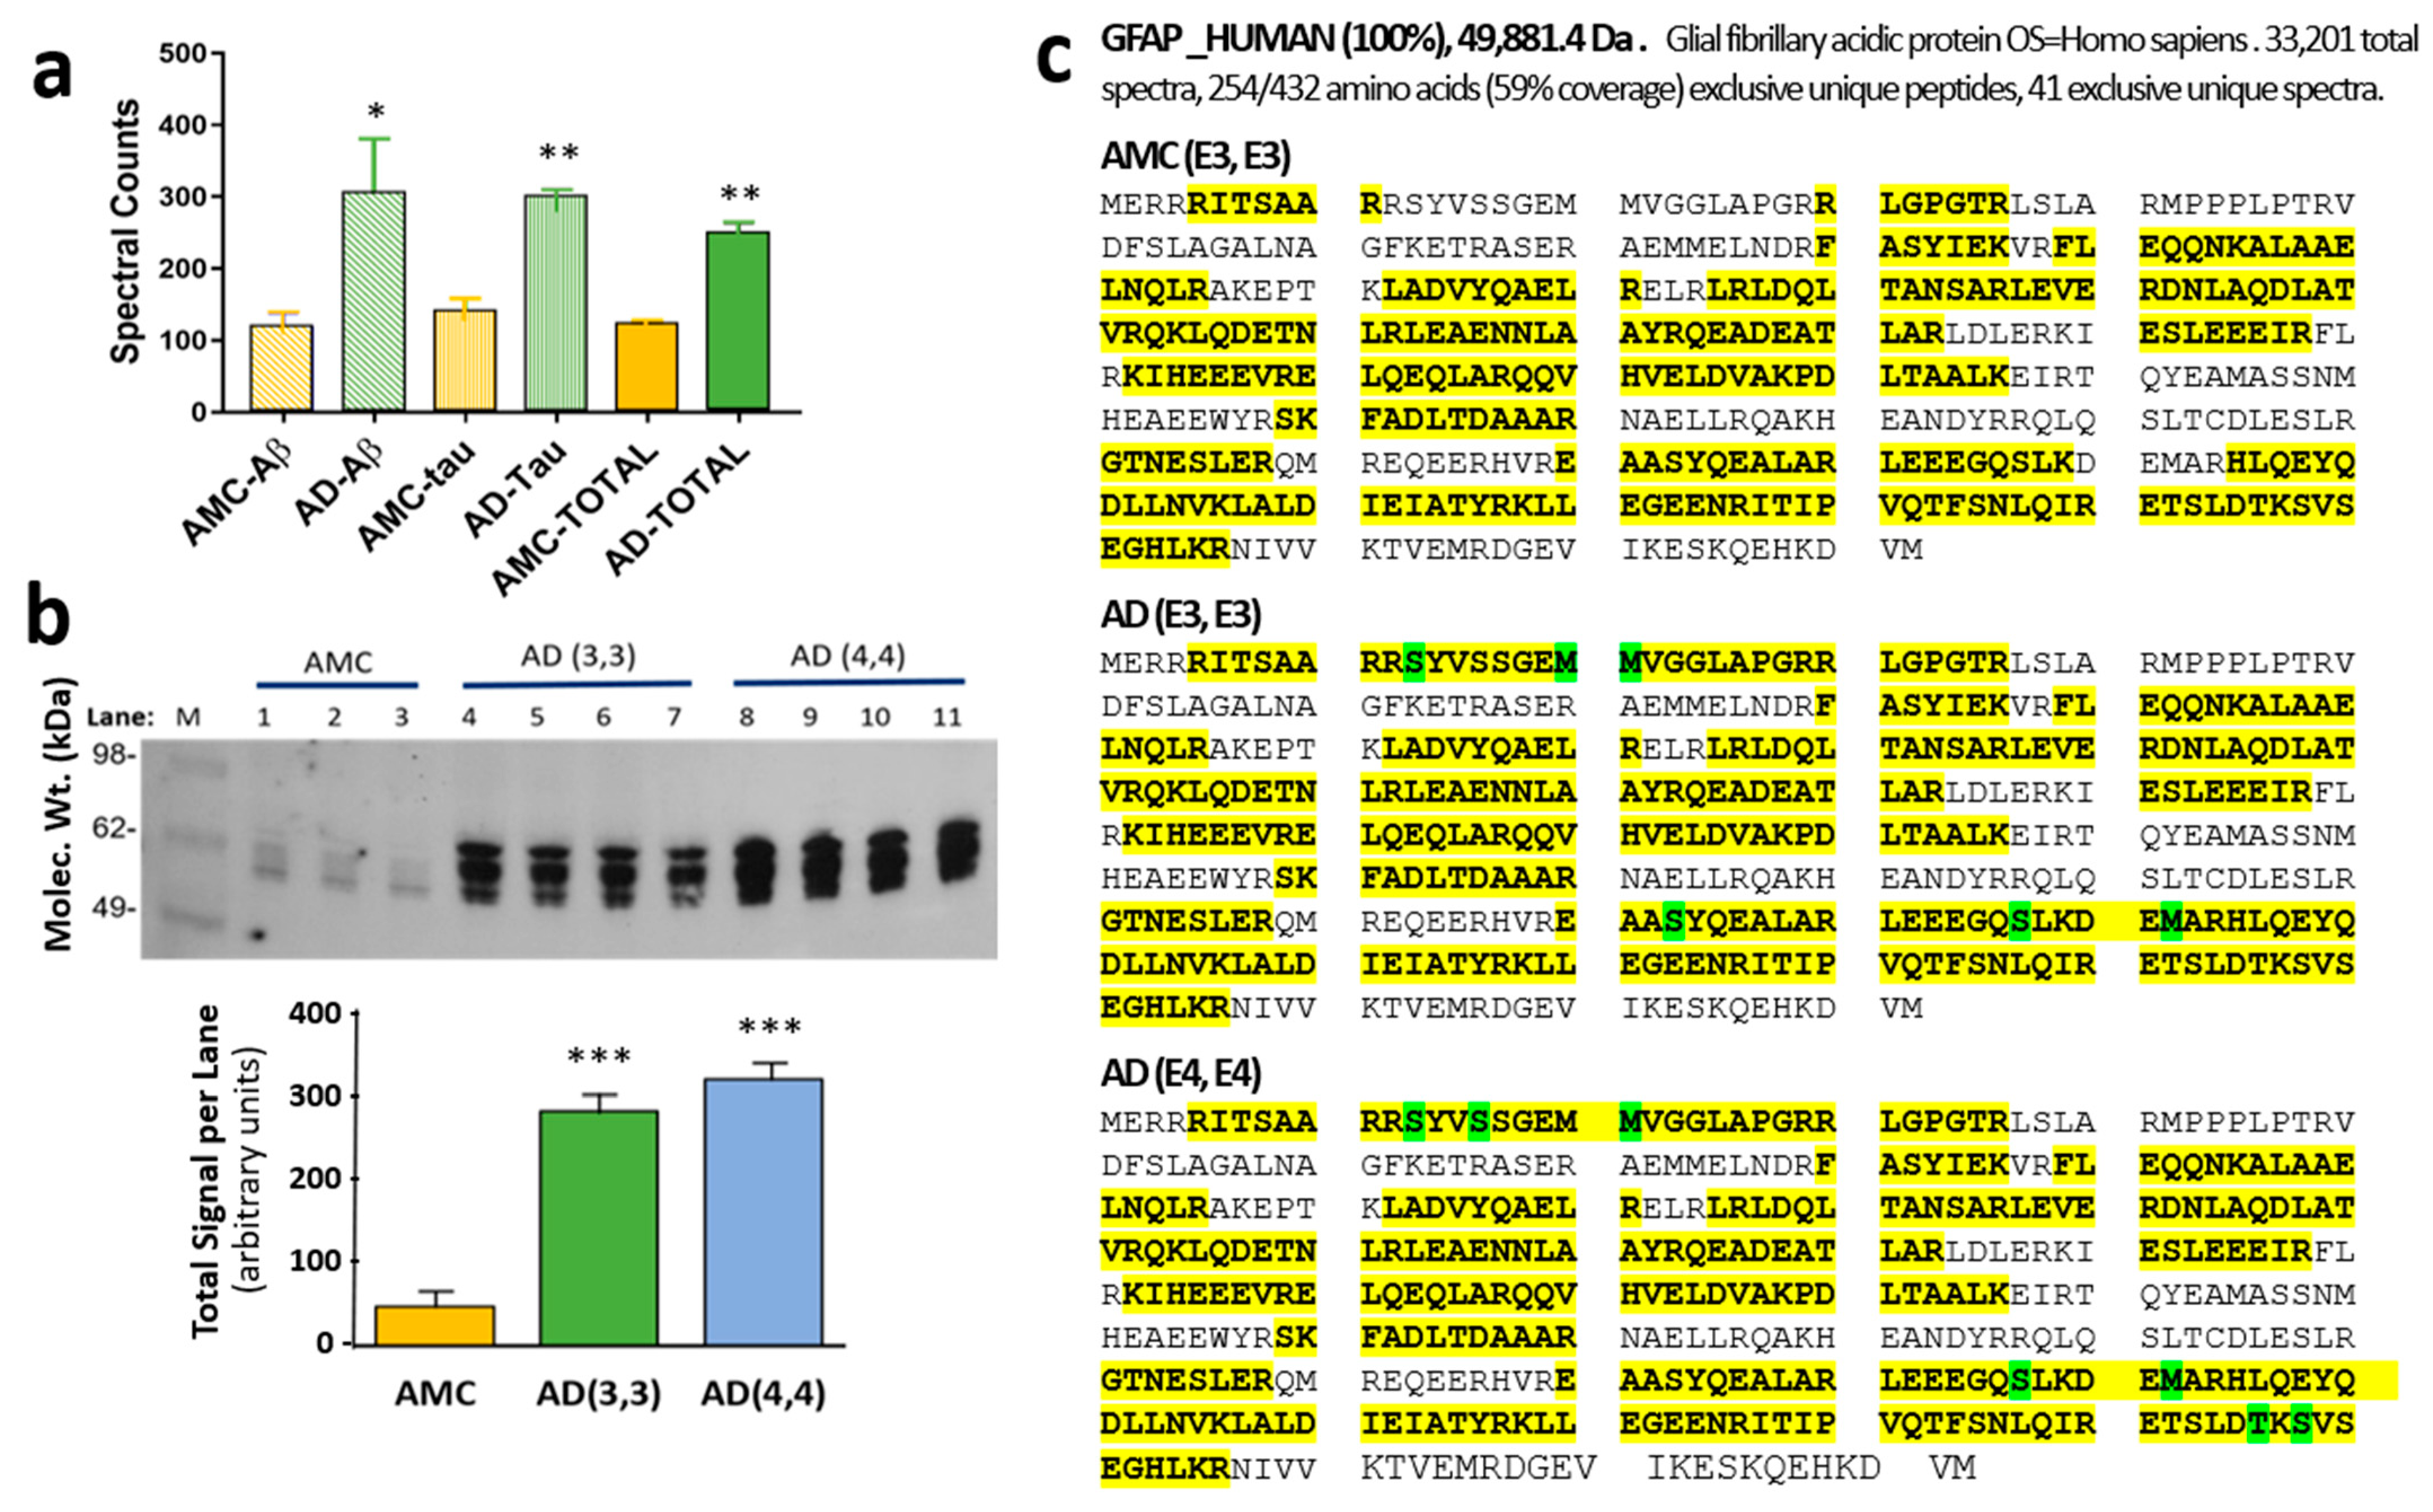
Abstract
1. Introduction
2. Methods
2.1. C. elegans Strains
2.2. Chemotaxis and Paralysis Assays in Aβ-Transgenic C. elegans Strains CL2355 and CL4176
2.3. Paralysis Assays in Human Tau-Expressing C. elegans Strain VH255
2.4. RNAi in C. elegans
2.5. siRNA Knockdowns and Thioflavin-T Staining of Human Cells
2.6. MSR1 Treatment of SH-SY5Y-APPSw Cells
2.7. Western-Blotting Analysis of Glial (T98G) Cells for pGFAP and ROCK1
2.8. Isolation of Aggregate Proteins
2.9. Modeling and MD Simulation of GFAP Structure
2.10. Virtual Screening of a Target Protein against Molecular Structure Libraries
2.11. Statistical Analyses
3. Results
3.1. Glial Fibrillary Acidic Protein Is Enriched, Hyperphosphorylated, and Oxidized in Aggregates Formed in Alzheimer’s Hippocampus
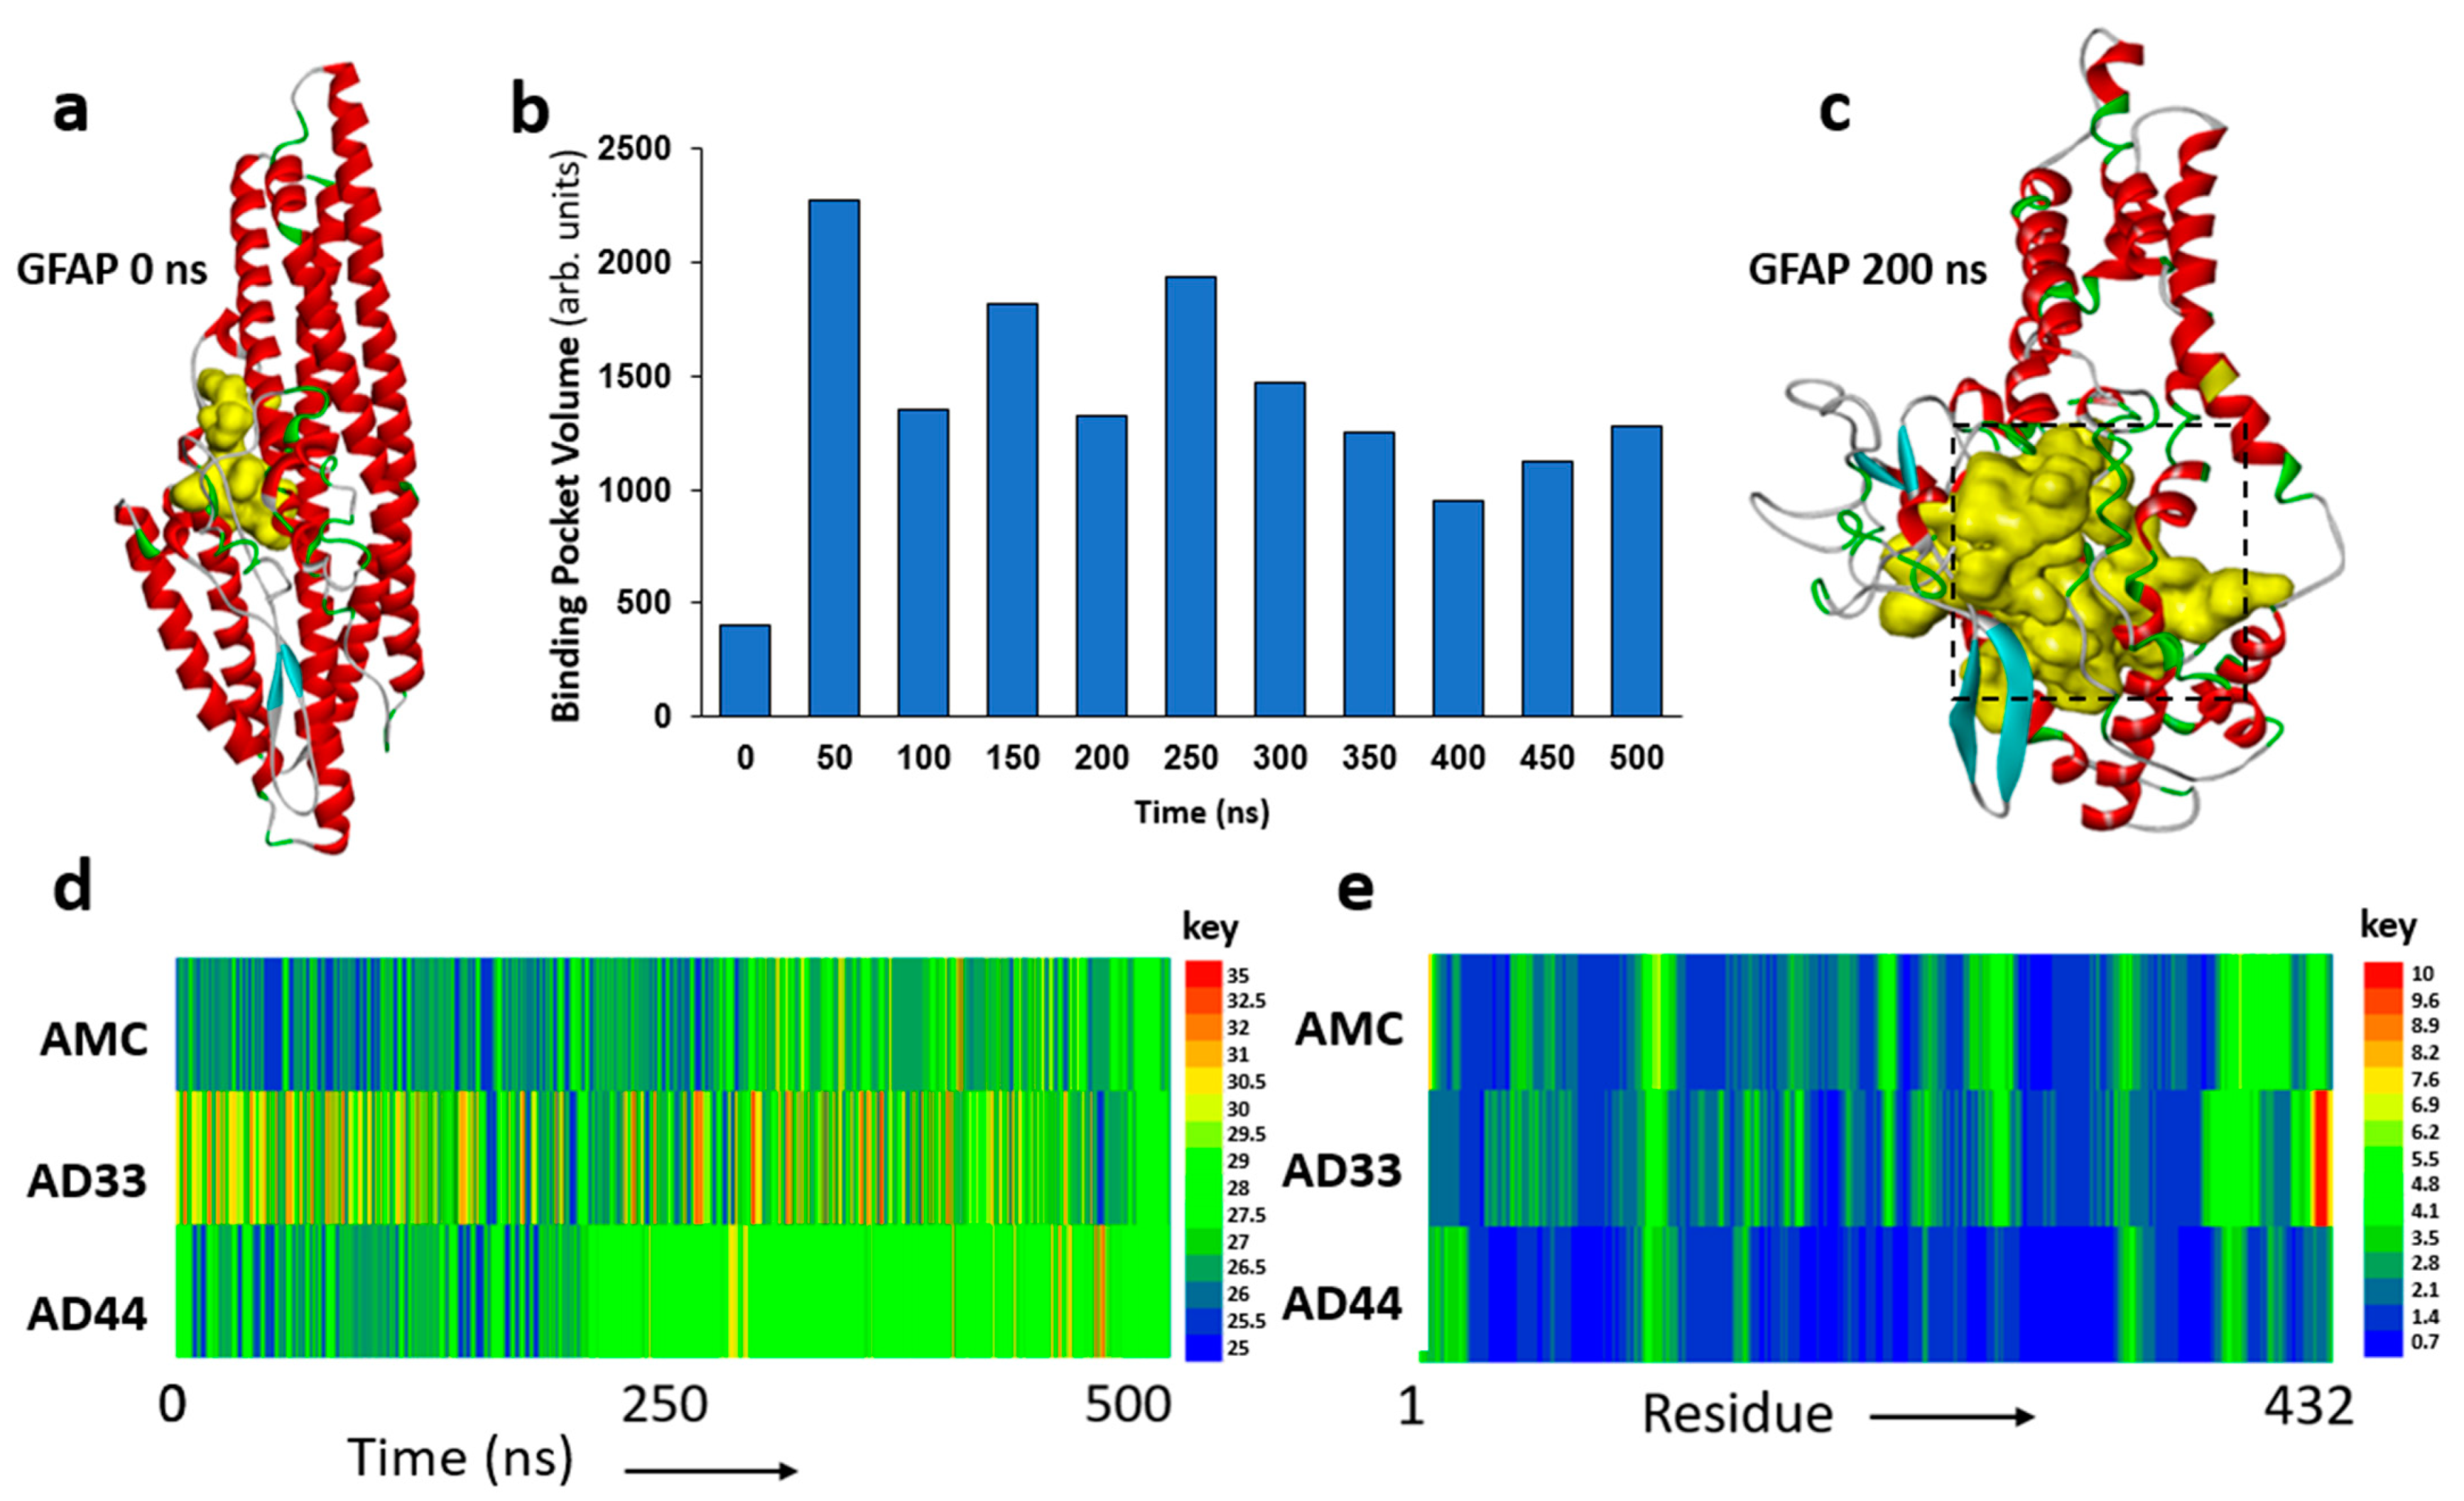
3.2. Molecular Dynamic Simulations Predict GFAP Unfolding and Identify a Druggable Pocket
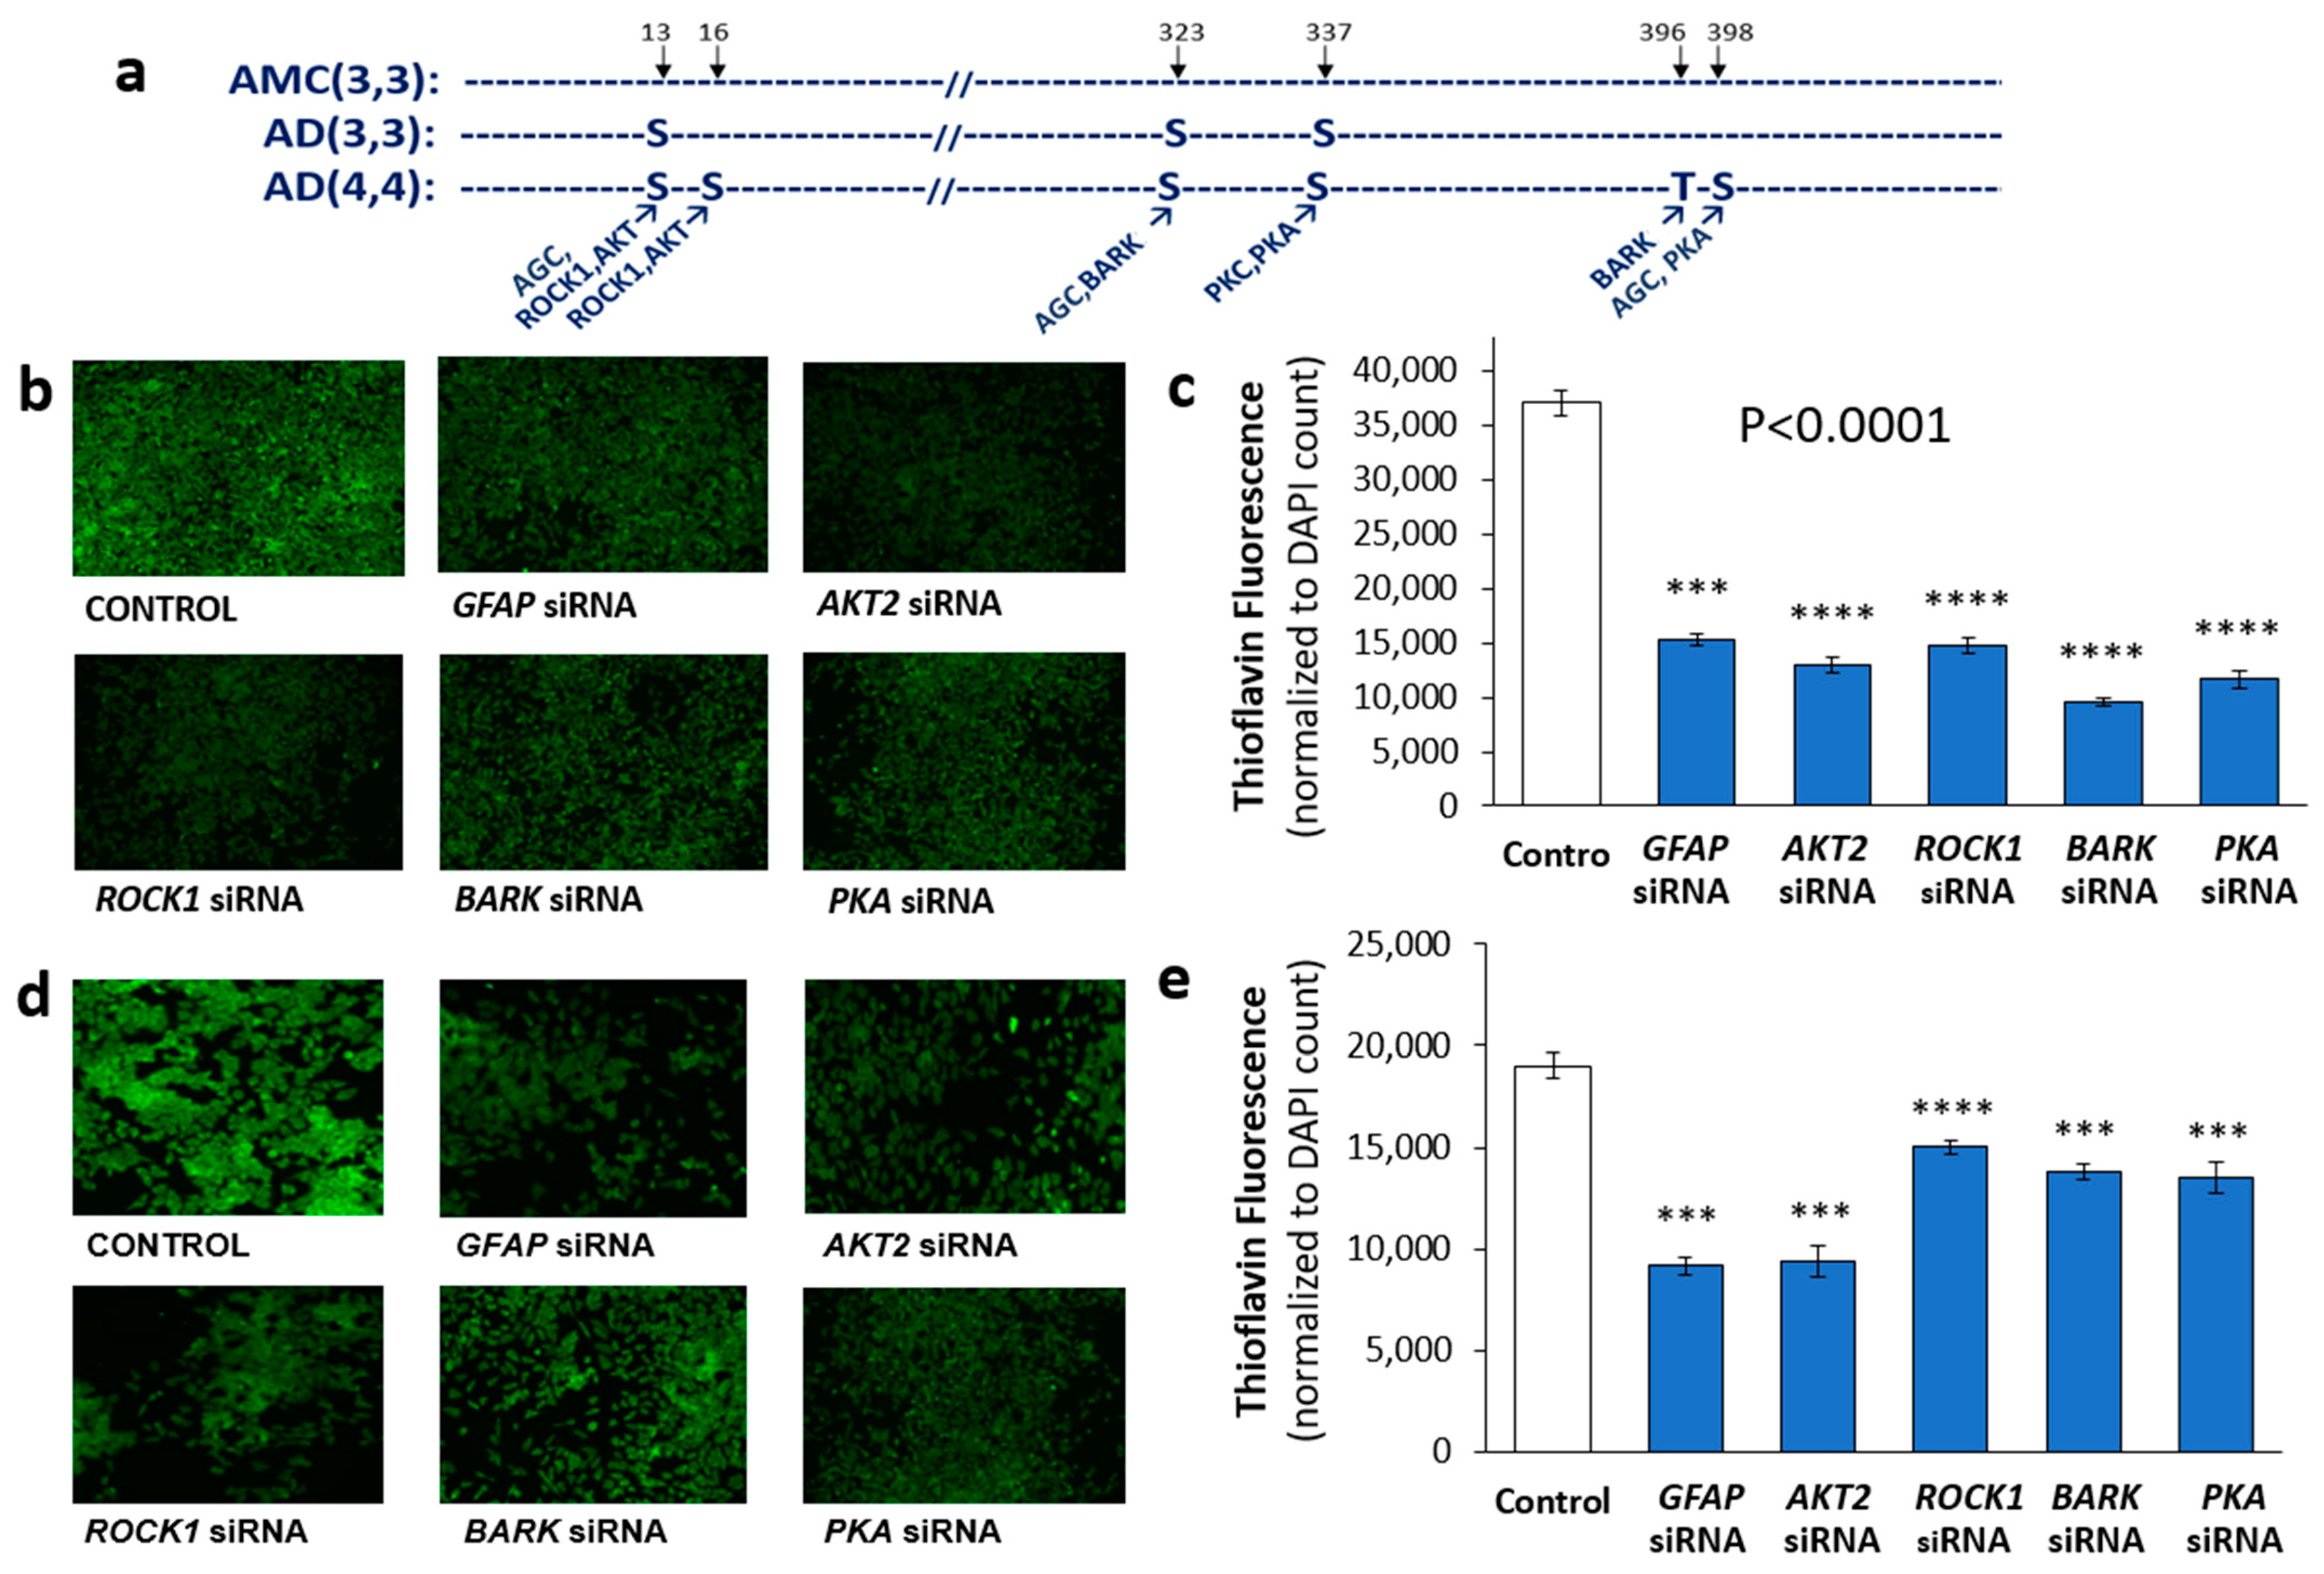
3.3. Identification of Potential Kinases Mediating GFAP Phosphorylation
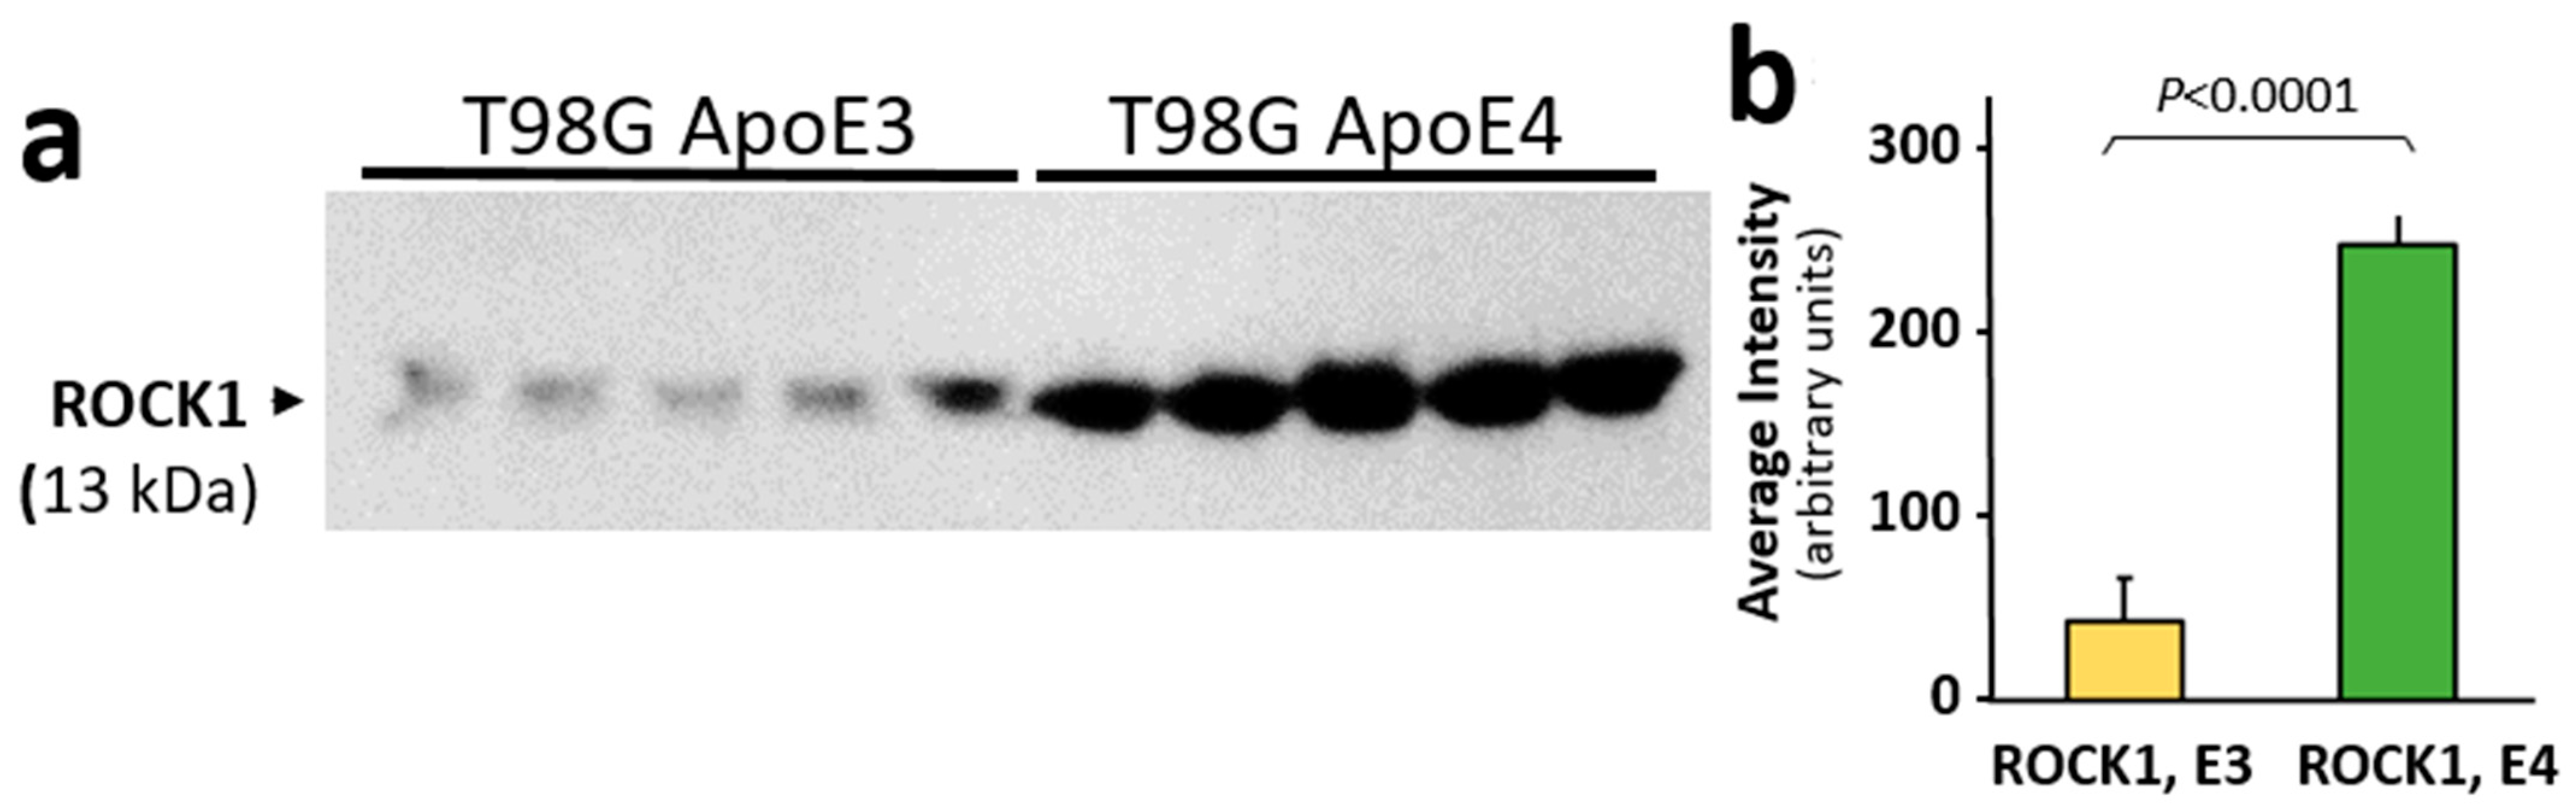
3.4. ROCK1 Is Increased in ApoE-Expressing Glioblastoma Cells
3.5. Computational Screening Identifies Novel Small Molecules Predicted to Bind Stably to GFAP
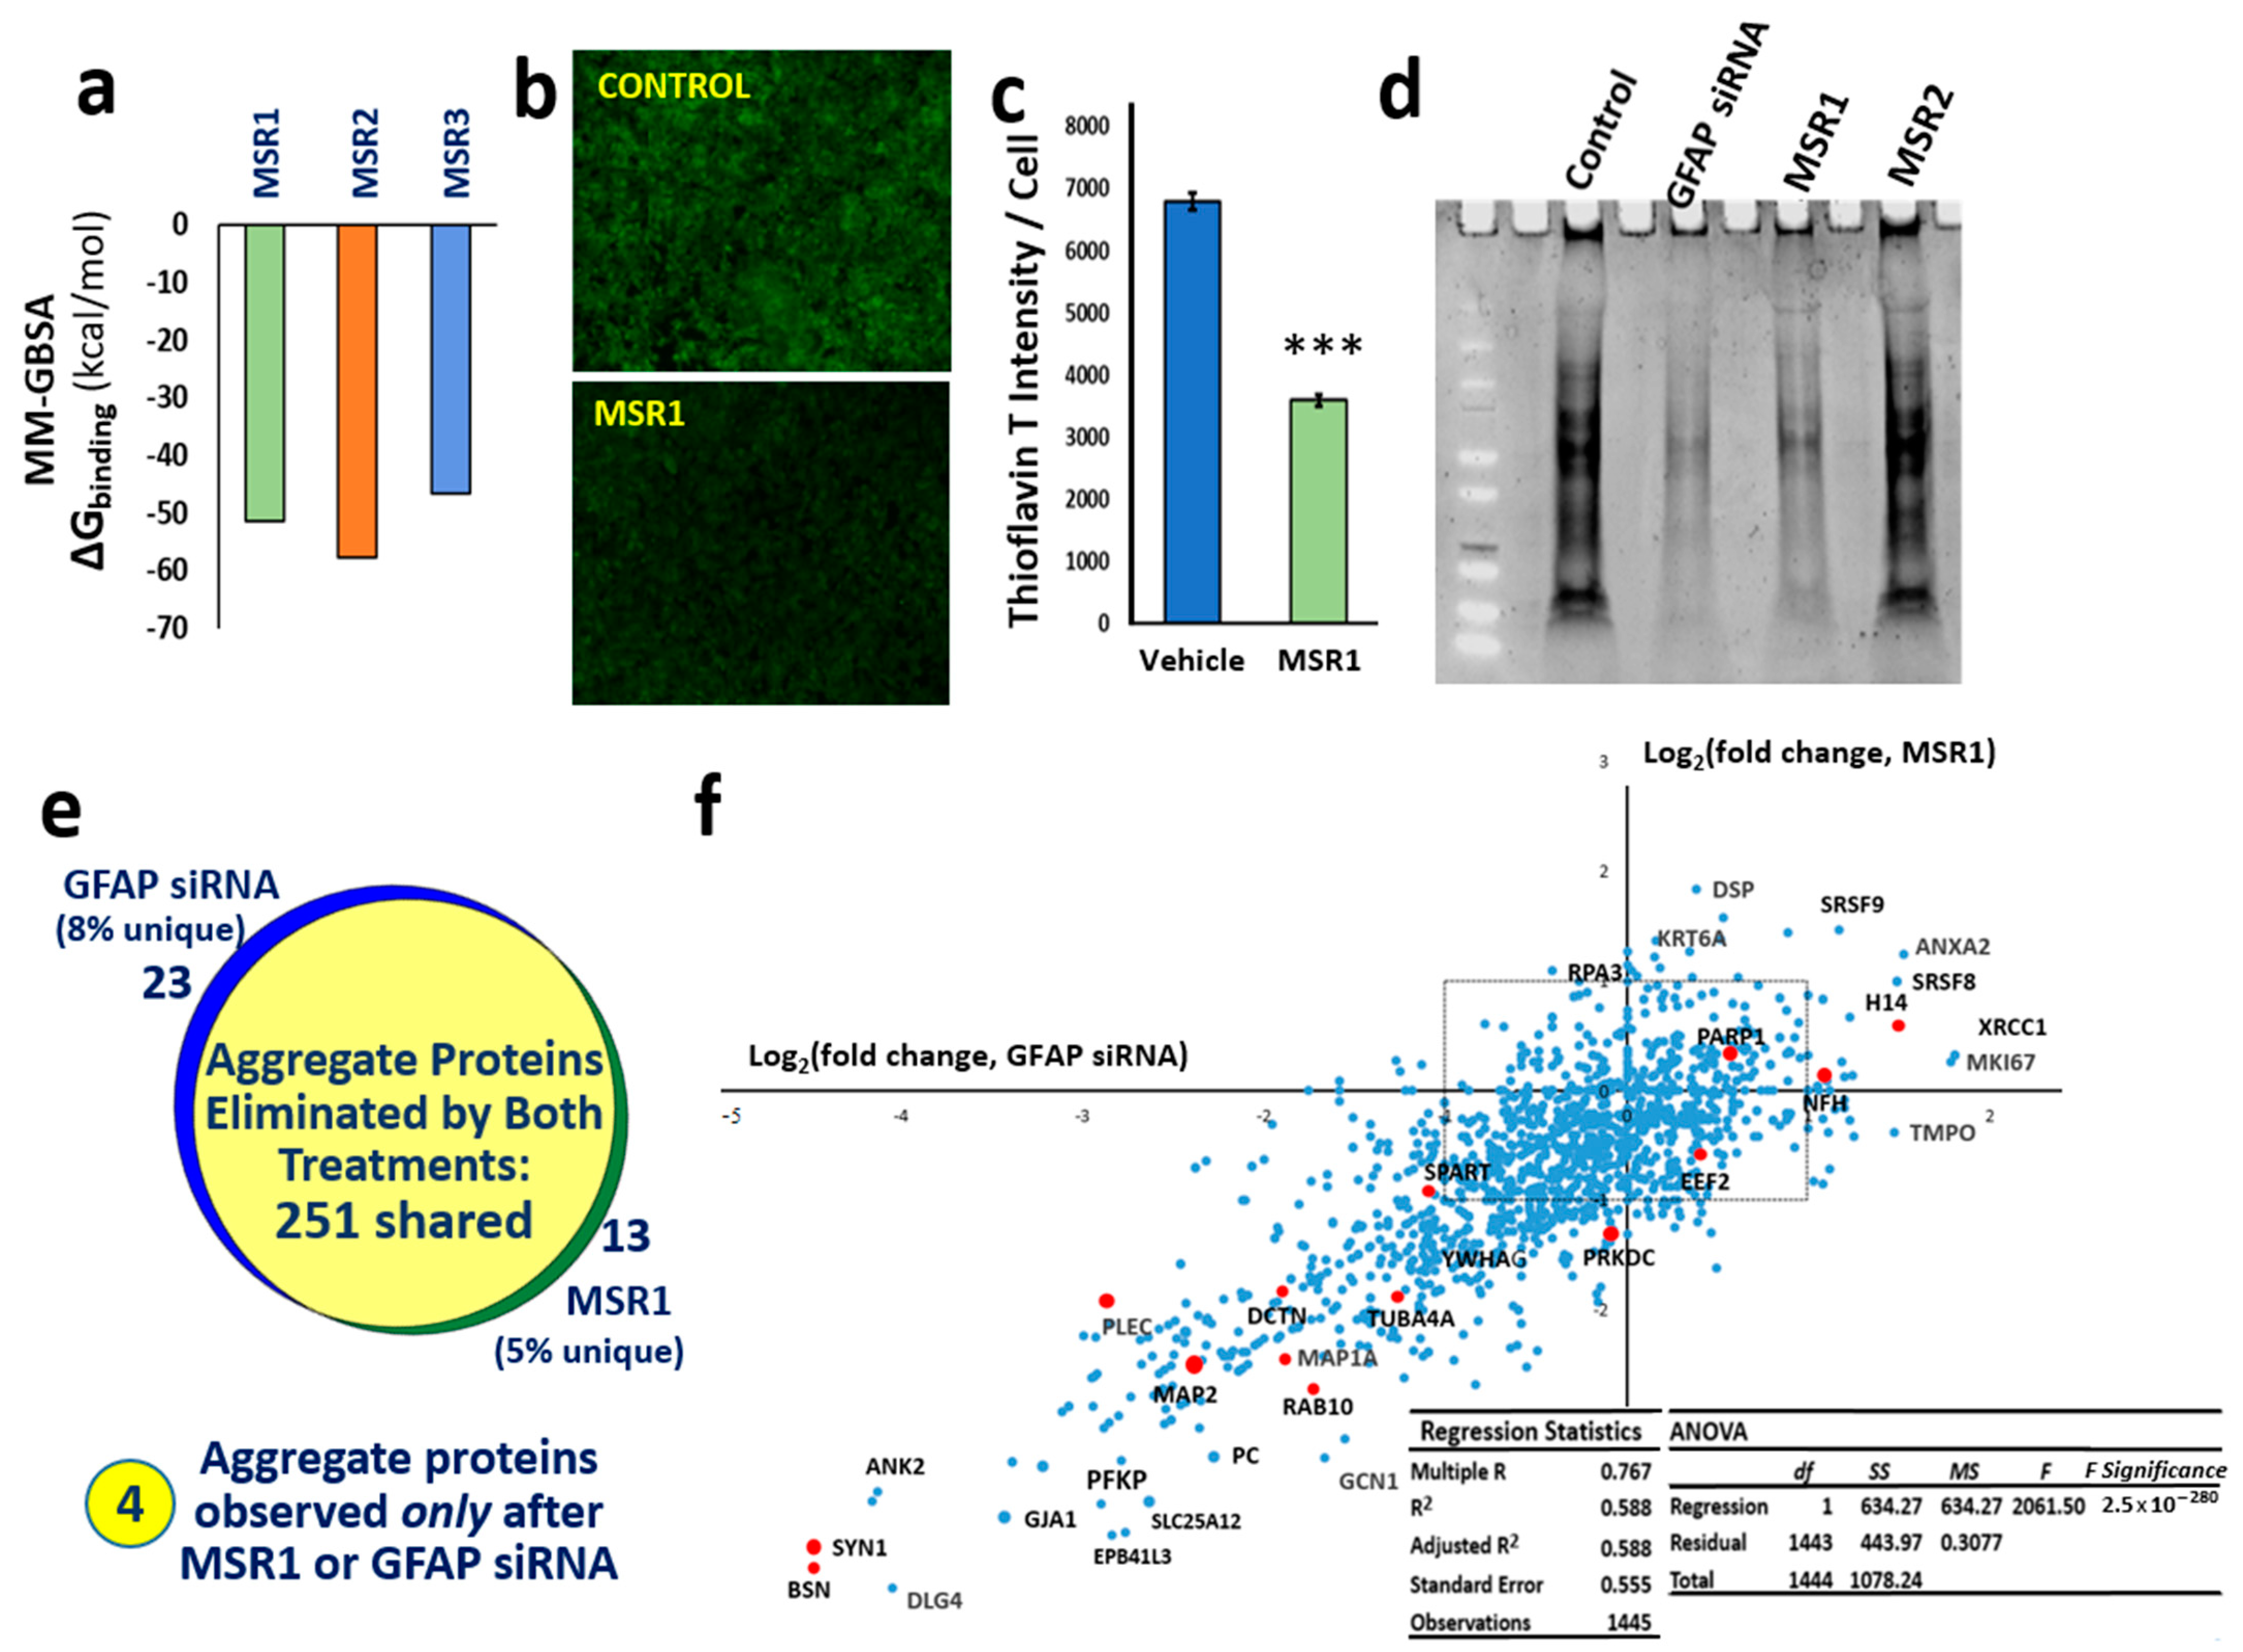
3.6. A Top-Ranked Drug Suppresses In Vitro and In Vivo Aggregation as Effectively as Knockdown of GFAP and Suppresses the Same Co-Aggregate Constituents
4. Discussion
5. Conclusions
Supplementary Materials
Author Contributions
Funding
Institutional Review Board Statement
Informed Consent Statement
Data Availability Statement
Acknowledgments
Conflicts of Interest
References
- Hol, E.M.; Capetanaki, Y. Type III Intermediate Filaments Desmin, Glial Fibrillary Acidic Protein (GFAP), Vimentin, and Peripherin. Cold Spring Harb. Perspect. Biol. 2017, 9, a021642. [Google Scholar] [CrossRef] [PubMed]
- Kamphuis, W.; Mamber, C.; Moeton, M.; Kooijman, L.; Sluijs, J.A.; Jansen, A.H.; Verveer, M.; de Groot, L.R.; Smith, V.D.; Rangarajan, S.; et al. GFAP isoforms in adult mouse brain with a focus on neurogenic astrocytes and reactive astrogliosis in mouse models of Alzheimer disease. PLoS ONE 2012, 7, e42823. [Google Scholar] [CrossRef] [PubMed]
- Lee, S.H.; Nam, T.S.; Kim, K.H.; Kim, J.H.; Yoon, W.; Heo, S.H.; Kim, M.J.; Shin, B.A.; Perng, M.D.; Choy, H.E.; et al. Aggregation-prone GFAP mutation in Alexander disease validated using a zebrafish model. BMC Neurol. 2017, 17, 175. [Google Scholar] [CrossRef] [PubMed]
- Martini, A.C.; Helman, A.M.; McCarty, K.L.; Lott, I.T.; Doran, E.; Schmitt, F.A.; Head, E. Distribution of microglial phenotypes as a function of age and Alzheimer’s disease neuropathology in the brains of people with Down syndrome. Alzheimers Dement. 2020, 12, e12113. [Google Scholar] [CrossRef]
- Bartl, M.; Dakna, M.; Galasko, D.; Hutten, S.J.; Foroud, T.; Quan, M.; Marek, K.; Siderowf, A.; Franz, J.; Trenkwalder, C.; et al. Biomarkers of neurodegeneration and glial activation validated in Alzheimer’s disease assessed in longitudinal cerebrospinal fluid samples of Parkinson’s disease. PLoS ONE 2021, 16, e0257372. [Google Scholar] [CrossRef]
- Schulz, I.; Kruse, N.; Gera, R.G.; Kremer, T.; Cedarbaum, J.; Barbour, R.; Zago, W.; Schade, S.; Otte, B.; Bartl, M.; et al. Systematic Assessment of 10 Biomarker Candidates Focusing on alpha-Synuclein-Related Disorders. Mov. Disord. 2021, 36, 2874–2887. [Google Scholar] [CrossRef] [PubMed]
- Ishiki, A.; Kamada, M.; Kawamura, Y.; Terao, C.; Shimoda, F.; Tomita, N.; Arai, H.; Furukawa, K. Glial fibrillar acidic protein in the cerebrospinal fluid of Alzheimer’s disease, dementia with Lewy bodies, and frontotemporal lobar degeneration. J. Neurochem. 2016, 136, 258–261. [Google Scholar] [CrossRef]
- Laping, N.J.; Teter, B.; Nichols, N.R.; Rozovsky, I.; Finch, C.E. Glial fibrillary acidic protein: Regulation by hormones, cytokines, and growth factors. Brain Pathol. 1994, 4, 259–275. [Google Scholar] [CrossRef]
- Battaglia, R.A.; Beltran, A.S.; Delic, S.; Dumitru, R.; Robinson, J.A.; Kabiraj, P.; Herring, L.E.; Madden, V.J.; Ravinder, N.; Willems, E.; et al. Site-specific phosphorylation and caspase cleavage of GFAP are new markers of Alexander disease severity. eLife 2019, 8, e47789. [Google Scholar] [CrossRef]
- Clairembault, T.; Kamphuis, W.; Leclair-Visonneau, L.; Rolli-Derkinderen, M.; Coron, E.; Neunlist, M.; Hol, E.M.; Derkinderen, P. Enteric GFAP expression and phosphorylation in Parkinson’s disease. J. Neurochem. 2014, 130, 805–815. [Google Scholar] [CrossRef]
- Herskowitz, J.H.; Seyfried, N.T.; Duong, D.M.; Xia, Q.; Rees, H.D.; Gearing, M.; Peng, J.; Lah, J.J.; Levey, A.I. Phosphoproteomic analysis reveals site-specific changes in GFAP and NDRG2 phosphorylation in frontotemporal lobar degeneration. J. Proteome Res. 2010, 9, 6368–6379. [Google Scholar] [CrossRef]
- Liu, D.; Liu, C.; Li, J.; Azadzoi, K.; Yang, Y.; Fei, Z.; Dou, K.; Kowall, N.W.; Choi, H.P.; Vieira, F.; et al. Proteomic analysis reveals differentially regulated protein acetylation in human amyotrophic lateral sclerosis spinal cord. PLoS ONE 2013, 8, e80779. [Google Scholar] [CrossRef]
- Ishigami, A.; Masutomi, H.; Handa, S.; Nakamura, M.; Nakaya, S.; Uchida, Y.; Saito, Y.; Murayama, S.; Jang, B.; Jeon, Y.C.; et al. Mass spectrometric identification of citrullination sites and immunohistochemical detection of citrullinated glial fibrillary acidic protein in Alzheimer’s disease brains. J. Neurosci. Res. 2015, 93, 1664–1674. [Google Scholar] [CrossRef]
- Lazarus, R.C.; Buonora, J.E.; Flora, M.N.; Freedy, J.G.; Holstein, G.R.; Martinelli, G.P.; Jacobowitz, D.M.; Mueller, G.P. Protein Citrullination: A Proposed Mechanism for Pathology in Traumatic Brain Injury. Front. Neurol. 2015, 6, 204. [Google Scholar] [CrossRef]
- Jin, Z.; Fu, Z.; Yang, J.; Troncosco, J.; Everett, A.D.; Van Eyk, J.E. Identification and characterization of citrulline-modified brain proteins by combining HCD and CID fragmentation. Proteomics 2013, 13, 2682–2691. [Google Scholar] [CrossRef]
- Moeton, M.; Stassen, O.M.; Sluijs, J.A.; van der Meer, V.W.; Kluivers, L.J.; van Hoorn, H.; Schmidt, T.; Reits, E.A.; van Strien, M.E.; Hol, E.M. GFAP isoforms control intermediate filament network dynamics, cell morphology, and focal adhesions. Cell Mol. Life Sci. 2016, 73, 4101–4120. [Google Scholar] [CrossRef]
- Thomsen, R.; Daugaard, T.F.; Holm, I.E.; Nielsen, A.L. Alternative mRNA splicing from the glial fibrillary acidic protein (GFAP) gene generates isoforms with distinct subcellular mRNA localization patterns in astrocytes. PLoS ONE 2013, 8, e72110. [Google Scholar] [CrossRef]
- Brodie, C.; Kuperstein, I.; Acs, P.; Blumberg, P.M. Differential role of specific PKC isoforms in the proliferation of glial cells and the expression of the astrocytic markers GFAP and glutamine synthetase. Brain Res. Mol. Brain Res. 1998, 56, 108–117. [Google Scholar] [CrossRef]
- de Souza, R.F.; Augusto, R.L.; de Moraes, S.R.A.; de Souza, F.B.; Goncalves, L.; Pereira, D.D.; Moreno, G.M.M.; de Souza, F.M.A.; Andrade-da-Costa, B. Ultra-Endurance Associated with Moderate Exercise in Rats Induces Cerebellar Oxidative Stress and Impairs Reactive GFAP Isoform Profile. Front. Mol. Neurosci. 2020, 13, 157. [Google Scholar] [CrossRef]
- Fan, Y.; He, J.J. HIV-1 Tat Induces Unfolded Protein Response and Endoplasmic Reticulum Stress in Astrocytes and Causes Neurotoxicity through Glial Fibrillary Acidic Protein (GFAP) Activation and Aggregation. J. Biol. Chem. 2016, 291, 22819–22829. [Google Scholar] [CrossRef]
- Muccigrosso, M.M.; Ford, J.; Benner, B.; Moussa, D.; Burnsides, C.; Fenn, A.M.; Popovich, P.G.; Lifshitz, J.; Walker, F.R.; Eiferman, D.S.; et al. Cognitive deficits develop 1 month after diffuse brain injury and are exaggerated by microglia-associated reactivity to peripheral immune challenge. Brain Behav. Immun. 2016, 54, 95–109. [Google Scholar] [CrossRef]
- Nawashiro, H.; Messing, A.; Azzam, N.; Brenner, M. Mice lacking GFAP are hypersensitive to traumatic cerebrospinal injury. Neuroreport 1998, 9, 1691–1696. [Google Scholar] [CrossRef] [PubMed]
- Dani, M.; Wood, M.; Mizoguchi, R.; Fan, Z.; Walker, Z.; Morgan, R.; Hinz, R.; Biju, M.; Kuruvilla, T.; Brooks, D.J.; et al. Microglial activation correlates in vivo with both tau and amyloid in Alzheimer’s disease. Brain 2018, 141, 2740–2754. [Google Scholar] [CrossRef] [PubMed]
- Donat, C.K.; Scott, G.; Gentleman, S.M.; Sastre, M. Microglial Activation in Traumatic Brain Injury. Front. Aging Neurosci. 2017, 9, 208. [Google Scholar] [CrossRef] [PubMed]
- Calabrese, V.; Santoro, A.; Monti, D.; Crupi, R.; Di Paola, R.; Latteri, S.; Cuzzocrea, S.; Zappia, M.; Giordano, J.; Calabrese, E.J.; et al. Aging and Parkinson’s Disease: Inflammaging, neuroinflammation and biological remodeling as key factors in pathogenesis. Free Radic. Biol. Med. 2018, 115, 80–91. [Google Scholar] [CrossRef]
- Streit, W.J.; Mrak, R.E.; Griffin, W.S. Microglia and neuroinflammation: A pathological perspective. J. Neuroinflamm. 2004, 1, 14. [Google Scholar] [CrossRef][Green Version]
- Hoenig, M.C.; Willscheid, N.; Bischof, G.N.; van Eimeren, T.; Drzezga, A.; Alzheimer’s Disease Neuroimaging, I. Assessment of Tau Tangles and Amyloid-beta Plaques Among Super Agers Using PET Imaging. JAMA Netw. Open 2020, 3, e2028337. [Google Scholar] [CrossRef]
- Drummond, E.; Nayak, S.; Pires, G.; Ueberheide, B.; Wisniewski, T. Isolation of Amyloid Plaques and Neurofibrillary Tangles from Archived Alzheimer’s Disease Tissue Using Laser-Capture Microdissection for Downstream Proteomics. Methods Mol. Biol. 2018, 1723, 319–334. [Google Scholar] [CrossRef]
- Ayyadevara, S.; Balasubramaniam, M.; Parcon, P.A.; Barger, S.W.; Griffin, W.S.; Alla, R.; Tackett, A.J.; Mackintosh, S.G.; Petricoin, E.; Zhou, W.; et al. Proteins that mediate protein aggregation and cytotoxicity distinguish Alzheimer’s hippocampus from normal controls. Aging Cell 2016, 15, 924–939. [Google Scholar] [CrossRef]
- Morley, J.F.; Brignull, H.R.; Weyers, J.J.; Morimoto, R.I. The threshold for polyglutamine-expansion protein aggregation and cellular toxicity is dynamic and influenced by aging in Caenorhabditis elegans. Proc. Natl. Acad. Sci. USA 2002, 99, 10417–10422. [Google Scholar] [CrossRef]
- Dosanjh, L.E.; Brown, M.K.; Rao, G.; Link, C.D.; Luo, Y. Behavioral phenotyping of a transgenic Caenorhabditis elegans expressing neuronal amyloid-beta. J. Alzheimers Dis. 2010, 19, 681–690. [Google Scholar] [CrossRef] [PubMed]
- Dostal, V.; Link, C.D. Assaying beta-amyloid toxicity using a transgenic C. elegans model. J. Vis. Exp. 2010, 44, 2252. [Google Scholar] [CrossRef] [PubMed]
- Kakraba, S.; Ayyadevara, S.; Penthala, N.R.; Balasubramaniam, M.; Ganne, A.; Liu, L.; Alla, R.; Bommagani, S.B.; Barger, S.W.; Griffin, W.S.T.; et al. A Novel Microtubule-Binding Drug Attenuates and Reverses Protein Aggregation in Animal Models of Alzheimer’s Disease. Front. Mol. Neurosci. 2019, 12, 310. [Google Scholar] [CrossRef] [PubMed]
- Ayyadevara, S.; Balasubramaniam, M.; Kakraba, S.; Alla, R.; Mehta, J.L.; Shmookler Reis, R.J. Aspirin-Mediated Acetylation Protects Against Multiple Neurodegenerative Pathologies by Impeding Protein Aggregation. Antioxid. Redox Signal. 2017, 27, 1383–1396. [Google Scholar] [CrossRef] [PubMed]
- Ayyadevara, S.; Mercanti, F.; Wang, X.; Mackintosh, S.G.; Tackett, A.J.; Prayaga, S.V.; Romeo, F.; Shmookler Reis, R.J.; Mehta, J.L. Age- and Hypertension-Associated Protein Aggregates in Mouse Heart Have Similar Proteomic Profiles. Hypertension 2016, 67, 1006–1013. [Google Scholar] [CrossRef]
- Brandt, R.; Gergou, A.; Wacker, I.; Fath, T.; Hutter, H. A Caenorhabditis elegans model of tau hyperphosphorylation: Induction of developmental defects by transgenic overexpression of Alzheimer’s disease-like modified tau. Neurobiol. Aging 2009, 30, 22–33. [Google Scholar] [CrossRef]
- Ayyadevara, S.; Balasubramaniam, M.; Suri, P.; Mackintosh, S.G.; Tackett, A.J.; Sullivan, D.H.; Shmookler Reis, R.J.; Dennis, R.A. Proteins that accumulate with age in human skeletal-muscle aggregates contribute to declines in muscle mass and function in Caenorhabditis elegans. Aging 2016, 8, 3486–3497. [Google Scholar] [CrossRef]
- Fire, A.; Xu, S.; Montgomery, M.K.; Kostas, S.A.; Driver, S.E.; Mello, C.C. Potent and specific genetic interference by double-stranded RNA in Caenorhabditis elegans. Nature 1998, 391, 806–811. [Google Scholar] [CrossRef]
- Fire, A.; Albertson, D.; Harrison, S.W.; Moerman, D.G. Production of antisense RNA leads to effective and specific inhibition of gene expression in C. elegans muscle. Development 1991, 113, 503–514. [Google Scholar] [CrossRef]
- Liu, L.; Li, Y.; Van Eldik, L.J.; Griffin, W.S.; Barger, S.W. S100B-induced microglial and neuronal IL-1 expression is mediated by cell type-specific transcription factors. J. Neurochem. 2005, 92, 546–553. [Google Scholar] [CrossRef]
- Ayyadevara, S.; Balasubramaniam, M.; Johnson, J.; Alla, R.; Mackintosh, S.G.; Shmookler Reis, R.J. PIP3-binding proteins promote age-dependent protein aggregation and limit survival in C. elegans. Oncotarget 2016, 7, 48870–48886. [Google Scholar] [CrossRef] [PubMed]
- Balasubramaniam, M.; Ayyadevara, S.; Shmookler Reis, R.J. Structural insights into pro-aggregation effects of C. elegans CRAM-1 and its human ortholog SERF2. Sci. Rep. 2018, 8, 14891. [Google Scholar] [CrossRef] [PubMed]
- Ayyadevara, S.; Balasubramaniam, M.; Gao, Y.; Yu, L.R.; Alla, R.; Shmookler Reis, R. Proteins in aggregates functionally impact multiple neurodegenerative disease models by forming proteasome-blocking complexes. Aging Cell 2015, 14, 35–48. [Google Scholar] [CrossRef] [PubMed]
- Yang, J.; Yan, R.; Roy, A.; Xu, D.; Poisson, J.; Zhang, Y. The I-TASSER Suite: Protein structure and function prediction. Nat. Methods 2015, 12, 7–8. [Google Scholar] [CrossRef]
- Henderson, B.W.; Gentry, E.G.; Rush, T.; Troncoso, J.C.; Thambisetty, M.; Montine, T.J.; Herskowitz, J.H. Rho-associated protein kinase 1 (ROCK1) is increased in Alzheimer’s disease and ROCK1 depletion reduces amyloid-beta levels in brain. J. Neurochem. 2016, 138, 525–531. [Google Scholar] [CrossRef] [PubMed]
- Obrenovich, M.E.; Morales, L.A.; Cobb, C.J.; Shenk, J.C.; Mendez, G.M.; Fischbach, K.; Smith, M.A.; Qasimov, E.K.; Perry, G.; Aliev, G. Insights into cerebrovascular complications and Alzheimer disease through the selective loss of GRK2 regulation. J. Cell. Mol. Med. 2009, 13, 853–865. [Google Scholar] [CrossRef]
- Obrenovich, M.E.; Palacios, H.H.; Gasimov, E.; Leszek, J.; Aliev, G. The GRK2 Overexpression Is a Primary Hallmark of Mitochondrial Lesions during Early Alzheimer Disease. Cardiovasc. Psychiatry Neurol. 2009, 2009, 327360. [Google Scholar] [CrossRef]
- Obrenovich, M.E.; Smith, M.A.; Siedlak, S.L.; Chen, S.G.; de la Torre, J.C.; Perry, G.; Aliev, G. Overexpression of GRK2 in Alzheimer disease and in a chronic hypoperfusion rat model is an early marker of brain mitochondrial lesions. Neurotox. Res. 2006, 10, 43–56. [Google Scholar] [CrossRef]
- Taylor, S.S.; Wallbott, M.; Machal, E.M.F.; Soberg, K.; Ahmed, F.; Bruystens, J.; Vu, L.; Baker, B.; Wu, J.; Raimondi, F.; et al. PKA Cbeta: A forgotten catalytic subunit of cAMP-dependent protein kinase opens new windows for PKA signaling and disease pathologies. Biochem. J. 2021, 478, 2101–2119. [Google Scholar] [CrossRef]
- Banerjee, T.D.; Reihl, K.; Swain, M.; Torres, M.; Dagda, R.K. Mitochondrial PKA Is Neuroprotective in a Cell Culture Model of Alzheimer’s Disease. Mol. Neurobiol. 2021, 58, 3071–3083. [Google Scholar] [CrossRef]
- Zhang, Z.; Shen, Q.; Wu, X.; Zhang, D.; Xing, D. Activation of PKA/SIRT1 signaling pathway by photobiomodulation therapy reduces Abeta levels in Alzheimer’s disease models. Aging Cell 2020, 19, e13054. [Google Scholar] [CrossRef] [PubMed]
- Ko, H.J.; Chiou, S.J.; Wong, Y.H.; Wang, Y.H.; Lai, Y.; Chou, C.H.; Wang, C.; Loh, J.K.; Lieu, A.S.; Cheng, J.T.; et al. GSKIP-Mediated Anchoring Increases Phosphorylation of Tau by PKA but Not by GSK3beta via cAMP/PKA/GSKIP/GSK3/Tau Axis Signaling in Cerebrospinal Fluid and iPS Cells in Alzheimer Disease. J. Clin. Med. 2019, 8, 1751. [Google Scholar] [CrossRef] [PubMed]
- Russo, I. The role of LRRK2 on PKA-NFkappaB pathway in microglia cells: Implications for Parkinson’s disease. Neural Regen. Res. 2019, 14, 1713–1714. [Google Scholar] [CrossRef]
- Balasubramaniam, M.; Mainali, N.; Bowroju, S.K.; Atluri, P.; Penthala, N.R.; Ayyadevera, S.; Crooks, P.A.; Shmookler Reis, R.J. Structural modeling of GSK3beta implicates the inactive (DFG-out) conformation as the target bound by TDZD analogs. Sci. Rep. 2020, 10, 18326. [Google Scholar] [CrossRef]
- Niccoli, T.; Partridge, L. Ageing as a risk factor for disease. Curr. Biol. 2012, 22, R741–R752. [Google Scholar] [CrossRef] [PubMed]
- Ano Bom, A.P.; Rangel, L.P.; Costa, D.C.; de Oliveira, G.A.; Sanches, D.; Braga, C.A.; Gava, L.M.; Ramos, C.H.; Cepeda, A.O.; Stumbo, A.C.; et al. Mutant p53 aggregates into prion-like amyloid oligomers and fibrils: Implications for cancer. J. Biol. Chem. 2012, 287, 28152–28162. [Google Scholar] [CrossRef] [PubMed]
- Balasubramaniam, M.; Ayyadevara, S.; Ganne, A.; Kakraba, S.; Penthala, N.R.; Du, X.; Crooks, P.A.; Griffin, S.T.; Shmookler Reis, R.J. Aggregate Interactome Based on Protein Cross-linking Interfaces Predicts Drug Targets to Limit Aggregation in Neurodegenerative Diseases. iScience 2019, 20, 248–264. [Google Scholar] [CrossRef]
- Sternburg, E.L.; Gruijs da Silva, L.A.; Dormann, D. Post-translational modifications on RNA-binding proteins: Accelerators, brakes, or passengers in neurodegeneration? Trends Biochem. Sci. 2022, 47, 6–22. [Google Scholar] [CrossRef]
- Ferrer, I.; Andres-Benito, P.; Ausin, K.; Pamplona, R.; Del Rio, J.A.; Fernandez-Irigoyen, J.; Santamaria, E. Dysregulated protein phosphorylation: A determining condition in the continuum of brain aging and Alzheimer’s disease. Brain Pathol. 2021, 31, e12996. [Google Scholar] [CrossRef]
- Mavroudis, I.; Petridis, F.; Chatzikonstantinou, S.; Kazis, D. Alpha-synuclein Levels in the Differential Diagnosis of Lewy Bodies Dementia and Other Neurodegenerative Disorders: A Meta-analysis. Alzheimer Dis. Assoc. Disord. 2020, 34, 220–224. [Google Scholar] [CrossRef]
- Zhang, L.; Chen, Y.; Liu, M.; Wang, Y.; Peng, G. TDP-43 and Limbic-Predominant Age-Related TDP-43 Encephalopathy. Front. Aging Neurosci. 2019, 11, 376. [Google Scholar] [CrossRef] [PubMed]
- Xu, Y.; Deng, Y.; Qing, H. The phosphorylation of alpha-synuclein: Development and implication for the mechanism and therapy of the Parkinson’s disease. J. Neurochem. 2015, 135, 4–18. [Google Scholar] [CrossRef] [PubMed]
- Bai, B.; Vanderwall, D.; Li, Y.; Wang, X.; Poudel, S.; Wang, H.; Dey, K.K.; Chen, P.C.; Yang, K.; Peng, J. Proteomic landscape of Alzheimer’s Disease: Novel insights into pathogenesis and biomarker discovery. Mol. Neurodegener. 2021, 16, 55. [Google Scholar] [CrossRef]
- Zheng, M.; Wang, P. Role of insulin receptor substance-1 modulating PI3K/Akt insulin signaling pathway in Alzheimer’s disease. 3 Biotech 2021, 11, 179. [Google Scholar] [CrossRef] [PubMed]
- Yang, L.; Wang, H.; Liu, L.; Xie, A. The Role of Insulin/IGF-1/PI3K/Akt/GSK3beta Signaling in Parkinson’s Disease Dementia. Front. Neurosci. 2018, 12, 73. [Google Scholar] [CrossRef] [PubMed]
- Chen, L.M.; Xiong, Y.S.; Kong, F.L.; Qu, M.; Wang, Q.; Chen, X.Q.; Wang, J.Z.; Zhu, L.Q. Neuroglobin attenuates Alzheimer-like tau hyperphosphorylation by activating Akt signaling. J. Neurochem. 2012, 120, 157–164. [Google Scholar] [CrossRef]
- Carlyle, B.C.; Nairn, A.C.; Wang, M.; Yang, Y.; Jin, L.E.; Simen, A.A.; Ramos, B.P.; Bordner, K.A.; Craft, G.E.; Davies, P.; et al. cAMP-PKA phosphorylation of tau confers risk for degeneration in aging association cortex. Proc. Natl. Acad. Sci. USA 2014, 111, 5036–5041. [Google Scholar] [CrossRef]
- Dagda, R.K.; Gusdon, A.M.; Pien, I.; Strack, S.; Green, S.; Li, C.; Van Houten, B.; Cherra, S.J., 3rd; Chu, C.T. Mitochondrially localized PKA reverses mitochondrial pathology and dysfunction in a cellular model of Parkinson’s disease. Cell Death Differ. 2011, 18, 1914–1923. [Google Scholar] [CrossRef]
- Greggio, E.; Bubacco, L.; Russo, I. Cross-talk between LRRK2 and PKA: Implication for Parkinson’s disease? Biochem. Soc. Trans. 2017, 45, 261–267. [Google Scholar] [CrossRef]
- Li, H.; Yang, S.; Wu, J.; Ji, L.; Zhu, L.; Cao, L.; Huang, J.; Jiang, Q.; Wei, J.; Liu, M.; et al. cAMP/PKA signaling pathway contributes to neuronal apoptosis via regulating IDE expression in a mixed model of type 2 diabetes and Alzheimer’s disease. J. Cell. Biochem. 2018, 119, 1616–1626. [Google Scholar] [CrossRef]
- Keil, M.F.; Briassoulis, G.; Stratakis, C.A.; Wu, T.J. Protein Kinase A and Anxiety-Related Behaviors: A Mini-Review. Front. Endocrinol. 2016, 7, 83. [Google Scholar] [CrossRef] [PubMed]


Publisher’s Note: MDPI stays neutral with regard to jurisdictional claims in published maps and institutional affiliations. |
© 2022 by the authors. Licensee MDPI, Basel, Switzerland. This article is an open access article distributed under the terms and conditions of the Creative Commons Attribution (CC BY) license (https://creativecommons.org/licenses/by/4.0/).
Share and Cite
Ganne, A.; Balasubramaniam, M.; Griffin, W.S.T.; Shmookler Reis, R.J.; Ayyadevara, S. Glial Fibrillary Acidic Protein: A Biomarker and Drug Target for Alzheimer’s Disease. Pharmaceutics 2022, 14, 1354. https://doi.org/10.3390/pharmaceutics14071354
Ganne A, Balasubramaniam M, Griffin WST, Shmookler Reis RJ, Ayyadevara S. Glial Fibrillary Acidic Protein: A Biomarker and Drug Target for Alzheimer’s Disease. Pharmaceutics. 2022; 14(7):1354. https://doi.org/10.3390/pharmaceutics14071354
Chicago/Turabian StyleGanne, Akshatha, Meenakshisundaram Balasubramaniam, W. Sue T. Griffin, Robert J. Shmookler Reis, and Srinivas Ayyadevara. 2022. "Glial Fibrillary Acidic Protein: A Biomarker and Drug Target for Alzheimer’s Disease" Pharmaceutics 14, no. 7: 1354. https://doi.org/10.3390/pharmaceutics14071354
APA StyleGanne, A., Balasubramaniam, M., Griffin, W. S. T., Shmookler Reis, R. J., & Ayyadevara, S. (2022). Glial Fibrillary Acidic Protein: A Biomarker and Drug Target for Alzheimer’s Disease. Pharmaceutics, 14(7), 1354. https://doi.org/10.3390/pharmaceutics14071354