Design Space Identification and Visualization for Continuous Pharmaceutical Manufacturing


Abstract
1. Introduction
2. Related Literature
2.1. Continuous Flow Synthesis of Active Pharmaceutical Ingredients
2.2. Continuous Pharmaceutical Separation Process Design
2.2.1. Liquid-Liquid Extraction
2.2.2. Crystallization
2.3. Continuous Downstream Processing + Drug Product Formulation
2.4. Industrial Adoption of Continuous Pharmaceutical Manufacturing
2.5. Design Space Investigation
2.5.1. Continuous Flow Synthesis
2.5.2. Continuous Separation Process Design
2.5.3. Downstream Processing
2.6. This Study
3. Plantwide Design Space Investigation
3.1. Upstream Plantwide Design Case Studies
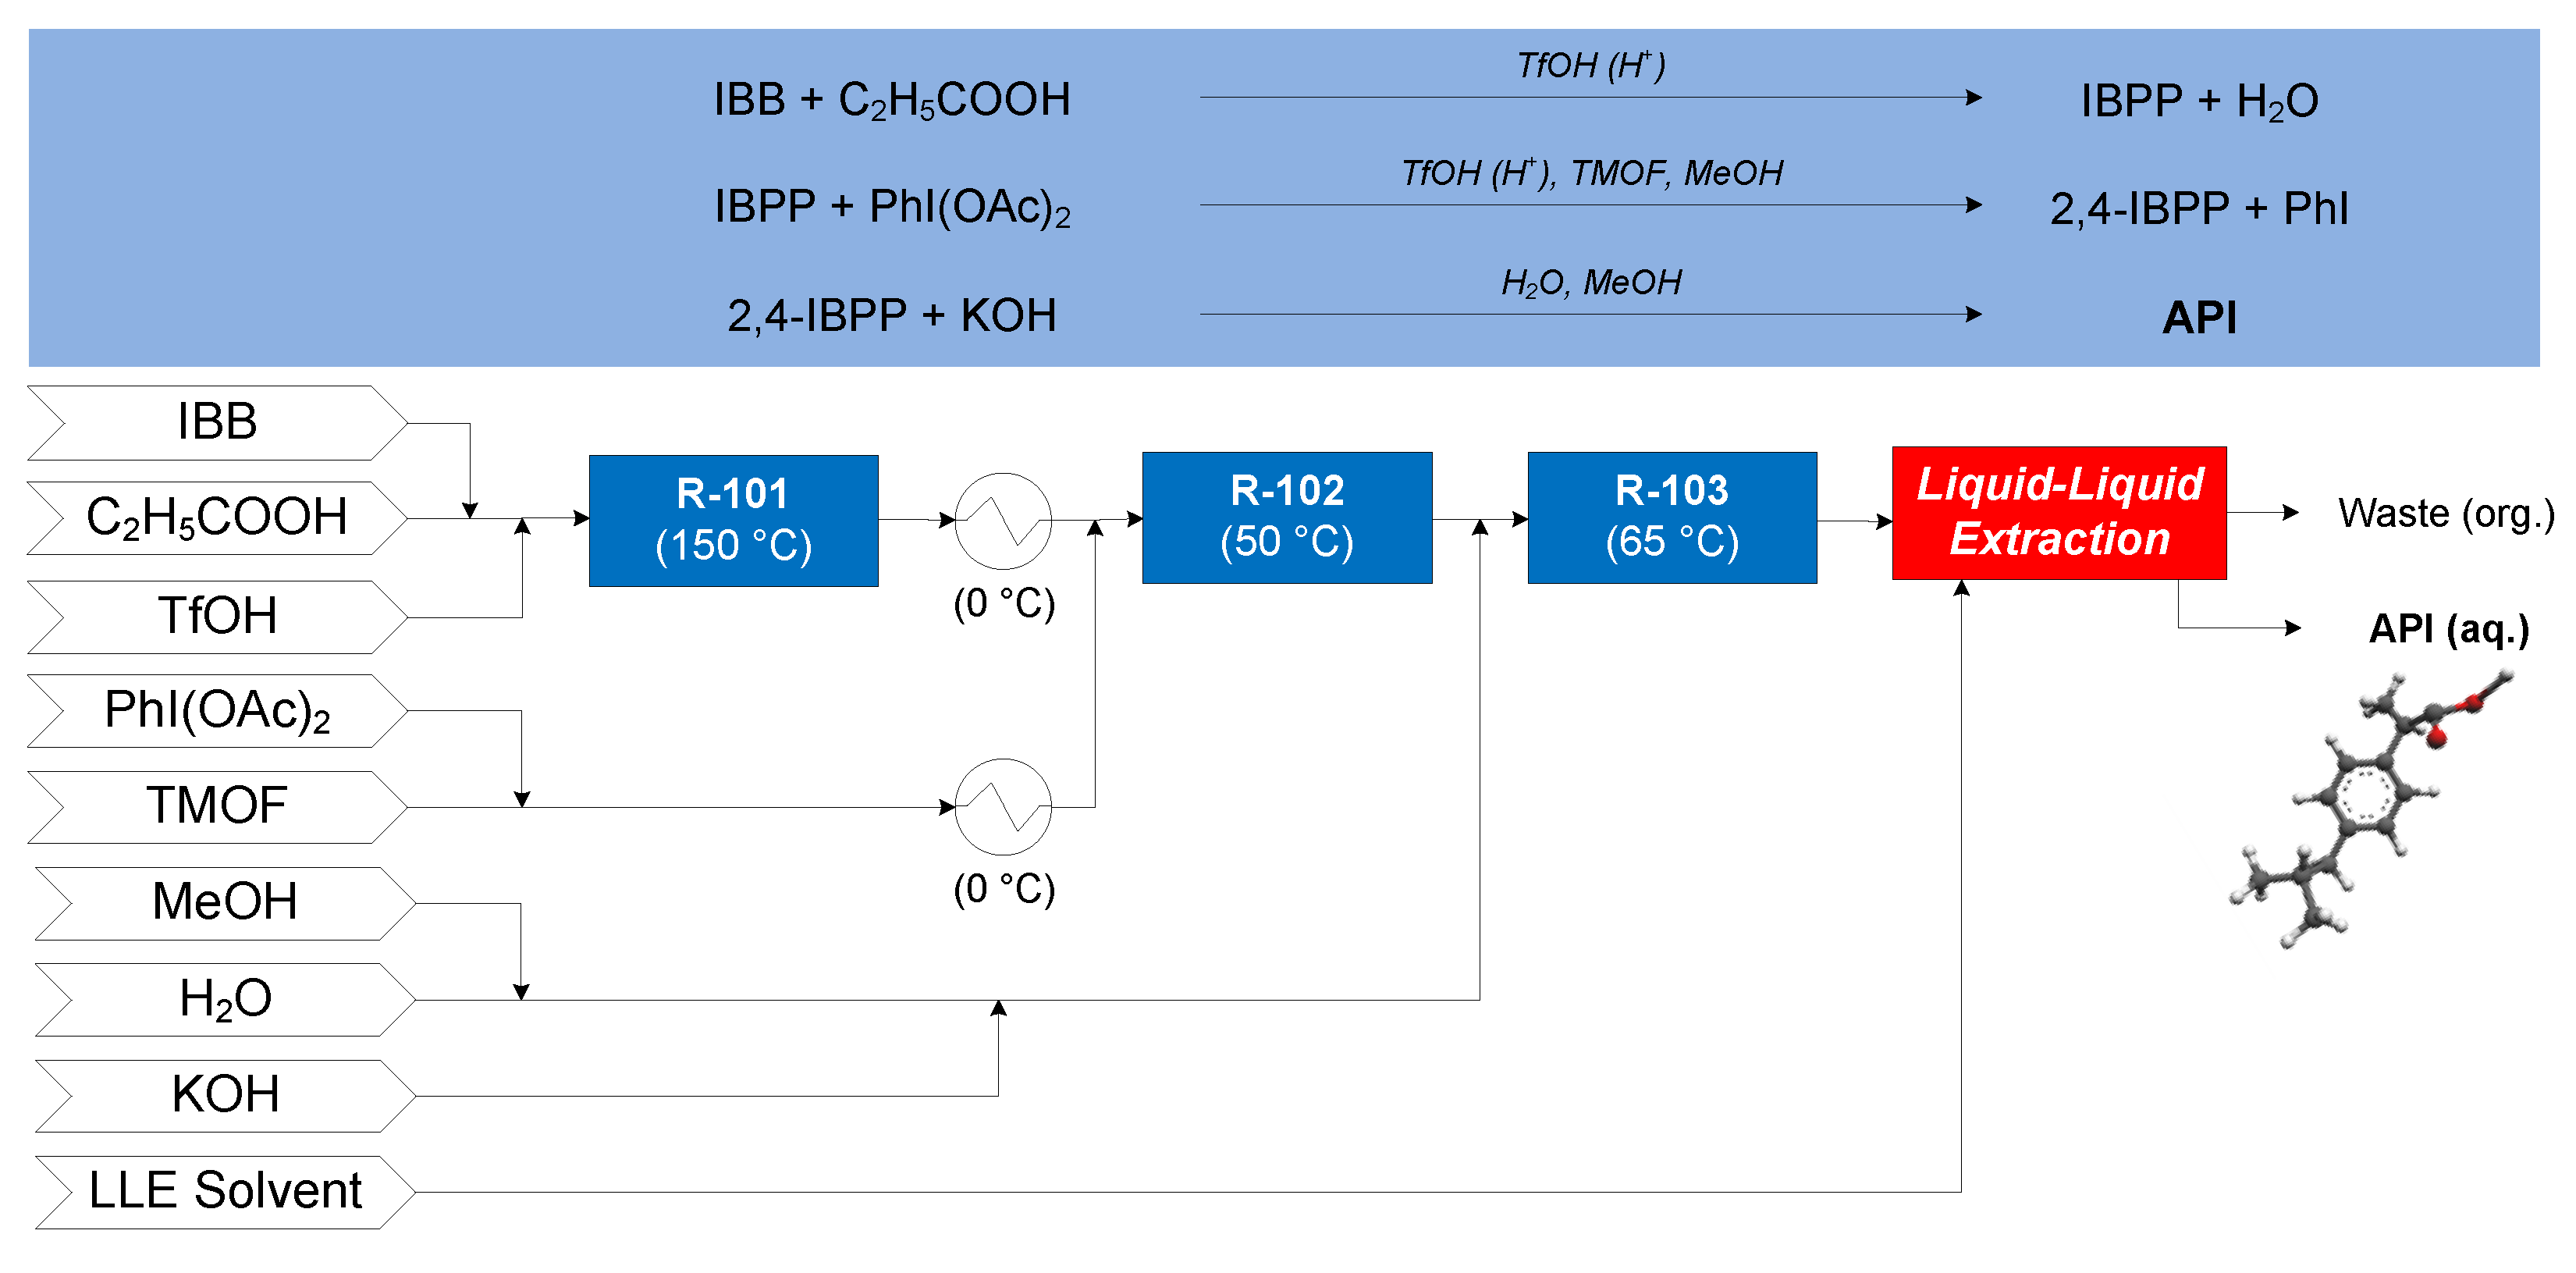
3.1.1. Ibuprofen
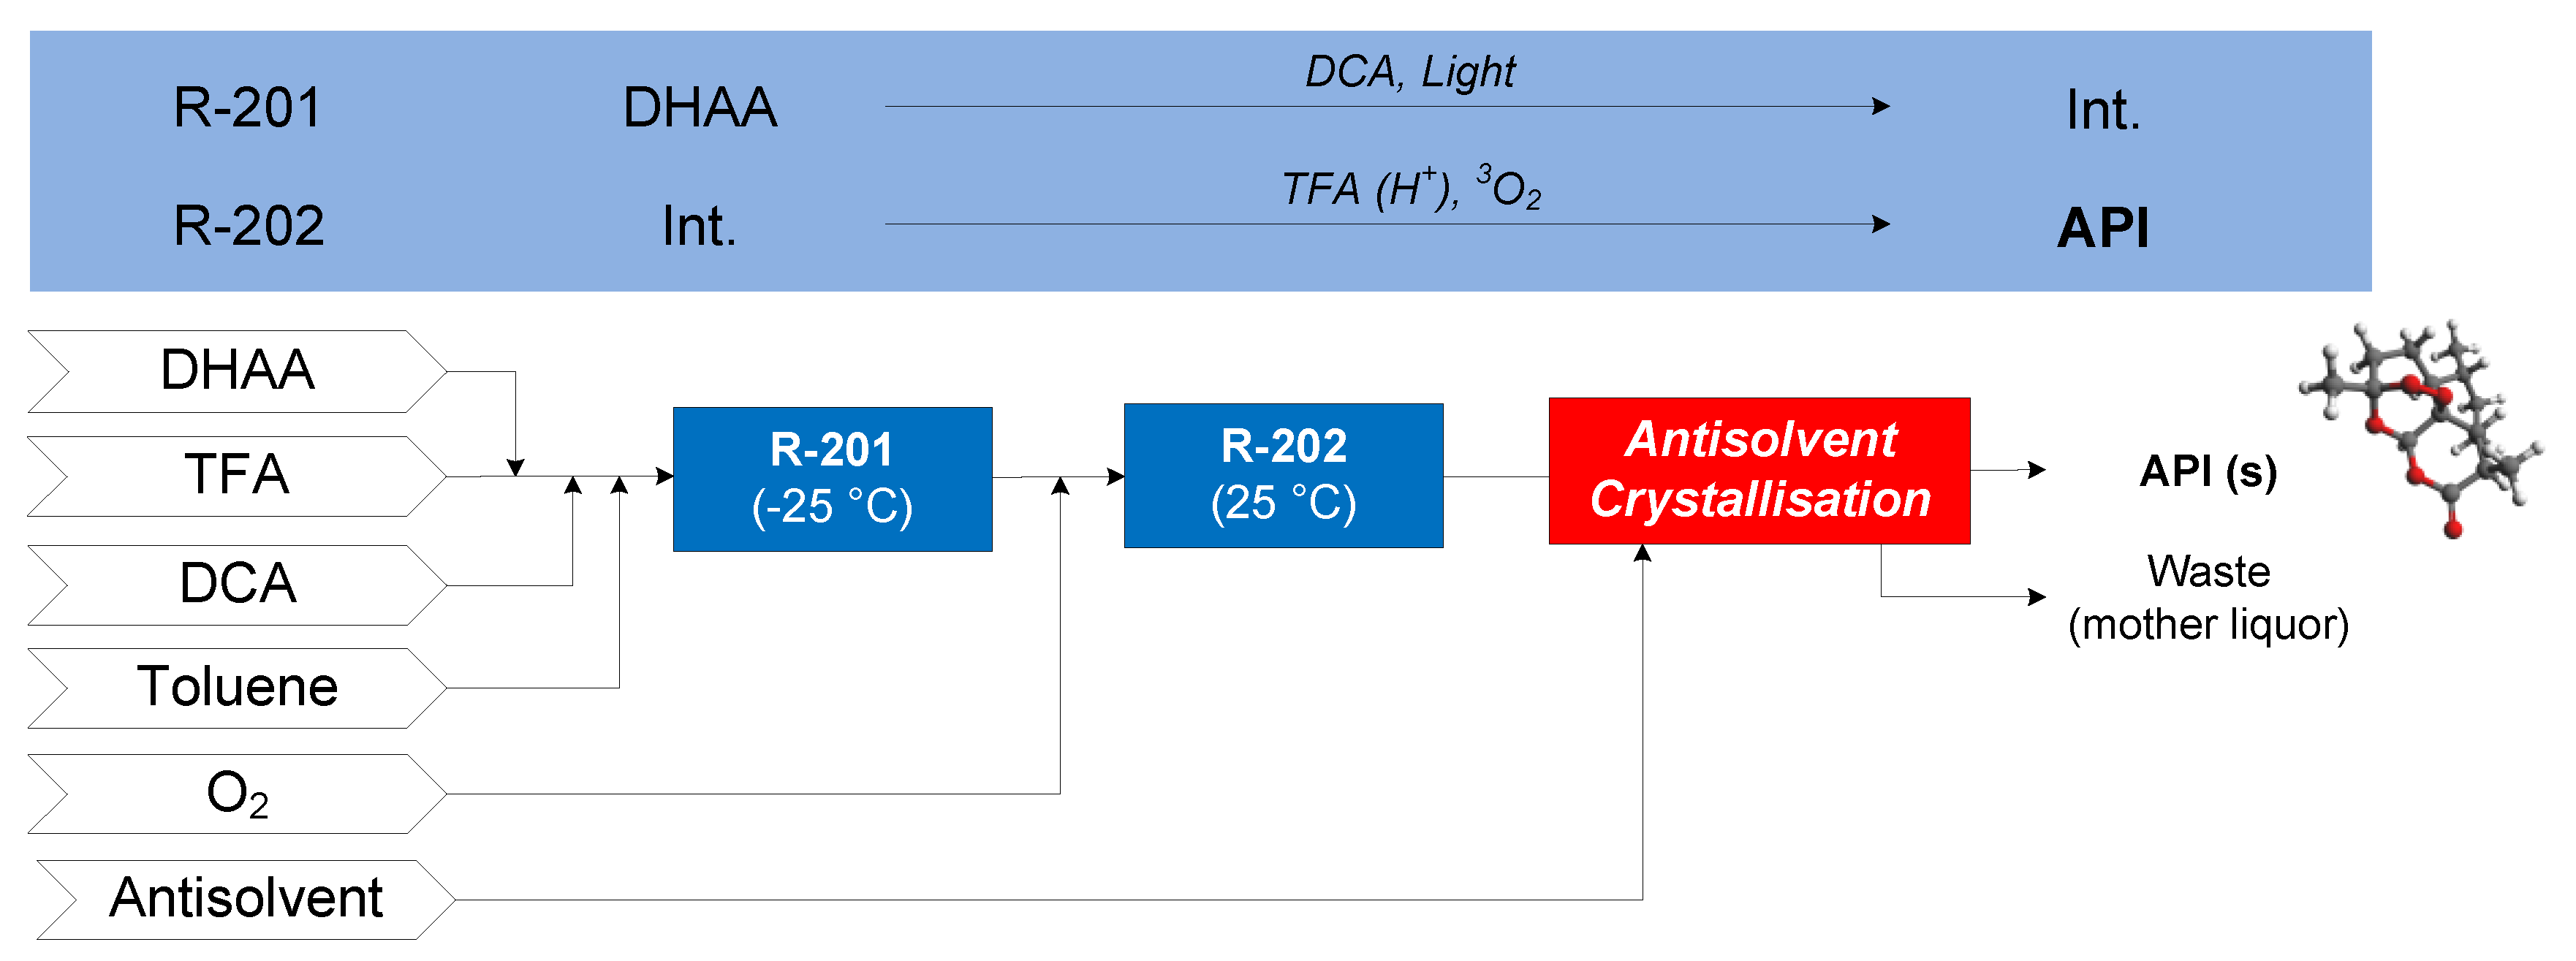
3.1.2. Artemisinin
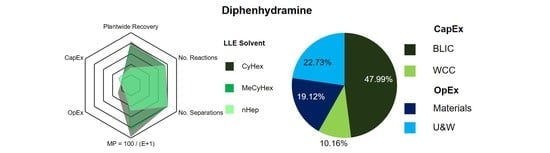
3.1.3. Diphenhydramine
3.1.4. Warfarin
3.1.5. Atropine
3.1.6. Nevirapine
3.2. Plant Design Performance Metrics
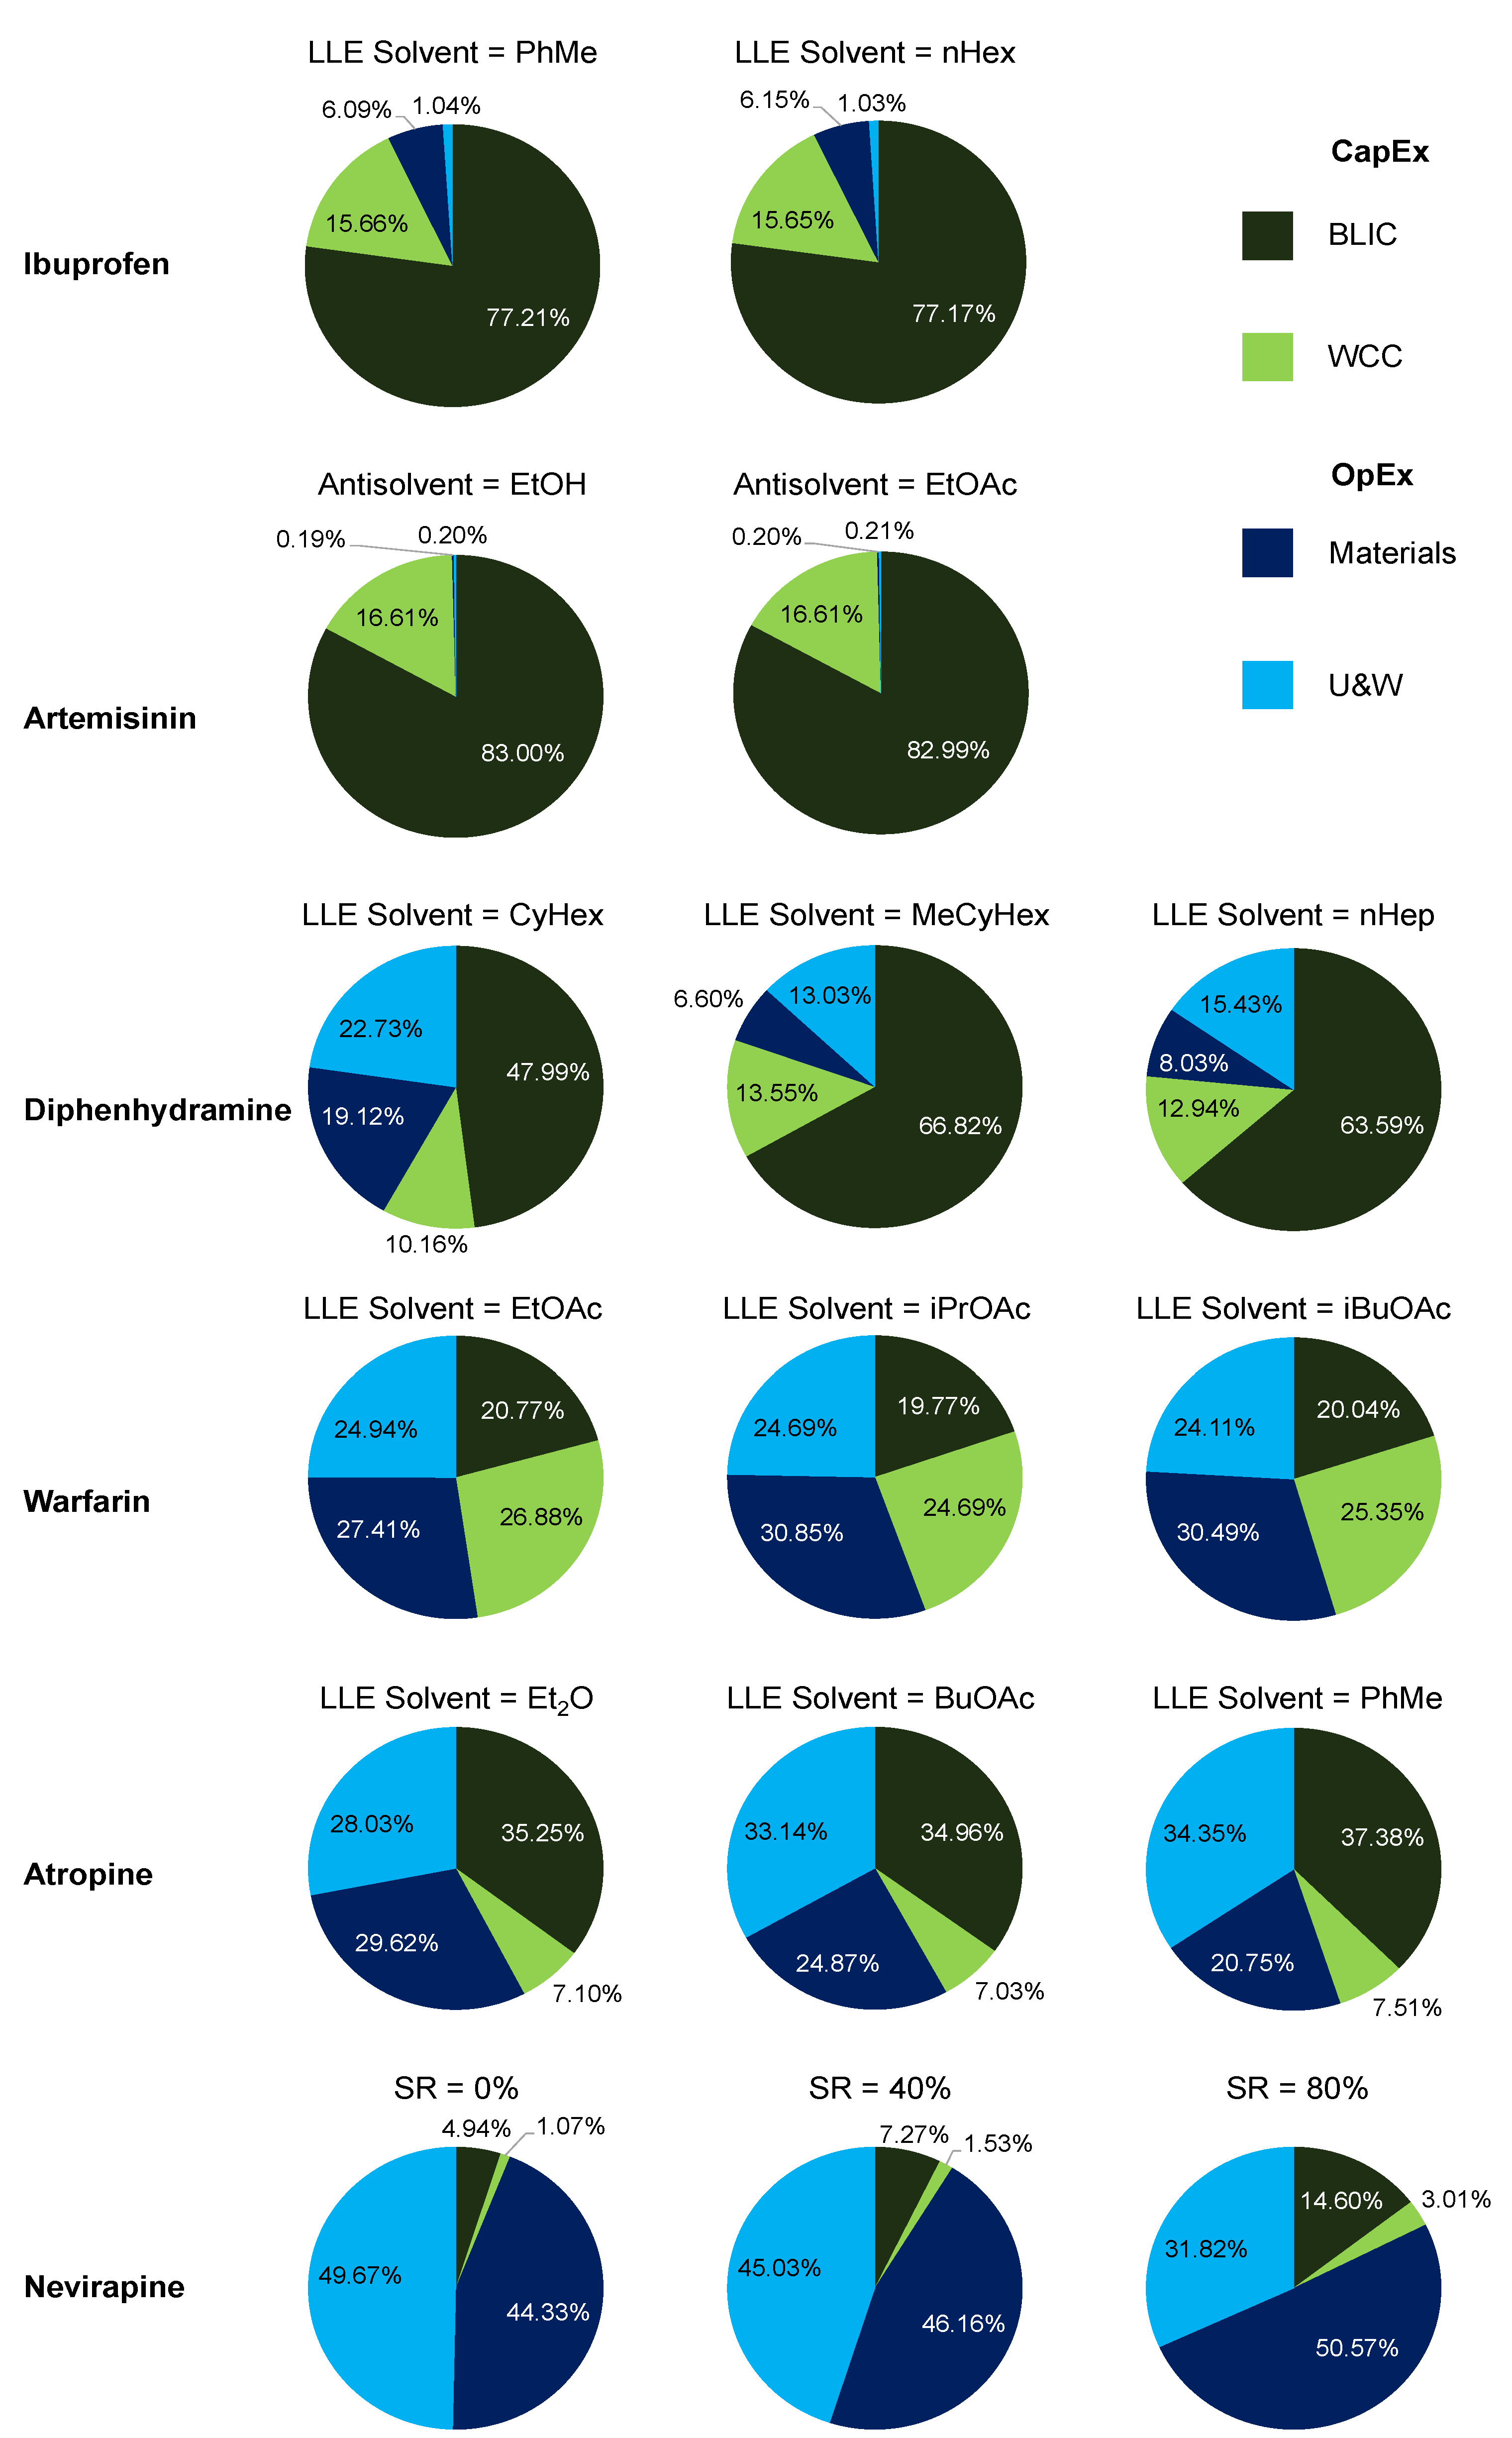
3.3. API Cost Component Contributions
4. Conclusions
Author Contributions
Funding
Conflicts of Interest
References
- Poechlauer, P.; Colberg, J.; Fisher, E.; Jansen, M.; Johnson, M.D.; Koenig, S.G.; Lawler, M.; Laporte, T.; Manley, J.; Martin, B.; et al. Pharmaceutical roundtable study demonstrates the value of continuous manufacturing in the design of greener processes. Org. Process Res. Dev. 2013, 17, 1472–1478. [Google Scholar] [CrossRef]
- Teoh, S.K.; Rathi, C.; Sharratt, P. Practical assessment methodology for converting fine chemicals processes from batch to continuous. Org. Process Res. Dev. 2015, 20, 414–431. [Google Scholar] [CrossRef]
- Bana, P.; Örkényi, R.; Lövei, K.; Lakó, Á.; Túrós, G.I.; Éles, J.; Faigl, F.; Greiner, I. The route from problem to solution in multistep continuous flow synthesis of pharmaceutical compounds. Bioorg. Med. Chem. 2017, 25, 6180–6189. [Google Scholar] [CrossRef] [PubMed]
- Costandy, J.G.; Edgar, T.F.; Baldea, M. Switching from batch to continuous reactors is a trajectory optimization problem. Ind. Eng. Chem. Res. 2019, 58, 13718–13736. [Google Scholar] [CrossRef]
- Plumb, K. Continuous processing in the pharmaceutical industry—Changing the mind set. Chem. Eng. Res. Des. 2005, 83, 730–738. [Google Scholar] [CrossRef]
- McWilliams, J.C.; Allian, A.D.; Opalka, S.M.; May, S.A.; Journet, M.; Braden, T.M. The evolving state of continuous processing in pharmaceutical API manufacturing: A survey of pharmaceutical companies and contract manufacturing organizations. Org. Process Res. Dev. 2018, 22, 1143–1166. [Google Scholar] [CrossRef]
- Baumann, M.; Baxendale, I.R. The synthesis of active pharmaceutical ingredients (APIs) using continuous flow chemistry. Beilstein J. Org. Chem. 2015, 11, 1194–1219. [Google Scholar] [CrossRef]
- Plutschack, M.B.; Pieber, B.; Gilmore, K.; Seeberger, P.H. The Hitchhiker’s guide to flow chemistry. Chem. Rev. 2017, 117, 11796–11893. [Google Scholar] [CrossRef]
- Britton, J.; Raston, C.L. Multi-step continuous-flow synthesis. Chem. Soc. Rev. 2017, 52, 10159–10162. [Google Scholar] [CrossRef]
- De Souza, R.O.M.A.; Watts, P. Flow processing as a tool for API production in developing economies. J. Flow Chem. 2017, 7, 146–150. [Google Scholar] [CrossRef]
- Malet-Sanz, L.; Susanne, F. Continuous flow synthesis. A pharma perspective. J. Med. Chem. 2012, 55, 4062–4098. [Google Scholar] [CrossRef] [PubMed]
- Rossetti, I.; Compagnoni, M. Chemical reaction engineering, process design and scale-up issues at the frontier of synthesis: Flow chemistry. Chem. Eng. J. 2016, 296, 56–70. [Google Scholar] [CrossRef]
- Adamo, A.; Beingessner, R.L.; Behnam, M.; Chen, J.; Jamison, T.F.; Jensen, K.F.; Monbaliu, J.-C.M.; Myerson, A.S.; Revalor, E.M.; Snead, D.R.; et al. On-demand continuous-flow production of pharmaceuticals in a compact, reconfigurable system. Science 2016, 352, 61–67. [Google Scholar] [CrossRef] [PubMed]
- Cole, K.P.; Reizman, B.J.; Hess, M.; Groh, J.M.; Laurila, M.E.; Cope, R.F.; Campbell, B.M.; Forst, M.B.; Burt, J.L.; Maloney, T.D.; et al. Small-volume continuous manufacturing of merestinib. Part 1. Process development and demonstration. Org. Process Res. Dev. 2019, 23, 858–869. [Google Scholar] [CrossRef]
- Reizman, B.J.; Cole, K.P.; Hess, M.; Burt, J.L.; Maloney, T.D.; Johnson, M.D.; Laurila, M.E.; Cope, R.F.; Luciani, C.V.; Buser, J.Y.; et al. Small-volume continuous manufacturing of merestinib. Part 2. Technology transfer and cgmp manufacturing. Org. Process Res. Dev. 2019, 23, 870–881. [Google Scholar] [CrossRef]
- Baxendale, I.R.; Braatz, R.D.; Hodnett, B.K.; Jensen, K.F.; Johnson, M.D.; Sharratt, P.; Sherlock, J.P.; Florence, A.J. Achieving continuous manufacturing: Technologies and approaches for synthesis, workup, and isolation of drug substance. May 20–21 2014 Continuous manufacturing symposium. J. Pharm. Sci. 2015, 104, 781–791. [Google Scholar] [CrossRef]
- Lee, J.W.; Horváth, Z.; O’Brien, A.G.; Seeberger, P.H.; Seidel-Morgenstern, A. Design and optimization of coupling a continuously operated reactor with simulated moving bed chromatography. Chem. Eng. J. 2014, 251, 355–370. [Google Scholar] [CrossRef]
- Wang, J.; Lakerveld, R. Continuous membrane-assisted crystallization to increase the attainable product quality of pharmaceuticals and design space for operation. Ind. Eng. Chem. Res. 2017, 56, 5705–5714. [Google Scholar] [CrossRef]
- Drageset, A.; Bjørsvik, H.-R. Continuous flow synthesis concatenated with continuous flow liquid–liquid extraction for work-up and purification: Selective mono- and di-iodination of the imidazole backbone. React. Chem. Eng. 2016, 1, 436–444. [Google Scholar] [CrossRef]
- Monbaliu, J.-C.M.; Stelzer, T.; Revalor, E.; Weeranoppanant, N.; Jensen, K.F.; Myerson, A.S. Compact and integrated approach for advanced end-to-end production, purification, and aqueous formulation of lidocaine hydrochloride. Org. Process Res. Dev. 2016, 20, 1347–1353. [Google Scholar] [CrossRef]
- Weeranoppanant, N.; Adamo, A.; Saparbaiuly, G.; Rose, E.; Fleury, C.; Schenkel, B.; Jensen, K.F. Design of multistage counter-current liquid–liquid extraction for small-scale applications. Ind. Eng. Chem. Res. 2017, 56, 4095–4103. [Google Scholar] [CrossRef]
- Zhang, D.; Xu, S.; Du, S.; Wang, J.; Gong, J. Progress of pharmaceutical continuous crystallization. Engineering 2017, 3, 354–364. [Google Scholar] [CrossRef]
- Chen, J.; Sarma, B.; Evans, J.M.B.; Myerson, A.S. Pharmaceutical crystallization. Cryst. Growth Des. 2011, 11, 887–895. [Google Scholar] [CrossRef]
- Randolph, A.D.; Larson, M.A. Theory of Particulate Processes: Analysis and Techniques of Continuous Crystallization; Academic Press: Cambridge, UK, 1988. [Google Scholar]
- Eder, R.J.P.; Schmitt, E.K.; Grill, J.; Radl, S.; Gruber-Woelfler, H.; Khinast, J.G. Seed loading effects on the mean crystal size of acetylsalicylic acid in a continuous-flow crystallization device. Cryst. Res. Technol. 2011, 46, 227–237. [Google Scholar] [CrossRef]
- McGlone, T.; Briggs, N.E.B.; Clark, C.A.; Brown, C.J.; Sefcik, J.; Florence, A.J. Oscillatory flow reactors (OFRs) for continuous manufacturing and crystallization. Org. Process Res. Dev. 2015, 19, 1186–1202. [Google Scholar] [CrossRef]
- Alvarez, A.J.; Myerson, A.S. Continuous plug flow crystallization of pharmaceutical compounds. Cryst. Growth Des. 2010, 10, 2219–2228. [Google Scholar] [CrossRef]
- Lawton, S.; Steele, G.; Shering, P.; Zhao, L.; Laird, I.; Ni, X.-W. Continuous crystallization of pharmaceuticals using a continuous oscillatory baffled crystallizer. Org. Process Res. Dev. 2009, 13, 1357–1363. [Google Scholar] [CrossRef]
- Eder, R.J.P.; Radl, S.; Schmitt, E.; Innerhofer, S.; Maier, M.; Gruber-Woelfler, H.; Khinast, J.G. Continuously seeded, continuously operated tubular crystallizer for the production of active pharmaceutical ingredients. Cryst. Growth Des. 2010, 10, 2247–2257. [Google Scholar] [CrossRef]
- Su, Q.; Benyahia, B.; Nagy, Z.K.; Rielly, C.D. Mathematical modeling, design, and optimization of a multisegment multiaddition plug-flow crystallizer for antisolvent crystallizations. Org. Process Res. Dev. 2015, 19, 1859–1870. [Google Scholar] [CrossRef]
- Vetter, T.; Burcham, C.L.; Doherty, M.F. Regions of attainable particle sizes in continuous and batch crystallization processes. Chem. Eng. Sci. 2014, 106, 167–180. [Google Scholar] [CrossRef]
- Ridder, B.J.; Majumder, A.; Nagy, Z.K. Parametric, optimization-based study on the feasibility of a multisegment antisolvent crystallizer for in situ fines removal and matching of target size distribution. Ind. Eng. Chem. Res. 2016, 55, 2371–2380. [Google Scholar] [CrossRef][Green Version]
- Su, Q.; Ganesh, S.; Moreno, M.; Bommireddy, Y.; Gonzalez, M.; Reklaitis, G.V.; Nagy, Z.K. A perspective on quality-by-control (QbC) in pharmaceutical continuous manufacturing. Comput. Chem. Eng. 2019, 125, 216–231. [Google Scholar] [CrossRef]
- Martinetz, M.C.; Rehrl, J.; Aigner, I.; Sacher, S.; Khinast, J. A continuous operation concept for a rotary tablet press using mass flow operating points. Chem. Ing. Tech. 2017, 89, 1006–1016. [Google Scholar] [CrossRef]
- Metta, N.; Ghijs, M.; Schäfer, E.; Kumar, A.; Cappuyns, P.; Assche, I.; Singh, R.; Ramachandran, R.; de Beer, T.; Ierapetritou, M.; et al. Dynamic flowsheet model development and sensitivity analysis of a continuous pharmaceutical tablet manufacturing process using the wet granulation route. Processes 2019, 7, 234. [Google Scholar] [CrossRef]
- Hsu, S.H.; Reklaitis, G.V.; Venkatasubramanian, V. Modeling and control of roller compaction for pharmaceutical manufacturing. Part I: Process dynamics and control framework. J. Pharm. Innov. 2010, 5, 14–23. [Google Scholar] [CrossRef]
- Hsu, S.H.; Reklaitis, G.V.; Venkatasubramania, V. Modeling and control of roller compaction for pharmaceutical manufacturing: Part II: Control system design. J. Pharm. Innov. 2010, 5, 24–36. [Google Scholar] [CrossRef]
- Bano, G.; Facco, P.; Ierapetritou, M.; Bezzo, F.; Barolo, M. Design space maintenance by online model adaptation in pharmaceutical manufacturing. Comput. Chem. Eng. 2019, 127, 254–271. [Google Scholar] [CrossRef]
- Tian, G.; Koolivand, A.; Arden, N.S.; Lee, S.; O’Connor, T.F. Quality risk assessment and mitigation of pharmaceutical continuous manufacturing using flowsheet modeling approach. Comput. Chem. Eng. 2019, 129, 106508. [Google Scholar] [CrossRef]
- Lee, S.L.; O’Connor, T.F.; Yang, X.; Cruz, C.N.; Chatterjee, S.; Madurawe, R.D.; Moore, C.M.V.; Yu, L.X.; Woodcock, J. Modernizing pharmaceutical manufacturing: From batch to continuous production. J. Pharm. Innov. 2015, 10, 191–199. [Google Scholar] [CrossRef]
- Mascia, S.; Heider, P.L.; Zhang, H.; Lakerveld, R.; Benyahia, B.; Barton, P.I.; Braatz, R.D.; Cooney, C.L.; Evans, J.M.B.; Jamison, T.F.; et al. End-to-end continuous manufacturing of pharmaceuticals: Integrated synthesis, purification, and final dosage formation. Angew. Chem. Int. Ed. 2013, 52, 12359–12363. [Google Scholar] [CrossRef]
- CPI Works with GSK and AstraZeneca on Pharma Manufacturing. Available online: https://www.uk-cpi.com/news/delivering-effective-continuous-wet-granulation-processes (accessed on 20 February 2020).
- How GSK Launched a Continuous Manufacturing Pilot Plant—And What it Learned. Available online: https://www.pharmaceuticalonline.com/doc/how-gsk-launched-a-continuous-manufacturing-pilot-plant-and-what-it-learned-0001 (accessed on 20 February 2020).
- Drug Companies Warm Up to Continuous Manufacturing—American Chemical Society. Available online: https://www.acs.org/content/acs/en/pressroom/presspacs/2019/acs-presspac-may-1-2019/drug-companies-warm-up-to-continuous-manufacturing.html (accessed on 20 February 2020).
- Quality by Design (QbD) for the Continuous Manufacturing of Solid Oral Dosage Forms. Available online: http://pqri.org/wp-content/uploads/2015/11/Embiata-Smith.pdf (accessed on 20 February 2020).
- GSK Invests a Further $77mil to Enhance Antibiotic Manufacturing Facility in Singapore. Available online: http://sg.gsk.com/en-sg/media/press-releases/2015/gsk-invests-a-further-s-77mil-to-enhance-antibiotic-manufacturing-facility-in-singapore/ (accessed on 3 February 2016).
- Palmer, E. GSK Opens $95M Continuous Production Operation in Singapore. Available online: https://www.fiercepharma.com/manufacturing/gsk-opens-130m-continuous-production-facilities-singapore (accessed on 21 February 2020).
- Bailey, C.K.; Caltabiano, S.; Cobitz, A.R.; Huang, C.; Mahar, K.M.; Patel, V.V. A randomized, 29-day, dose-ranging, efficacy and safety study of daprodustat, administered three times weekly in patients with anemia on hemodialysis. BMC Nephrol. 2019, 20, 372. [Google Scholar] [CrossRef] [PubMed]
- FDA Approves Tablet Production on Janssen Continuous Manufacturing Line. Available online: http://www.pharmtech.com/fda-approves-tablet-production-janssen-continuous-manufacturing-line (accessed on 7 October 2016).
- Meet Eli Lilly and Company—2019 Facility of the Year Process Innovation Category Winner | Pharmaceutical Engineering. Available online: https://ispe.org/pharmaceutical-engineering/ispeak/meet-eli-lilly-and-company-2019-facility-year-process-innovation (accessed on 21 February 2020).
- Bédard, A.-C.; Adamo, A.; Aroh, K.C.; Russell, M.G.; Bedermann, A.A.; Torosian, J.; Yue, B.; Jensen, K.F.; Jamison, T.F. Reconfigurable system for automated optimization of diverse chemical reactions. Science 2018, 361, 1220–1225. [Google Scholar] [CrossRef] [PubMed]
- Armstrong, C.T.; Pritchard, C.Q.; Cook, D.W.; Ibrahim, M.; Desai, B.K.; Whitham, P.J.; Marquardt, B.J.; Chen, Y.; Zoueu, J.T.; Bortner, M.J.; et al. Continuous flow synthesis of a pharmaceutical intermediate: A computational fluid dynamics approach. React. Chem. Eng. 2019, 4, 634–642. [Google Scholar] [CrossRef]
- Reizman, B.J.; Jensen, K.F. Simultaneous solvent screening and reaction optimization in microliter slugs. Chem. Commun. 2015, 51, 13290–13293. [Google Scholar] [CrossRef]
- Boros, Z.; Nagy-Győr, L.; Kátai-Fadgyas, K.; Kőhegyi, I.; Ling, I.; Nagy, T.; Iványi, Z.; Oláh, M.; Ruzsics, G.; Temesi, O.; et al. Continuous flow production in the final step of vortioxetine synthesis. piperazine ring formation on a flow platform with a focus on productivity and scalability. J. Flow Chem. 2019, 9, 101–113. [Google Scholar] [CrossRef]
- Wyvratt, B.M.; McMullen, J.P.; Grosser, S.T. Multidimensional dynamic experiments for data-rich process development of reactions in flow. React. Chem. Eng. 2019, 4, 1637–1645. [Google Scholar] [CrossRef]
- Ott, D.; Borukhova, S.; Hessel, V. Life cycle assessment of multi-step rufinamide synthesis – from isolated reactions in batch to continuous microreactor networks. Green Chem. 2016, 18, 1096–1116. [Google Scholar] [CrossRef]
- Ridder, B.J.; Majumder, A.; Nagy, Z.K. Population balance model-based multiobjective optimization of a multisegment multiaddition (MSMA) continuous plug-flow antisolvent crystallizer. Ind. Eng. Chem. Res. 2014, 53, 4387–4397. [Google Scholar] [CrossRef]
- Köllges, T.; Vetter, T. Polymorph selection and process intensification in a continuous crystallization-milling process: A case study on L-glutamic acid crystallized from water. Org. Process Res. Dev. 2019, 23, 361–374. [Google Scholar] [CrossRef]
- Baker, R.E.; Peña, J.M.; Jayamohan, J.; Jérusalem, A. Mechanistic models versus machine learning, a fight worth fighting for the biological community? Biol. Lett. 2018, 14, 20170660. [Google Scholar] [CrossRef]
- Bano, G.; Wang, Z.; Facco, P.; Bezzo, F.; Barolo, M.; Ierapetritou, M. A novel and systematic approach to identify the design space of pharmaceutical processes. Comput. Chem. Eng. 2018, 115, 309–322. [Google Scholar] [CrossRef]
- Wang, Z.; Escotet-Espinoza, M.S.; Ierapetritou, M. Process analysis and optimization of continuous pharmaceutical manufacturing using flowsheet models. Comput. Chem. Eng. 2017, 107, 77–91. [Google Scholar] [CrossRef]
- Bogdan, A.R.; Poe, S.L.; Kubis, D.C.; Broadwater, S.J.; McQuade, D.T. The continuous-flow synthesis of ibuprofen. Angew. Chem. Int. Ed. 2009, 48, 8547–8550. [Google Scholar] [CrossRef] [PubMed]
- Jolliffe, H.G.; Gerogiorgis, D.I. Plantwide design and economic evaluation of two continuous pharmaceutical manufacturing (CPM) cases: Ibuprofen and artemisinin. Comput. Chem. Eng. 2016, 91, 269–288. [Google Scholar] [CrossRef]
- Kopetzki, D.; Levesque, F.; Seeberger, P.H. A continuous-flow process for the synthesis of artemisinin. Chem. Eur. J. 2013, 19, 5450–5456. [Google Scholar] [CrossRef] [PubMed]
- Snead, D.R.; Jamison, T.F. End-to-end continuous flow synthesis and purification of diphenhydramine hydrochloride featuring atom economy, in-line separation, and flow of molten ammonium salts. Chem. Sci. 2013, 4, 2822–2827. [Google Scholar] [CrossRef]
- Diab, S.; Gerogiorgis, D.I. Process modeling, simulation, and technoeconomic evaluation of separation solvents for the continuous pharmaceutical manufacturing (CPM) of diphenhydramine. Org. Process Res. Dev. 2017, 21, 924–946. [Google Scholar] [CrossRef]
- Porta, R.; Benaglia, M.; Coccia, F.; Rossi, S.; Puglisi, A. Enantioselective organocatalysis in microreactors: Continuous flow synthesis of a (S)-pregabalin precursor and (S)-warfarin. Symmetry 2015, 7, 1395–1409. [Google Scholar] [CrossRef]
- Diab, S.; Gerogiorgis, D.I. Process modeling, simulation and technoeconomic optimisation for continuous pharmaceutical manufacturing of (S)-warfarin. Comput. Aided Chem. Eng. 2018, 43, 1643–1648. [Google Scholar]
- Bédard, A.-C.; Longstreet, A.R.; Britton, J.; Wang, Y.; Moriguchi, H.; Hicklin, R.W.; Green, W.H.; Jamison, T.F. Minimizing E-factor in the continuous-flow synthesis of diazepam and atropine. Bioorgan. Med. Chem. 2016, 25, 6233–6241. [Google Scholar] [CrossRef]
- Diab, S.; Gerogiorgis, D.I. Technoeconomic mixed integer nonlinear programming (MINLP) optimization for design of liquid-liquid extraction (LLE) cascades in continuous pharmaceutical manufacturing of atropine. AIChE J. 2019, 65, e16738. [Google Scholar] [CrossRef]
- Verghese, J.; Kong, C.J.; Rivalti, D.; Yu, E.C.; Krack, R.; Alcázar, J.; Manley, J.B.; McQuade, D.T.; Ahmad, S.; Belecki, K.; et al. Increasing global access to the high-volume HIV drug nevirapine through process intensification. Green Chem. 2017, 19, 2986–2991. [Google Scholar] [CrossRef]
- Diab, S.; McQuade, D.T.; Gupton, B.F.; Gerogiorgis, D.I. Process design and optimisation for the continuous manufacturing of nevirapine, an active pharmaceutical ingredient (API) for H.I.V. treatment. Org. Process Res. Dev. 2019, 23, 320–333. [Google Scholar] [CrossRef]
- Roschangar, F.; Sheldon, R.A.; Senanayake, C.H. Overcoming barriers to green chemistry in the pharmaceutical industry—The green aspiration levelTM concept. Green Chem. 2015, 17, 752–768. [Google Scholar] [CrossRef]
- Alder, C.M.; Hayler, J.D.; Henderson, R.K.; Redman, A.M.; Shukla, L.; Shuster, L.E.; Sneddon, H.F. Updating and further expanding GSK’s solvent sustainability guide. Green Chem. 2016, 18, 3879–3890. [Google Scholar] [CrossRef]
- Bertz, S.H. The first general index of molecular complexity. J. Am. Chem. Soc. 1981, 103, 3599–3601. [Google Scholar] [CrossRef]
- Böttcher, T. An additive definition of molecular complexity. J. Chem. Inf. Model. 2016, 56, 462–470. [Google Scholar] [CrossRef]
- Nagy, B.; Marosi, G.; Gerogiorgis, D.I. Multi-parametric statistical analysis of economic data for continuous pharmaceutical manufacturing. Comput. Aided Chem. Eng. 2016, 38, 1045–1050. [Google Scholar]
- Ellerker, M.E.; Diab, S.; Gerogiorgis, D.I. A multiparametric analysis of molecular complexities vs. economic data towards the continuous pharmaceutical manufacturing (CPM) of antibiotics. Comput. Aided Chem. Eng. 2018, 43, 1093–1098. [Google Scholar]
- Jolliffe, H.G.; Gerogiorgis, D.I. Technoeconomic optimization of a conceptual flowsheet for continuous separation of an analgaesic active pharmaceutical ingredient (API). Ind. Eng. Chem. Res. 2017, 56, 4357–4376. [Google Scholar] [CrossRef]
- Gerogiorgis, D.I.; Jolliffe, H.G. Continuous pharmaceutical process engineering and economics. Investigating technical efficiency, environmental impact and economic viability. Chem. Today 2015, 33, 29–32. [Google Scholar]
- Gerogiorgis, D.I.; Barton, P.I. Steady-state optimization of a continuous pharmaceutical process. Comput. Aided Chem. Eng. 2009, 27, 927–932. [Google Scholar]


| API | Application | Separation | Option | No. Stages | Refs. | Methodology | ||
|---|---|---|---|---|---|---|---|---|
| Synth. | Sep. | Synth. | Sep. | |||||
| Ibuprofen | Analgesic | LLE | PhMe | 3 | 1 | [62] | [63] | Simulation |
| nHex | 3 | 1 | [62] | [63] | Simulation | |||
| Artemisinin | Antimalarial | Crystallization | EtOH | 2 | 1 | [64] | [63] | Simulation |
| EtOAc | 2 | 1 | [64] | [63] | Simulation | |||
| Diphenhydramine | Antihistamine | LLE | CyHex | 1 | 1 | [65] | [66] | Simulation |
| MeCyHex | 1 | 1 | [65] | [66] | Simulation | |||
| nHep | 1 | 1 | [65] | [66] | Simulation | |||
| Warfarin | Anticoagulant | LLE | EtOAc | 1 | 1 | [67] | [68] | NLP |
| iPrOAc | 1 | 1 | [67] | [68] | NLP | |||
| iBuOAc | 1 | 1 | [67] | [68] | NLP | |||
| Atropine | Nerve agents | LLE | EtOAc | 2 | 4 | [69] | [70] | MINLP |
| BuOAc | 2 | 4 | [69] | [70] | MINLP | |||
| PhMe | 2 | 4 | [69] | [70] | MINLP | |||
| Nevirapine | HIV treatment | Crystallization | SR = 00% | 3 | 3 | [71] | [72] | NLP |
| SR = 40% | 3 | 3 | [71] | [72] | NLP | |||
| SR = 80% | 3 | 3 | [71] | [72] | NLP | |||
| API | Separation | Option | Recovery (%) | E-Factor (−) | Cost Component (GBP kg−1) | Ref. | ||
|---|---|---|---|---|---|---|---|---|
| CapEx | OpEx | Total | ||||||
| Ibuprofen | LLE | PhMe | 89.2 | 44.7 | 195.9 | 15.3 | 211.2 | [63] |
| nHex | 89.5 | 43.2 | 192.7 | 15.2 | 207.9 | [63] | ||
| Artemisinin | Crystallization | EtOH | 36.1 | 35.1 | 389.6 | 1.5 | 391.2 | [63] |
| EtOAc | 57.7 | 28.1 | 414.9 | 1.7 | 416.6 | [63] | ||
| Diphenhydramine | LLE | CyHex | 88.3 | 27.1 | 89.6 | 64.5 | 154.1 | [66] |
| MeCyHex | 81.1 | 31.1 | 92.8 | 22.7 | 115.5 | [66] | ||
| nHep | 53.1 | 48.2 | 118.4 | 36.3 | 154.7 | [66] | ||
| Warfarin | LLE | EtOAc | 85.7 | 57.1 | 71.5 | 78.5 | 150.0 | [68] |
| iPrOAc | 78.8 | 62.2 | 68.4 | 85.4 | 153.8 | [68] | ||
| iBuOAc | 84.8 | 58.4 | 66.7 | 80.2 | 146.9 | [68] | ||
| Atropine | LLE | Et2O | 79.3 | 50.4 | 90.1 | 122.6 | 212.7 | [70] |
| BuOAc | 77.8 | 68.0 | 91.8 | 126.7 | 218.5 | [70] | ||
| PhMe | 81.0 | 62.9 | 88.5 | 108.7 | 197.2 | [70] | ||
| Nevirapine | Crystallization | SR = 0% | 86.7 | 144.5 | 14.3 | 223.6 | 237.8 | [72] |
| SR = 40% | 86.4 | 89.0 | 14.2 | 147.3 | 161.5 | [72] | ||
| SR = 80% | 85.0 | 30.5 | 13.8 | 64.5 | 78.3 | [72] | ||
© 2020 by the authors. Licensee MDPI, Basel, Switzerland. This article is an open access article distributed under the terms and conditions of the Creative Commons Attribution (CC BY) license (http://creativecommons.org/licenses/by/4.0/).
Share and Cite
Diab, S.; Gerogiorgis, D.I. Design Space Identification and Visualization for Continuous Pharmaceutical Manufacturing. Pharmaceutics 2020, 12, 235. https://doi.org/10.3390/pharmaceutics12030235
Diab S, Gerogiorgis DI. Design Space Identification and Visualization for Continuous Pharmaceutical Manufacturing. Pharmaceutics. 2020; 12(3):235. https://doi.org/10.3390/pharmaceutics12030235
Chicago/Turabian StyleDiab, Samir, and Dimitrios I. Gerogiorgis. 2020. "Design Space Identification and Visualization for Continuous Pharmaceutical Manufacturing" Pharmaceutics 12, no. 3: 235. https://doi.org/10.3390/pharmaceutics12030235
APA StyleDiab, S., & Gerogiorgis, D. I. (2020). Design Space Identification and Visualization for Continuous Pharmaceutical Manufacturing. Pharmaceutics, 12(3), 235. https://doi.org/10.3390/pharmaceutics12030235