
Entry Inhibitors of SARS-CoV-2 Targeting the Transmembrane Domain of the Spike Protein

 , , , , , , ,
  ,
,  and
and
Abstract
1. Introduction
2. Materials and Methods
2.1. Cells and Virus Stocks
2.2. In Vitro Antiviral Compound Screening
2.3. RNA Extraction and Quantitative rtPCR
2.4. Characterization of Thiol Reactivity via Singlet Oxygen Detection Assay
2.5. Purification of S-TMD
2.6. NMR Experiments
2.7. Computation Methods for Inhibitor–Protein Complexes
2.7.1. System Preparation
2.7.2. Molecular Dynamics Simulations
2.7.3. Binding Free Energy Calculations
3. Results
3.1. SARS-CoV-2 Entry Inhibitor Screening
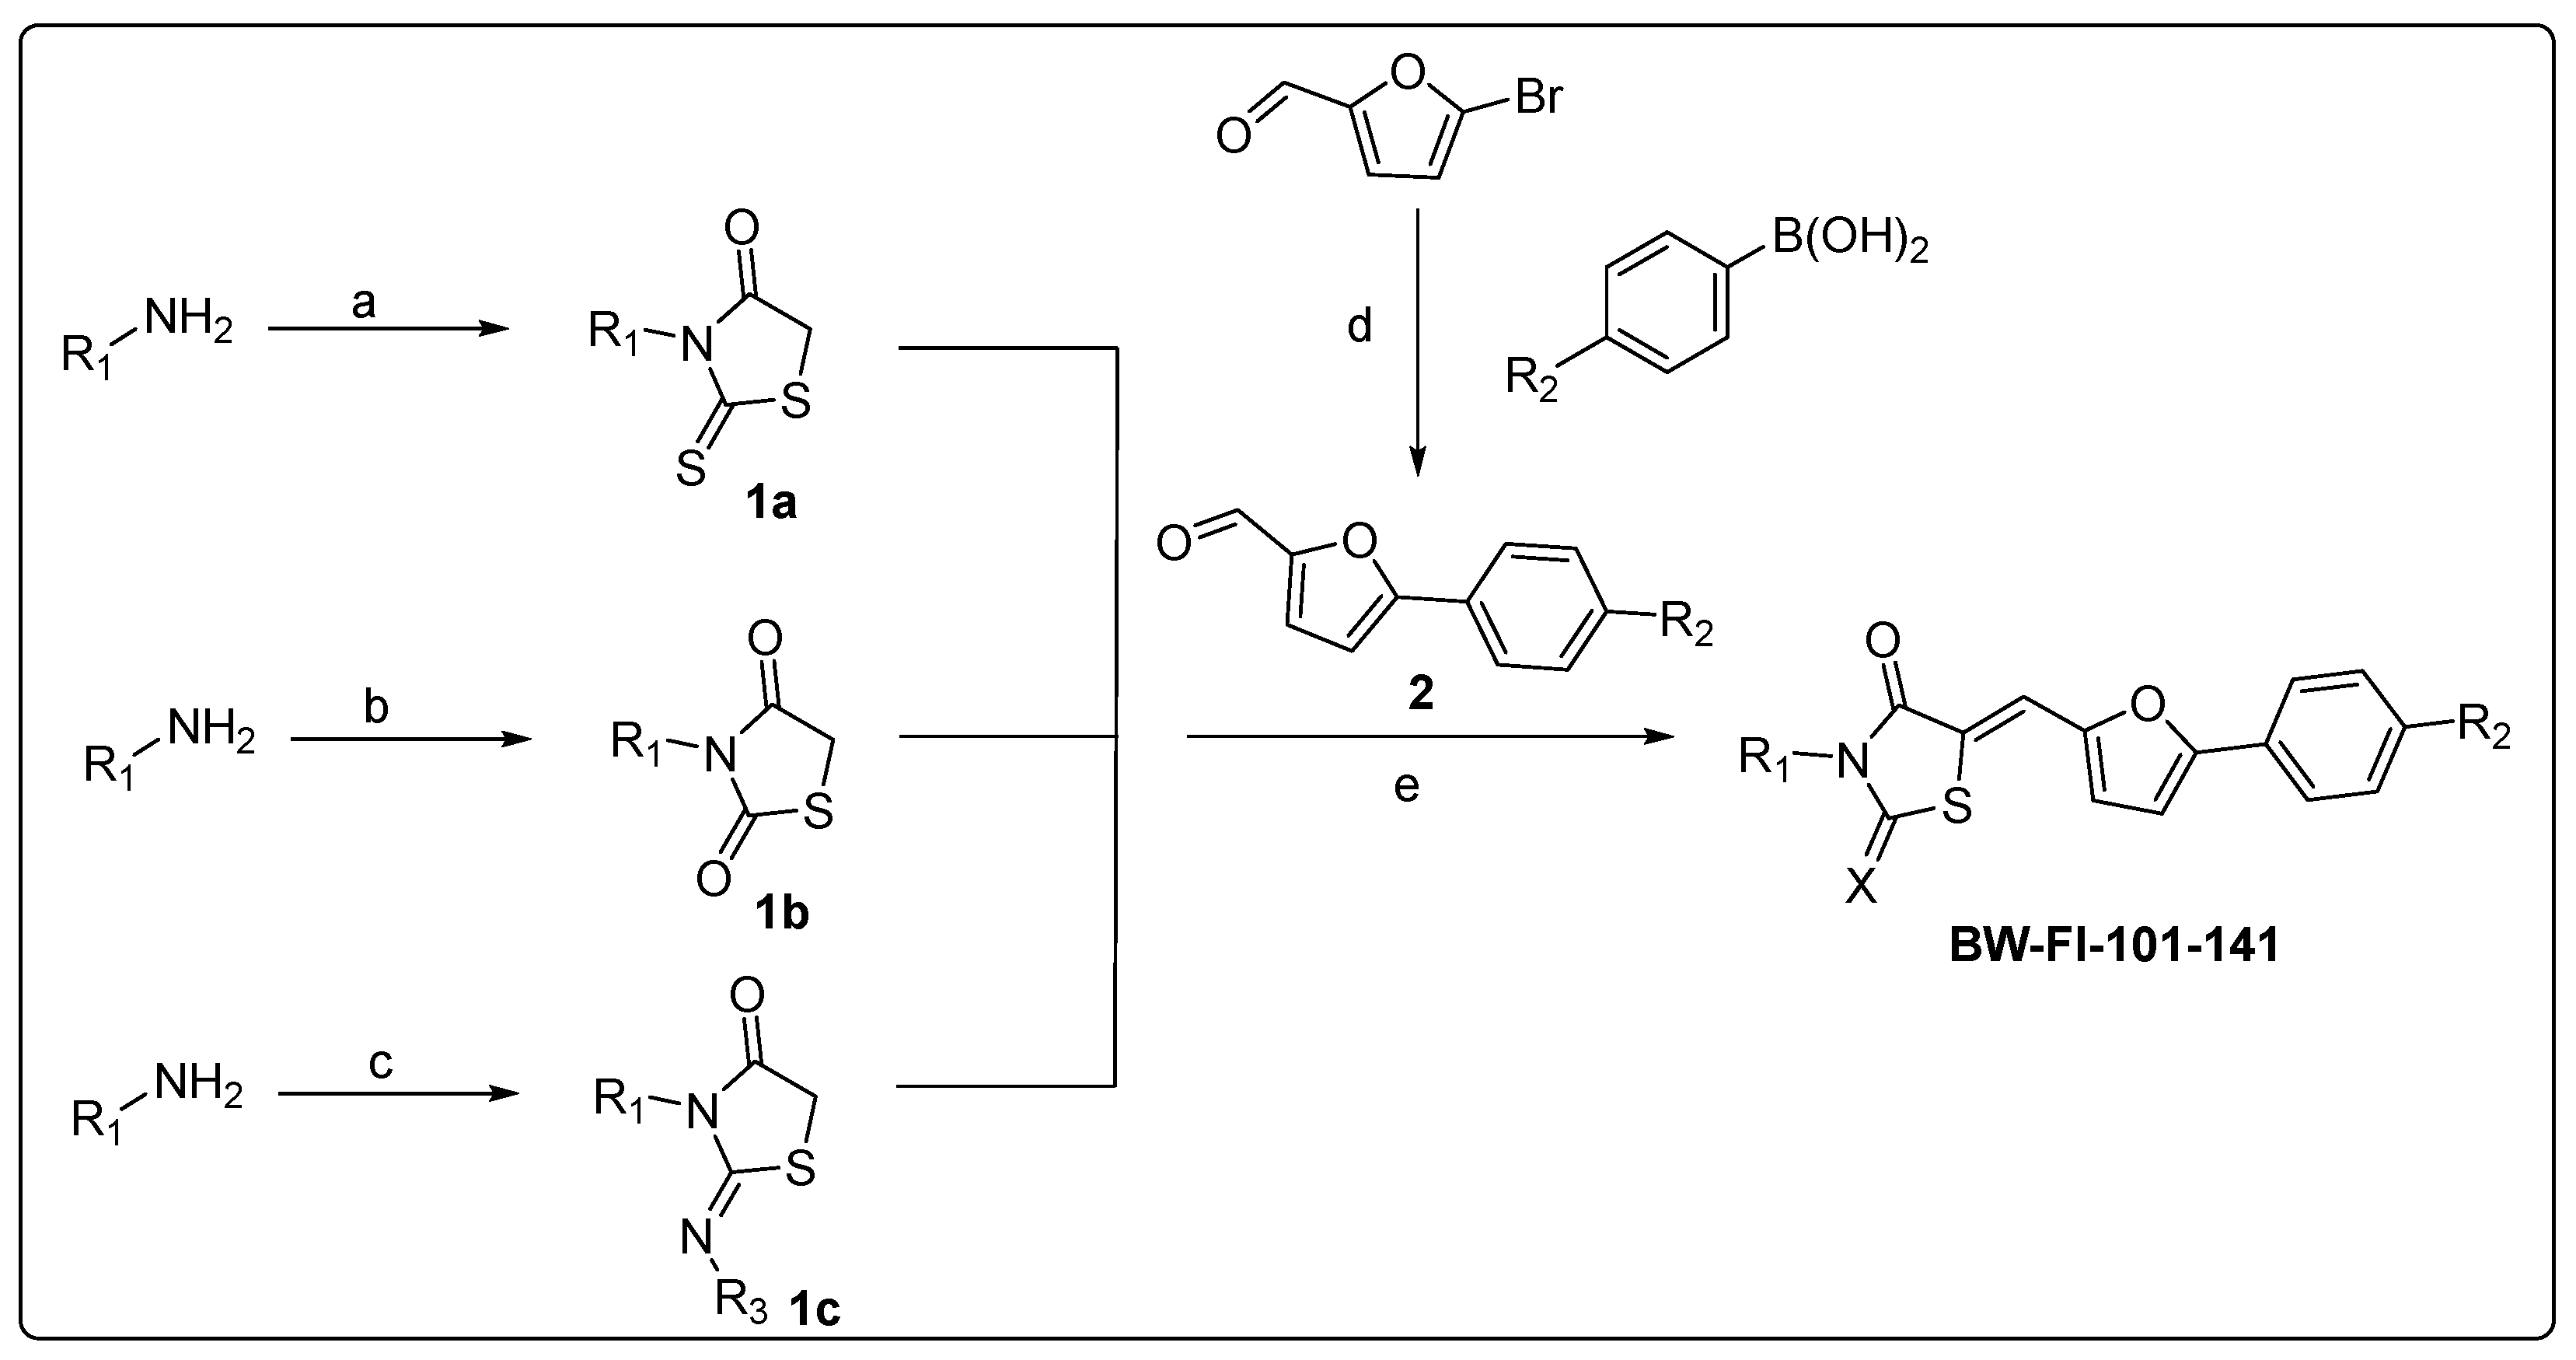
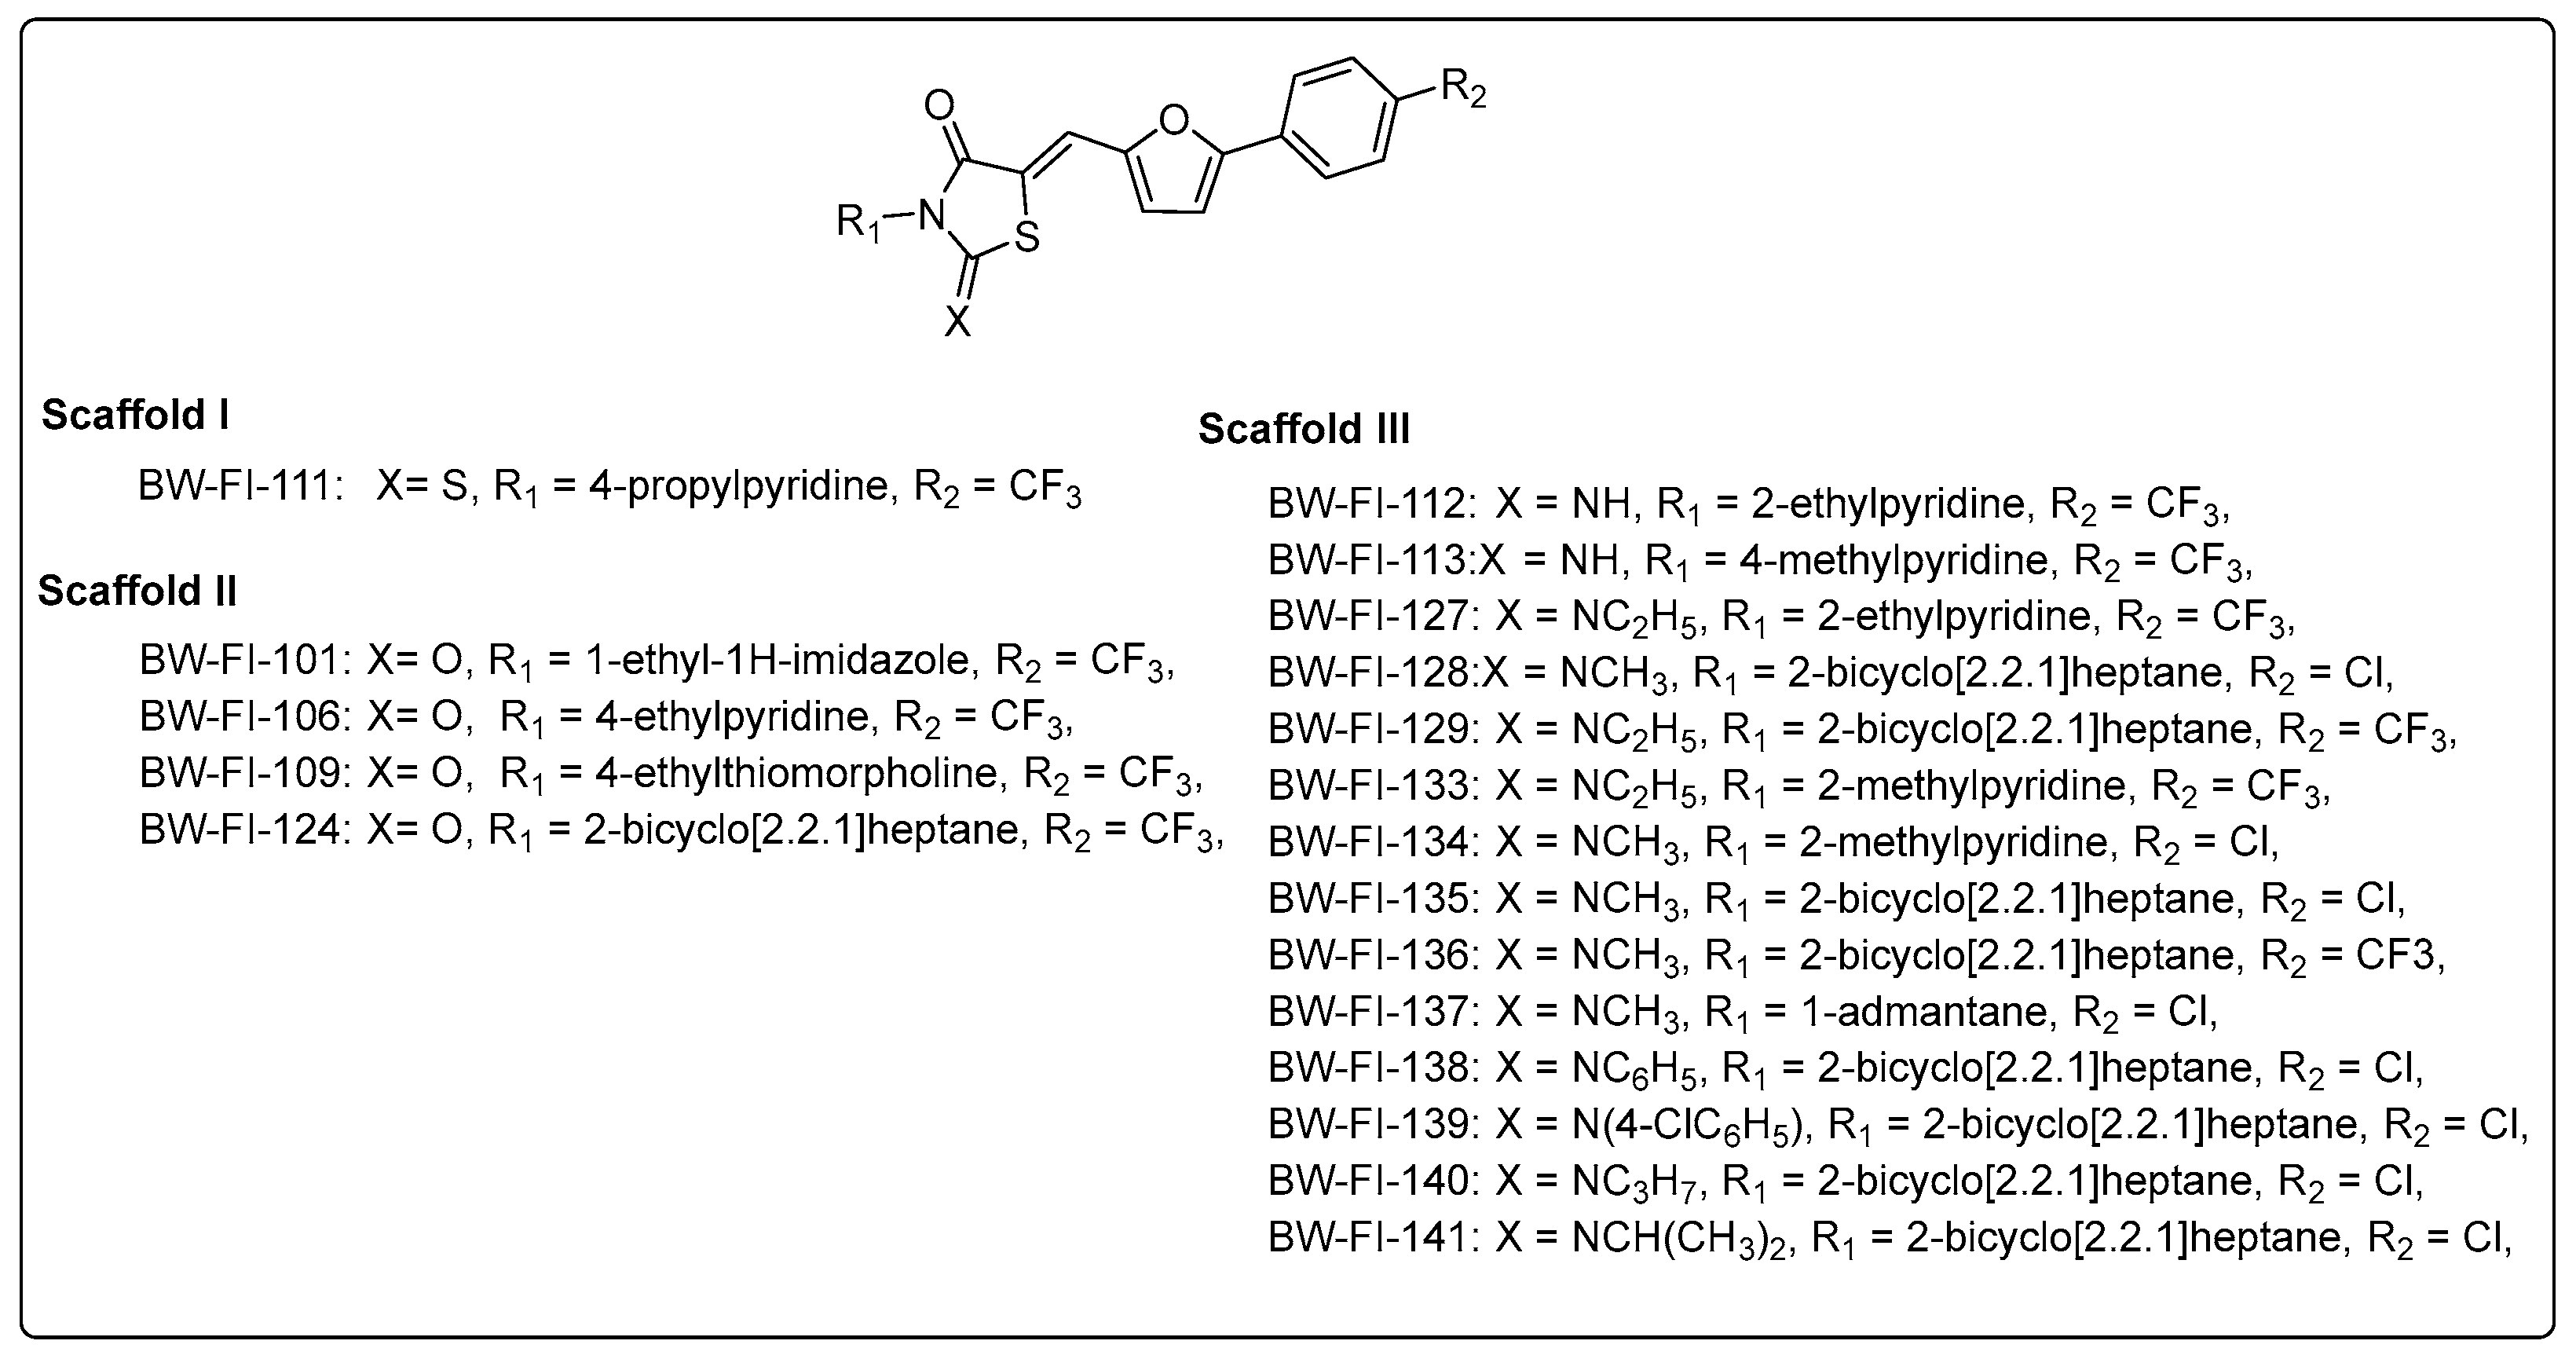
3.2. Analogue Synthesis
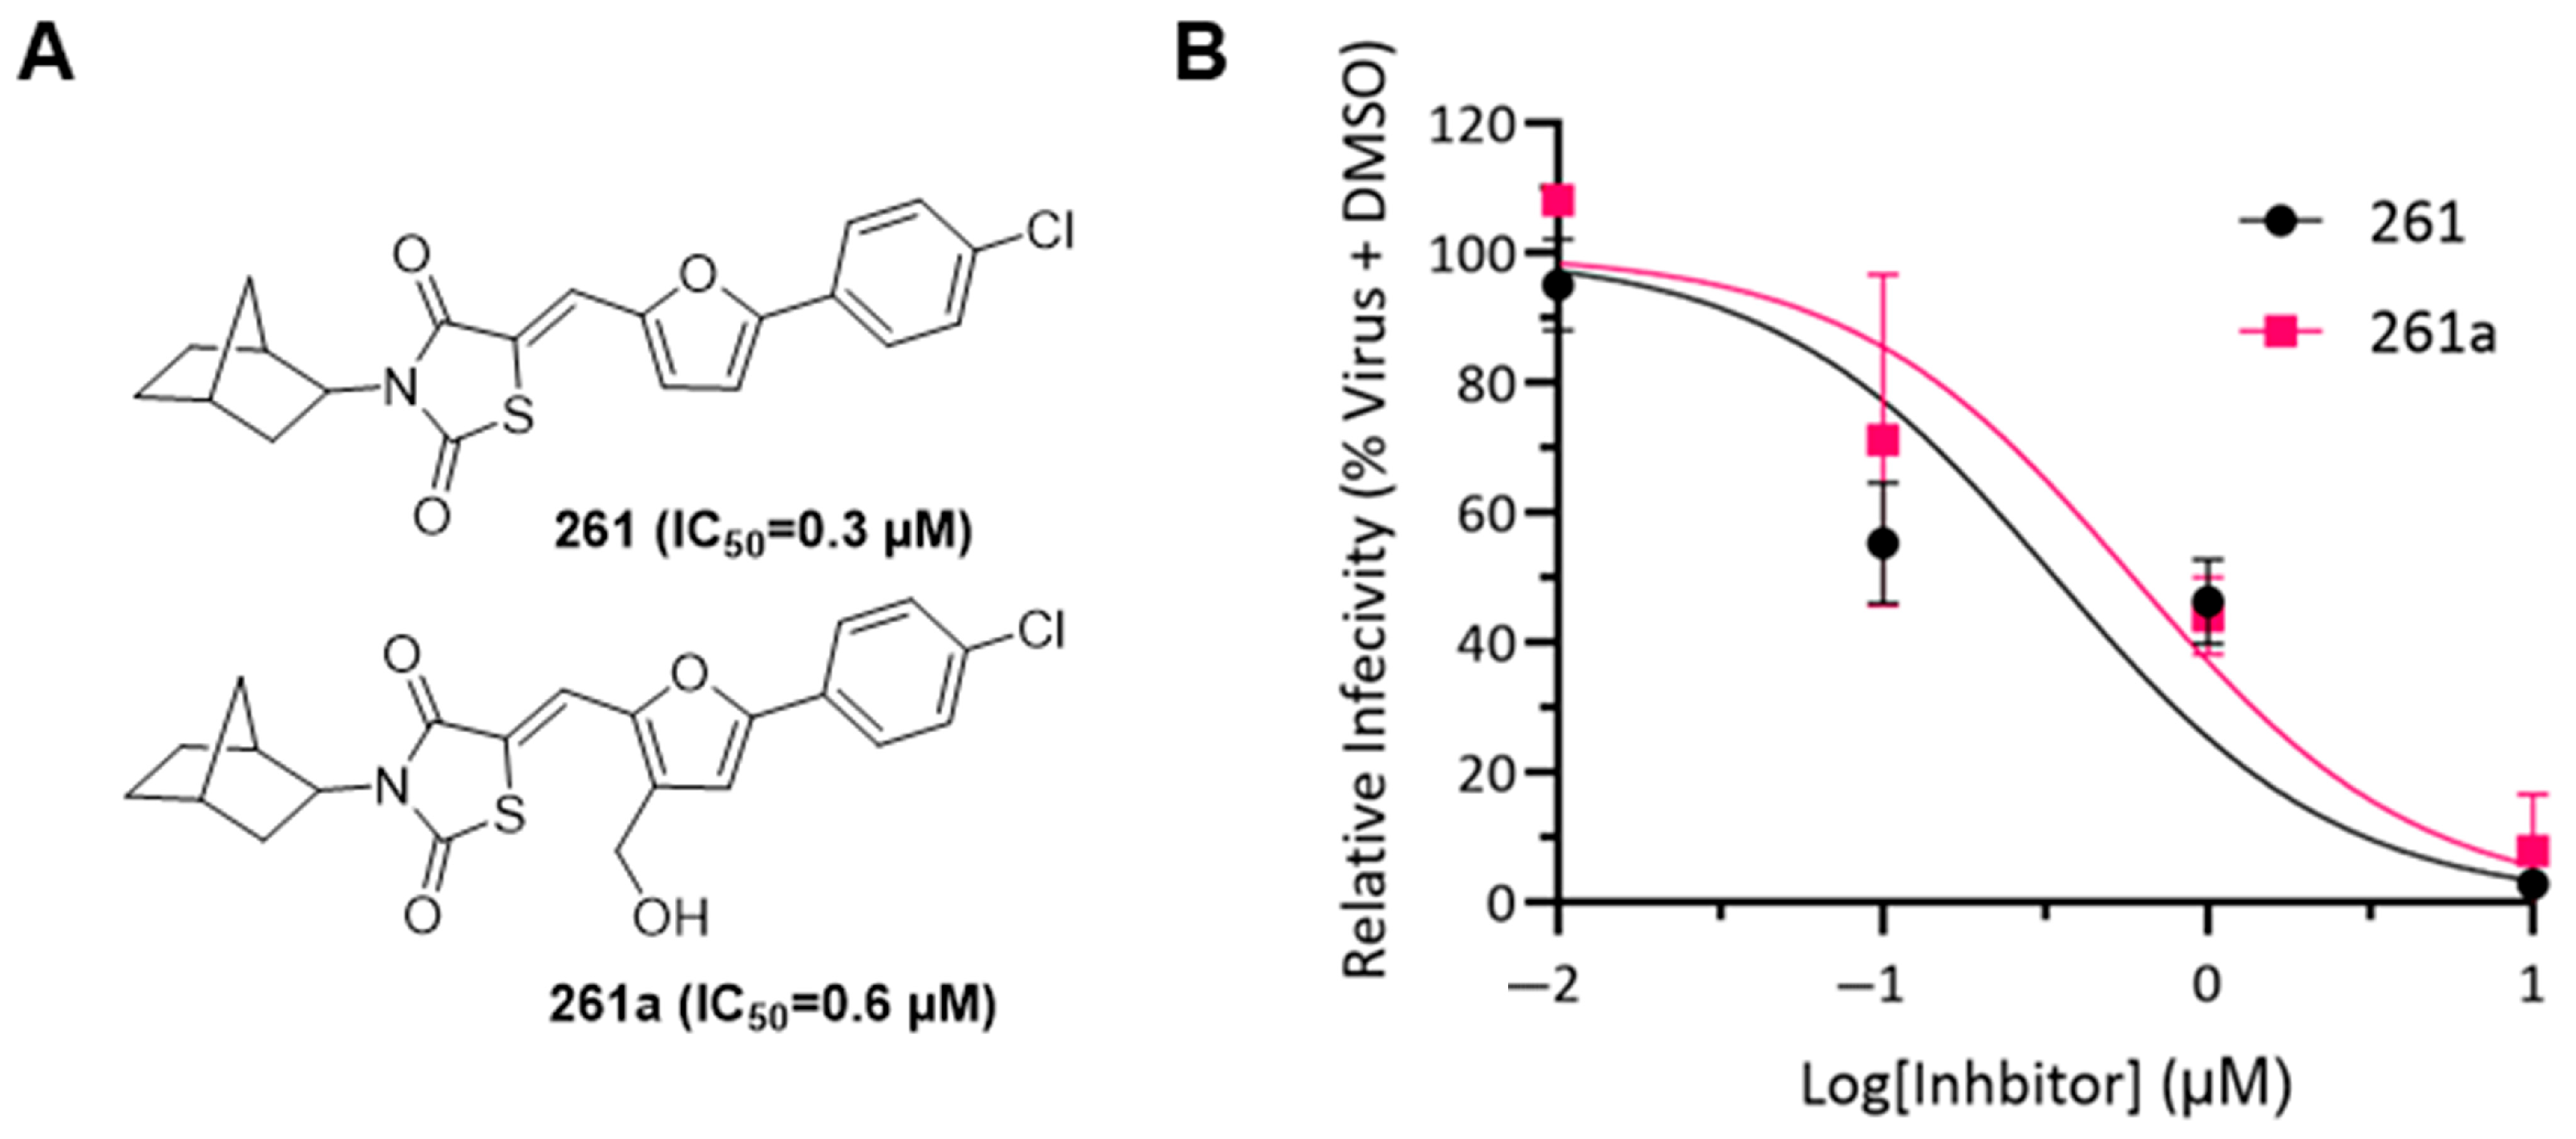
3.3. Chemical Characterization of Compound 261
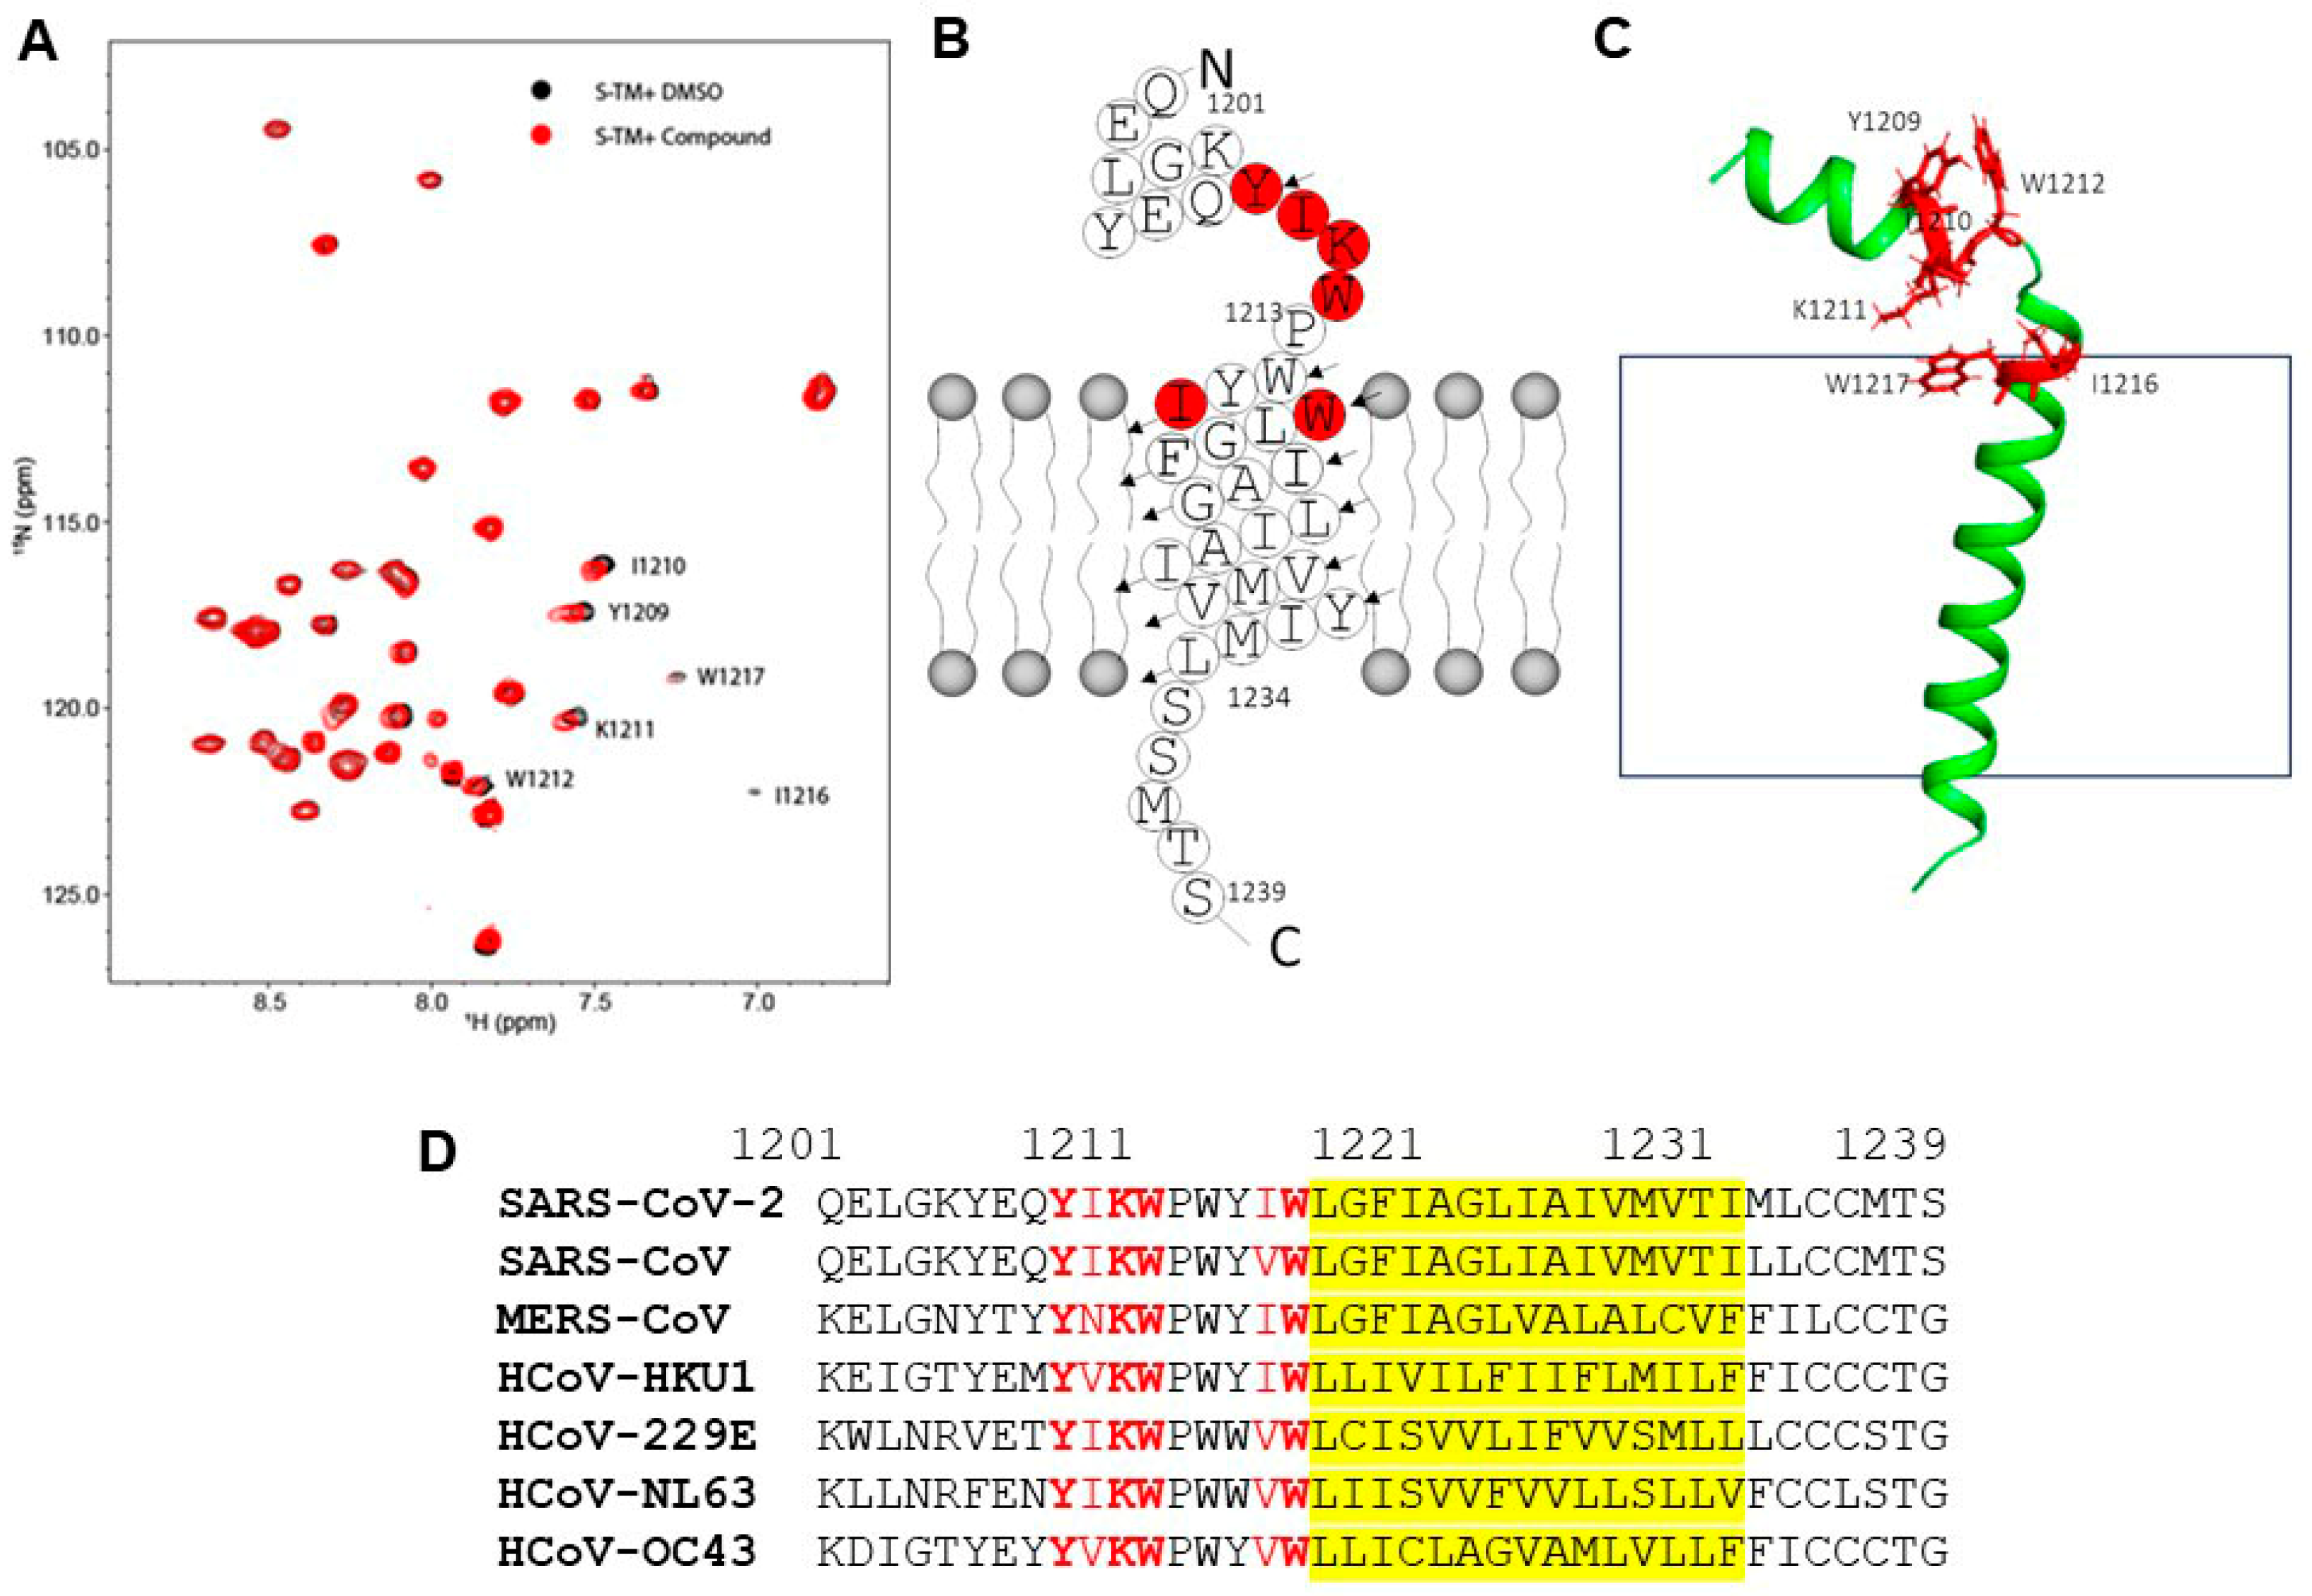
3.4. NMR Structural Characterization of Inhibitor–Transmembrane Domain Interactions
3.5. Compound 261 Binding Site Mapped by Molecular Dynamics Simulation
4. Discussion
5. Conclusions
Supplementary Materials
Author Contributions
Funding
Institutional Review Board Statement
Informed Consent Statement
Data Availability Statement
Acknowledgments
Conflicts of Interest
Abbreviations
| ACE2 | Angiotensin converting enzyme 2 |
| ACN | Acetonitrile |
| CO2 | Carbon dioxide |
| Conf-1 | MD simulation with 261 furan’s oxygen is orientated toward the protein |
| Conf-2 | MD simulation with 261 furan’s oxygen is directed toward the lipid bilayer |
| DHPC | Dihexanoylphosphatidylcholine |
| DMEM | Dulbecco’s modified eagle medium |
| DMPC | 1,2-dimyristoyl-sn-glycero-3-phosphocholine |
| DMSO | Dimethyl sulfoxide |
| E | Envelope |
| E. coli | Escherichia coli |
| FBS | Fetal bovine serum |
| HP1 | Heptad repeat 1 |
| HP2 | Heptad repeat 2 |
| HPLC | High-performance liquid chromatography |
| ITPG | Isopropyl β-D-1-thiogalactopyranoside |
| KDE | Kernel density estimation |
| LED | Light-emitting diode |
| M | Membrane |
| MD | Molecular dynamics |
| MOI | Multiplicity of infection |
| N | Nucleocapsid |
| NMR | Nuclear magnetic resonance |
| OD600 | Optical density at 600 nm |
| PME | Particle-mesh Ewald method |
| RBD | Receptor binding domain |
| Rg | Radius of gyration |
| RMSD | Root-mean-square deviations |
| rtPCR | Reverse transcription polymerase chain reaction |
| S | Spike |
| S1 | Region of spike protein that mediates receptor binding |
| S2 | Region of spike protein that facilitates membrane fusion |
| SAR | Structure–activity relationship |
| SARS-CoV-2 | Severe acute respiratory syndrome coronavirus 2 |
| S-TMD | Elongated transmembrane domain construct used in our study |
| TMD | Transmembrane domain |
| TMDtri | Trimer of transmembrane domain |
| VeroE6 | Cercopithecus aethiops kidney epithelial cells |
| Τp | Coupling constant |
References
- Lu, G.; Wang, Q.; Gao, G.F. Bat-to-human: Spike features determining ‘host jump’ of coronaviruses SARS-CoV, MERS-CoV, and beyond. Trends Microbiol. 2015, 23, 468–478. [Google Scholar] [CrossRef] [PubMed]
- Zhou, P.; Yang, X.L.; Wang, X.G.; Hu, B.; Zhang, L.; Zhang, W.; Si, H.R.; Zhu, Y.; Li, B.; Huang, C.L.; et al. A pneumonia outbreak associated with a new coronavirus of probable bat origin. Nature 2020, 579, 270–273. [Google Scholar] [CrossRef] [PubMed]
- Qin, H.; Ni, H.; Liu, Y.; Yuan, Y.; Xi, T.; Li, X.; Zheng, L. RNA-binding proteins in tumor progression. J. Hematol. Oncol. 2020, 13, 90. [Google Scholar] [CrossRef] [PubMed]
- V’Kovski, P.; Kratzel, A.; Steiner, S.; Stalder, H.; Thiel, V. Coronavirus biology and replication: Implications for SARS-CoV-2. Nat. Rev. Microbiol. 2021, 19, 155–170. [Google Scholar] [CrossRef] [PubMed]
- Koppisetti, R.K.; Fulcher, Y.G.; Van Doren, S.R. Fusion Peptide of SARS-CoV-2 Spike Rearranges into a Wedge Inserted in Bilayered Micelles. J. Am. Chem. Soc. 2021, 143, 13205–13211. [Google Scholar] [CrossRef] [PubMed]
- Niort, K.; Dancourt, J.; Boedec, E.; Al Amir Dache, Z.; Lavieu, G.; Tareste, D. Cholesterol and Ceramide Facilitate Membrane Fusion Mediated by the Fusion Peptide of the SARS-CoV-2 Spike Protein. ACS Omega 2023, 8, 32729–32739. [Google Scholar] [CrossRef] [PubMed]
- Madu, I.G.; Roth, S.L.; Belouzard, S.; Whittaker, G.R. Characterization of a highly conserved domain within the severe acute respiratory syndrome coronavirus spike protein S2 domain with characteristics of a viral fusion peptide. J. Virol. 2009, 83, 7411–7421. [Google Scholar] [CrossRef] [PubMed]
- Baier, C.J.; Barrantes, F.J. Role of cholesterol-recognition motifs in the infectivity of SARS-CoV-2 variants. Coll. Surf. B Biointerfaces 2023, 222, 113090. [Google Scholar] [CrossRef] [PubMed]
- Cai, Y.; Zhang, J.; Xiao, T.; Peng, H.; Sterling, S.M.; Walsh, R.M., Jr.; Rawson, S.; Rits-Volloch, S.; Chen, B. Distinct conformational states of SARS-CoV-2 spike protein. Science 2020, 369, 1586–1592. [Google Scholar] [CrossRef] [PubMed]
- Fan, X.; Cao, D.; Kong, L.; Zhang, X. Cryo-EM analysis of the post-fusion structure of the SARS-CoV spike glycoprotein. Nat. Commun. 2020, 11, 3618. [Google Scholar] [CrossRef] [PubMed]
- Shi, W.; Cai, Y.; Zhu, H.; Peng, H.; Voyer, J.; Rits-Volloch, S.; Cao, H.; Mayer, M.L.; Song, K.; Xu, C.; et al. Cryo-EM structure of SARS-CoV-2 postfusion spike in membrane. Nature 2023, 619, 403–409. [Google Scholar] [CrossRef] [PubMed]
- Li, Q.; Huang, Q.; Kang, C. Secondary Structures of the Transmembrane Domain of SARS-CoV-2 Spike Protein in Detergent Micelles. Int. J. Mol. Sci. 2022, 23, 1040. [Google Scholar] [CrossRef] [PubMed]
- Aliper, E.T.; Efremov, R.G. Inconspicuous Yet Indispensable: The Coronavirus Spike Transmembrane Domain. Int. J. Mol. Sci. 2023, 24, 16421. [Google Scholar] [CrossRef] [PubMed]
- Corver, J.; Broer, R.; van Kasteren, P.; Spaan, W. Mutagenesis of the transmembrane domain of the SARS coronavirus spike glycoprotein: Refinement of the requirements for SARS coronavirus cell entry. Virol. J. 2009, 6, 230. [Google Scholar] [CrossRef] [PubMed]
- Howard, M.W.; Travanty, E.A.; Jeffers, S.A.; Smith, M.K.; Wennier, S.T.; Thackray, L.B.; Holmes, K.V. Aromatic amino acids in the juxtamembrane domain of severe acute respiratory syndrome coronavirus spike glycoprotein are important for receptor-dependent virus entry and cell-cell fusion. J. Virol. 2008, 82, 2883–2894. [Google Scholar] [CrossRef] [PubMed]
- Matthews, T.; Salgo, M.; Greenberg, M.; Chung, J.; DeMasi, R.; Bolognesi, D. Enfuvirtide: The first therapy to inhibit the entry of HIV-1 into host CD4 lymphocytes. Nat. Rev. Drug Discov. 2004, 3, 215–225. [Google Scholar] [CrossRef] [PubMed]
- Su, S.; Xu, W.; Jiang, S. Virus Entry Inhibitors: Past, Present, and Future. In Virus Entry Inhibitors: Stopping the Enemy at the Gate; Jiang, S., Lu, L., Eds.; Springer: Singapore, 2022; pp. 1–13. [Google Scholar]
- Grunst, M.W.; Qin, Z.; Dodero-Rojas, E.; Ding, S.; Prevost, J.; Chen, Y.; Hu, Y.; Pazgier, M.; Wu, S.; Xie, X.; et al. Structure and inhibition of SARS-CoV-2 spike refolding in membranes. Science 2024, 385, 757–765. [Google Scholar] [CrossRef]
- Sanders, D.W.; Jumper, C.C.; Ackerman, P.J.; Bracha, D.; Donlic, A.; Kim, H.; Kenney, D.; Castello-Serrano, I.; Suzuki, S.; Tamura, T.; et al. SARS-CoV-2 requires cholesterol for viral entry and pathological syncytia formation. Elife 2021, 10, 65962. [Google Scholar] [CrossRef] [PubMed]
- Rowse, M.; Qiu, S.; Tsao, J.; Xian, T.; Khawaja, S.; Yamauchi, Y.; Yang, Z.; Wang, G.; Luo, M. Characterization of potent fusion inhibitors of influenza virus. PLoS ONE 2015, 10, e0122536. [Google Scholar] [CrossRef] [PubMed]
- Kumari, P.; Rothan, H.A.; Natekar, J.P.; Stone, S.; Pathak, H.; Strate, P.G.; Arora, K.; Brinton, M.A.; Kumar, M. Neuroinvasion and Encephalitis Following Intranasal Inoculation of SARS-CoV-2 in K18-hACE2 Mice. Viruses 2021, 13, 132. [Google Scholar] [CrossRef] [PubMed]
- Natekar, J.P.; Pathak, H.; Stone, S.; Kumari, P.; Sharma, S.; Auroni, T.T.; Arora, K.; Rothan, H.A.; Kumar, M. Differential Pathogenesis of SARS-CoV-2 Variants of Concern in Human ACE2-Expressing Mice. Viruses 2022, 14, 1139. [Google Scholar] [CrossRef] [PubMed]
- Elsharkawy, A.; Stone, S.; Guglani, A.; Patterson, L.D.; Ge, C.; Dim, C.; Miano, J.M.; Kumar, M. Omicron XBB.1.5 subvariant causes severe pulmonary disease in K18-hACE-2 mice. Front. Microbiol. 2024, 15, 1466980. [Google Scholar] [CrossRef] [PubMed]
- Abramson, J.; Adler, J.; Dunger, J.; Evans, R.; Green, T.; Pritzel, A.; Ronneberger, O.; Willmore, L.; Ballard, A.J.; Bambrick, J.; et al. Accurate structure prediction of biomolecular interactions with AlphaFold 3. Nature 2024, 630, 493–500. [Google Scholar] [CrossRef] [PubMed]
- Waterhouse, A.; Bertoni, M.; Bienert, S.; Studer, G.; Tauriello, G.; Gumienny, R.; Heer, F.T.; de Beer, T.A.P.; Rempfer, C.; Bordoli, L.; et al. SWISS-MODEL: Homology modelling of protein structures and complexes. Nucleic Acids Res. 2018, 46, W296–W303. [Google Scholar] [CrossRef] [PubMed]
- Jo, S.; Kim, T.; Im, W. Automated builder and database of protein/membrane complexes for molecular dynamics simulations. PLoS ONE 2007, 2, e880. [Google Scholar] [CrossRef]
- Wu, E.L.; Cheng, X.; Jo, S.; Rui, H.; Song, K.C.; Davila-Contreras, E.M.; Qi, Y.; Lee, J.; Monje-Galvan, V.; Venable, R.M.; et al. CHARMM-GUI Membrane Builder toward realistic biological membrane simulations. J. Comput. Chem. 2014, 35, 1997–2004. [Google Scholar] [CrossRef] [PubMed]
- Joung, I.S.; Cheatham, T.E., 3rd. Determination of alkali and halide monovalent ion parameters for use in explicitly solvated biomolecular simulations. J. Phys. Chem. B 2008, 112, 9020–9041. [Google Scholar] [CrossRef] [PubMed]
- Case, D.A.; Aktulga, H.M.; Belfon, K.; Ben-Shalom, I.Y.; Berryman, J.T.; Brozell, S.R.; Cerutti, D.S.; Cheatham III, T.E.; Cisneros, G.A.; Cruzeiro, V.W.D.; et al. Amber 2023; University of California: San Francisco, CA, USA, 2022. [Google Scholar]
- Tian, C.; Kasavajhala, K.; Belfon, K.A.A.; Raguette, L.; Huang, H.; Migues, A.N.; Bickel, J.; Wang, Y.; Pincay, J.; Wu, Q.; et al. ff19SB: Amino-Acid-Specific Protein Backbone Parameters Trained against Quantum Mechanics Energy Surfaces in Solution. J. Chem. Theory Comput. 2020, 16, 528–552. [Google Scholar] [CrossRef] [PubMed]
- Dickson, C.J.; Walker, R.C.; Gould, I.R. Lipid21: Complex Lipid Membrane Simulations with AMBER. J. Chem. Theory Comput. 2022, 18, 1726–1736. [Google Scholar] [CrossRef] [PubMed]
- Price, D.J.; Brooks, C.L., 3rd. A modified TIP3P water potential for simulation with Ewald summation. J. Chem. Phys. 2004, 121, 10096–10103. [Google Scholar] [CrossRef] [PubMed]
- Wang, J.; Wolf, R.M.; Caldwell, J.W.; Kollman, P.A.; Case, D.A. Development and testing of a general amber force field. J. Comput. Chem. 2004, 25, 1157–1174. [Google Scholar] [CrossRef] [PubMed]
- Jakalian, A.; Jack, D.B.; Bayly, C.I. Fast, efficient generation of high-quality atomic charges. AM1-BCC model: II. Parameterization and validation. J. Comput. Chem. 2002, 23, 1623–1641. [Google Scholar] [CrossRef] [PubMed]
- Essmann, U.; Perera, L.; Berkowitz, M.L.; Darden, T.; Lee, H.; Pedersen, L.G. A smooth particle mesh Ewald method. J. Chem. Phys. 1995, 103, 8577–8593. [Google Scholar] [CrossRef]
- Ryckaert, J.-P.; Ciccotti, G.; Berendsen, H.J.C. Numerical integration of the cartesian equations of motion of a system with constraints: Molecular dynamics of n-alkanes. J. Comput. Phys. 1977, 23, 327–341. [Google Scholar] [CrossRef]
- Roe, D.R.; Cheatham, T.E., 3rd. PTRAJ and CPPTRAJ: Software for Processing and Analysis of Molecular Dynamics Trajectory Data. J. Chem. Theory Comput. 2013, 9, 3084–3095. [Google Scholar] [CrossRef] [PubMed]
- Wang, C.; Nguyen, P.H.; Pham, K.; Huynh, D.; Le, T.B.; Wang, H.; Ren, P.; Luo, R. Calculating protein-ligand binding affinities with MMPBSA: Method and error analysis. J. Comput. Chem. 2016, 37, 2436–2446. [Google Scholar] [CrossRef] [PubMed]
- Miller, B.R., 3rd; McGee, T.D., Jr.; Swails, J.M.; Homeyer, N.; Gohlke, H.; Roitberg, A.E. MMPBSA.py: An Efficient Program for End-State Free Energy Calculations. J. Chem. Theory. Comput. 2012, 8, 3314–3321. [Google Scholar] [CrossRef] [PubMed]
- Rowse, M.; Qiu, S.; Tsao, J.; Yamauchi, Y.; Wang, G.; Luo, M. Reduction of Influenza Virus Envelope’s Fusogenicity by Viral Fusion Inhibitors. ACS Infect. Dis. 2016, 2, 47–53. [Google Scholar] [CrossRef] [PubMed]
- Dahlen, A.D.; Dashi, G.; Maslov, I.; Attwood, M.M.; Jonsson, J.; Trukhan, V.; Schioth, H.B. Trends in Antidiabetic Drug Discovery: FDA Approved Drugs, New Drugs in Clinical Trials and Global Sales. Front. Pharmacol. 2021, 12, 807548. [Google Scholar] [CrossRef] [PubMed]
- Daina, A.; Michielin, O.; Zoete, V. SwissADME: A free web tool to evaluate pharmacokinetics, drug-likeness and medicinal chemistry friendliness of small molecules. Sci. Rep. 2017, 7, 42717. [Google Scholar] [CrossRef] [PubMed]
- Fu, Q.; Chou, J.J. A Trimeric Hydrophobic Zipper Mediates the Intramembrane Assembly of SARS-CoV-2 Spike. J. Am. Chem. Soc. 2021, 143, 8543–8546. [Google Scholar] [CrossRef] [PubMed]


| Structure |  | |||
|---|---|---|---|---|
| R1 | X | R4 | R5 | |
| Class I (23) |  | S | 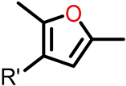 R’ = H or | 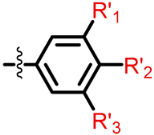 R’1, R’2, R’3 = H, F, Cl, OH, OCH3 |
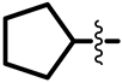 | O |  or or | ||
| Class II (53) | 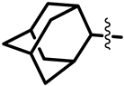 | R’=  | R’ =  | |
Disclaimer/Publisher’s Note: The statements, opinions and data contained in all publications are solely those of the individual author(s) and contributor(s) and not of MDPI and/or the editor(s). MDPI and/or the editor(s) disclaim responsibility for any injury to people or property resulting from any ideas, methods, instructions or products referred to in the content. |
© 2025 by the authors. Licensee MDPI, Basel, Switzerland. This article is an open access article distributed under the terms and conditions of the Creative Commons Attribution (CC BY) license (https://creativecommons.org/licenses/by/4.0/).
Share and Cite
Lyles, K.V.; Stone, S.; Singh, P.; Patterson, L.D.; Natekar, J.; Pathak, H.; Varshnaya, R.K.; Elsharkawy, A.; Liu, D.; Bansal, S.; et al. Entry Inhibitors of SARS-CoV-2 Targeting the Transmembrane Domain of the Spike Protein. Viruses 2025, 17, 989. https://doi.org/10.3390/v17070989
Lyles KV, Stone S, Singh P, Patterson LD, Natekar J, Pathak H, Varshnaya RK, Elsharkawy A, Liu D, Bansal S, et al. Entry Inhibitors of SARS-CoV-2 Targeting the Transmembrane Domain of the Spike Protein. Viruses. 2025; 17(7):989. https://doi.org/10.3390/v17070989
Chicago/Turabian StyleLyles, Kristin V., Shannon Stone, Priti Singh, Lila D. Patterson, Janhavi Natekar, Heather Pathak, Rohit K. Varshnaya, Amany Elsharkawy, Dongning Liu, Shubham Bansal, and et al. 2025. "Entry Inhibitors of SARS-CoV-2 Targeting the Transmembrane Domain of the Spike Protein" Viruses 17, no. 7: 989. https://doi.org/10.3390/v17070989
APA StyleLyles, K. V., Stone, S., Singh, P., Patterson, L. D., Natekar, J., Pathak, H., Varshnaya, R. K., Elsharkawy, A., Liu, D., Bansal, S., Faniyi, O. O., Tang, S., Yang, X., Mulpuri, N., Hamelberg, D., Kang, C., Wang, B., Kumar, M., & Luo, M. (2025). Entry Inhibitors of SARS-CoV-2 Targeting the Transmembrane Domain of the Spike Protein. Viruses, 17(7), 989. https://doi.org/10.3390/v17070989