I interviewed 18 log truck owners from all of Georgia’s major timber producing regions (
Table 1). Participants represented all of the major types of log truck owners: logging businesses, wood dealers, owner-operator contract haulers, and large diversified trucking businesses. Fleet size ranged from zero trucks to more than 50 trucks. The participant with zero trucks had many years of experience managing a trucking fleet, but had ceased timber hauling within the previous 12 months, due, in large part, to rising truck insurance premiums.
3.1. Log Truck Drivers
Participants employed between 0 and 65 log truck drivers, with an average of 12.6 drivers per firm. All participants agreed (72% strongly agreed) with the statement that it was difficult to find qualified truck drivers, which agrees with research results from the Northeast U.S. [
18]. Likewise, all participants agreed and 72% strongly agreed that it was more difficult to find truck drivers than it was five years prior in 2012. Three of the logging business owners had family members driving log trucks and two of them personally drove log trucks at least occasionally. Truck driver turnover varied significantly between firms. Twelve participants stated they had low (<25% per year) or no turnover. One company had employed one of its truck drivers since the 1960s. Another company experienced 70% turnover per year, but many of the drivers that left the company returned at some point. Another company stated that employees sometimes receive multiple job offers per week from competing firms, which led to high turnover. One company, which employed seven truck drivers, went four consecutive years without driver turnover until two drivers departed recently.
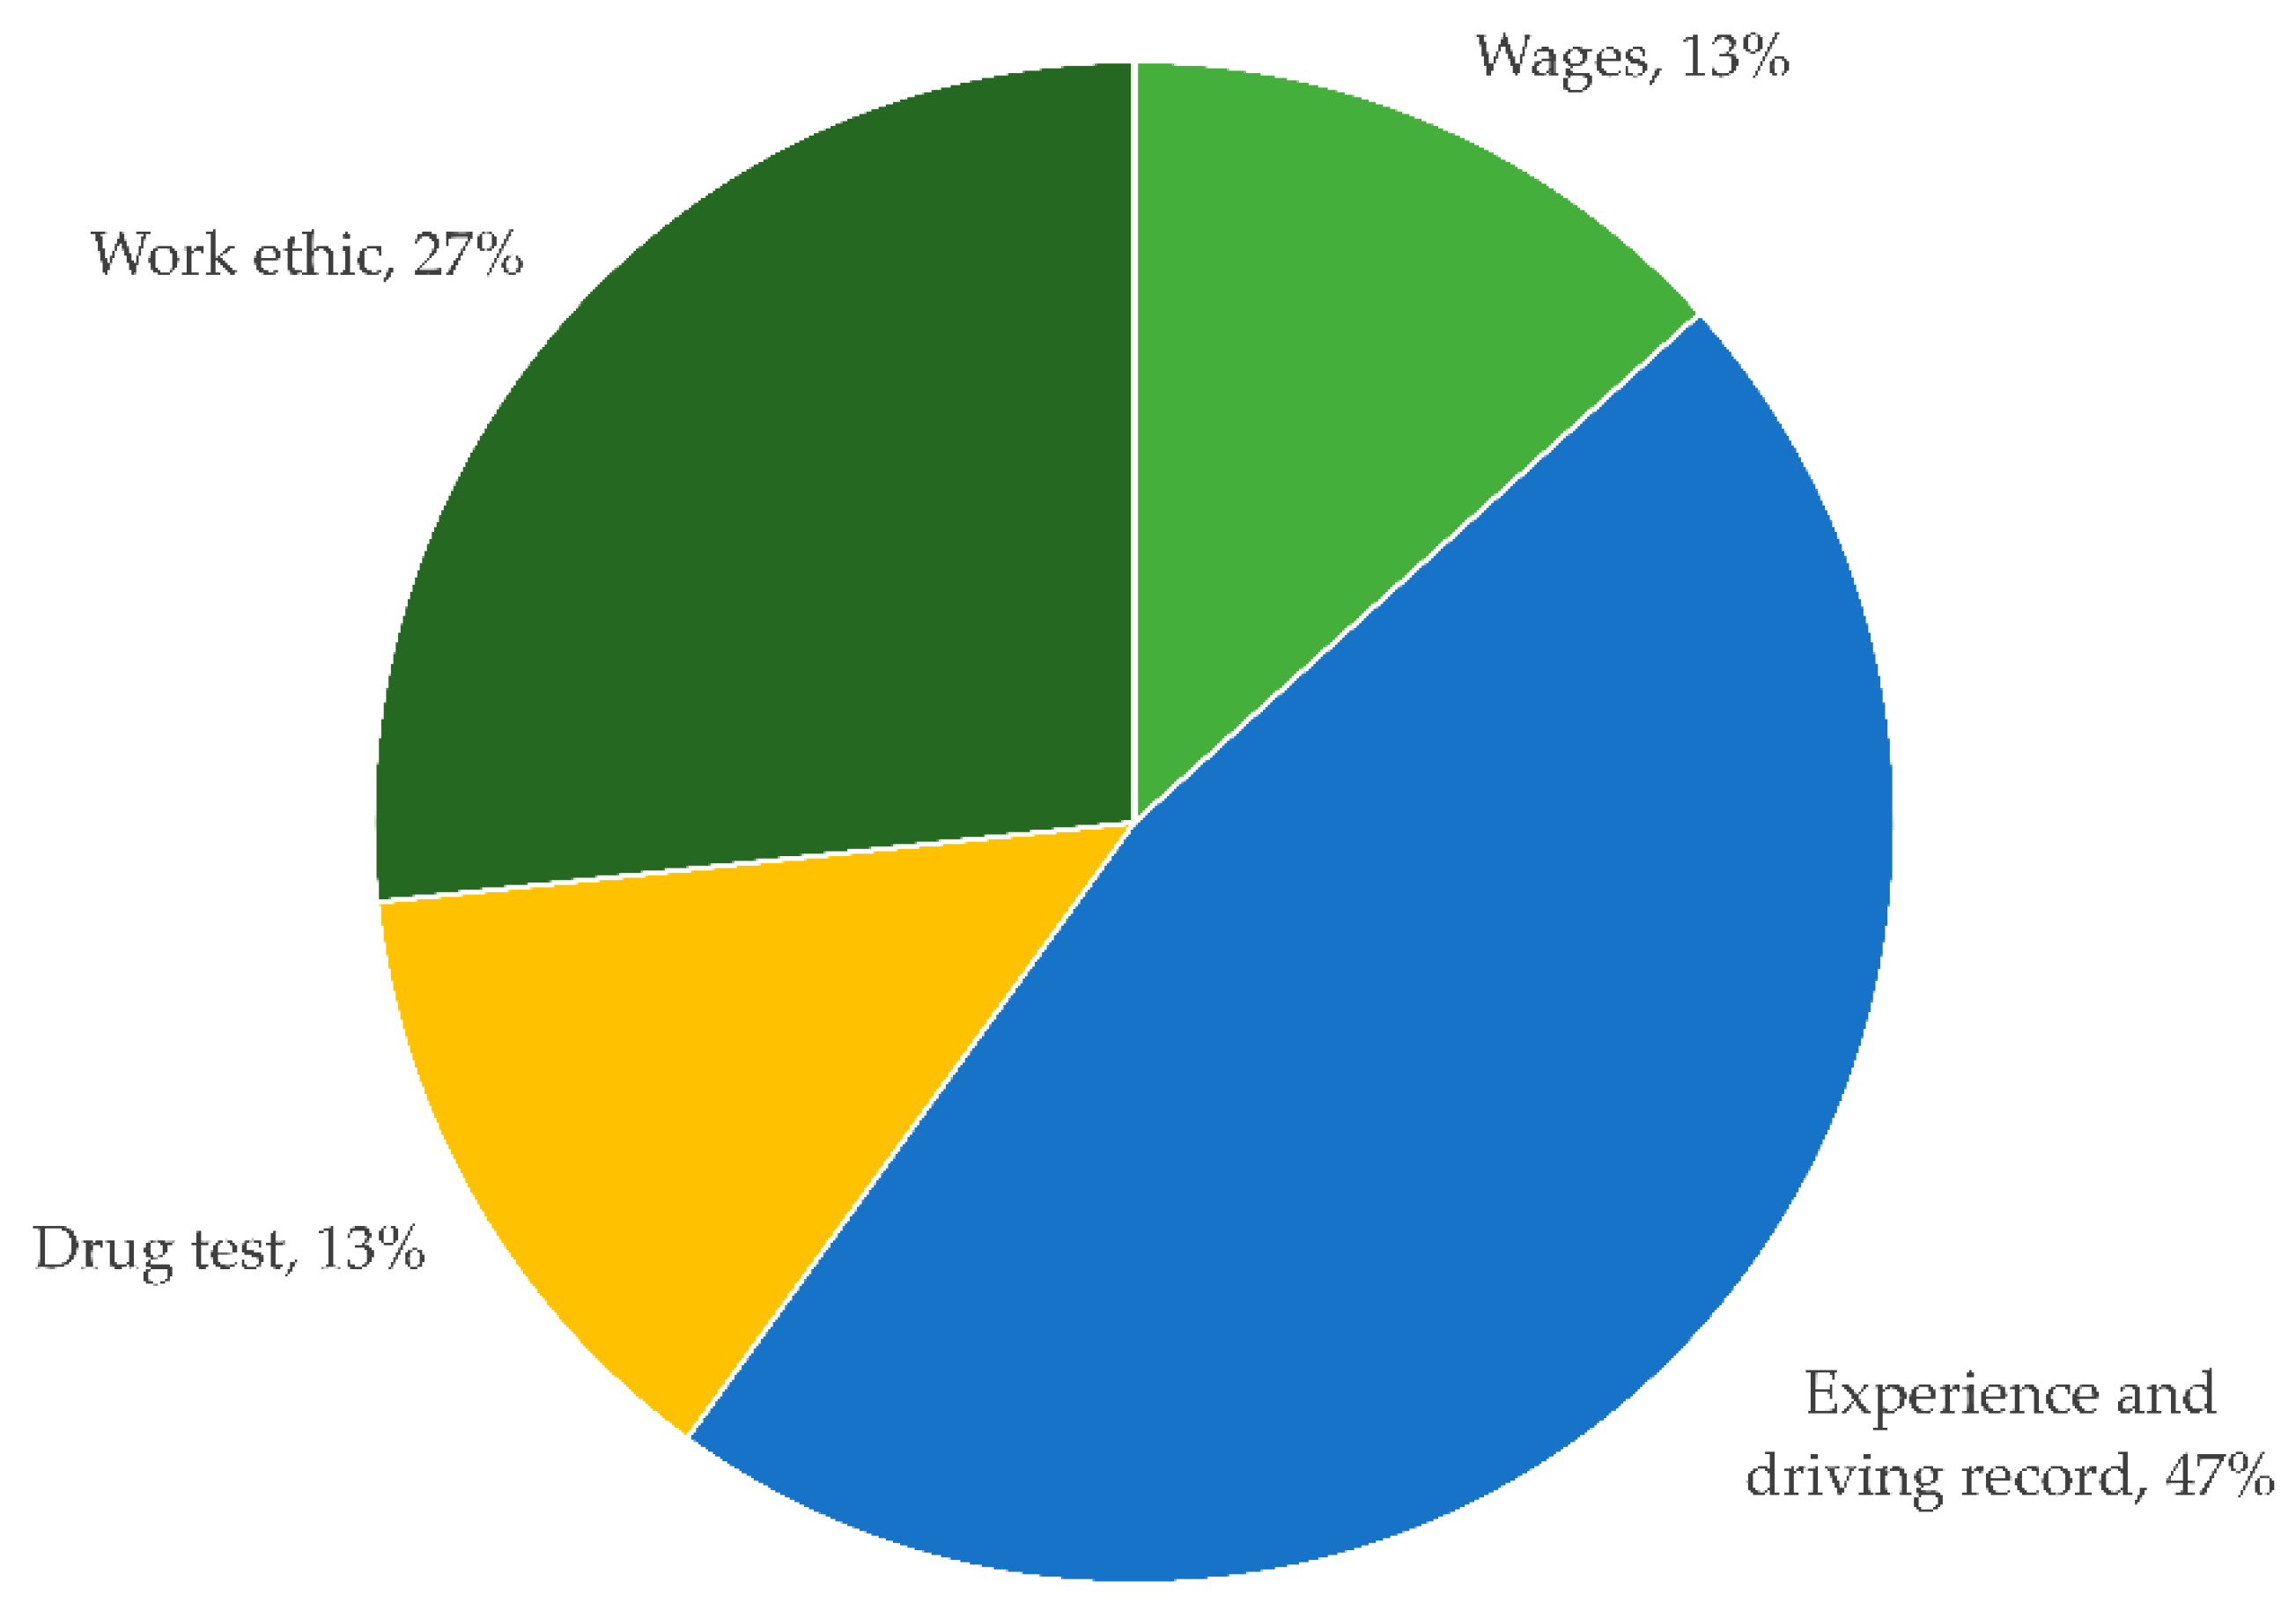
Most companies recruited through word of mouth and often trusted their existing drivers to recommend new drivers. One company used social media and provided compliments (e.g., bottles of water) at various meetings to recruit new drivers. The problem for many was not a lack of applicants, but rather a lack of qualified applicants. Nearly half of participants identified driving record or experience first as a barrier to hiring new drivers (
Figure 1). While requirements vary, most insurance companies require log truck drivers to be at least 25 years old and have two years of experience driving a log truck, which makes it difficult to expand the pool of existing log truck drivers. Twenty-two percent of participants suggested low wages were a major barrier to recruiting new drivers. Likewise, 22% suggested an unwillingness of potential drivers to work as a major barrier to attracting new drivers (13% listed work ethic first). Twenty-two percent of participants stated drug tests were a barrier to hiring new drivers (13% listed this first).
Firms compensated their drivers in a variety of ways. Three firms paid hourly wages, three paid a salary, two paid a percentage of gross receipts from the truck, one paid a rate per ton, one paid per km, and others used a combination of these methods. While payment rates and methodologies differed between companies, it appeared that drivers could earn between USD
$30,000 and
$50,000 year
−1. Some form of benefits were provided by 58% of respondents to their drivers. Baker and Mendell [
19] found similar wage rates and concluded that log truck drivers in the Southern U.S. earned wages comparable to other local trucking occupations. Over-the-road truck drivers often earn higher wages than log truck drivers, but these drivers face many nights away from home and consequently may have lower quality of life than log truck drivers. The American Transportation Research Institute (ATRI) estimated that average annual truck driver wages were USD
$54,363 plus
$16,111 in benefits [
21], which is higher than the wages documented in this study, especially when fringe benefits are included.
3.2. Fleet Characteristics
Participants owned an average of 15 trucks (median = 9). Average fleet size was higher than typical for logging businesses in Georgia [
22], but all fleet sizes were represented (
Table 1). The most recent survey by ATRI found an average fleet size of 838 trucks across all trucking industries (median = 97) [
21], which confirms that log truck fleets are generally smaller than fleets in other trucking sectors. All participants except one owned trucks, and one participant leased 16% of their log trucks. Seven participants’ fleet sizes had been consistent in recent years, seven had increased the size of their fleets, and four had reduced the size of their fleets. Three of the firms that increased their fleet size did so because of reduced contract trucking availability in their area. Firms reduced the size of their fleets because of driver shortages, downsizing to match the production of their logging business, and because of increased insurance premiums.
Truck ages ranged from new (i.e., purchased within the past year) to 23 years old. Sixty-five percent of participants purchased new trucks, with the remainder of truck owners purchasing used trucks or a combination of new and used trucks. Of the new truck buyers, 73% planned to replace the trucks within five years of purchase. The remaining 27% of those purchasing new trucks planned to replace their trucks within 10 years of purchase. Approximately half of the participants purchasing used trucks purchased trucks that were 5–10 years old with 560,000–800,000 km on the odometer with the goal of driving them three to five years, or until the odometer reached approximately 1.6 million km.
Truck purchasing and replacement strategies involve several tradeoffs. Purchasing new trucks is obviously more expensive upfront than purchasing used trucks. According to participants, the average cost of a new truck tractor was USD $136,091. In contrast, the average used truck tractor cost USD $30,333. Of course, maintenance, repair, and downtime costs are likely much higher for used trucks. Four participants suggested Environmental Protection Agency (EPA) emissions standards influenced their truck purchasing decisions. Three participants that purchased used trucks did so, at least in part, to avoid newer models requiring diesel exhaust fluid (DEF). EPA requirements to reduce NOx emissions were phased in beginning in 2007 with full implementation in 2010. Consequently, several log truck owners preferred to own 2005 or 2006 models. One company held onto 2005 and 2006 vehicles for as long possible and then purchased a large number of 2016 and 2017 models with the hope that the new trucks would be more reliable than the earlier models using DEF. Another firm purchased new trucks and paid for a five-year, 800,000 km warranty because of concerns about expensive and time-consuming repairs associated with modern emissions control systems. Two other companies purchased new trucks to improve the safety of their trucking fleets. These two firms experienced insurance premium increases after random roadside inspections identified mechanical deficiencies.
Despite varying truck and trailer ages, the average tare (empty) weight reported by participants was just 12.8 t. This finding supports the results of Greene et al. [
23], who found that most logging businesses in Georgia and South Carolina had invested in lightweight tractors and trailers. One firm had purchased new trailers within the past year to reduce tare weight. Of course, lightweight tractor-trailers must remain sufficiently durable to withstand logging conditions to prevent costly downtime and remain safe. One company stated that it had recently purchased heavier tractor-trailers to ensure durability.
Participants generally owned far more trailers than trucks and trailers had a much longer useful life than the truck tractors. Participants owned an average of two trailers for every truck they owned. Only two participants stated that they used set-out trailers. One company used set-out trailers to reduce turn-times at harvest site, whereas another set out trailers near the mill to avoid costly waiting time there. Five participants owned trailers manufactured during the 1980s. Nearly three-quarters of participants owned trailers that were at least 10 years old. Previous research found that log trailers last much longer than truck tractors [
16] and this should be acknowledged in cost calculations.
3.3. Haul Characteristics
Log trucks were driven an average of 127,324 km year
−1 (79,116 mi year
−1) (
Table 2). Average one-way haul distance was 90 km (56 mi), which is consistent with published estimates from the Southern U.S. [
2,
22] and slightly shorter than published estimates from the Northeast U.S. and West U.S. [
16,
18]. Log trucks operated for an average of 51 weeks per year, but averaged three loads per day.
It is important to compare Georgia log trucking fleets to other types of fleets. Participants in this study reported just 48% loaded km, and even this appears to be optimistic because some log truck owners probably failed to account for empty km driven home or to the business headquarters at the end of the day. Hooper and Murray [
21] reported 80.5% loaded km for trucking companies as a whole. Estimated average revenue per truck was just USD
$121,564 in this study, compared to USD
$366,803 for other trucking industries [
21]. Mason et al. [
16] estimated revenue of USD
$137,775 per log truck in Washington in 2006. Trucks in other industries drove 31% more km and achieved much higher percent-loaded km, which enabled higher revenue per truck and likely increased profitability.
Increasing percent-loaded km and number of loads delivered per day are two approaches that could increase hauling efficiency and profitability. Percent-loaded km was identified as a concern in past research [
17]. Increasing percent-loaded km is difficult because a loaded log truck must arrive at the mill and an unloaded one must arrive at the logging site. Therefore, for a logging business that operates one crew and owns the trucks that haul its timber, percent-loaded km cannot exceed 50%. However, given the ongoing consolidation in the logging industry [
24] and the success of multi-crew logging businesses, there are increasing opportunities for log trucks to optimize truck routes, pick up back-hauls, and increase percent-loaded km, as demonstrated by Mendell et al. [
25]. Only two log truck owners reported achieving better than 50% loaded km. Owner N owned more than 20 trucks, three logging crews, and owned a centrally-located shop that allowed trucks to pick up back hauls and trucks frequently brought loaded trailers to the shop at the end of the day for a different truck to deliver to the mill the next day.
Loads delivered per day is a function of haul distance, hours worked per day, loading time, and unloading time. Haul distance is determined by market and harvest tract location. Hours worked by a single driver are capped by state and federal regulations. Logging businesses and mills determine loading and unloading time and past research suggests there is room for improvement in these areas. Dowling [
26] found the average turn-time for log trucks at the harvest site exceeded one hour in a case study of four harvesting crews in Virginia. However, logging crews studied by Dowling [
26] achieved turn-times as low as 25 min when the truck was waiting to be loaded (i.e., hot loading) and as low as 11 min when set-out trailers were used. Deckard et al. [
27] evaluated mill turn times in eight states in the Southeastern U.S. and found the most efficient mills achieved median turn-times of 17 min, less efficient mills median turn-times were approximately 24 min, and approximately 10% of trucks took approximately one hour to unload. Deckard et al. [
27] estimated that improving efficiency could save USD
$44–87 million per year in the eight-state study area.
Given an average haul distance of 90 km, average travel speed of 65 km h
−1, 17 min to unload at the mill and 25 min to load at the harvest site, round-trip time should average 3.5 h. Participants in this study reported truck drivers worked an average of 11 hours per day. Given 11 working hours per day and each load requiring a 3.5 h roundtrip, this implies three loads can be delivered per day, which agrees with the productivity reported by participants (
Table 2). Participants that surpassed three loads delivered per truck per day had shorter than average haul distance or their drivers worked close to the maximum number of hours per day allowed by law, which was 11 h of driving during any 14 h period after 10 consecutive hours off duty [
28]. Only two log truck owners identified mill turn-times as problematic. Owner F stated that it is common to wait two to three hours to unload at one mill to which he regularly delivers. Likewise, owner J stated that their trucks often spent more time waiting to be unloaded at mills than travelling loaded.
3.4. Cost Structure
Based on responses of interview participants, the average cost to own and operate a relatively new (five years old or newer) log tractor and trailer in Georgia in 2017 was USD
$153,297 per year (
Table 3). Obviously, the cost to own and operate a log tractor-trailer varies depending on average haul distance, number of loads hauled, and repair and maintenance strategies; however, the costs in
Table 3 serve as a baseline cost for a company operating relatively new tractor-trailers.
The driver was the largest cost component for owning and operating a truck, followed by fuel and truck payments (
Table 3). Rapidly rising insurance costs have received much attention, but remain the sixth-most expensive component of owning and operating a tractor-trailer. The issue of insurance costs is discussed in greater detail below. The cost components ranking and actual costs are comparable to the values for trucks used in other industries [
21] and log trucks in other states [
16]. Trucks in other industries generally drove greater distances per year and generated greater revenues than log trucks in this study (
Table 2) [
21].
Given the average haul distance of 90 km and an average of 17,410 t hauled year
−1 (
Table 2), the average cost for participants to haul timber in Georgia was USD
$0.102 t
−1 km
−1. The estimated cost to haul timber was approximately 24% and 15% higher than published minimum haul and incremental haul rates, respectively [
2]. Companies operating used trucks estimated their initial purchase price of USD
$30,333 and companies operating old trucks (less than five years old) estimated their average annual maintenance and repair cost to be USD
$16,610. Using these values and holding all other values in
Table 3 constant, the average cost of hauling timber with used trucks was USD
$0.094 t
−1 km
−1, which is 8% lower than the estimated cost of operating a new truck. The estimated cost of owning and operating a used truck was 14% and 5% above published minimum and incremental haul rates, respectively.
Grebner et al. [
9] found the estimated cost of delivering timber with new tractor-trailers exceeded the rates paid. They also found that operating used log trucks reduced hauling costs by approximately 25%. Compared to the analysis by Grebner et al. [
9], this analysis assumed a longer financing period and lower interest rates. In addition, the cost of fuel, driver wages, insurance, and most other cost components were higher in 2017 than during the study by Grebner et al. [
9].
There are a number of methods to reduce the cost of timber transportation. For example, assuming the same number of km driven per year, increasing percent-loaded km to 60% would allow new tractor-trailers to break-even and 55% loaded km would allow used tractor-trailers to break-even at published minimum haul rates [
2].
Georgia law allows log tractor-trailers a 5% variance on weight enforcement on non-interstate highways, which allows a gross vehicle weight of up to 38,101 kg without penalty. Neighboring states’ tolerances are approximately 5% higher than Georgia’s, so if Georgia increases its tolerance, average payload would conceivably increase by approximately 5% and hauling costs would be reduced. Holding all other variables constant, increasing average payload by 5% to 26.5 t reduces hauling costs to USD
$0.096 t
−1 km
−1 for new trucks and USD
$0.089 t
−1 km
−1 for used trucks. However, even with these savings, hauling costs for new trucks remain 17% above minimum haul rates and used trucks’ hauling costs stay 8% above minimum haul rates [
2].
Participants in the study were well aware of the challenging economics of timber transportation. One company stated that hauling rates never cover hauling costs. Another firm stated that it had not received an increased haul rate to offset increasing costs. A third company stated hauling was a “loss leader” for a profitable timber buying and logging business. A fourth company stated that haul rates needed to increase to cover the cost of transportation. Only two firms stated they had received an increase in hauling rates to offset increases in insurance and other costs. Trucking firms did enjoy reduced fuel costs in recent years. On-highway diesel prices averaged USD
$1.02 L
−1 from 2012 to 2014, but averaged USD
$0.72 L
−1 from 2015 to 2017 [
20]. Only 24% of Georgia loggers reported receiving a rate adjustment for higher fuel costs in 2012 [
23]. Unfortunately, fuel prices rose during the second half of 2017 and during 2018, compounding the challenges faced by log truck owners [
20].
3.5. Log Truck Insurance
Participants were asked to identify the most important issue facing log truck owners in Georgia. Eight participants (44%) stated that a shortage of qualified drivers was the most important issue facing their business and seven participants (39%) listed truck insurance as the most important issue they faced. Other important issues identified by participants included safety, lawsuits following accidents, emissions laws and their impact on the cost of trucks, and other regulations. A nationwide shortage of truck drivers has been documented by previous research [
14,
17,
18] and drivers were discussed in an earlier section.
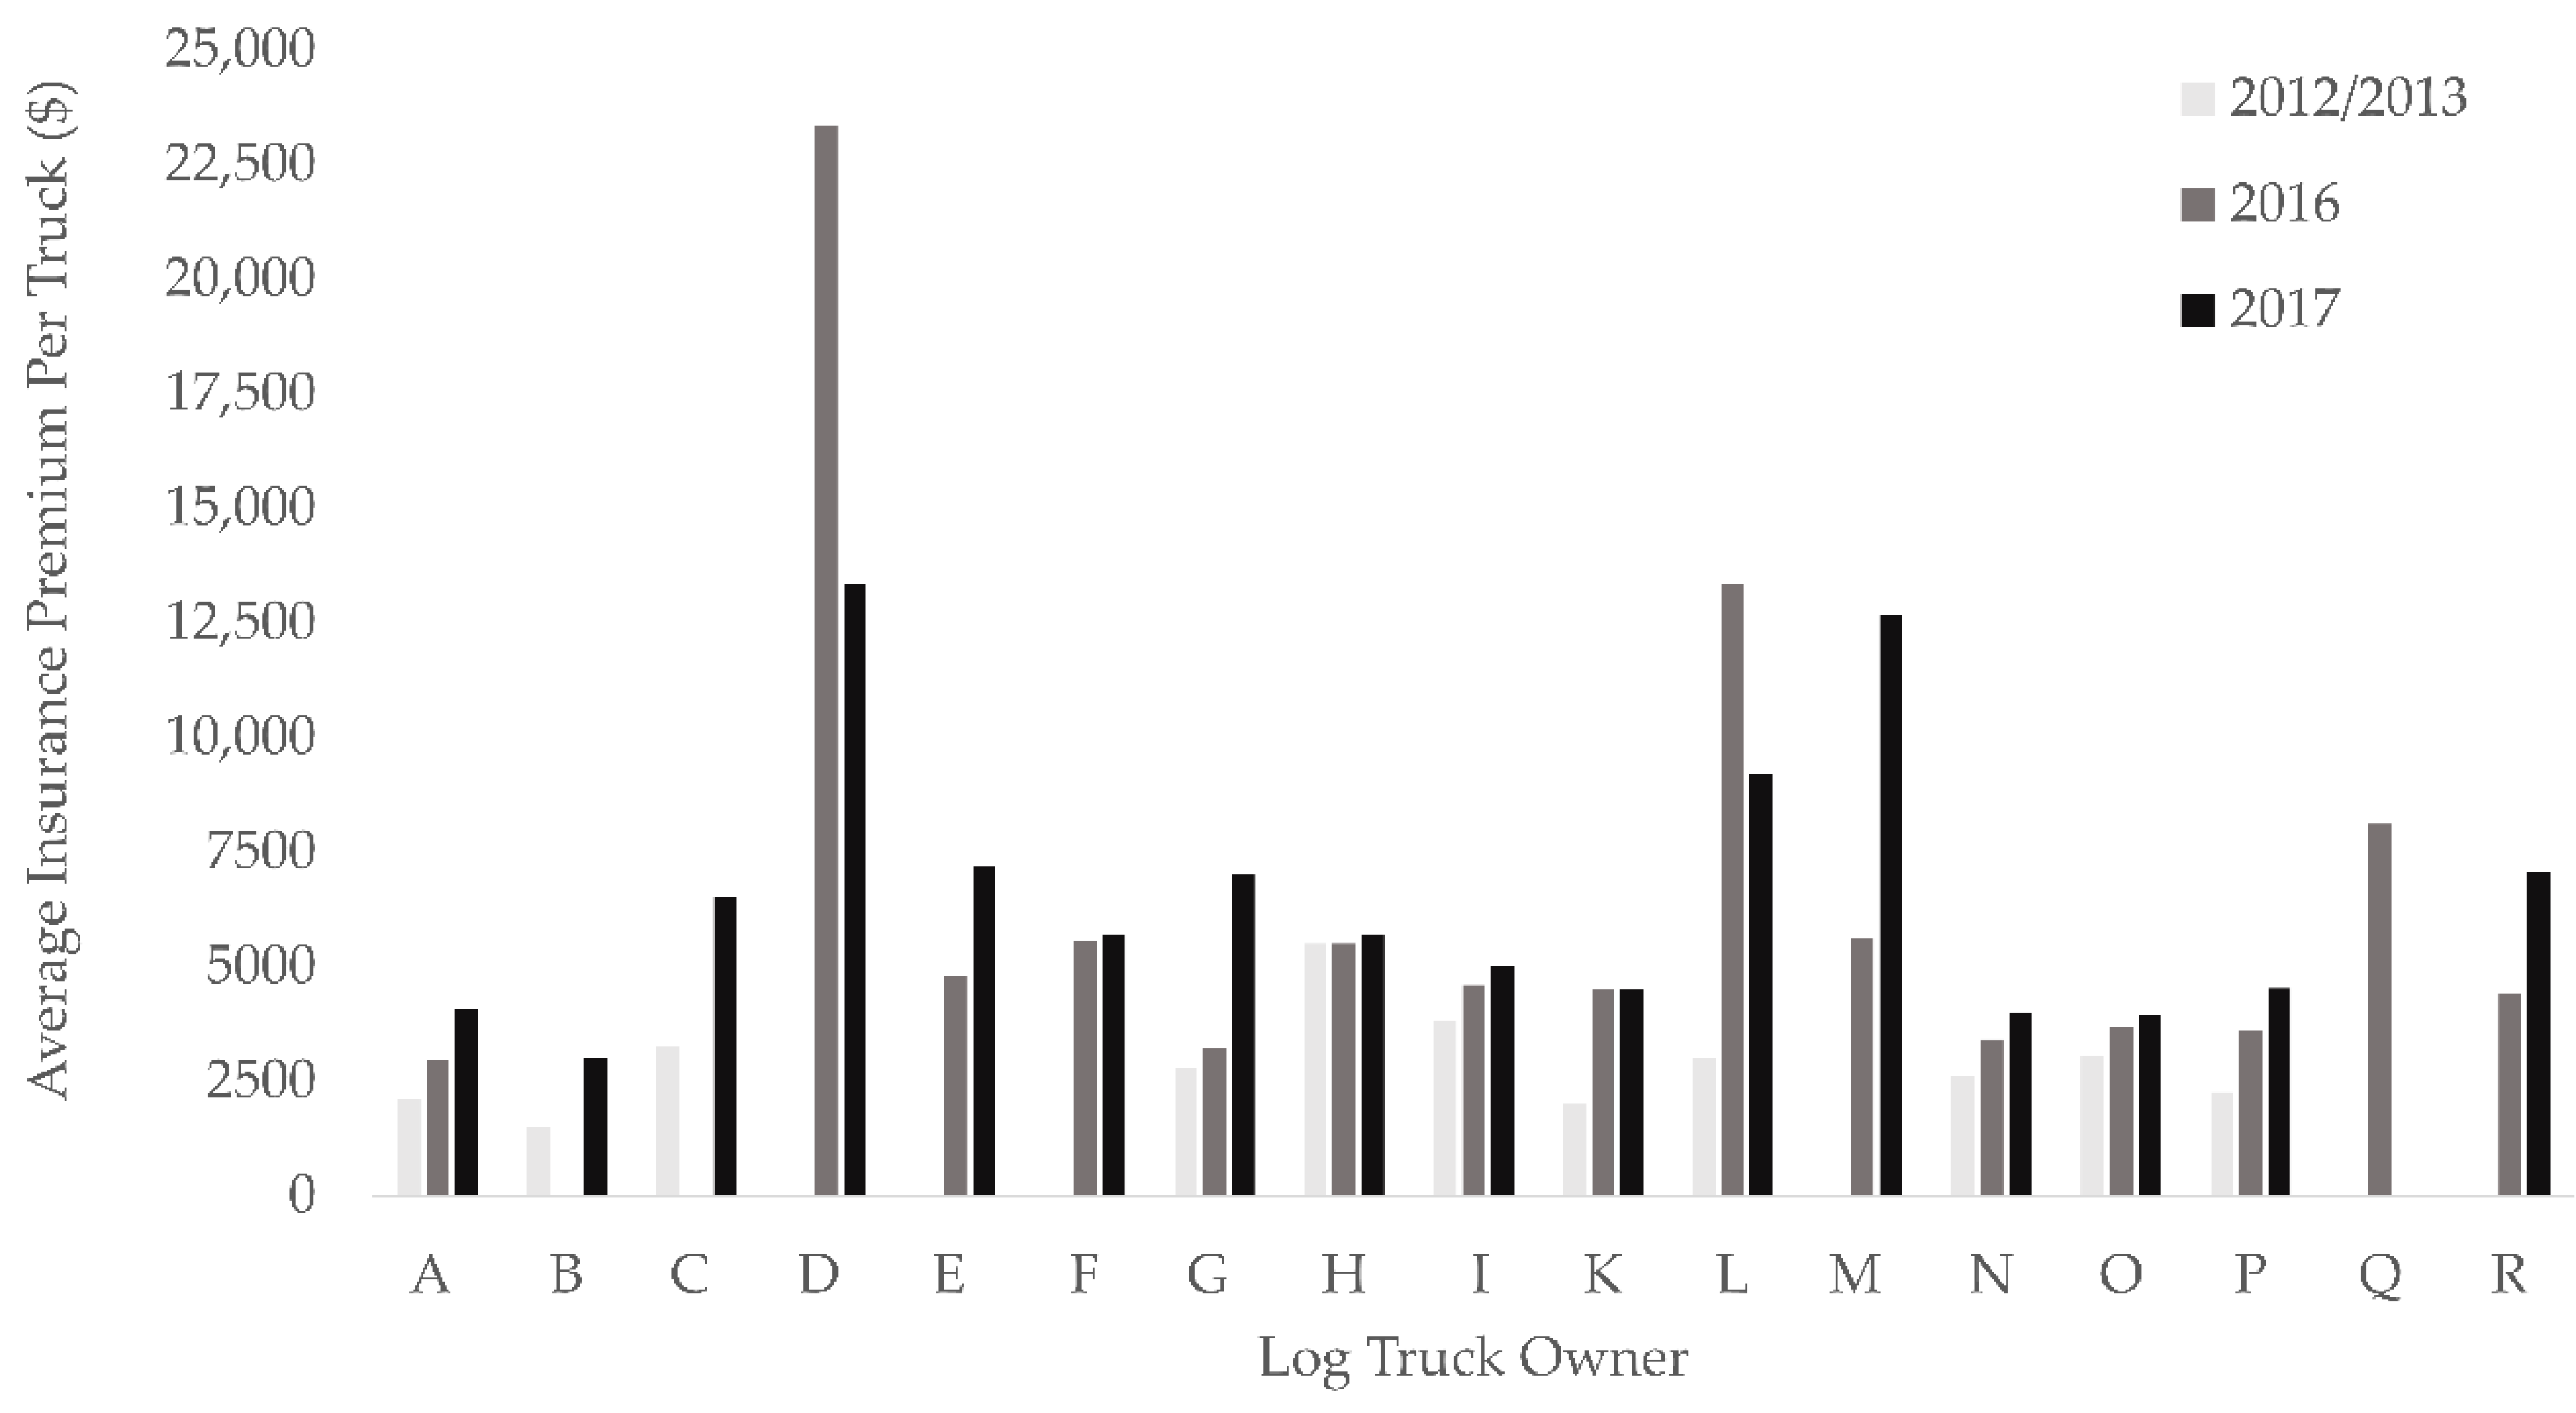
Rising insurance costs have been reported by many log truck owners and is the issue that prompted this research. Previous research found log truck insurance premiums increased by 50% in Georgia and 27% in South Carolina between 2012 and 2017 [
13]. Participants in this study had diverse experience with insurance premiums. In 2012 and 2013, most participants’ insurance premiums were in the narrow range of USD
$1500 to
$3800 with an average premium of USD
$2969 (
Figure 2). Owner H paid USD
$5500 per truck per year in 2013, but his premium was above average because this was their first year as a truck owner. By 2017, the average premium increased to USD
$6458. Likewise, the premium range increased to USD
$10,333 per year, with some owners still paying approximately UDS
$3000 per truck, while others paid premiums in excess of USD
$13,000 per truck per year. One-third of participants experienced increases in premiums in excess of 25% between 2016 and 2017. Two owners experienced reduced premiums between 2016 and 2017. Both of the owners experiencing a premium reduction had changed insurance companies.
Even after recent premium increases, insurance remained the sixth-most expensive component of owning and operating log trucks (
Table 3). However, insurance premium increases remain an important challenge to log truck owners. Log trucks generally operate on small profit margins and if log trucks were breaking even or enduring a small loss prior to premium increases, rising premiums would make a problematic situation untenable. In addition, insurance premiums are not the only cost that is rising for log truck owners. Although fuel costs declined between 2012 and 2017, fuel costs rose during 2017 and 2018 [
20]. Driver wages [
19] and the purchase price of trucks have both increased in years. While the cost of trucks and fuel are similar for everyone and the information is publicly available, truck insurance premiums have become highly variable (
Figure 2) and the information is generally not publicly available. Finally, sudden increases in insurance premiums create challenges for planning and leave a truck owner short of cash when log truck insurance is due for renewal. For example, owner C was forced to take out a loan of USD
$50,000 to cover a larger than expected insurance premium increase.
Six participants blamed rising insurance premiums on accidents/insurance claims, five blamed a loss of insurance carriers/lack of competition for policies, three blamed the Federal Motor Carrier Safety Administration’s (FMCSA) compliance, safety, and accountability (CSA) program, and three blamed lawsuits and/or the failure of insurers to fight lawsuits in court. Insurers have suffered consistent and substantial losses in commercial auto insurance [
29]. In Georgia, insurers have suffered underwriting losses on commercial auto policies every year from 2009 to 2016, the most recent year for which data are available [
30]. Accident frequency among all vehicle types has increased because of increases in distances travelled and distracted driving. Simultaneously, the cost of claims has risen because of increasing health care costs and increasing costs of vehicle repairs associated with costly new technology (e.g., lane departure warning systems, multiple air bags, etc.) [
29]. The combination of increasing accident frequency and increasing costs per accident have led to major losses in commercial automobile insurance and insurers have responded with significant premium increases. Log truck insurance is a small segment of the commercial auto insurance market. Some insurance underwriters have exited the log truck market, raising concerns among log truck owners that lack of competition may contribute to higher insurance premiums.
The compliance, safety, and accountability (CSA) program assigns scores and out-of-service rates to all trucking companies based on roadside inspections and accidents [
31]. This information is used by FMCSA to prioritize fleets for interventions. The CSA program was implemented in phases in 2010–2011 and fully implemented in 2012. Some of the information collected by the CSA program is available to the public and is used by insurers, in conjunction with claims history, to determine premiums offered to individual log trucking companies. The CSA program allowed insurers to better identify risky trucking companies and charge them appropriate premiums. The CSA program is a likely culprit in the increased variability in insurance premiums between 2012 and 2017 (
Figure 2). Before CSA and during the early years of its implementation, insurance premiums for log trucks were fairly consistent across the industry. The range in premiums for experienced participants in this study was just USD
$2300. In contrast, after CSA was fully implemented, the range of premiums for study participants increased by over 400%. CSA is not responsible for overall premium increases because claim costs are the primary determinant, but CSA is a major determinant of premiums paid by individual companies.
Litigation was a common complaint among study participants. All participants agreed (94% strongly agreed) that “lawsuits are a major problem for log trucking companies”. One log truck owner stated that lawsuits are what keeps him awake at night. Five participants advocated tort reform, with the most common solution a “loser pays” system. Participants’ primary concern was about lawsuits filed following accidents in which their truck was not at fault. Even if these lawsuits did not result in a judgement, the settlement and/or defense of the lawsuit cost the insurance company money that must be recovered from premiums.
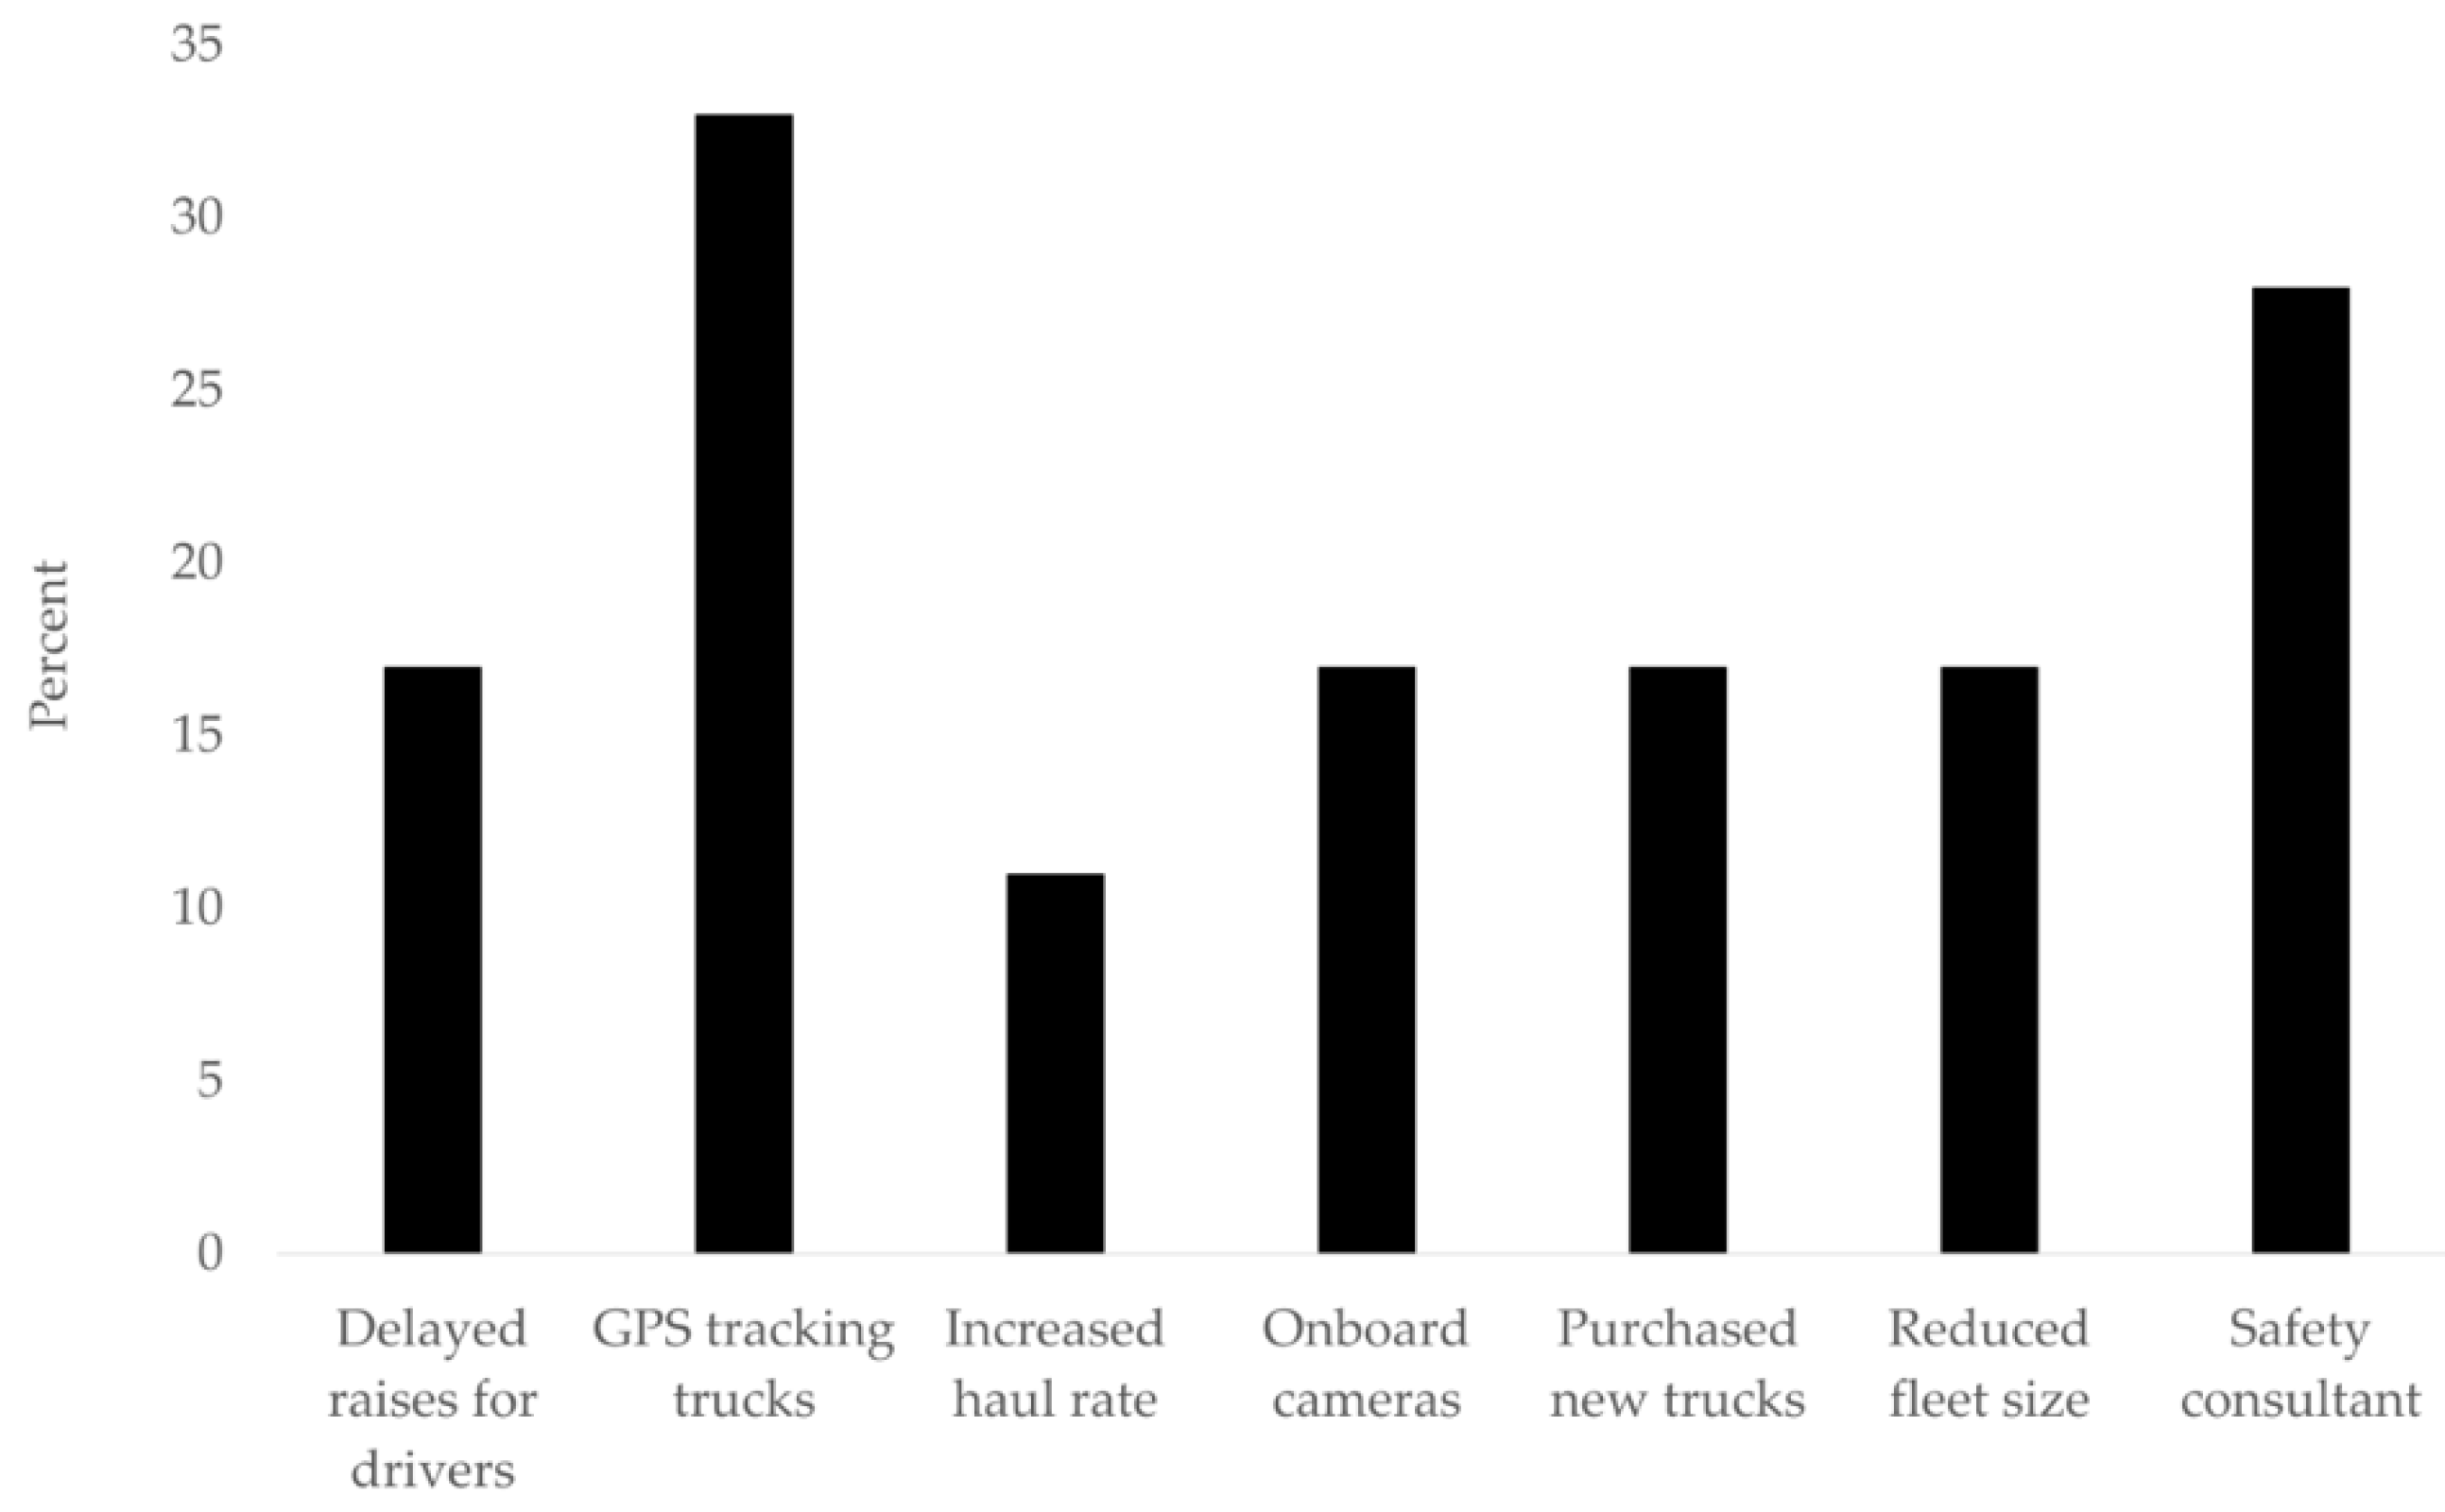
Some log truck owners had taken proactive steps in response to rising truck insurance premiums (
Figure 3). Three truck owners had installed onboard cameras on their trucks. The onboard cameras collect evidence when an accident occurs and this evidence can be used to defend against a lawsuit or citation. Camera footage can also be used as part of a driver training program. Many of the onboard cameras record whenever there is an “event”, such as heavy braking. One owner uses the footage to coach his drivers. Since implementing the program, his drivers have increased their average following distance and his ratio of premiums to claims has improved. Six truck owners implemented global positioning system (GPS) tracking, which allows them to monitor driving routes and travel speeds (
Figure 3). Five truck owners hired a safety consultant to focus their employees and truck drivers on safe operations. Several owners had purchased new trucks in order to improve their inspection results because of the CSA program.
Several truck owners had taken reactive steps. Three owners delayed wage increases because additional capital was allocated to insurance premiums. Several companies reduced their fleet size in response to insurance premium increases. Only two participants were successful in negotiating increased haul rates. While reactive steps are often necessary in the short term, delaying raises and reducing fleet size can jeopardize the long-term viability of a logging business if it loses talented drivers or does not have enough trucking capacity to transport timber. While increased haul rates are sometimes necessary, excessive haul rates can jeopardize wood supply chain competitiveness. Insurance companies, log truck owners, regulators, and the forest products industry should work together to seek solutions that improve truck transportation safety and reduce costs.
3.6. Opportunities to Improve Timber Transportation Efficiency
There are a number of possible solutions to improve the efficiency of timber transportation and improve the profitability of log trucking businesses based on the findings of this study and others. Possible improvements include increasing weight limits on public roads [
17], increasing percent-loaded km [
17,
18,
25], reducing turn-times at harvest sites and mills [
26,
27], and increasing average payload by using in-woods scales [
4,
5,
6].
Improving timber transportation safety should be an important goal for log truck owners. Several participants in this study identified accidents as a primary cause of increasing insurance premiums. Likewise, an unsafe working environment discourages prospective drivers from an industry struggling to attract qualified drivers. This study and others have identified a number of opportunities to improve transportation safety: invest in new trucks (
Figure 3), implement driver training programs, install technology such as GPS tracking and onboard cameras on trucks, and hire someone to monitor safety training and compliance.
Unfortunately, there is no single solution that will solve the problems identified, and some solutions require action by entities other than log truck owners. In some cases, investments to improve transportation efficiency result in benefits to the entire wood supply chain, but the costs are borne by a few individuals. For example, reducing mill turn-times would reduce transportation costs and benefit loggers and log truck owners, but may require substantial investment by the mill owner. Operating large trucking fleets servicing multiple timber harvesting businesses may improve percent-loaded km and reduce transportation costs, but may reduce individual logging business owners’ control over the timing of timber transportation, and in some cases, may reduce in-woods efficiency if timber transportation schedules do not match in-wood production on a particular tract.


