
Allometric Equations for Estimating Tree Aboveground Biomass in Tropical Dipterocarp Forests of Vietnam

 and
and
Abstract
:1. Introduction
2. Materials and Methods
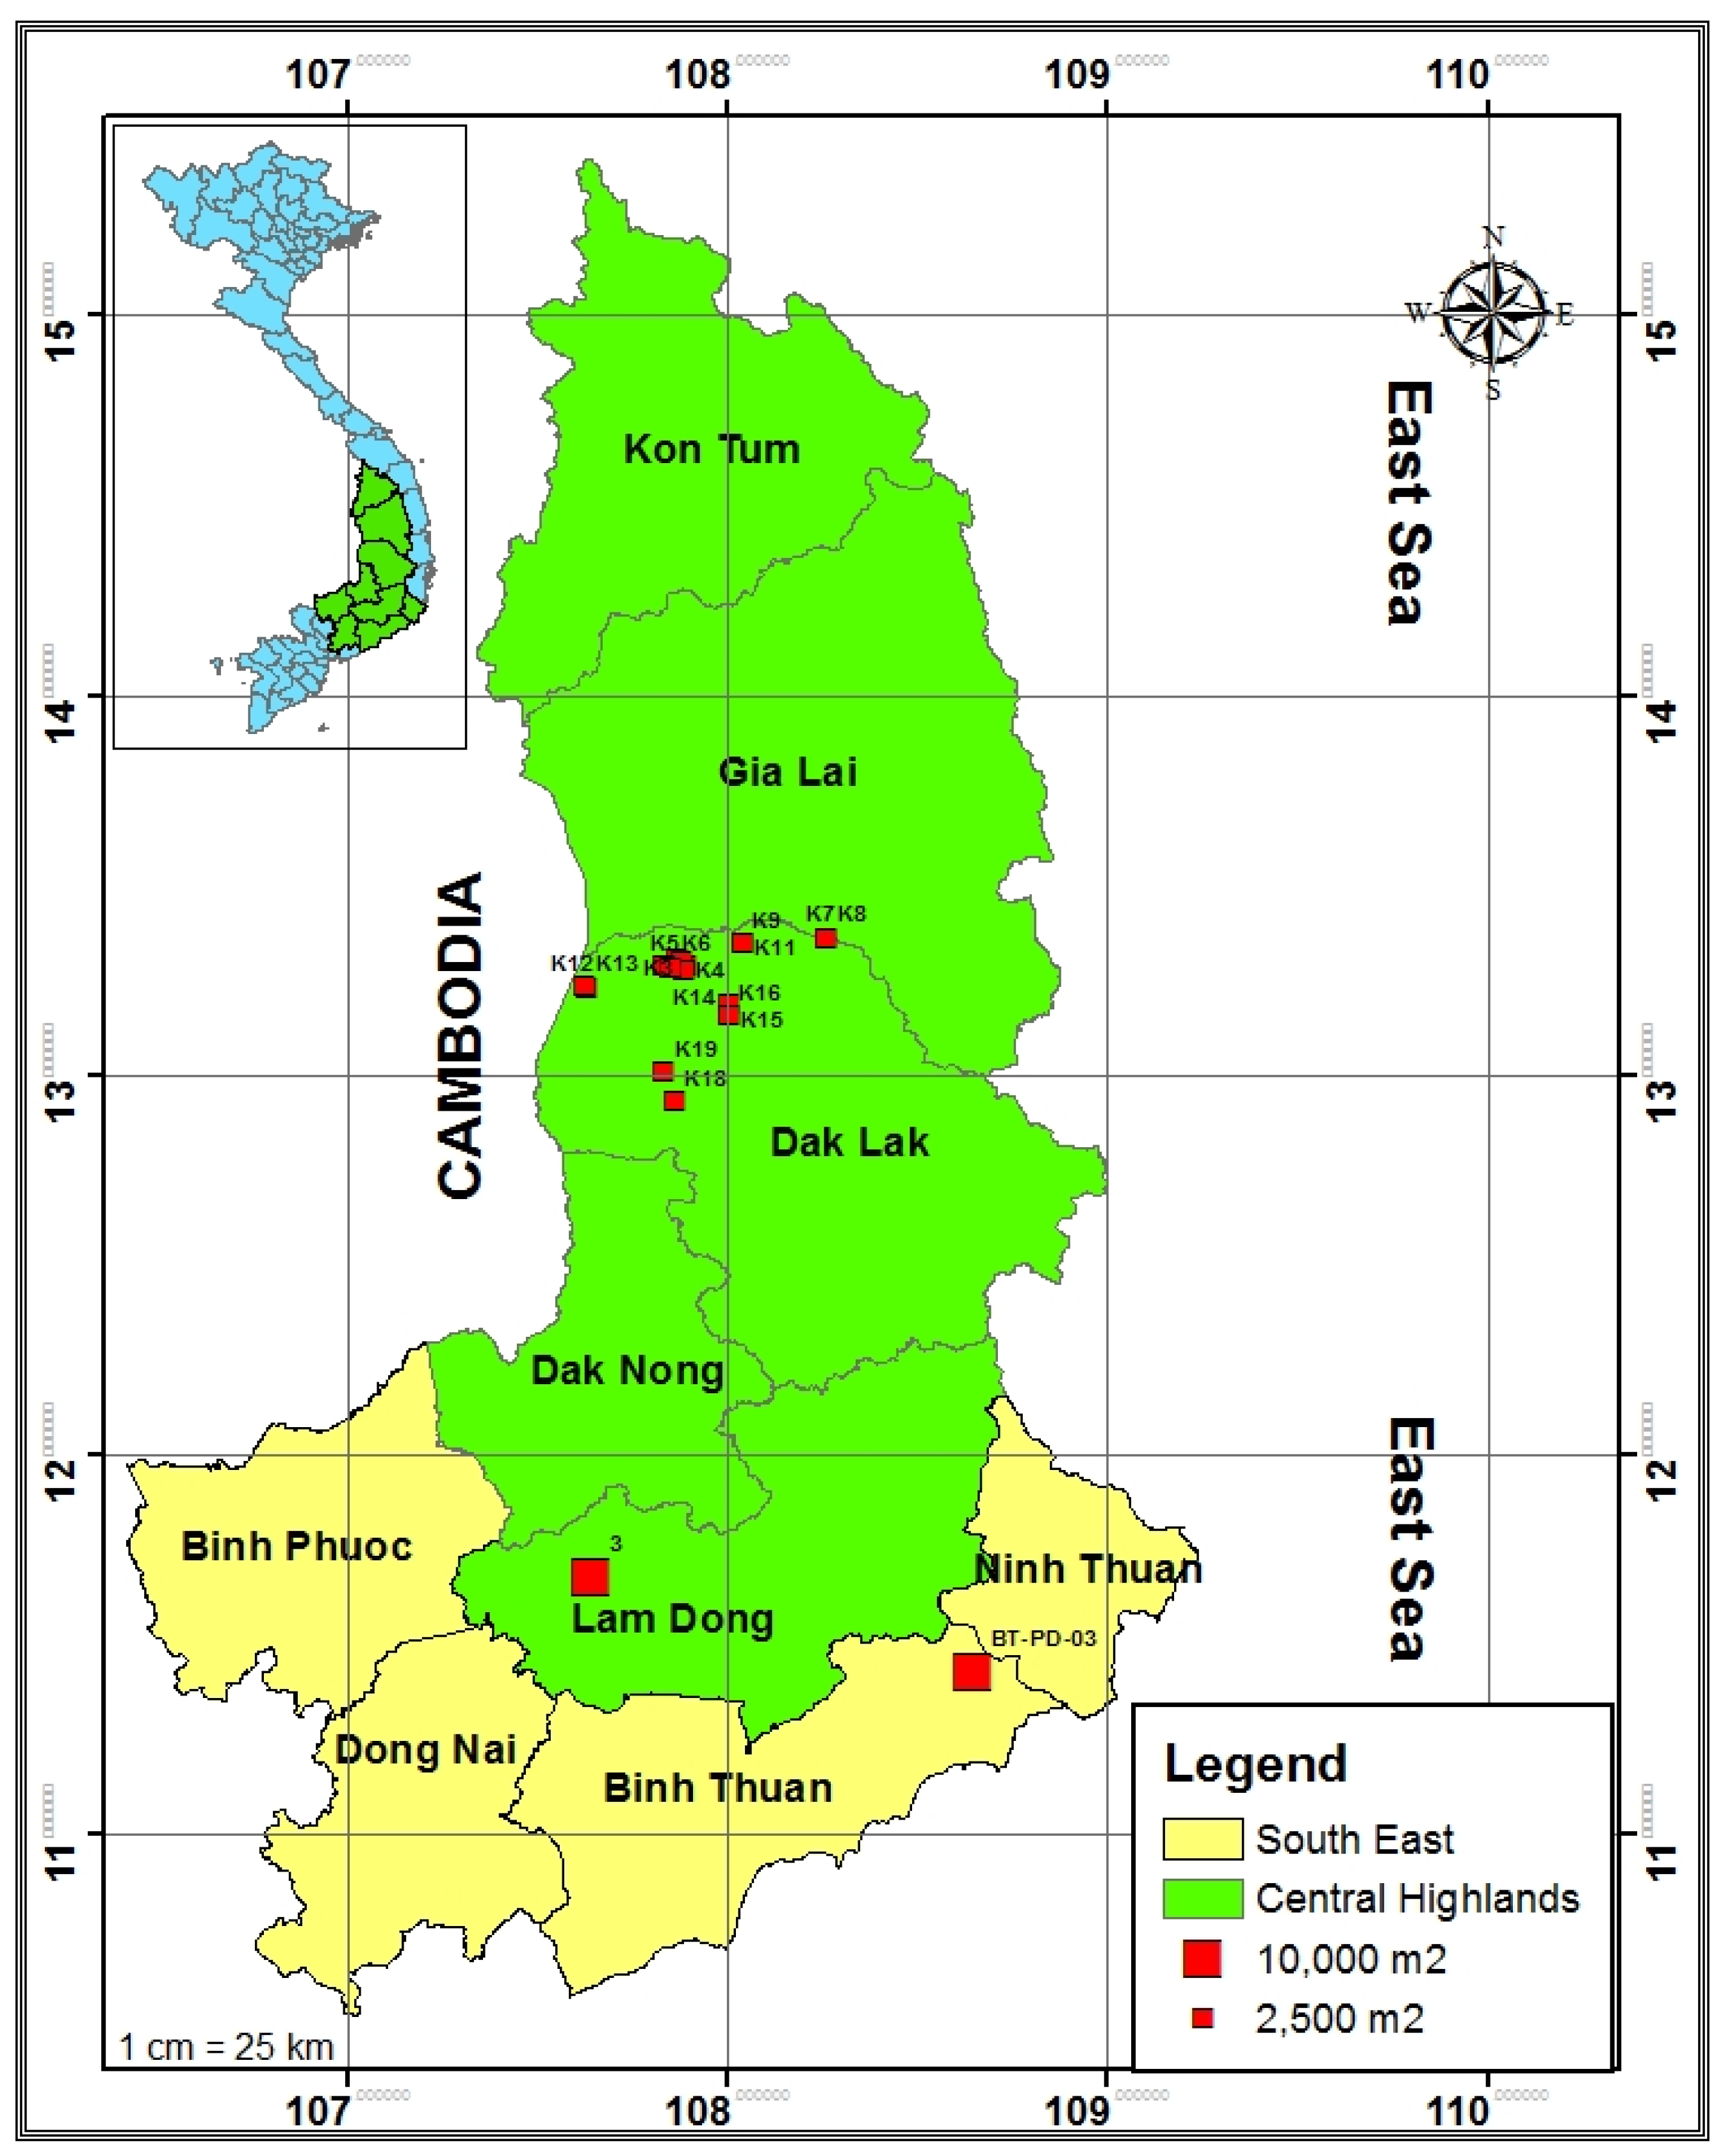
2.1. Study Sites
2.2. Sampling Design and Data Collection
2.3. Equation Development and Selection
2.4. Equation Validation and Comparison
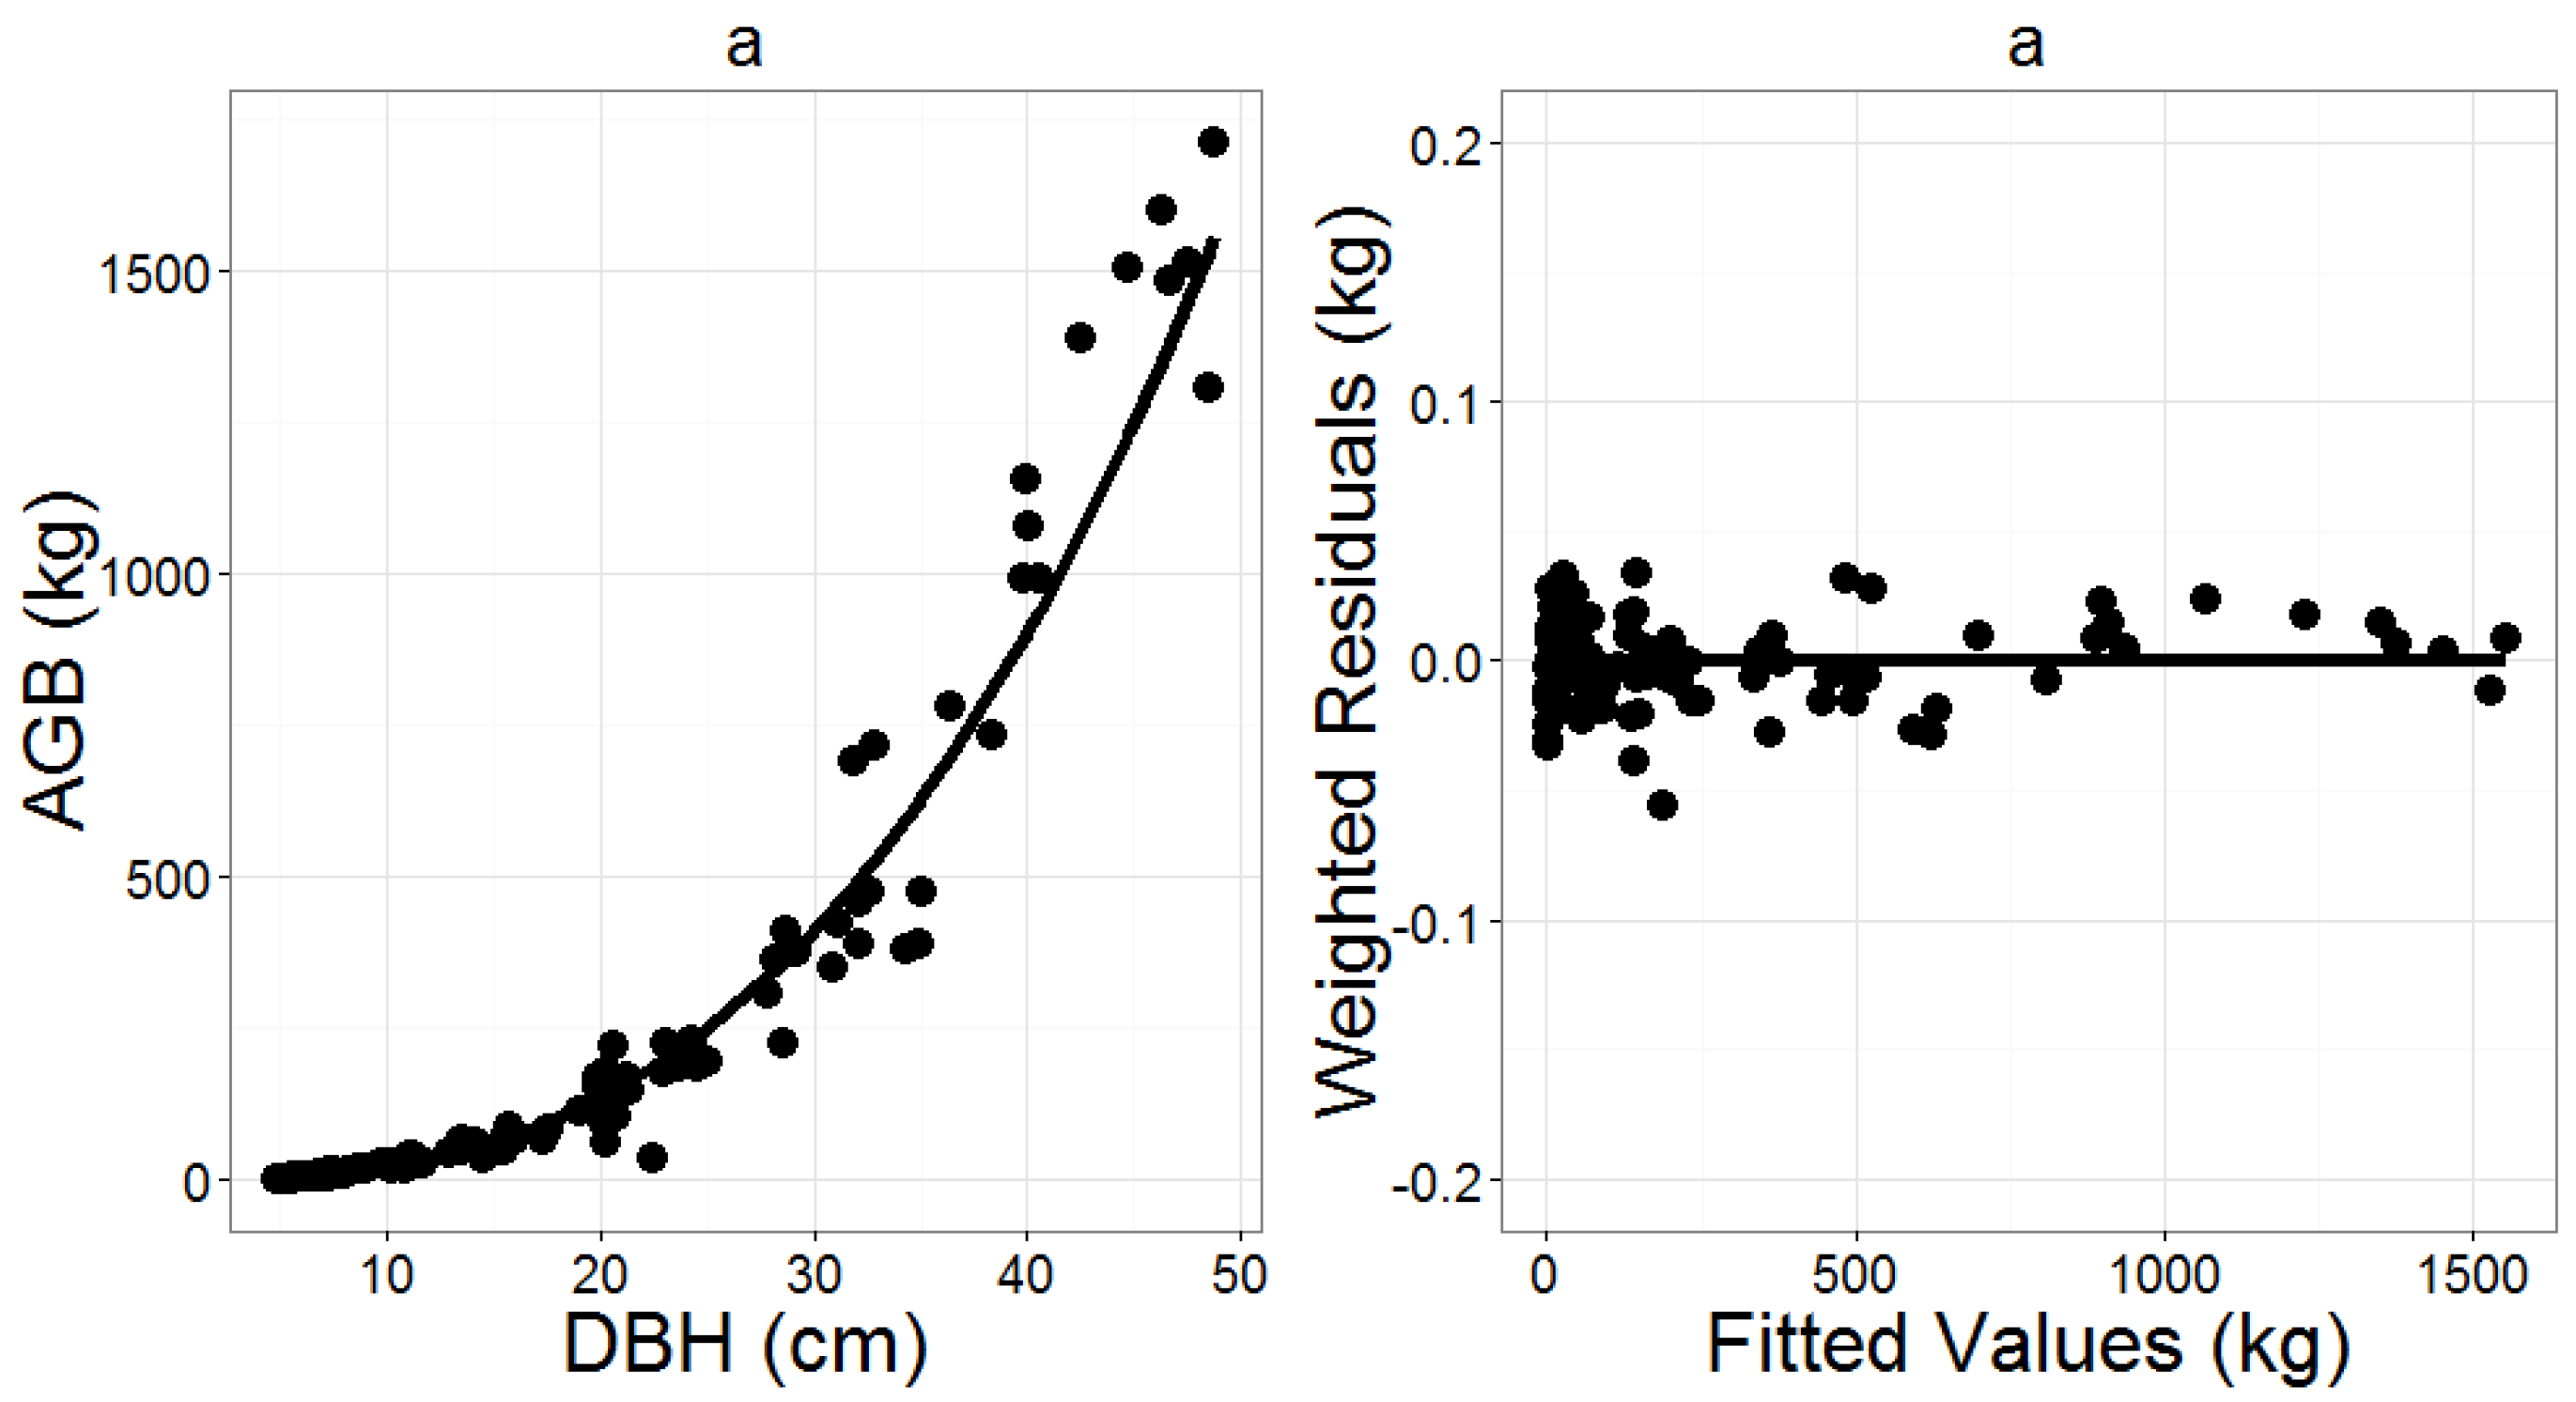
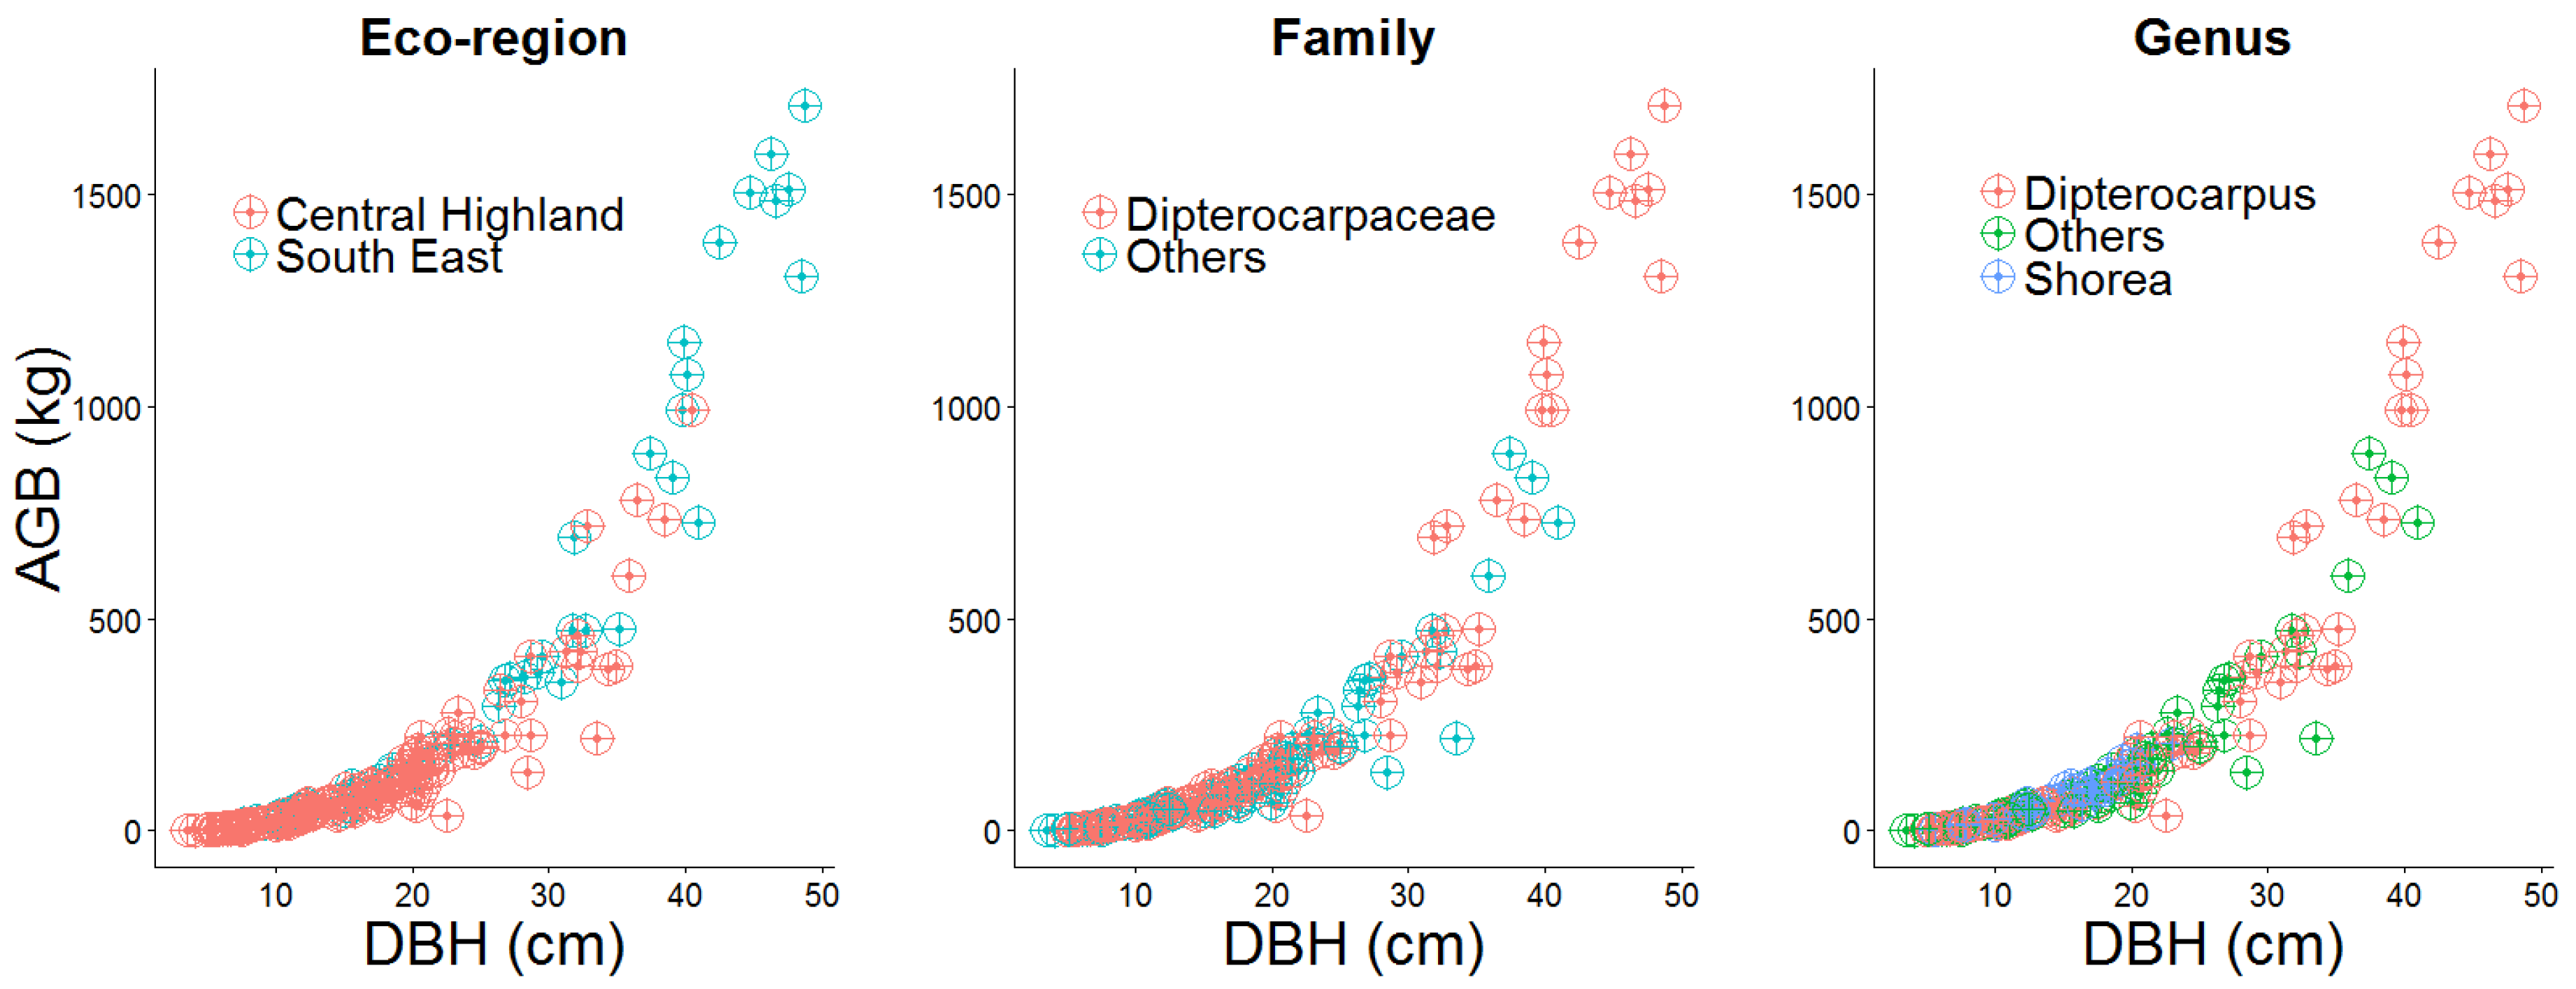
3. Results
3.1. Equations for Mixed-Species
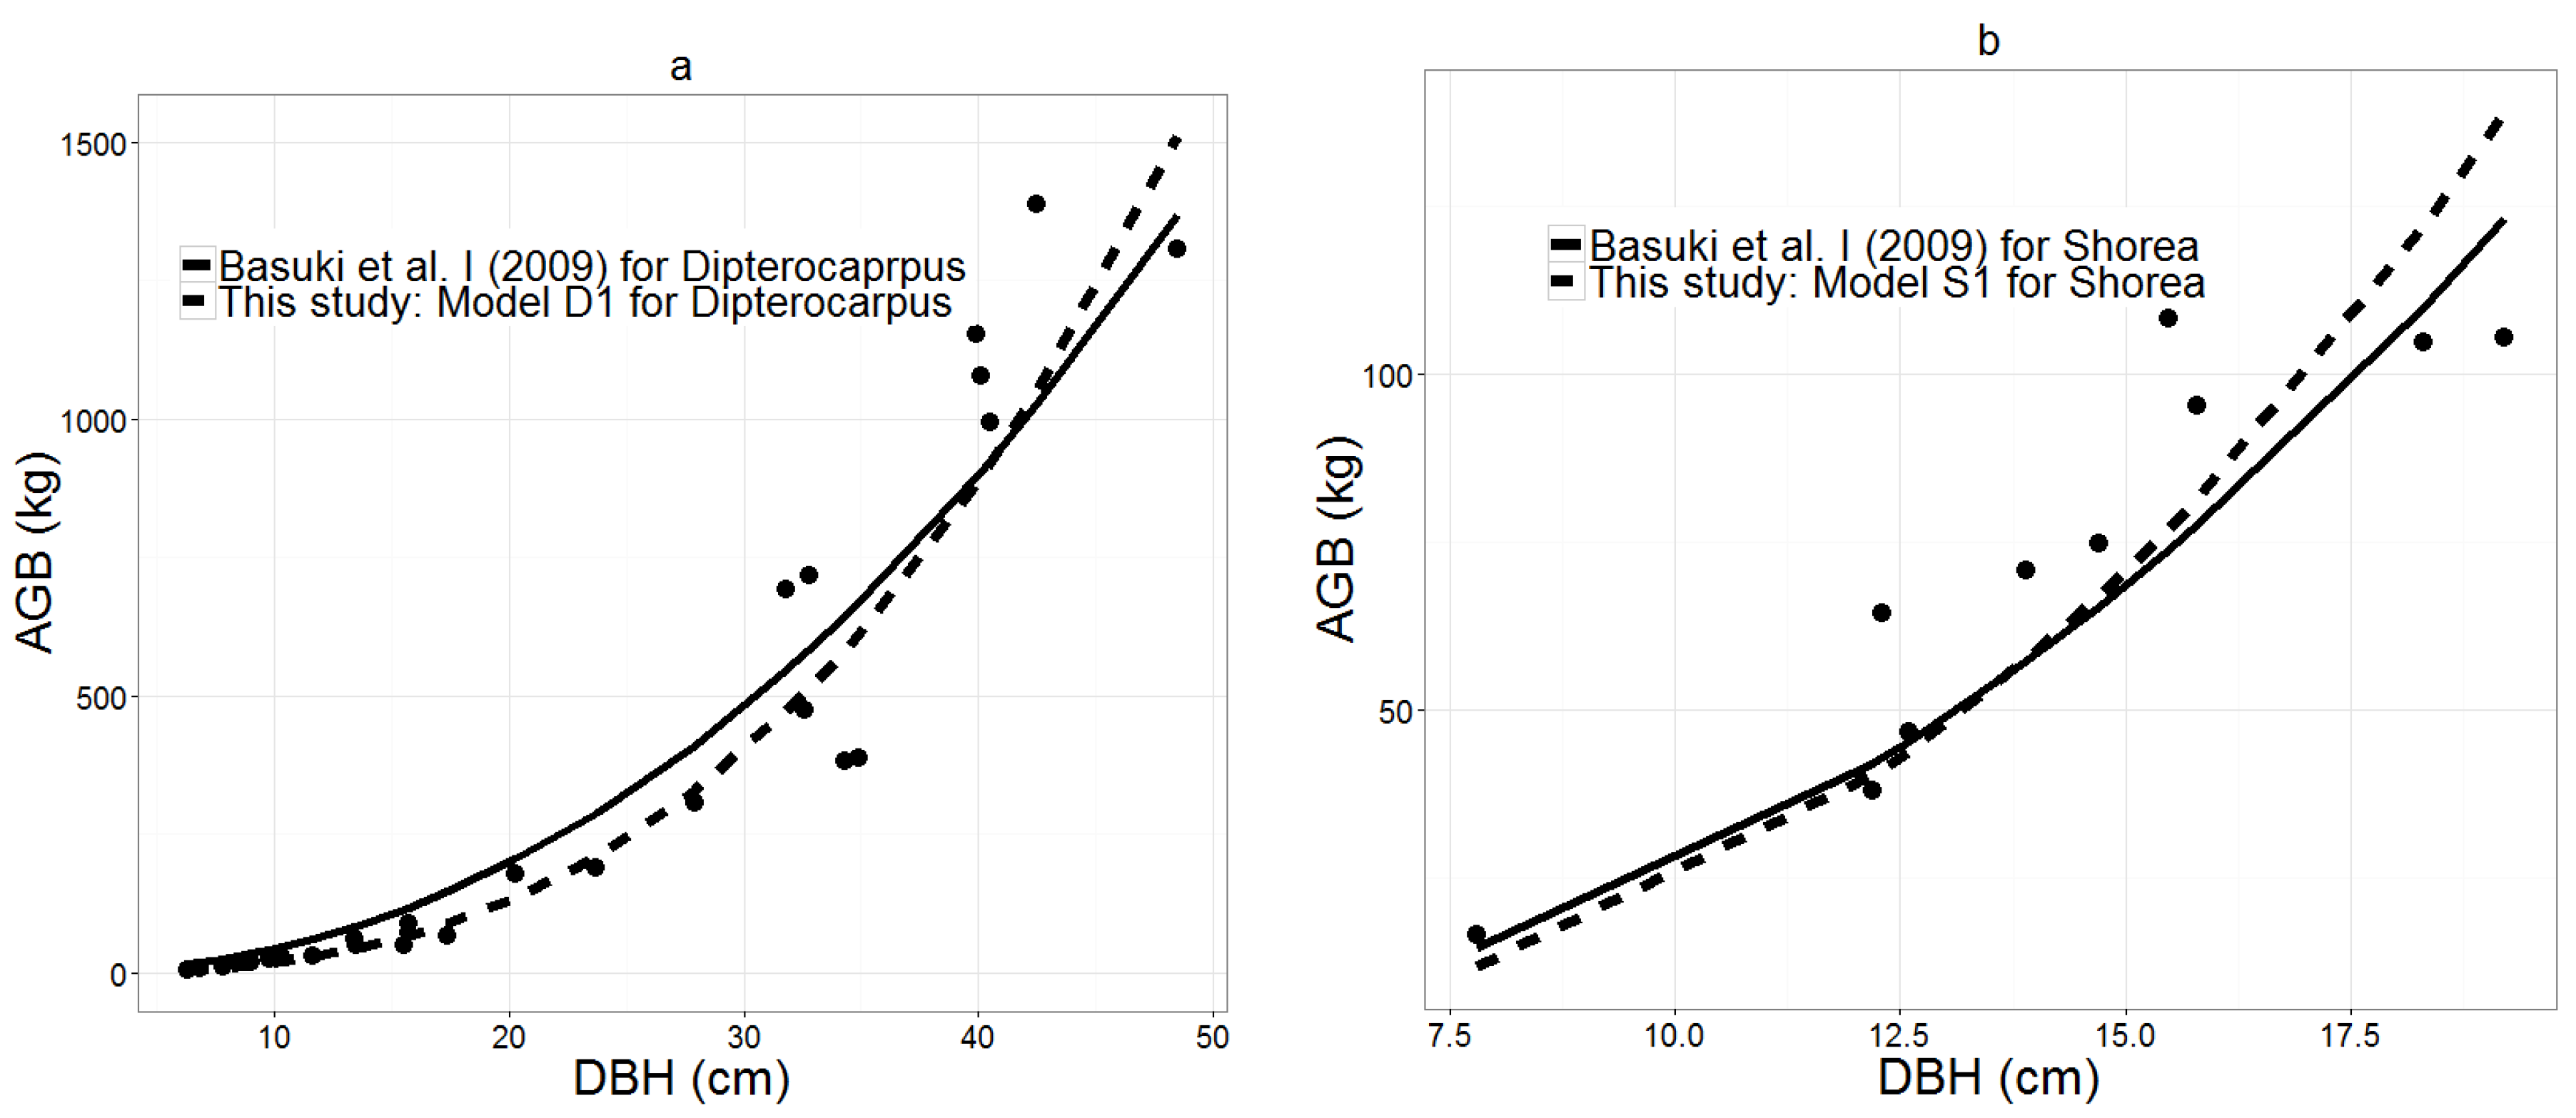
3.2. Equations for Dominant Genera
3.3. Equation Validation and Comparison
4. Discussion
4.1. Input Variables for AGB Mixed-Species Equations for Dipterocarp Forests
4.2. Equations at the Mixed-Species Level in the Dipterocarp Forests of Southeast Asia
4.3. Equations at the Genus Level in the Dipterocarp Forests of Southeast Asia
5. Conclusions
Acknowledgments
Author Contributions
Conflicts of Interest
References
- Measurement, Reporting & Verification (MRV) Framework Document. Available online: http://theredddesk.org/resources/measurement-reporting-and-verification-framework-document (accessed on 17 August 2016).
- UNFCCC (United Nations Framework Convention on Climate Change). Report of the Conference of the Parties on its Thirteenth Session; Proceedings of UNFCCC: Bonn, Germany, 2008. [Google Scholar]
- Appanah, S. Management of Natural Forests. In A Review of Dipterocarp: Taxonomy, Ecology and Silviculture; Appanah, S., Turnbull, J.M., Eds.; Center for International Forestry Research (CIFOR): Bogor, Indonesia, 1998; pp. 130–149. [Google Scholar]
- Maury-Lechon, G.; Curtet, L. Biogeography and Evolutionary Systematics of Dipterocarpaceae. In A Review of Dipterocarp: Taxonomy, Ecology and Silviculture; Appanah, S., Turnbull, J.M., Eds.; Center for International Forestry Research (CIFOR): Bogor, Indonesia, 1998; pp. 5–44. [Google Scholar]
- Huy, B. Part B1: Equations for Biomass of Aboveground Trees, Branches and Leaves Biomass in Evergreen Broadleaved Forests, and for Aboveground Biomass of Six Tree Families in Evergreen and Deciduous Forests. In Allometric Equations at National Scale for Estimating Tree and Forest Biomass in Vietnam; Sola, G., Inoguchi, A., Garcia-Perez, J., Donegan, E., Birigazzi, L., Henry, M., Eds.; UN-REDD Programme: Ha Noi, Vietnam, 2014. [Google Scholar]
- Jenkins, J.C.; Chojnacky, D.C.; Heath, L.S.; Birdsey, R.A. Comprehensive Database of Diameter-based Biomass Regressions for North American Tree Species; General Technical Report NE-319; USDA Forest Service: Newtown Square, PA, USA, 2004; p. 45. [Google Scholar]
- Jenkins, J.C.; Chojnacky, D.C.; Heath, L.S.; Birdsey, R.A. National-scale biomass estimators for USA tree species. J. For. Sci. 2003, 49, 12–35. [Google Scholar]
- Sola, G.; Inoguchi, A.; Garcia-Perez, J.; Donegan, E.; Birigazzi, L.; Henry, M. Allometric Equations at National Scale for Tree Biomass Assessment in Vietnam, Context, methodology and summary of the results; UN-REDD Programme: Ha Noi, Vietnam, 2014. [Google Scholar]
- Sola, G.; Inoguchi, A.; Phuong, V.T.; Huy, B.; Khoa, P.V.; Hung, N.D.; Xuan, N.V.; Henry, M. Allometric Equations at National Scale for Tree Biomass Assessment in Vietnam; UN-REDD Programme: Ha Noi, Vietnam, 2014. [Google Scholar]
- Ter-Mikaelian, M.T.; Korzukhin, M.D. Biomass equations for sixty-five North American tree species. J. For. Ecol. Manag. 1997, 97, 1–24. [Google Scholar] [CrossRef]
- Pearson, T.R.H.; Brown, S.; Birdsey, R.A. Measurement Guidelines for the Sequestration of Forest Carbon; General Technical Report NRS-18; USDA Forest Service: Newton Square, PA, USA, 2007. [Google Scholar]
- Estimating Biomass and Biomass Change of Tropical Forests: A Primer. (FAO Forestry Paper-134). Available online: http://www.fao.org/docrep/W4095E/w4095e00.htm#Contents (accessed on 16 August 2016).
- Basuki, T.M.; Van Lake, P.E.; Skidmore, A.K.; Hussin, Y.A. Allometric equations for estimating the above-ground biomass in the tropical lowland Dipterocarp forests. For. Ecol. Manag. 2009, 257, 1684–1694. [Google Scholar] [CrossRef]
- Picard, N.; Rutishauser, E.; Ploton, P.; Ngomanda, A.; Henry, M. Should tree biomass allometry be restricted to power models? For. Ecol. Manag. 2015, 353, 156–163. [Google Scholar] [CrossRef]
- Chambers, J.Q.; dos Santos, J.; Ribeiro, R.J.; Higuchi, N. Tree damage allometric relationship and above-ground net primary production in central Amazon forest. For. Ecol. Manag. 2001, 152, 73–84. [Google Scholar] [CrossRef]
- Chave, J.; Andalo, C.; Brown, S.; Cairns, M.A.; Chambers, J.Q.; Eamus, D.; Folster, H.; Fromard, F.; Higuchi, N.; Kira, T.; et al. Tree allometry and improved estimation of carbon stocks and balance in tropical forests. Oecologia 2005, 145, 87–99. [Google Scholar] [CrossRef] [PubMed]
- Chave, J.; Mechain, M.R.; Burquez, A.; Chidumayo, E.; Colgan, M.S.; Delitti, W.B.C.; Duque, A.; Eid, T.; Fearnside, P.M.; Goodman, R.C.; et al. Improved allometric models to estimate the aboveground biomass of tropical trees. Glob. Change Biol. 2014, 20, 3177–3190. [Google Scholar] [CrossRef] [PubMed]
- IPCC National Greenhouse Gas Inventories Programme. Good Practice Guidance for Land Use, Land-Use Change and Forestry; IPCC: Hayama, Japan, 2003; p. 295. [Google Scholar]
- National Greenhouse Gas Inventories Programme. IPCC Guidelines for National Greenhouse Gas Inventories; IGES: Hayama, Kanagawa, Japan, 2006. [Google Scholar]
- Keller, M.; Palace, M.; Hurtt, G. Biomass estimation in the Tapajos National Forest. Brazil examination of sampling and allometric uncertainties. For. Ecol. Manag. 2001, 154, 371–382. [Google Scholar] [CrossRef]
- Ketterings, Q.M.; Coe, R.; van Noordwijk, M.; Ambagau, Y.; Palm, C.A. Reducing uncertainty in the use of allometric biomass equations for predicting above ground tree biomass in mixed secondary forests. For. Ecol. Manag. 2001, 146, 199–209. [Google Scholar] [CrossRef]
- Huy, B.; Poudel, K.P.; Temegen, H. Aboveground biomass equations for evergreen broadleaf forests in South Central Coastal of Vietnam: Selection of eco-regional or pantropical models. For. Ecol. Manag. 2016, 376, 276–283. [Google Scholar] [CrossRef]
- Hijmans, R.J.; Cameron, S.E.; Parra, J.L.; Jones, P.G.; Jarvis, A. Very high resolution interpolated climate surfaces for global land areas. Int. J. Climatol. 2005, 25, 1965–1978. [Google Scholar] [CrossRef]
- Nachtergaele, F.O.; van Velthuizen, H.T.; Verelst, L.; Wiberg, D.; Batjes, N.H.; Dijkshoorn, J.A.; van Engelen, V.W.P.; Fischer, G.; Jones, A.; Montanarella, L.; et al. Harmonized World Soil Database (Version 1.2); FAO: Rome, Italy; IIASA: Laxenburg, Austria, 2012; p. 42. [Google Scholar]
- Huy, B.; Ly, C.T.; Hung, V.; Nguyen, T.T.H.; Dinh, N.D. Define CO2 Absorbed in the Broad-Leaf Ever-Green Forests in the Central Highlands of Vietnam to Join the REDD+ Program; Technical Report; Ministry of Education and Training: Ha Noi, Vietnam, 2013.
- Stewart, J.L.; Dunsdon, A.J.; Hellin, J.J.; Hughes, C.E. Wood Biomass Estimation of the Central American Dry Zone Species; Tropical Forestry Papers 26; Oxford Forestry Institute, Department of Plant Sciences, University of Oxford: Oxford, UK, 1992. [Google Scholar]
- Nlme: Linear and nonlinear mixed effects models. Available online: http://CRAN.R-project.org/package=nlme. (accessed on 19 August 2016).
- The R Project for Statistical Computing. Available online: https://www.R-project.org/ (accessed on 16 August 2016).
- Swanson, D.A.; Tayman, J.; Bryan, T.M. MAPE-R: A rescaled measure of accuracy for cross-sectional subnational population forecasts. J. Pop. Res. 2011, 28, 225–243. [Google Scholar] [CrossRef]
- Temesgen, H.; Zhang, C.H.; Zhao, X.H. Modelling tree height-diameter relationships in multi-species and multi-layered forests: A large observational study from Northeast China. For. Ecol. Manag. 2014, 316, 78–89. [Google Scholar] [CrossRef]
- Nelson, B.W.; Mesquita, R.; Pereira, J.L.G.; de Souza, S.G.A.; Batista, G.T.; Couta, L.B. Allometric regressions for improved estimate of secondary forest biomass in the Central Amazon. For. Ecol. Manag. 1999, 177, 149–167. [Google Scholar] [CrossRef]
- Cairns, M.A.; Olmsted, I.; Granados, J.; Argaez, J. Composition and aboveground tree biomass of the dry semi-evergreen forest on Mexico’s Yucatan Peninsula. For. Ecol. Manag. 2003, 186, 125–132. [Google Scholar] [CrossRef]
- Temesgen, H.; Affleck, D.; Poudel, K.P.; Gray, A.; Sessions, J. A review of the challenges and opportunities in estimating above ground forest biomass using tree-level models. Scand. J. For. Res. 2015, 30, 326–335. [Google Scholar]


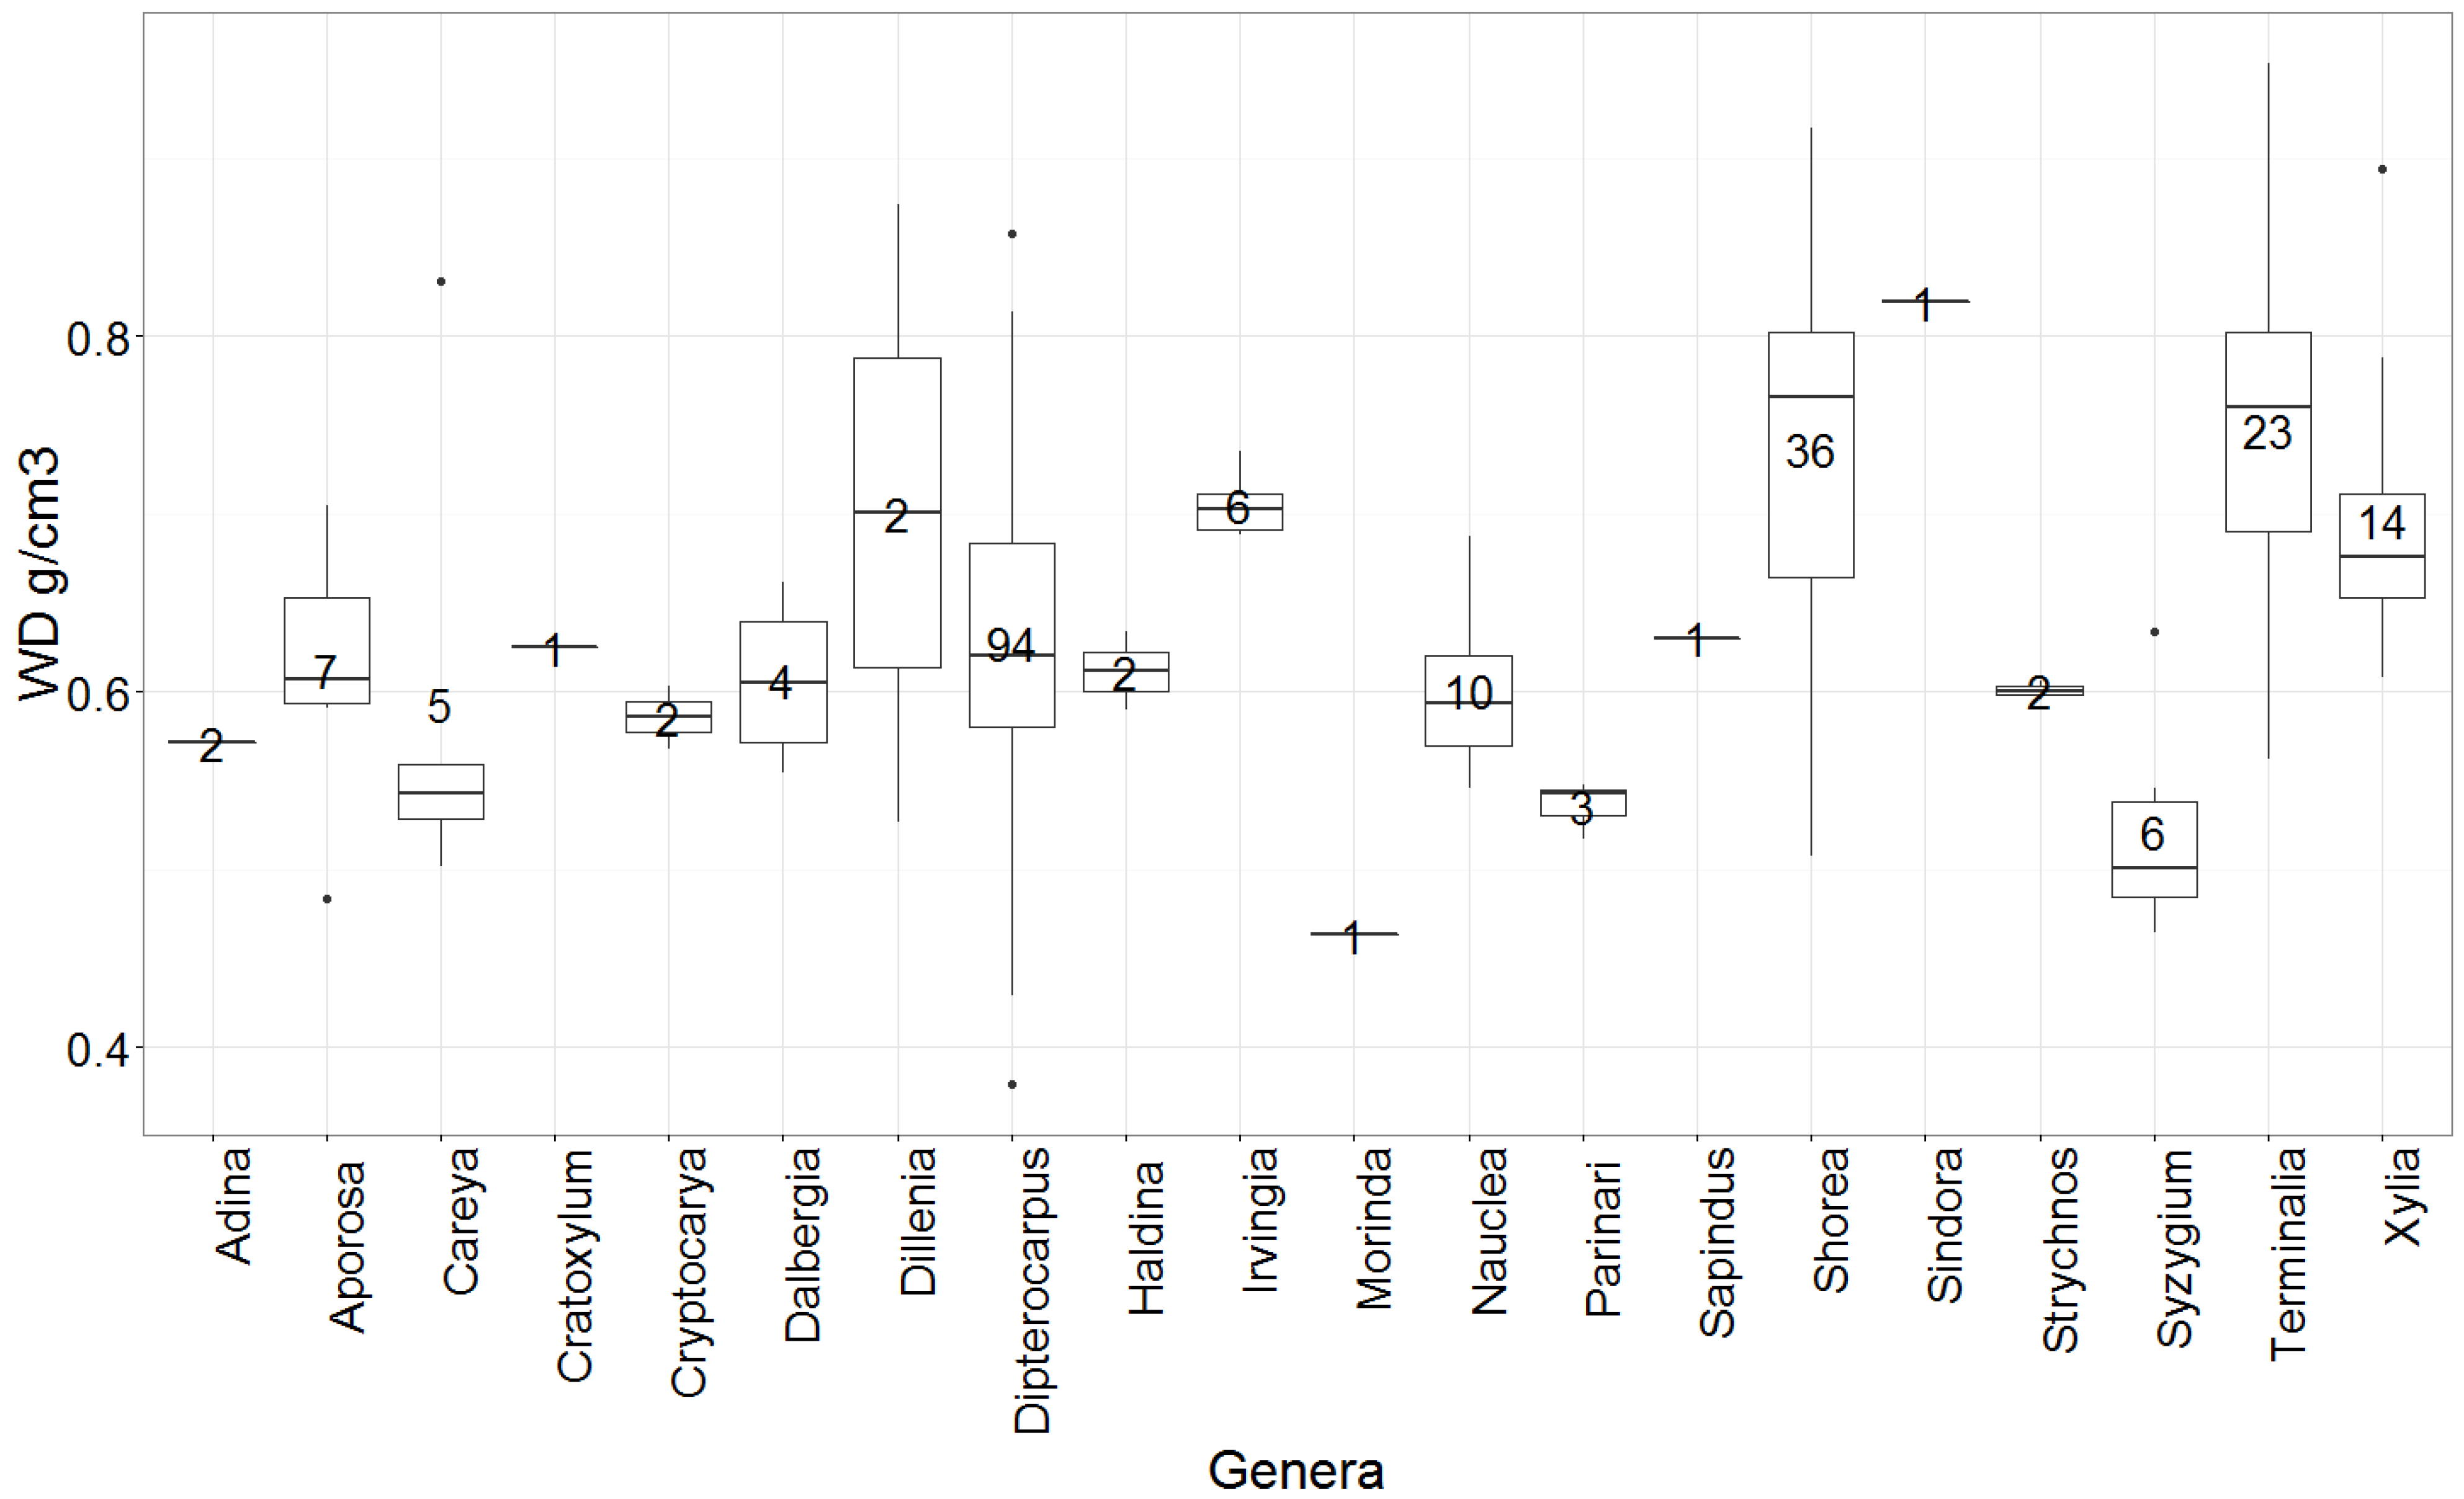
| Family/Genus/Species | N | Average WD (g/cm3) | SD of WD (g/cm3) |
|---|---|---|---|
| Chrysobalanaceae | 3 | 0.535665 | 0.016343 |
| Parinari | 3 | 0.535665 | 0.016343 |
| Parinari anamensis Hance | 3 | 0.535665 | 0.016343 |
| Combretaceae | 23 | 0.747057 | 0.094749 |
| Terminalia | 23 | 0.747057 | 0.094749 |
| Terminalia alata Roth | 16 | 0.730093 | 0.100805 |
| Terminalia corticosa Pierre ex Laness | 7 | 0.785830 | 0.070653 |
| Dilleniaceae | 2 | 0.700423 | 0.246027 |
| Dillenia | 2 | 0.700423 | 0.246027 |
| Dillenia sp. | 2 | 0.700423 | 0.246027 |
| Dipterocarpaceae | 130 | 0.657599 | 0.098560 |
| Dipterocarpus | 94 | 0.627294 | 0.080587 |
| Dipterocarpus intricatus Dyer | 21 | 0.589667 | 0.037682 |
| Dipterocarpus obtusifolius Teijsm. ex Miq. | 10 | 0.640704 | 0.050715 |
| Dipterocarpus tuberculatus Roxb. | 63 | 0.637707 | 0.091056 |
| Shorea | 36 | 0.736729 | 0.098185 |
| Shorea obtusa Wall. ex Blume | 28 | 0.772400 | 0.074928 |
| Shorea siamensis Miq. | 8 | 0.611881 | 0.060359 |
| Phyllanthaceae | 7 | 0.612478 | 0.074246 |
| Aporosa | 7 | 0.612478 | 0.074246 |
| Aporosa sp. | 7 | 0.612478 | 0.074246 |
| Hypericaceae | 1 | 0.625000 | - |
| Cratoxylum | 1 | 0.625000 | - |
| Cratoxylum formosum (Jacq.) Benth. & Hook.f. ex Dyer | 1 | 0.625000 | - |
| Irvingiaceae | 6 | 0.704833 | 0.017702 |
| Irvingia | 6 | 0.704833 | 0.017702 |
| Irvingia malayana Oliv. ex A.W.Benn. | 6 | 0.704833 | 0.017702 |
| Lauraceae | 2 | 0.585500 | 0.024749 |
| Cryptocarya | 2 | 0.585500 | 0.024749 |
| Cryptocarya sp. | 2 | 0.585500 | 0.024749 |
| Lecythidaceae | 5 | 0.592586 | 0.134872 |
| Careya | 5 | 0.592586 | 0.134872 |
| Careya arborea Roxb. | 5 | 0.592586 | 0.134872 |
| Leguminosae | 19 | 0.683648 | 0.082150 |
| Dalbergia | 4 | 0.606063 | 0.049240 |
| Dalbergia cochinchinensis Pierre | 3 | 0.587667 | 0.040079 |
| Dalbergia nigrescens var. saigonensis (Pierre) Gagnep. | 1 | 0.661252 | - |
| Sindora | 1 | 0.818989 | - |
| Sindora siamensis Miq. | 1 | 0.818989 | - |
| Xylia | 14 | 0.696148 | 0.073180 |
| Xylia xylocarpa (Roxb.) Taub. | 14 | 0.696148 | 0.073180 |
| Loganiaceae | 2 | 0.600613 | 0.006983 |
| Strychnos | 2 | 0.600613 | 0.006983 |
| Strychnos nux-blanda A.W. Hill | 2 | 0.600613 | 0.006983 |
| Myrtaceae | 6 | 0.521244 | 0.062018 |
| Syzygium | 6 | 0.521244 | 0.062018 |
| Syzygium cumini (L.) Skeels | 2 | 0.589732 | 0.062332 |
| Syzygium sp. | 4 | 0.487000 | 0.020607 |
| Rubiaceae | 15 | 0.589079 | 0.051010 |
| Adina | 2 | 0.571000 | 0.000000 |
| Adina pilulifera (Lam.) Franch. ex Drake | 2 | 0.571000 | 0.000000 |
| Haldina | 2 | 0.611293 | 0.031190 |
| Haldina cordifolia (Roxb.) Ridsdale | 2 | 0.611293 | 0.031190 |
| Morinda | 1 | 0.463000 | - |
| Morinda citrifolia L. | 1 | 0.463000 | - |
| Nauclea | 10 | 0.600860 | 0.042858 |
| Nauclea orientalis (L.) L. | 10 | 0.600860 | 0.042858 |
| Sapindaceae | 1 | 0.630000 | - |
| Sapindus | 1 | 0.630000 | - |
| Sapindus saponaria L. | 1 | 0.630000 | - |
| Grand Total | 222 | 0.656475 | 0.101823 |
| Level | Summary | DBH (cm) | H (m) | WD (g/cm3) | AGB (kg) |
|---|---|---|---|---|---|
| Mixed-Species | Min | 3.4 | 2.5 | 0.379 | 1.3 |
| Average | 17.6 | 10.3 | 0.656 | 184.9 | |
| Max | 48.8 | 23.5 | 0.953 | 1710.8 | |
| Standard Deviation | 10.3 | 4.5 | 0.102 | 315.0 | |
| n | 222 | 222 | 222 | 222 | |
| Dipterocarpus Genus | Min | 4.9 | 3.8 | 0.379 | 1.5 |
| Average | 20.4 | 11.2 | 0.627 | 285.6 | |
| Max | 48.8 | 23.5 | 0.858 | 1710.8 | |
| Standard Deviation | 12.4 | 5.3 | 0.081 | 431.8 | |
| n | 94 | 94 | 94 | 94 | |
| Shorea Genus | Min | 5.6 | 4.4 | 0.507 | 2.9 |
| Average | 15.2 | 9.4 | 0.737 | 86.4 | |
| Max | 23.0 | 14.1 | 0.917 | 205.9 | |
| Standard Deviation | 4.2 | 2.4 | 0.098 | 52.5 | |
| n | 36 | 36 | 36 | 36 |
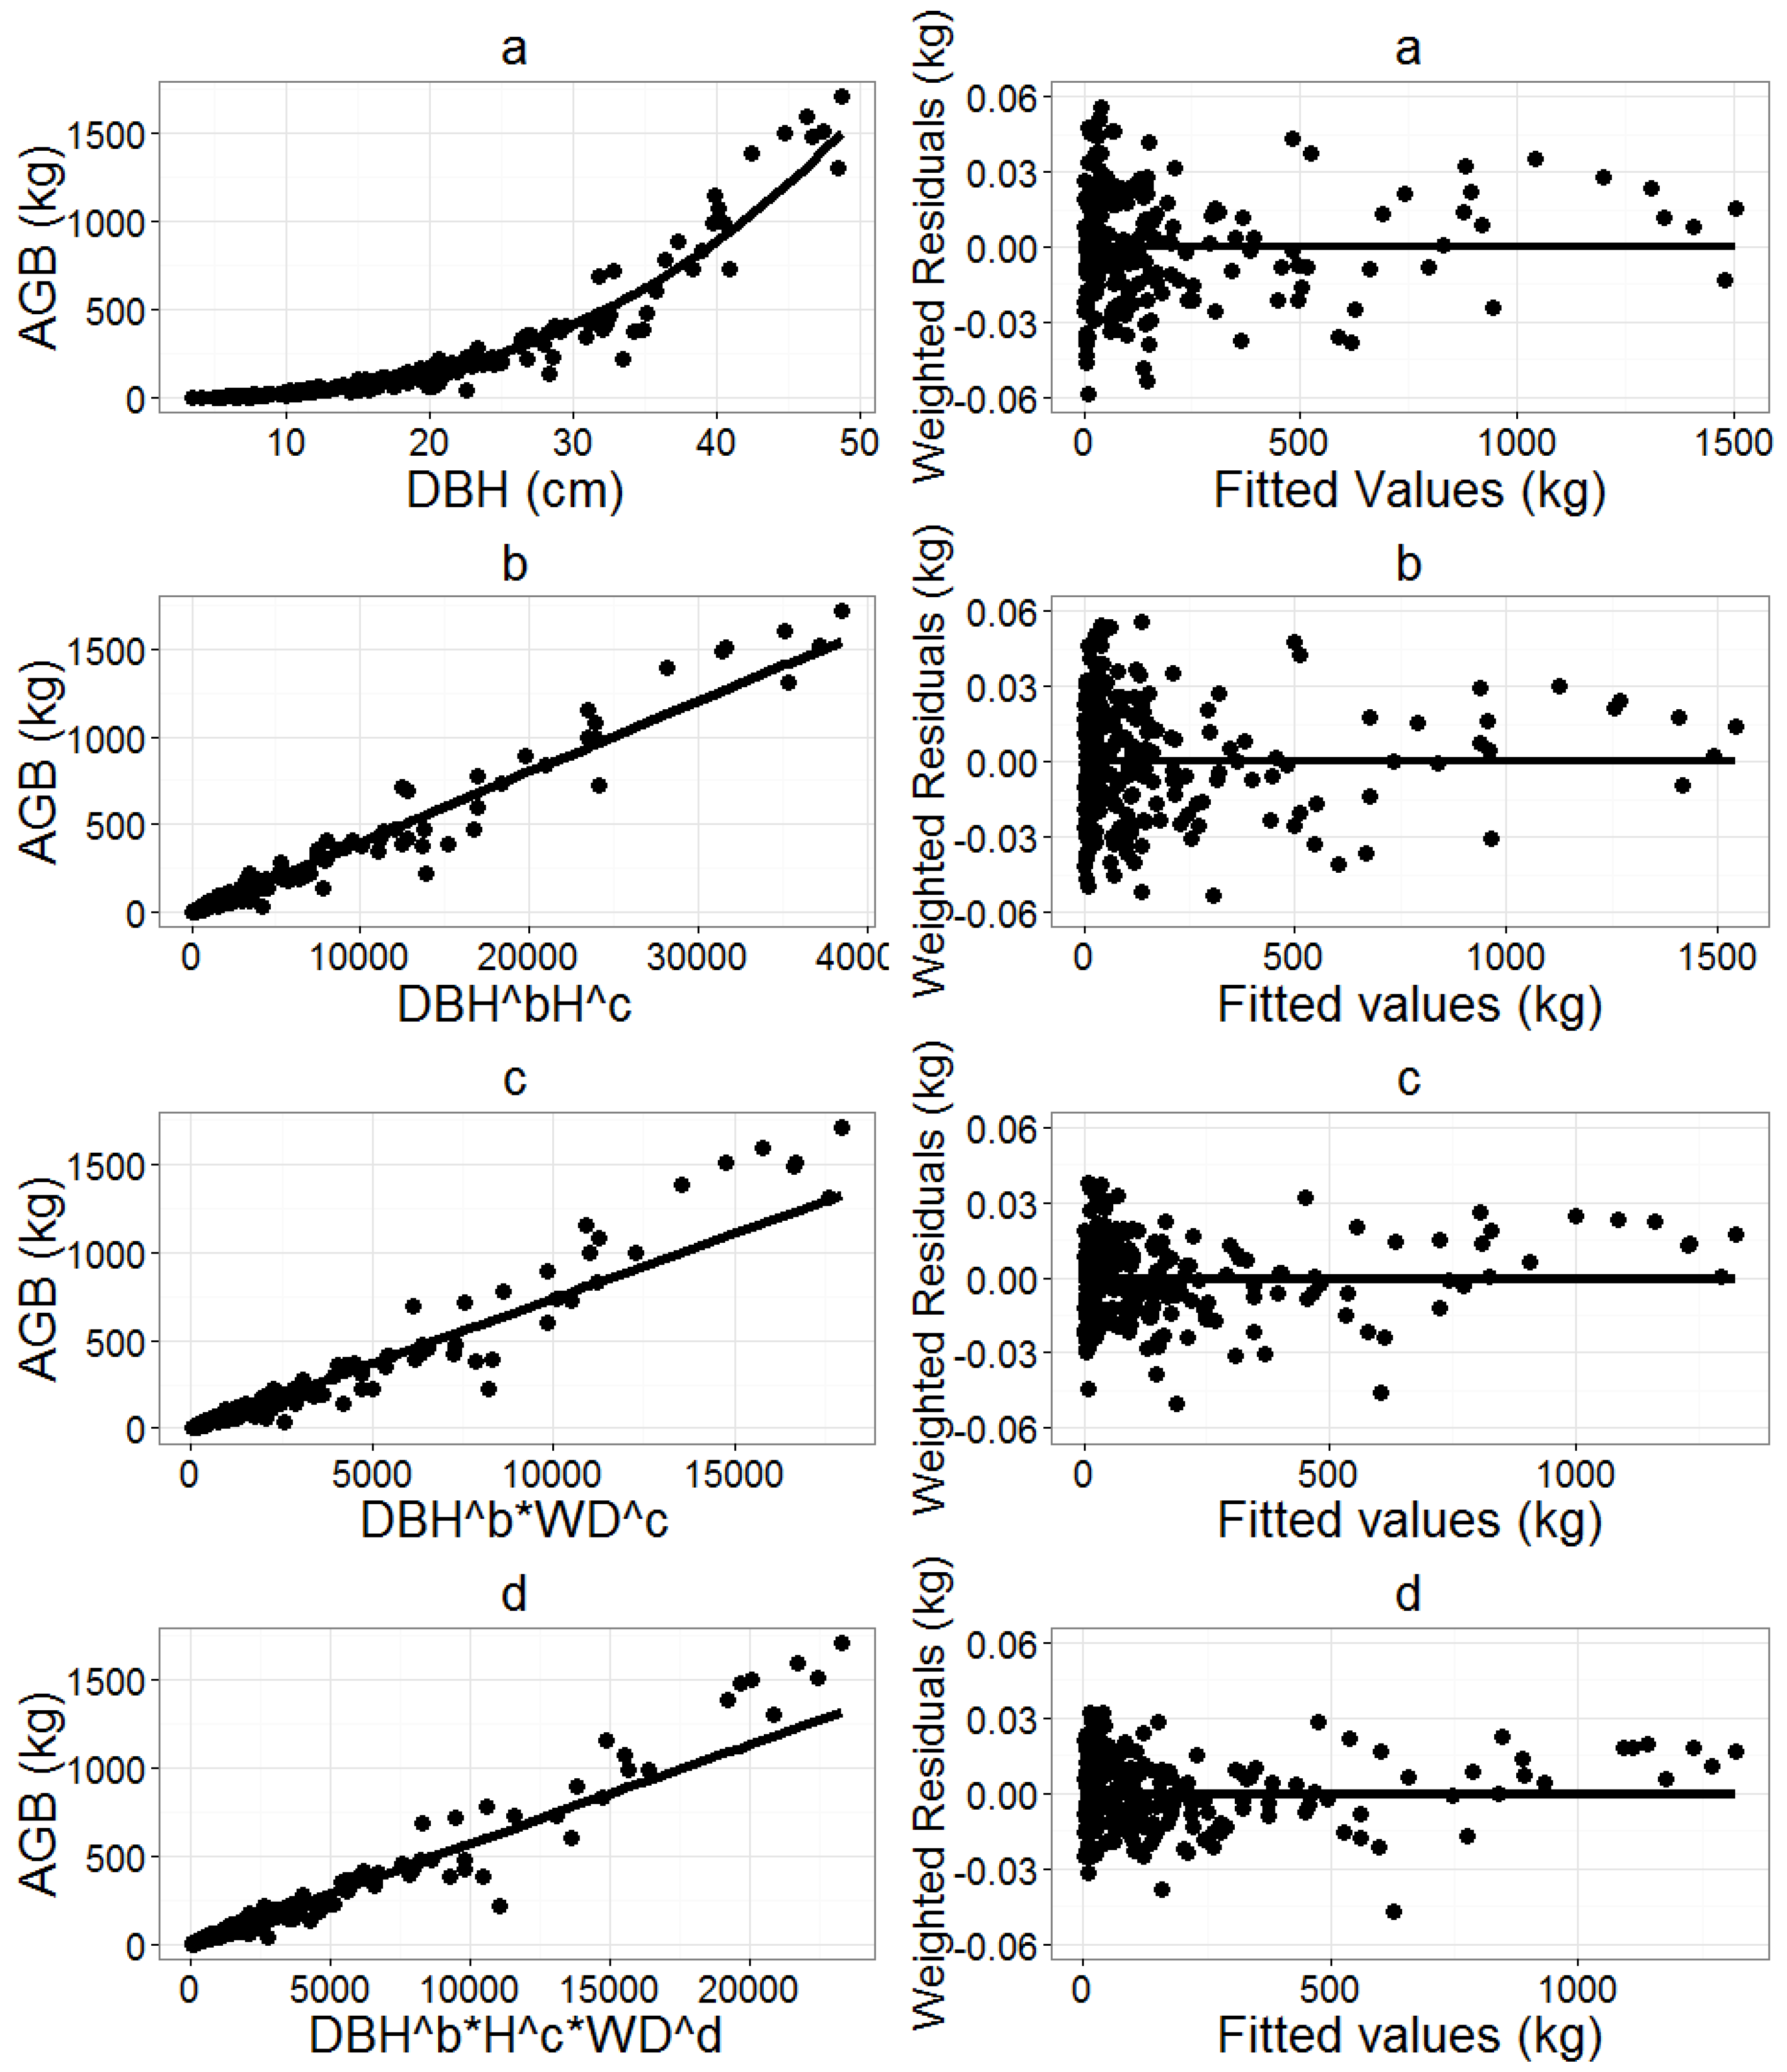
| Model Selected | Model Form | Random Effect | Weight Variable | AIC | Adj. R2 | RMSPE |
|---|---|---|---|---|---|---|
| Covariate: DBH | ||||||
| M1 | AGB = a × DBHb | None | 1/DBH k | 1335 | 0.966 | 59.0 |
| AGB = a × DBHb | Ecoregion | 1/DBH k | 1335 | 0.966 | 59.0 | |
| M2 | Covariates: DBH and H | |||||
| AGB = a × (DBH2H)b | None | 1/(DBH2H) k | 1374 | 0.967 | 48.1 | |
| AGB = a × DBHb × Hc | None | 1/DBH k | 1324 | 0.975 | 51.1 | |
| AGB = a × DBHb × Hc | Ecoregion | 1/DBH k | 1324 | 0.975 | 51.1 | |
| M3 | Covariates: DBH and WD | |||||
| AGB = a × (DBH2WD)b | None | 1/(DBH2WD) k | 1337 | 0.901 | 53.7 | |
| AGB = a × DBHb × WDc | None | 1/DBH k | 1322 | 0.933 | 54.8 | |
| AGB = a × DBHb × WDc | Ecoregion | 1/DBH k | 1322 | 0.933 | 54.8 | |
| M4 | Covariates: DBH, H, and WD | |||||
| AGB = a × (DBH2HWD)b | None | 1/(DBH2HWD) k | 1323 | 0.945 | 39.3 | |
| AGB = a × DBHb × Hc × WDd | None | 1/DBH k | 1298 | 0.940 | 43.7 | |
| AGB = a × DBHb × Hc × WDd | Ecoregion | 1/DBH k | 1280 | 0.940 | 43.7 | |
| Model Selected | Covariate (s) | Model Form | Parameter Estimates | Standard Error | |
|---|---|---|---|---|---|
| M1 | DBH | a | 0.04742 | 0.00434 | |
| b | 2.66663 | 0.03151 | |||
| M2 | DBH, H | a | 0.03844 | 0.00377 | |
| b | 2.40756 | 0.05861 | |||
| c | 0.40408 | 0.07988 | |||
| M3 | DBH, WD | a | 0.07126 | 0.00843 | |
| b | 2.60940 | 0.03290 | |||
| c | 0.59275 | 0.59275 | |||
| M4 | DBH, H, WD | a | 0.06203 | 0.00679 | |
| b | 2.26430 | 0.05754 | |||
| c | 0.51415 | 0.07497 | |||
| d | 0.79456 | 0.11420 | |||
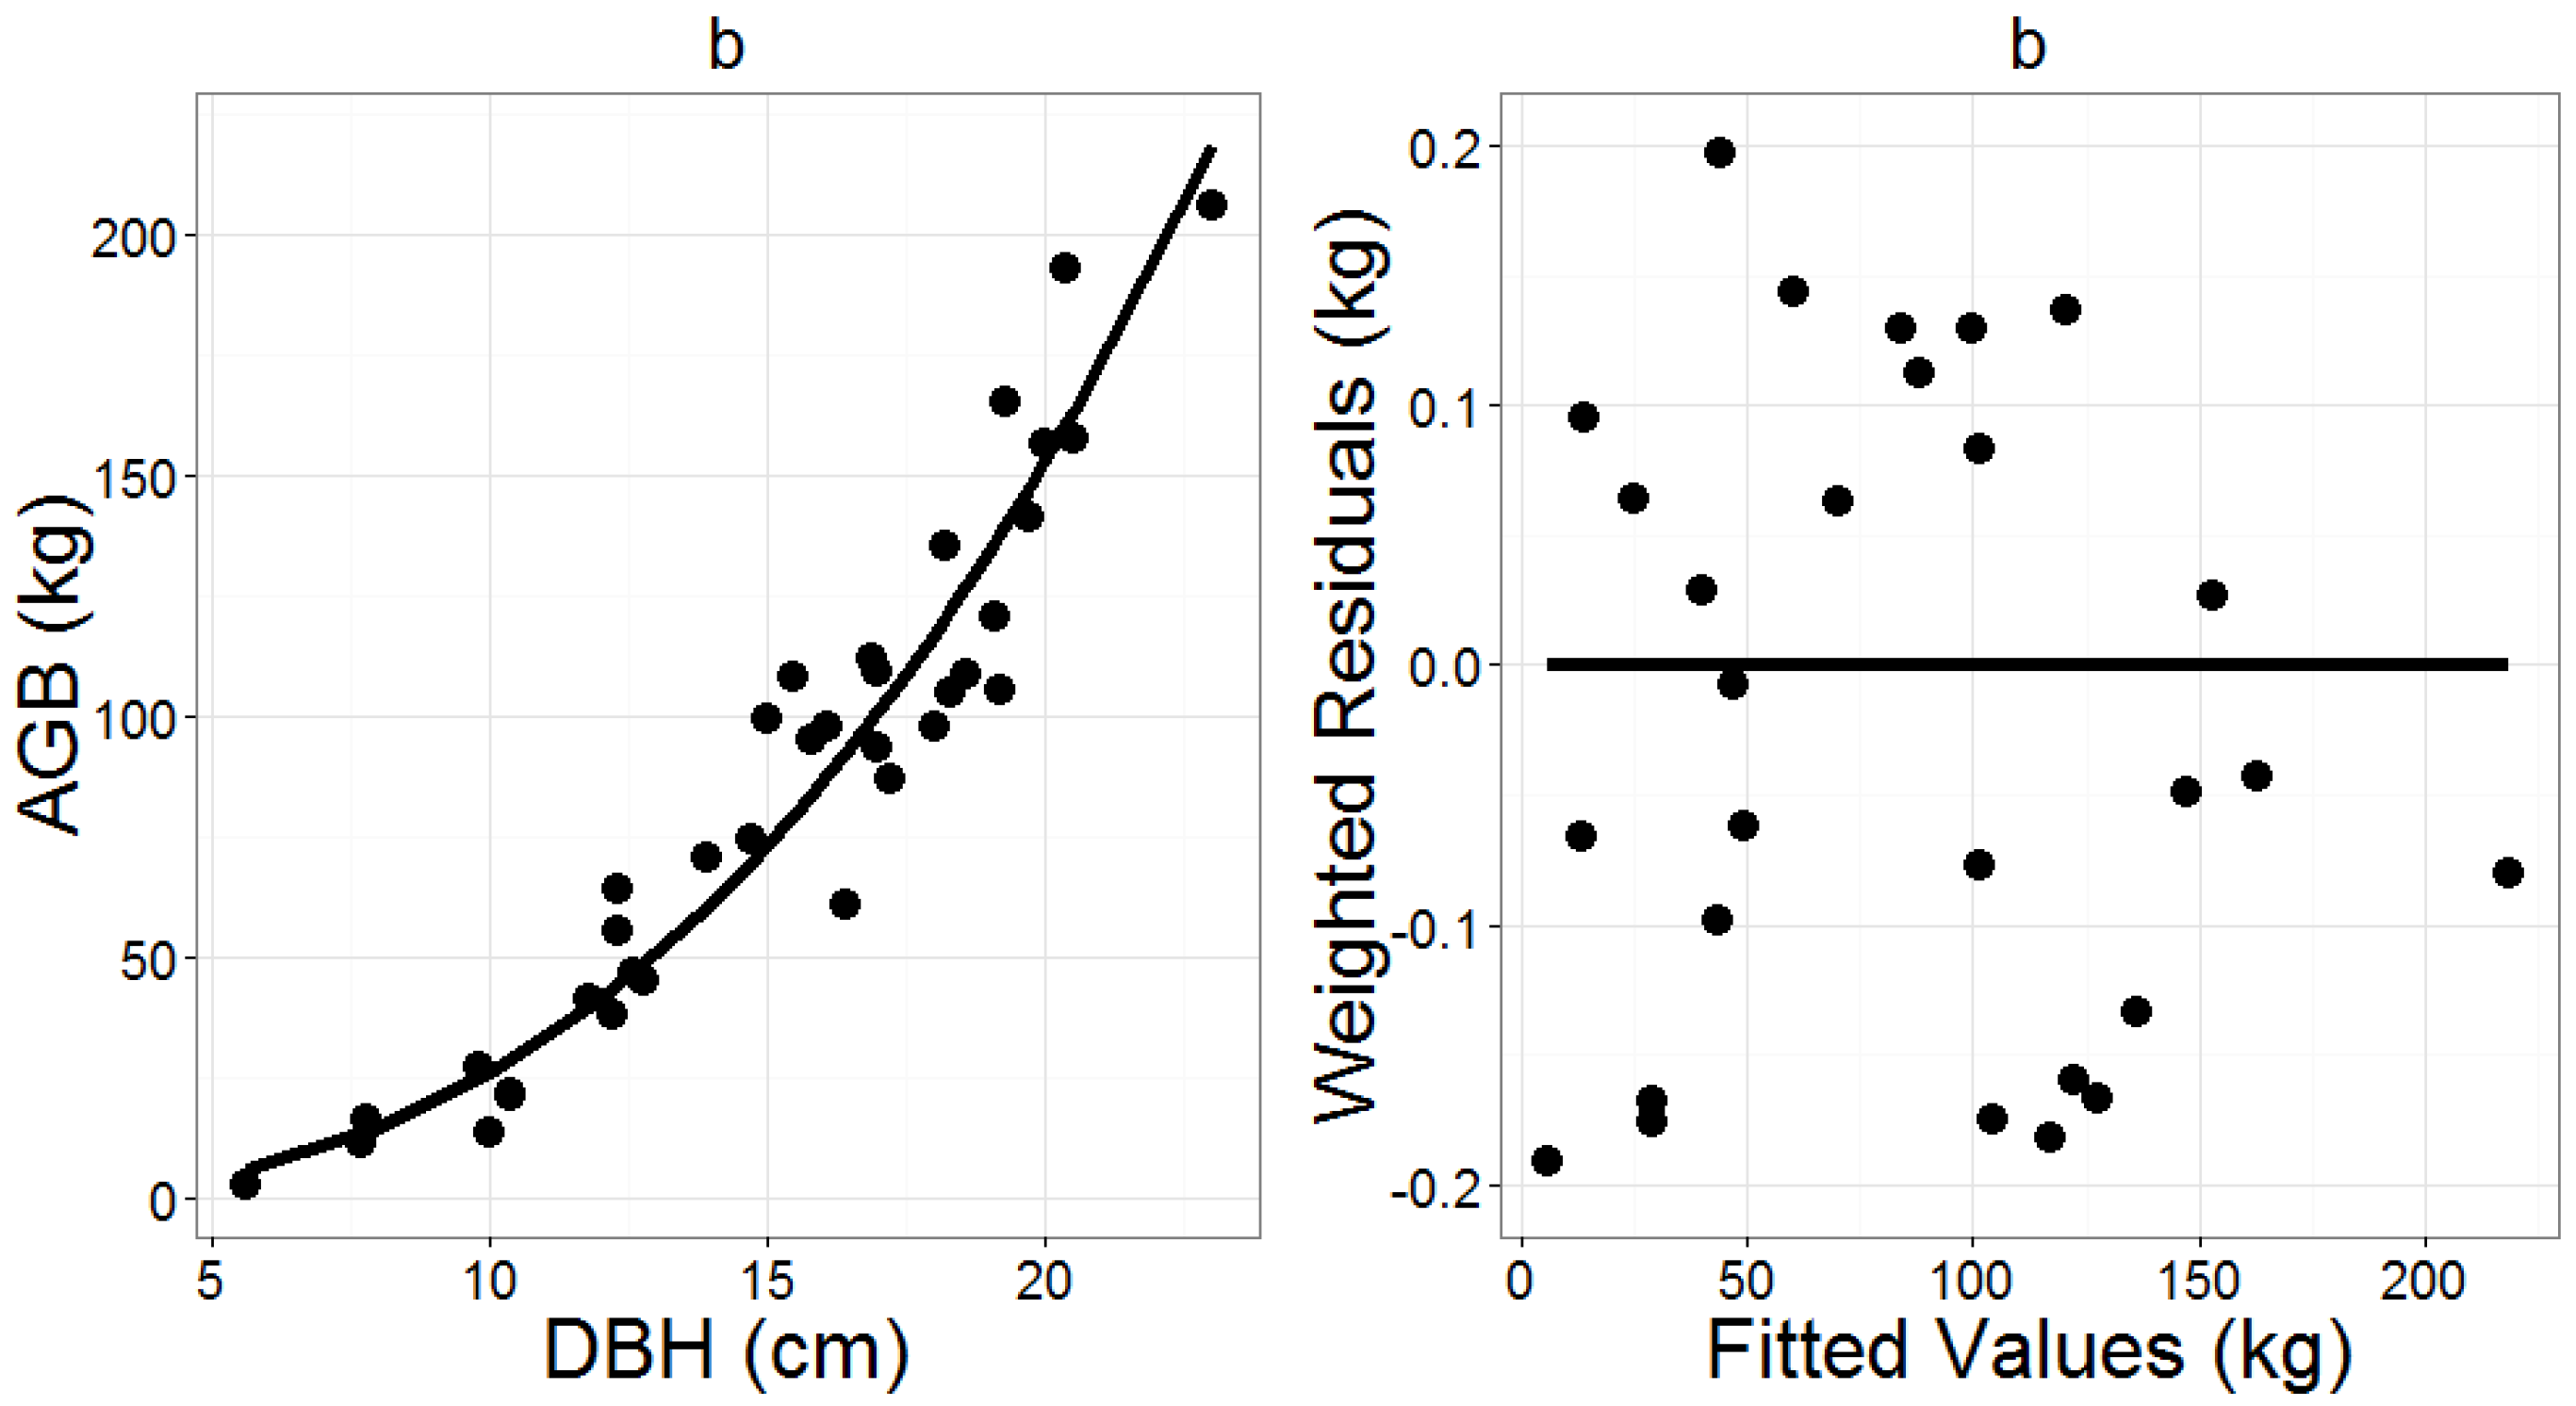
| Model Selected | Covariate(s) | Model Form | Weight Variable | AIC | Adj. R2 | RMSPE |
|---|---|---|---|---|---|---|
| Genus: Dipterocarpus | ||||||
| D1 | DBH | AGB = a × DBHb | 1/DBH k | 600 | 0.970 | 60.7 |
| D2 | DBH, H | AGB = a × (DBH2H)b | 1/DBH k | 616 | 0.965 | 46.5 |
| AGB = a × DBHb × Hc | 1/DBH k | 600 | 0.979 | 54.1 | ||
| D3 | DBH, WD | AGB = a × (DBH2WD)b | 1/(DBH2WD) k | 603 | 0.920 | 61.8 |
| AGB = a × DBHb × WDc(#) | 1/DBH k | 605 | 0.952 | 59.9 | ||
| D4 | DBH, H, WD | AGB = a × (DBH2HWD)b | 1/(DBH2HWD) k | 602 | 0.970 | 45.2 |
| AGB = a × DBHb × Hc × WDd | 1/DBH k | 601 | 0.970 | 49.8 | ||
| Genus: Shorea | ||||||
| S1 | DBH | AGB = a × DBHb | 1/DBH k | 220 | 0.919 | 25.4 |
| S2 | DBH, H | AGB = a × (DBH2H)b | 1/(DBH2H) k | 231 | 0.861 | 33.6 |
| AGB = a × DBHb × Hc(#) | 1/DBH k | 227 | 0.921 | 25.9 | ||
| S3 | DBH, WD | AGB = a × (DBH2WD)b | 1/(DBH2WD) k | 224 | 0.881 | 22.3 |
| AGB = a × DBHb × WDc(#) | 1/DBH k | 226 | 0.912 | 22.6 | ||
| S4 | DBH, H, WD | AGB = a × (DBH2HWD)b | 1/(DBH2HWD) k | 220 | 0.894 | 24.0 |
| AGB = a × DBHb × Hc(#) × WDd | 1/DBH k | 231 | 0.920 | 21.0 | ||
| Model Selected | Covariate (s) | Model Form | Parameter Estimates | Standard Error | ||
|---|---|---|---|---|---|---|
| a | b | a | b | |||
| Genus: Dipterocarpus | ||||||
| D1 | DBH | 0.03713 | 2.73813 | 0.00488 | 0.04310 | |
| D2 | DBH, H | 290.370 | 1.03913 | 9.30399 | 0.01900 | |
| D3 | DBH, WD | 0.09387 | 1.31539 | 0.01047 | 0.02101 | |
| D4 | DBH, H, WD | 0.45812 | 1.00673 | 0.04729 | 0.01707 | |
| Genus: Shorea | ||||||
| S1 | DBH | 0.07483 | 2.54496 | 0.02897 | 0.13722 | |
| S2 | DBH, H | 325.264 | 0.95220 | 24.2081 | 0.04909 | |
| S3 | DBH, WD | 0.19114 | 1.16390 | 0.06181 | 0.06166 | |
| S4 | DBH, H, WD | 0.69838 | 0.92173 | 0.13807 | 0.03772 | |
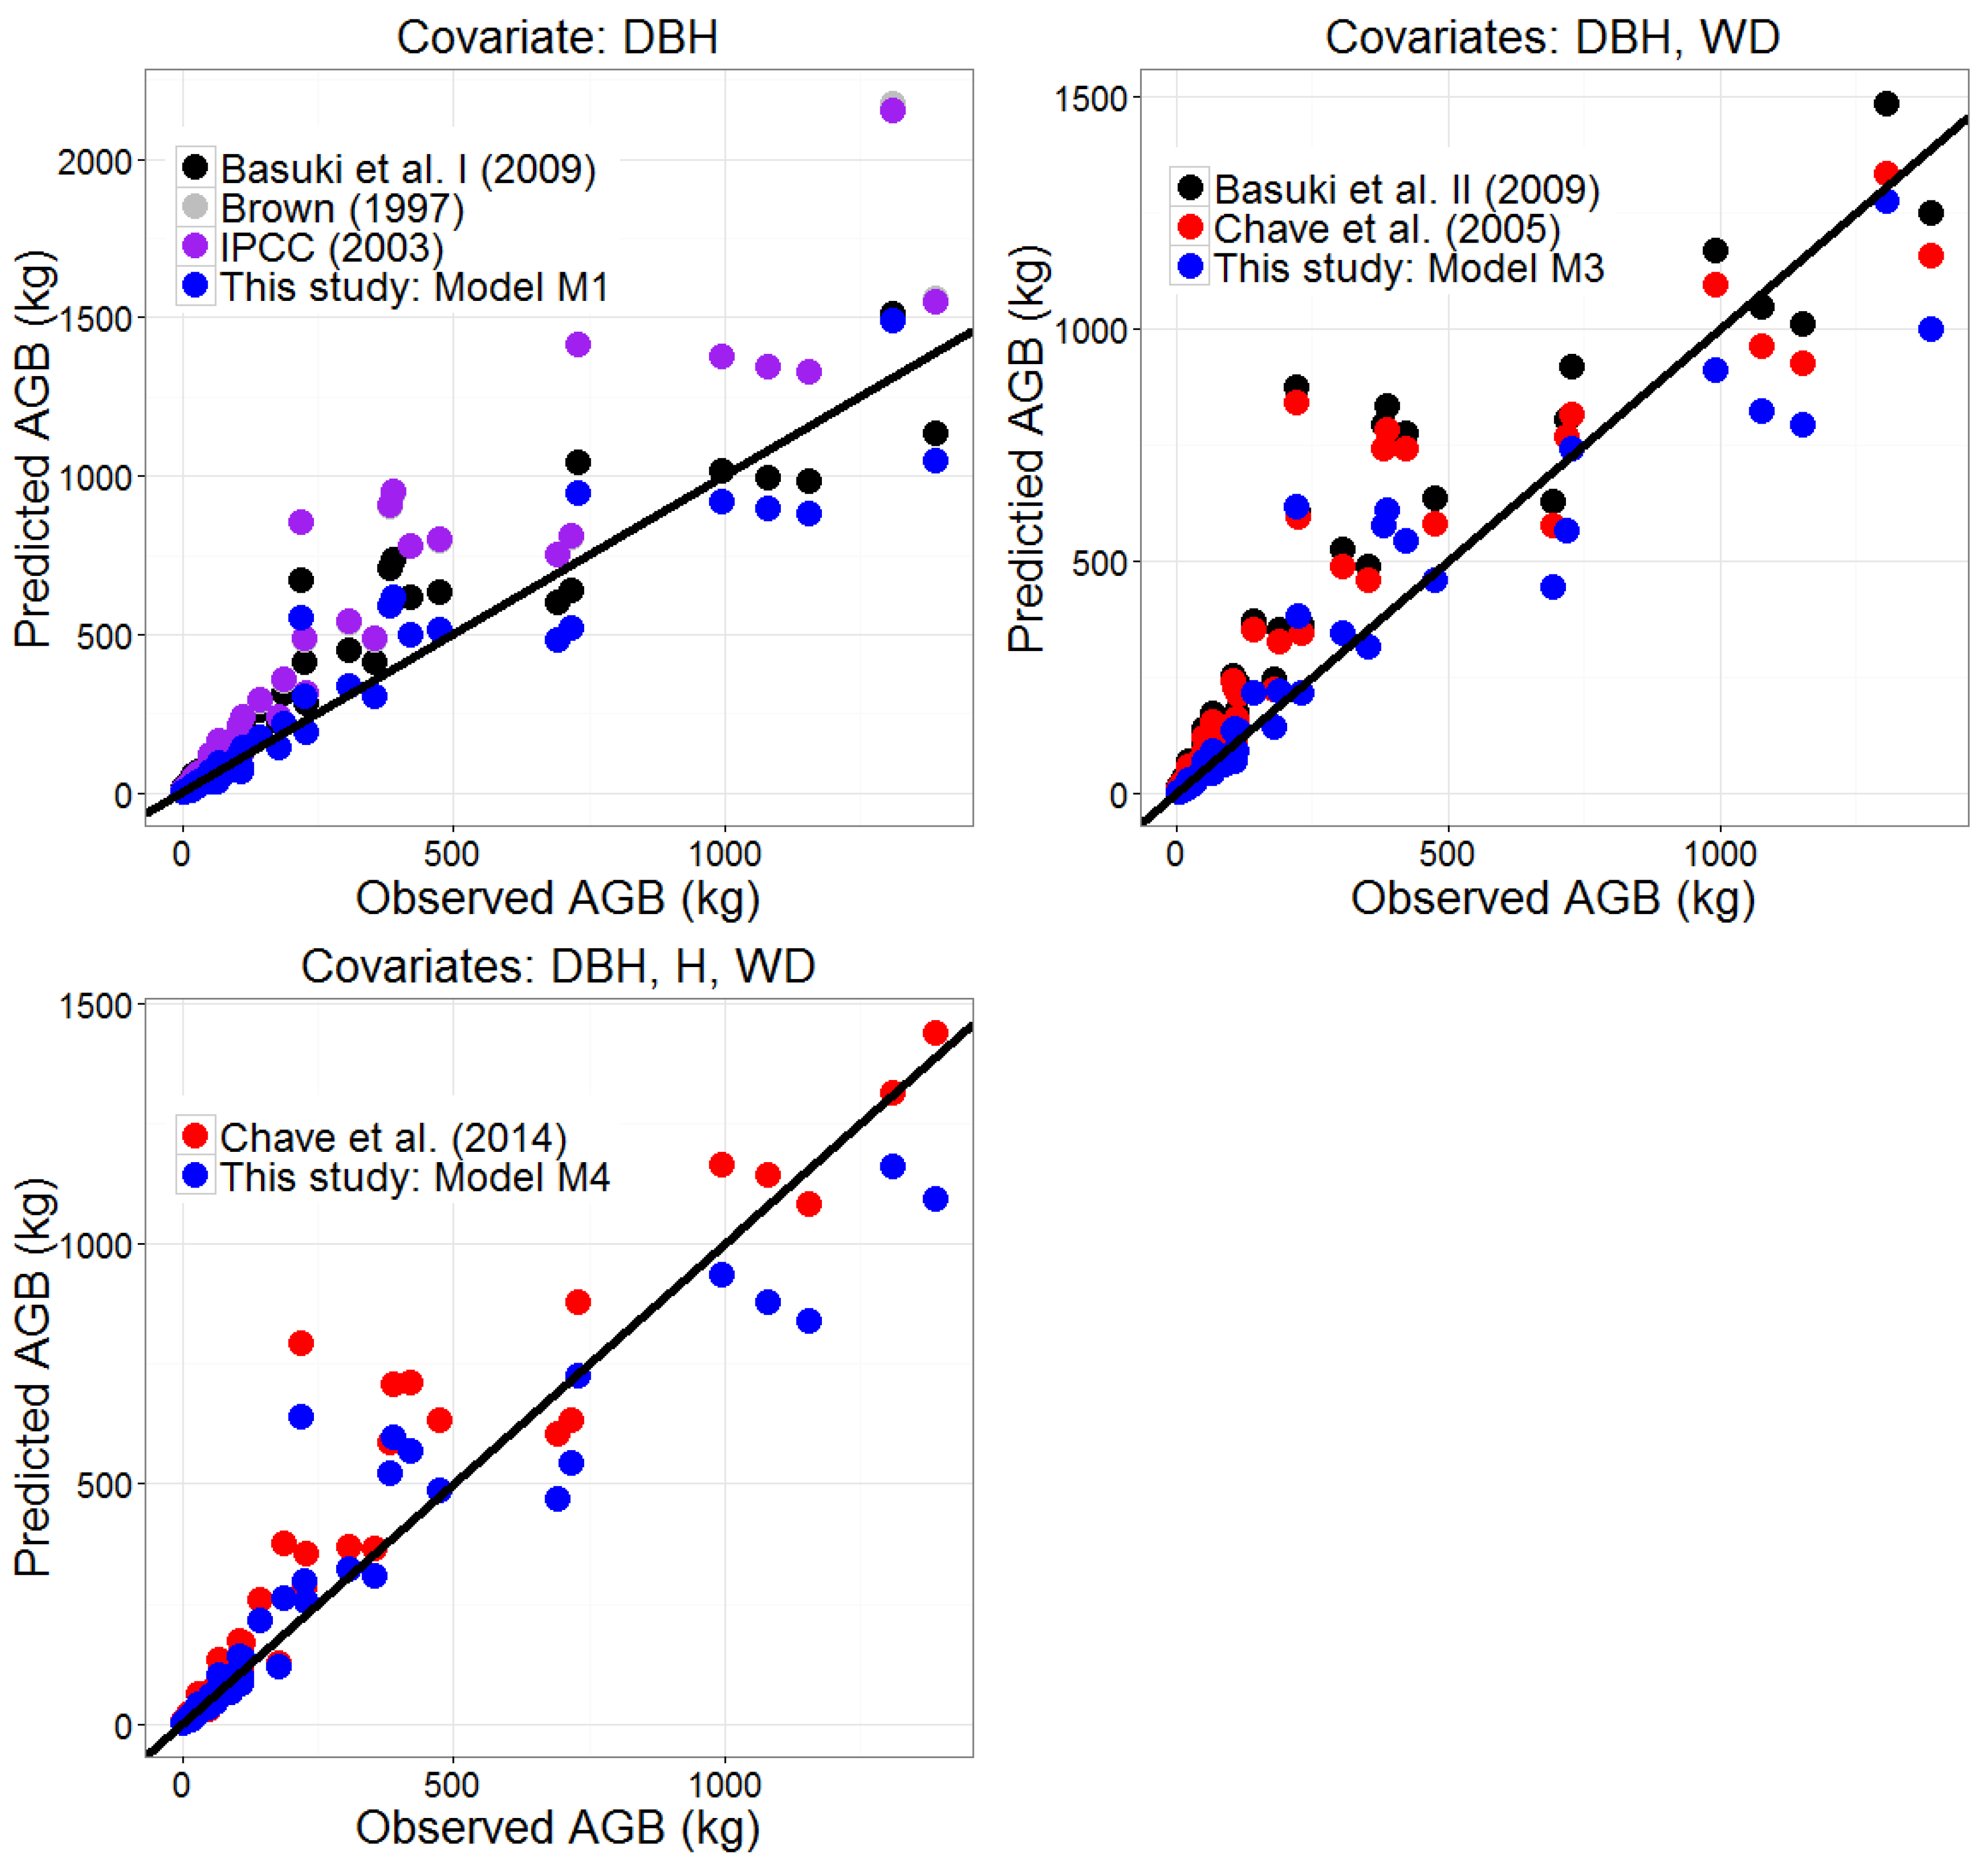
| Covariate (s) | Model | DBH Class (cm) | Percent Bias | RMSPE | MAPE |
|---|---|---|---|---|---|
| DBH | Brown (1997) [12] Equation (9) | <15 | −86.5 | 106.7 | 86.5 |
| 15–30 | −74.0 | 80.9 | 74.0 | ||
| >30 | −79.0 | 92.7 | 79.0 | ||
| All | −80.9 | 101.5 | 80.9 | ||
| IPCC (2003) [18] Equation (10) | <15 | −86.8 | 106.4 | 86.8 | |
| 15–30 | −76.2 | 83.1 | 76.2 | ||
| > 30 | −79.2 | 93.0 | 79.2 | ||
| All | −81.9 | 102.0 | 81.9 | ||
| Basuki et al. I (2009) [13] Equation (13) | <15 | −132.2 | 163.5 | 132.2 | |
| 15–30 | −64.6 | 72.0 | 64.6 | ||
| > 30 | −37.7 | 57.6 | 47.8 | ||
| All | −92.3 | 126.2 | 94.2 | ||
| M1 | <15 | 2.5 | 32.0 | 24.3 | |
| 15–30 | −3.4 | 21.9 | 19.4 | ||
| >30 | −17.2 | 43.7 | 38.1 | ||
| All | −3.1 | 34.6 | 25.2 | ||
| DBH, H | M2 | <15 | 0.1 | 31.6 | 24.2 |
| 15–30 | −2.1 | 19.9 | 16.9 | ||
| >30 | −18.0 | 41.8 | 36.2 | ||
| All | −3.9 | 33.5 | 24.0 | ||
| DBH, WD | Chave et al. (2005) [16] Equation (11) | <15 | −97.2 | 117.3 | 97.3 |
| 15–30 | −73.8 | 83.8 | 73.8 | ||
| >30 | −46.5 | 69.7 | 56.0 | ||
| All | −79.2 | 105.0 | 81.1 | ||
| Basuki et al. II (2009) [13] Equation (14) | <15 | −139.2 | 164.2 | 139.2 | |
| 15–30 | −90.3 | 99.1 | 90.3 | ||
| >30 | −56.4 | 76.4 | 61.5 | ||
| All | −107.6 | 136.9 | 108.7 | ||
| M3 | < 15 | 2.8 | 28.4 | 21.1 | |
| 15–30 | −8.3 | 27.4 | 23.6 | ||
| >30 | −15.5 | 47.2 | 39.6 | ||
| All | −4.1 | 36.5 | 25.7 | ||
| DBH, H, WD | Chave et al. (2014) [17] Equation (12) | <15 | −27.1 | 44.5 | 33.0 |
| 15–30 | −30.9 | 41.8 | 33.9 | ||
| >30 | −42.9 | 60.3 | 48.2 | ||
| All | -31.2 | 53.5 | 36.6 | ||
| M4 | < 15 | 0.1 | 26.5 | 20.6 | |
| 15–30 | −7.4 | 23.7 | 20.2 | ||
| >30 | −16.6 | 46.1 | 38.5 | ||
| All | −5.2 | 34.7 | 24.2 |
| Genus | Covariate (s) | Equation | DBH Class (cm) | Percent Bias | RMSPE | MAPE |
|---|---|---|---|---|---|---|
| Dipterocarpus | DBH | Basuki et al. I (2009) [13] Equation (15) | <15 | −91.7 | 94.9 | 91.7 |
| 15–30 | −61.8 | 61.5 | 61.4 | |||
| >30 | −5.7 | 30.5 | 27.6 | |||
| All | −50.9 | 70.6 | 59.7 | |||
| D1 | <15 | 18.4 | 19.5 | 18.4 | ||
| 15–30 | −5.2 | 17.2 | 17.2 | |||
| >30 | 0.2 | 28.2 | 25.9 | |||
| All | 7.9 | 24.2 | 21.8 | |||
| Shorea | DBH | Basuki et al. (2009) [13] Equation (16) | <15 | 13.3 | 15.7 | 15.8 |
| 15–30 | 6.8 | 19.4 | 17.9 | |||
| >30 | - | - | - | |||
| All | 10.4 | 18.0 | 16.7 | |||
| S1 | <15 | 16.8 | 18.2 | 18.4 | ||
| 15–30 | −1.2 | 23.5 | 22.7 | |||
| >30 | - | - | - | |||
| All | 9.6 | 21.2 | 19.9 |
© 2016 by the authors; licensee MDPI, Basel, Switzerland. This article is an open access article distributed under the terms and conditions of the Creative Commons Attribution (CC-BY) license (http://creativecommons.org/licenses/by/4.0/).
Share and Cite
Huy, B.; Poudel, K.P.; Kralicek, K.; Hung, N.D.; Khoa, P.V.; Phương, V.T.; Temesgen, H. Allometric Equations for Estimating Tree Aboveground Biomass in Tropical Dipterocarp Forests of Vietnam. Forests 2016, 7, 180. https://doi.org/10.3390/f7080180
Huy B, Poudel KP, Kralicek K, Hung ND, Khoa PV, Phương VT, Temesgen H. Allometric Equations for Estimating Tree Aboveground Biomass in Tropical Dipterocarp Forests of Vietnam. Forests. 2016; 7(8):180. https://doi.org/10.3390/f7080180
Chicago/Turabian StyleHuy, Bao, Krishna P. Poudel, Karin Kralicek, Nguyen Dinh Hung, Phung Van Khoa, Vu Tan Phương, and Hailemariam Temesgen. 2016. "Allometric Equations for Estimating Tree Aboveground Biomass in Tropical Dipterocarp Forests of Vietnam" Forests 7, no. 8: 180. https://doi.org/10.3390/f7080180
APA StyleHuy, B., Poudel, K. P., Kralicek, K., Hung, N. D., Khoa, P. V., Phương, V. T., & Temesgen, H. (2016). Allometric Equations for Estimating Tree Aboveground Biomass in Tropical Dipterocarp Forests of Vietnam. Forests, 7(8), 180. https://doi.org/10.3390/f7080180