Abstract
The forests of the boreal biome, which perform an important climate-regulating function, are the most susceptible to forest fires. An important task is to obtain quantitative estimates of carbon (C) losses of forest ecosystems under different fire damage scenarios, as well as the possibility of such estimates based on remote sensing data. Our study provides comprehensive field data on C stocks in pools of plant phytomass and necromass, forest litter, and ground cover for a vast area of boreal forests in the Russian Far East. We studied forests of the larch formation that have been affected by fires of varying intensity. The severity of the fires was assessed based on differenced Normalized Burn Ratio (dNBR). The variation in C pools depending on the strength of the fire is shown. We did not find a relationship of C stocks with the dNBR in the forests in the south of the study area that might have caused the rapid change of species during post-fire recovery. In the northern part of the area, there is a trend of a decrease in plant phytomass with an increase in dNBR (R2 = 0.78). The proportion of dead standing wood share in the total C stock increases with increasing fire severity (R2 = 0.63). The maximum and average C stocks in the litter were 10.6 and 3.9 t C ha−1, respectively; coarse woody debris contained 8.7 and 2.0 t C ha−1; carbon stocks in living ground cover were 1.2 on average and reached 4.7 t C ha−1. Our study shows that dNBR can serve as a good predictor of the C stock of phytomass after a fire in the northern part of the Far East region, which opens up opportunities for approximate quantitative remote estimates of C losses.
1. Introduction
Recently, there has been a growing interest in the boreal forest among researchers. This is mainly due to the particularly important role of this biome in the terrestrial biogenic carbon (C) cycle and its significant contribution to the functioning of the Earth’s climate system. The vegetation and soils (including permafrost area) of boreal forests contain 37% of the total C stock of terrestrial ecosystems [1]. The increase in greenhouse gas emissions in boreal forests against the background of warming and catastrophic disturbances, primarily fires, is of great concern.
The Far East region occupies 40% of the territory of Russia with a forest area of 344 million hectares, which is 29%–38% of the total area of global boreal forests [1]. Larch forests and permafrost are mainly common here [2]. The Far East is characterized by the maximum forest burning in the boreal biome: the area of forest fires here reaches 4 million ha yr−1 and accounts for, on average, half of the total burned forest areas in Russia [1]. According to Russian forest management, a major part of the forested area in Siberia and the Far East is in the zone of “forest fire control”, meaning that fires in this zone are only observed but not extinguished [3].
Our knowledge of the pyrogenic dynamics of the forests of the Far East remains very incomplete. There are few studies estimating forest areas, burned forest areas, recovery rates, and fire emissions based on remote sensing data [4,5,6]. Field assessments of the state of the main elements of forest ecosystems in the Far Eastern region are still scarce [7]. In larch forests, both ground, surface, and underground fires are common. They occur in different seasons of the year, differently disrupt the plant community structure, and lead to various direct emissions and changes in the structure of carbon pools. Woody biomass (both plant phytomass and necromass) is a C stock for tens or even hundreds of years, thereby contributing to the C balance.
C accumulation and loss in the forests of the Far East are controlled by six main factors: annual biomass growth, rates of biomass destruction, permafrost formation/degradation, frequency, intensity and area of forest fires [8,9]. In order to obtain correct models of the dynamics of carbon stocks in this part of boreal forests, full data from complex studies are needed.
In the Far East, there are regular geographical changes in the contributions of various ecosystem elements to the total carbon budget. In northern larch forests, the role of litter and sub-canopy vegetation (shrubs) is increasing, sometimes being comparable to the canopy tree phytomass [7]. Field data on the phytomass structure of larch forests, including ground cover, are still few in the forests of Siberia [10,11,12,13,14] and almost absent in the Far East. The verification of the results of remote assessments of C stocks in terrestrial pools by field investigations is important for an accurate estimation of C stocks structure and modeling of future dynamics.
The purpose of our study is to identify patterns of changes in the structure of aboveground C stocks in the forests of the Russian Far East based on field assessments and remote data on the pyrogenic disturbance of these forests. The results of our study are based on the analysis of data from field work performed on 147 circular plots with a measurement of stand biomass, dead standing wood, ground cover, and litter. This study continues and completes our previous research in this region [15].
2. Materials and Methods
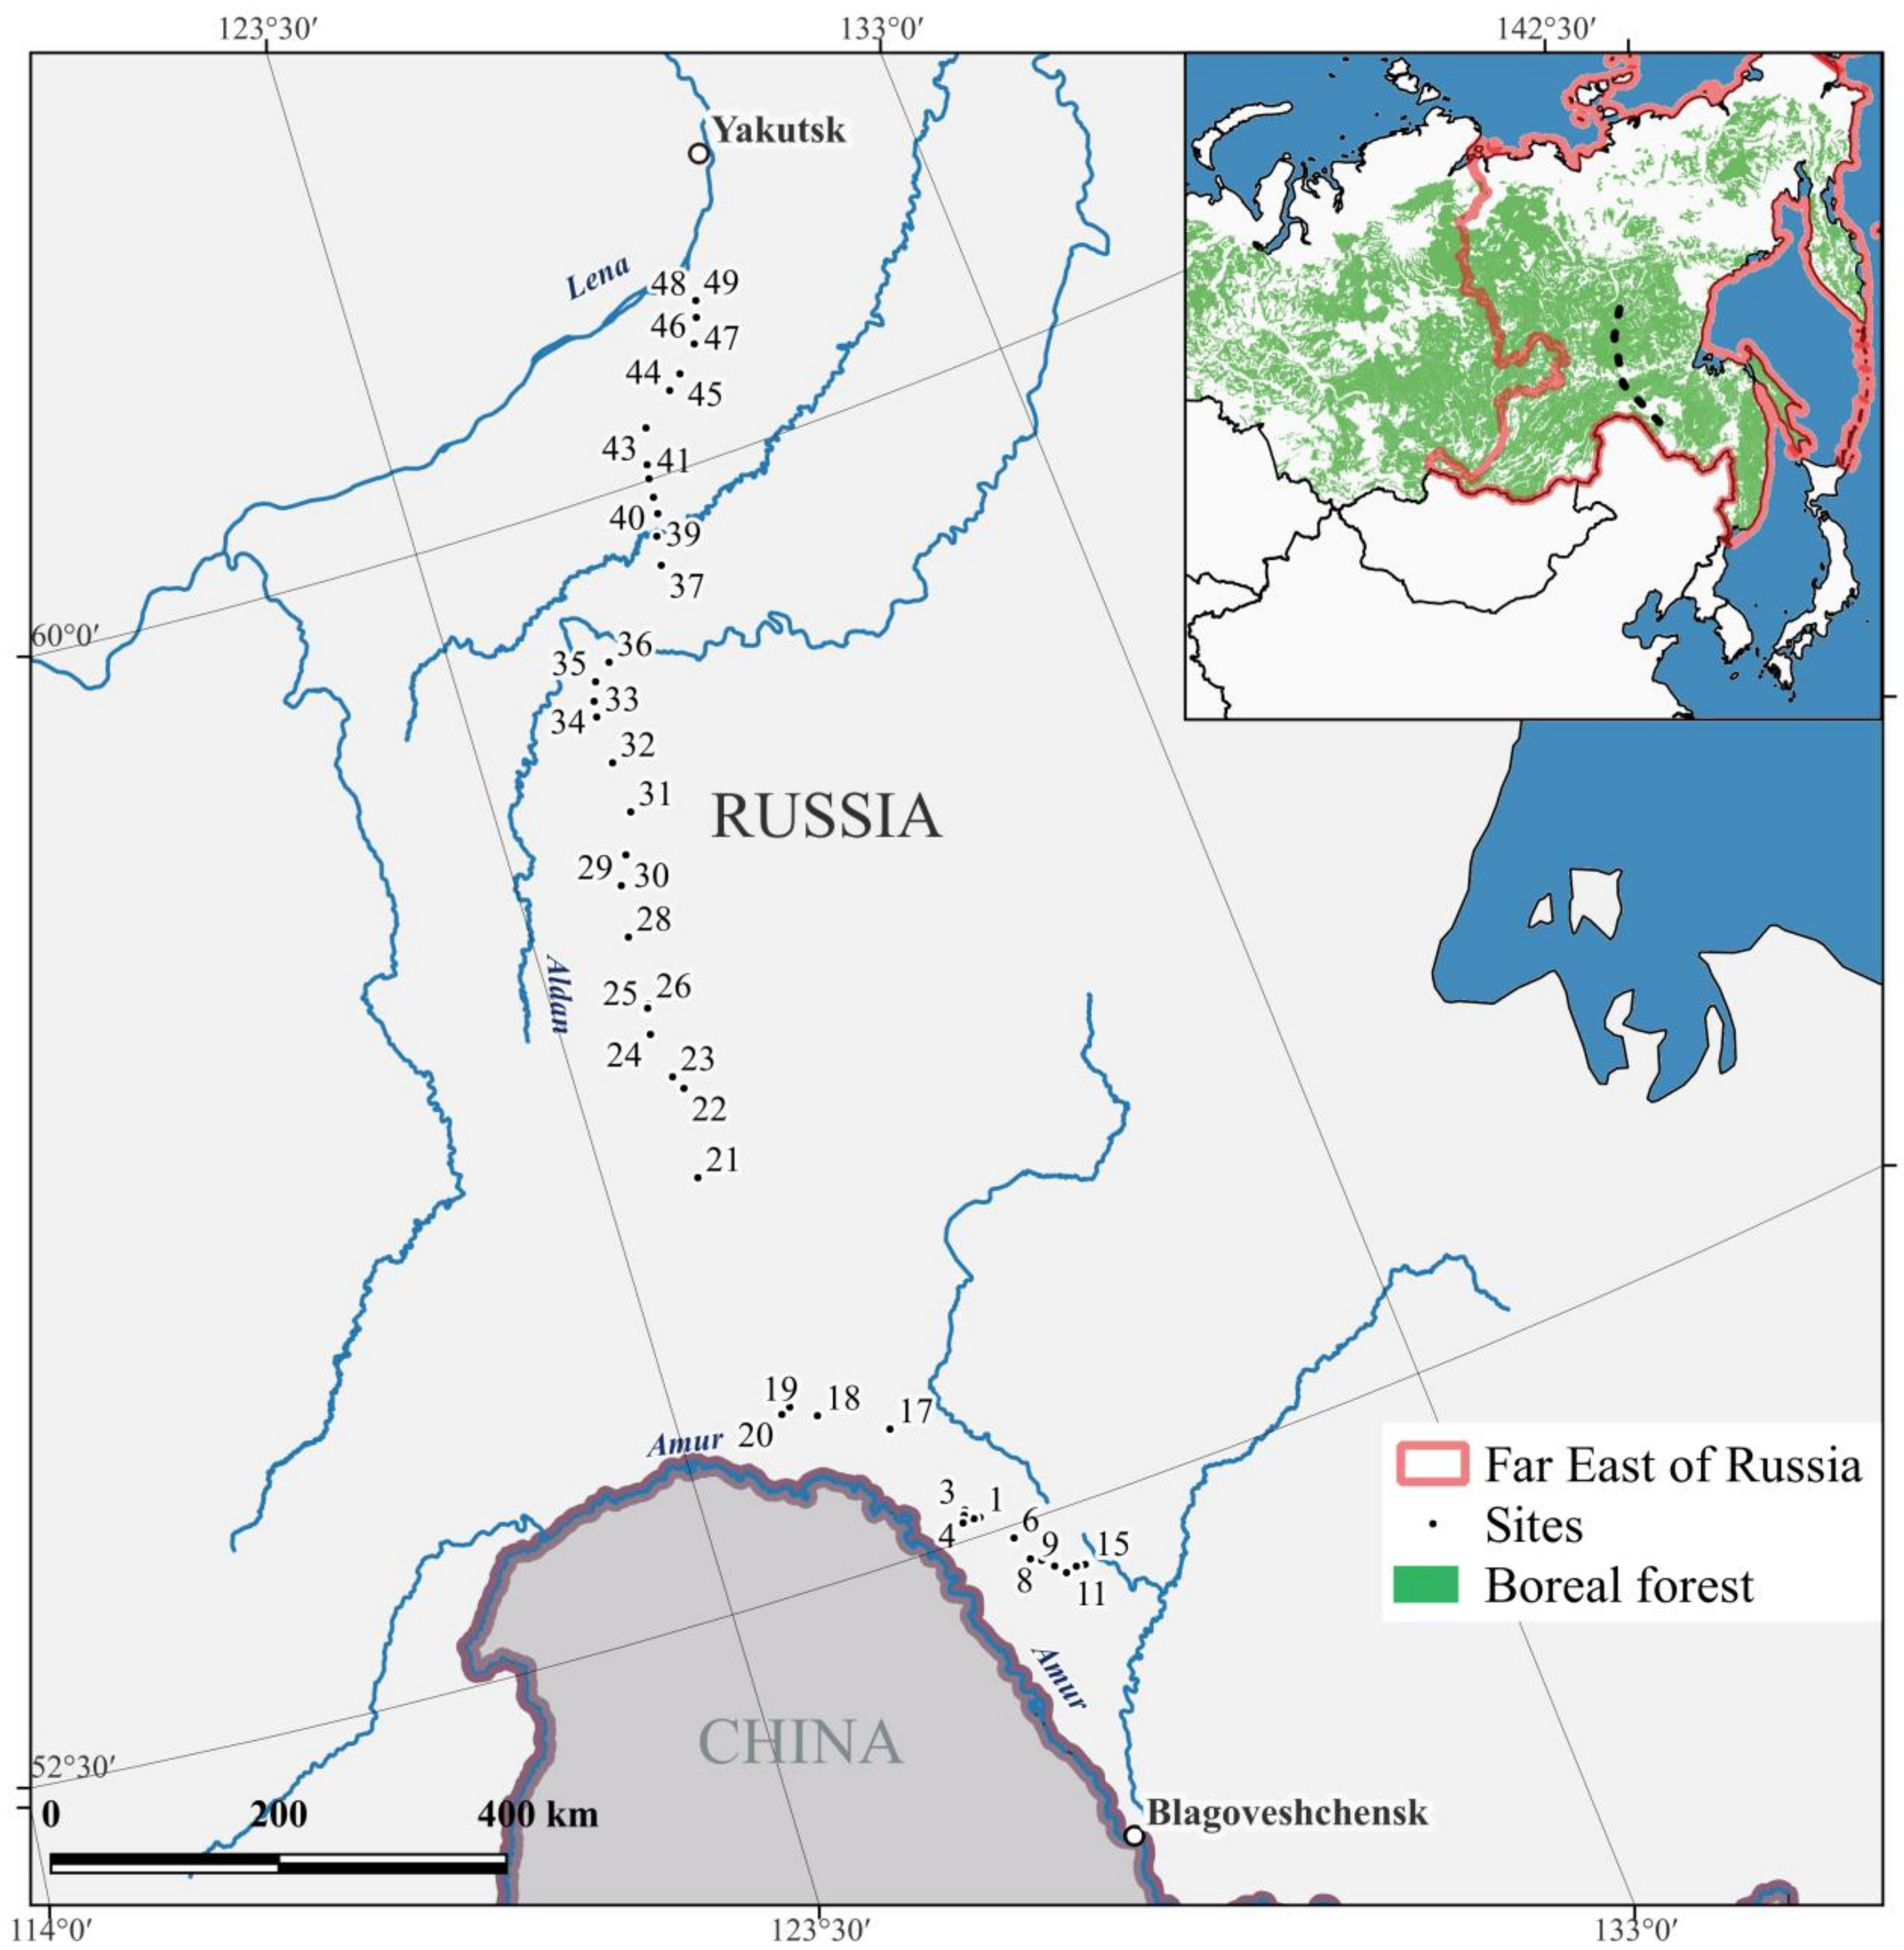
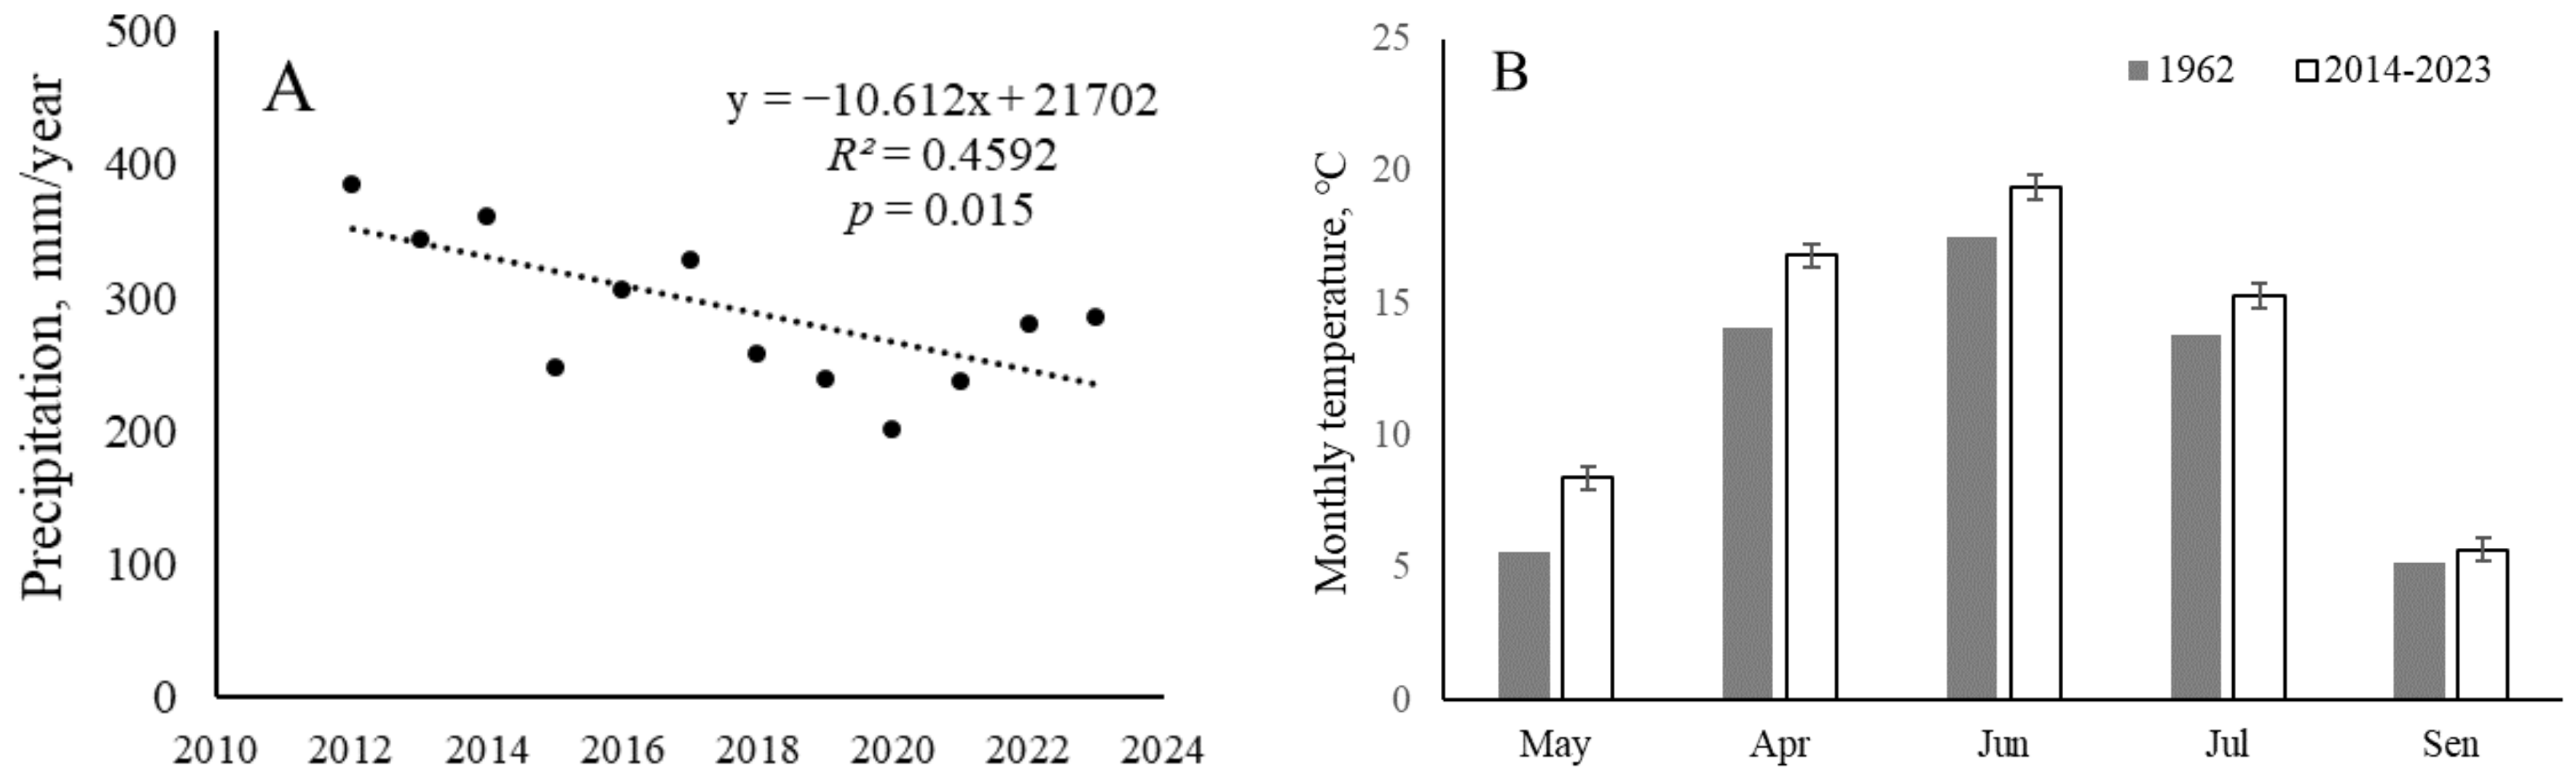
2.1. Research Area
The study was conducted in the southern part of the Russian Far East, on the Blagoveshchensk-Tynda-Yakutsk transect. The ground-based observation sites are located on a 1200 km transect along 124–125 meridians between 52–61° north latitude (Figure 1).
Figure 1.
Research region and site location.
The transect crosses the Amur-Zeya Plain in the south, the Stanovoy Ridge, as well as the Aldan Highlands and the Prilensk Plateau located in the Lena River basin. Most of the forest cover is dominated by larch (Larix cajanderi Mayr, Larix gmelinii (Rupr.) Kuzen., and Larix sibirica Ledeb.), sometimes mixed with Pinus sylvestris L. and Picea obovata Ledeb. Under the influence of fires, secondary birch forests of Betula platyphylla Sukacz sometimes completely replace larch forests and Populus tremula L. Typical plants of the ground cover of primary forests are Vaccinium vitis-idaea L., Ledum palustre L., and Vaccinium uliginosum L. Most of the study area is underlined by continuous and discontinuous permafrost; in the southern part, the permafrost distribution changes to sporadic. According to WRB 2014, the dominant type of soil is Cambisols [16].
The climate of the study region is continental with average annual temperatures ranging from −8 to 0 °C, and the annual precipitation ranges from 200 to 600 mm year−1, increasing from north to south. We analyzed weather data from the Amga weather station (N 60.9018, E 131.9794) for the period 2011–2023. We also used research data [17], which presents data from the same weather station on the average air temperature for 5 months in 1962 (Figure 2).
Figure 2.
Long-term trends in precipitation (A) and average annual air temperature (B) at the Amga weather station.
Over the past 12 years, the annual precipitation in the northern part of the study region has been decreasing on average by 10 mm/year (p < 0.05). Over a long-term interval of 1963–2018, a trend of increasing average monthly temperatures for the period May–September with an average value of 0.34 °C 10 yr−1 is visible. The average warming trends for Russia and the world for the period 1976–2020 are 0.51 and 0.29 °C 10 yr−1, respectively. We assumed that the observed trends of a simultaneous decrease in precipitation and increase in air temperature will lead to an increase in the frequency and intensity of forest fires in the future.
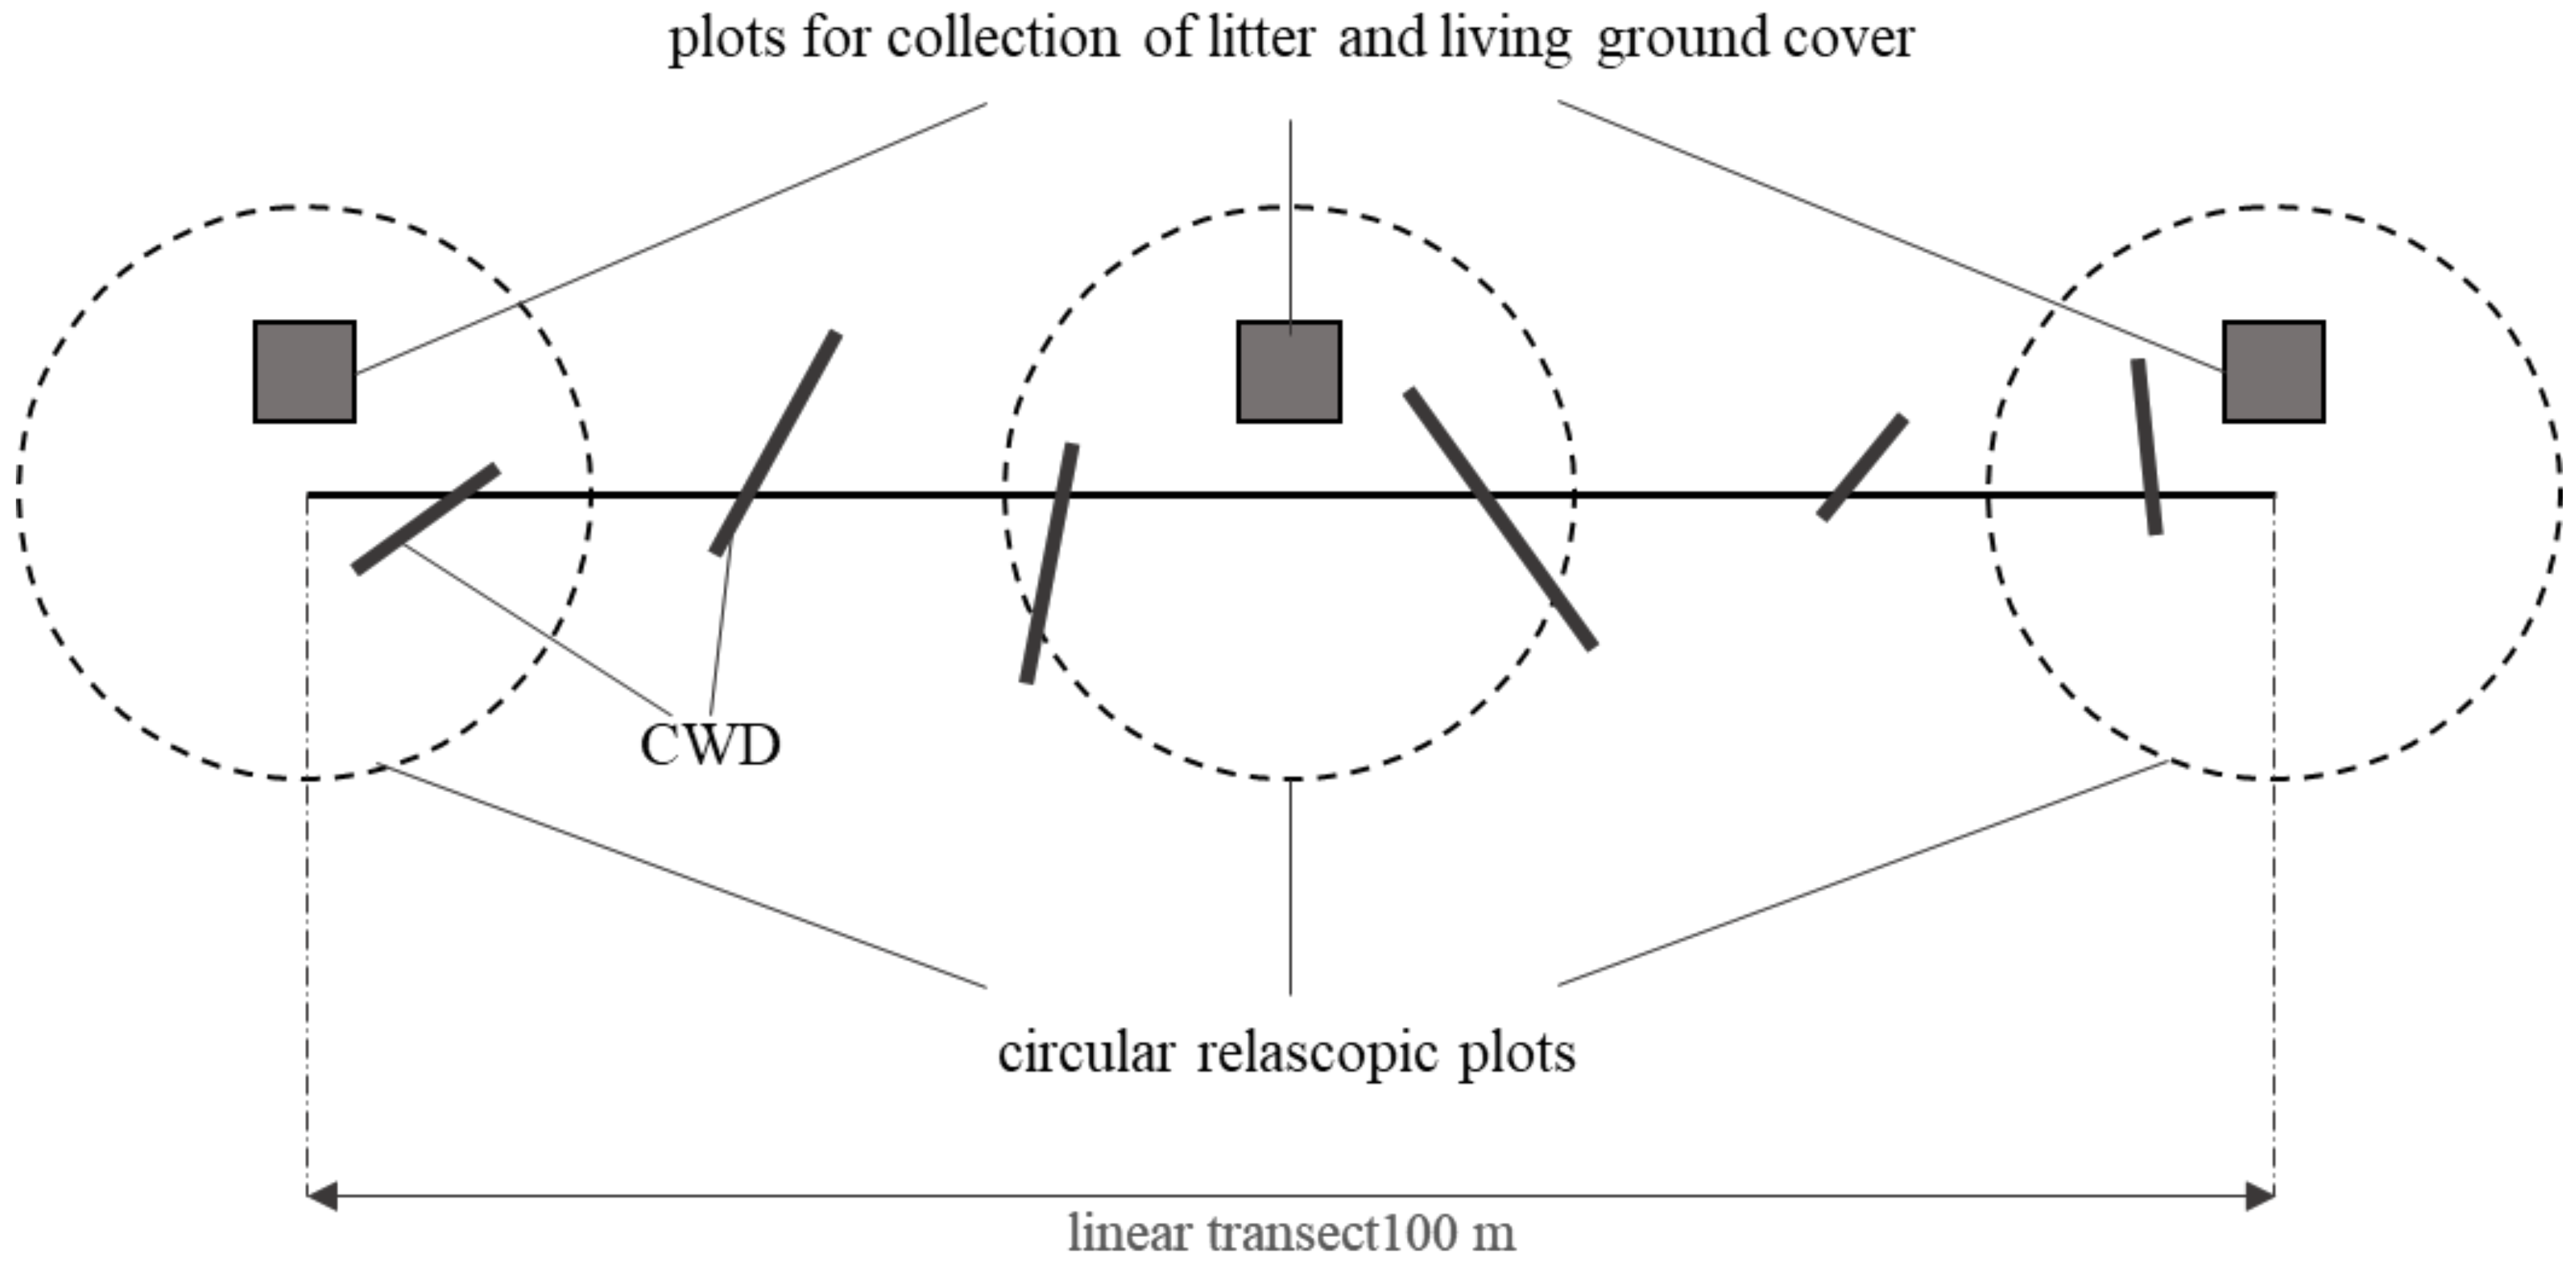
2.2. Field Work Methods
The sites for the field studies, which were exposed to wildfires at different times (from 1987 to 2022), were pre-selected using remote sensing data. The selection was made in several steps: first, burned areas that had not been rehabilitated or planted were visually identified using publicly available services (e.g., Google Earth) that provide high-resolution satellite imagery. The main selection criterion was the accessibility of the burned areas, which should be at least 70–100 m away from roads and other contrasting objects (such as quarries, dumps, etc.).
The next step was to analyse the selected sites using a time series of Landsat 5 (TM), 7 (ETM+), and 8 (OLI) satellite images, from which the date of the last fire was determined for each site. The identification of burned areas on Landsat imagery was performed by a visual analysis of composite images in SWIR-2-NIR-Green channel fusion, where burned areas can be interpreted by red colour (from bright red to dark maroon), which is the most contrasting colour to healthy vegetation, shown in bright green in this channel combination. The main criteria for site selection at this stage was the availability of cloud-free imagery over a specified date range, which is necessary for the subsequent calculation of dNBR. The spectral homogeneity of the burn within the buffer polygons (60 m radius) created around the predetermined points was also an important selection criterion.
For analysis, all sites were divided into groups by forest types, according to the classification accepted in Russia. The marker of the forest type is a dominant indicator species in the living ground cover.
2.3. Evaluation of Aboveground Pools C
2.3.1. Stand and Dead Standing Wood
Before starting measurements, a tape measure with a length of 100 m was laid on the ground. For the stands inventory, the method of circular plots (Figure 3) was used. Measurements of the wood stock were performed using the method of measuring the density of the stand with the Bitterlich device [18]. For each stem, the name of the tree species and the condition (alive/dead) were indicated. At each site, we set 3 circular plots in the middle and at the ends of the 100 m transect (Figure 3).
Figure 3.
Scheme of field work on research site.
The height of 1–3 trees of each species was measured at each circular plot by electronic clinometer Haglof EC II-D (Haglof, Torsång, Sweden). The stock was defined based on stem density, average height, and species compatible taper functions. To convert the tree stock into the total C stock of the aboveground phytomass, a linear correlation was used, obtained from the data of our previous study in this region [15]. Here, we used data on the stock of stands and the exact determination of phytomass using allometric equations for each tree on an area of 0.25 hectares. The conversion equation was as follows:
where Pa = aboveground phytomass, t C ha−1 and M = stand stock, m−3 ha−1.
Pa = 0.167 × M + 3.472
The equation was applied separately for stocks of live and dead trees.
2.3.2. Coarse Woody Debris
The coarse wood debris (CWD) stock was measured using the line transect method [19,20,21]. We measured 100 m length transects along the plot. For each CWD fragment with a diameter larger than 4 cm crossing a transect, we measured species, maximum and minimum diameter (measured cross-wise), length, and the stage of decomposition. CWD classes were distinguished visually according to the method developed for coniferous tree species: 1—thin branches exist, no decomposition signs; 2—the bark exists, thin branches are lost, the trunk may by covered by mosses and lichens; 3—the bark exists as fragments, only first- and second-order branches remain on the trunk; 4—the bark is almost lost, first-order branches shorter than trunk diameter; and 5—the initial shape and structural integrity are lost [22]. Calculations were done using the software Debris 3.0, publicly available from the Center for Forest Ecology and Productivity, Russian Academy of Sciences (http://cepl.rssi.ru/r-and-d-8/ (accessed on 1 March 2024)). Calculations were performed according to the following equation:
where V is the volume of CWD, m3; Di is the diameter of i CWD (i = 1…n); n is the total number of CWD on the transect; and L is the transect length, m.
2.3.3. Forest Litter
The forest litter was collected using a 20 × 20 cm frame in three replications on each site (Figure 3). After removing the litter layer, the thickness of the litter was measured on 4 sides of the frame. Litter samples were placed in an airtight zip bag, and dried at 60 degrees to a constant weight. Then, homogenized samples were subjected to an analysis of C content on element analyser Shimadzu TOC-5000 SSM (Shimadzu, Kyoto, Japan) at the Amur Centre of Mineral-Geochemistry Investigation in the Institute of Geology and Nature Management. The C content in different layers of the litter varied from 20 to 42%. The average C content ranged from 29 to 32%. In this study, we used a coefficient of 0.315 to convert the stock of absolutely dry litter into a C stock. Then, the stock values were recalculated by an area of 1 ha.
2.3.4. Ground Cover Vegetation
To determine the C stock of the ground cover, biomass of all herbaceous plants, shrubs, and the moss–lichen layer were cut at a frame of 20 × 20 cm before litter was collected. The projective coverage of the ground cover was determined on each circular plot. After that, vegetation samples were dried in the laboratory to a constant weight at a temperature of 40 °C. A coefficient of 0.44 was used to convert the mass of the sample to the C stock [23].
2.4. Assessment of the Burn Severity from Satellite Images
We used the Landsat archive covering the period from 1986 to 2022. The Normalized Burn Ratio, NBR, was chosen as a characteristic of fire disturbance [24]. The difference in indices obtained after and before the fire (dNBR) provides an estimate of absolute changes that can estimate changes in specific natural quantities, such as phytomass reserves.
The work with remote sensing data was performed according to the following algorithm. At the first stage, images were selected that meet a number of conditions related to the period of shooting pre-fire and post-fire images. To assess the NBR of the pre-fire period, images taken no earlier than 1–3 years before the fire were selected, and as post-fire images taken the following year after the fire. Due to the high sensitivity of the index to phenological changes, the dates (day/month) of the pre-fire and post-fire images should be as close to each other as possible; therefore, in each case, images with a minimum difference in capture dates (≤14 days) were selected. At the next stage, the uploaded Landsat images were adjusted to consider the influence of the atmosphere (using the DOS correction algorithm), and the pixel values of the images from the DN (digital number) were converted to reflectivity values. After pre-processing, NBR values were calculated for each site by thefollowing equation:
where NIR is a reflection in the near infrared region of the spectrum, SWIR2 is a reflection in the mid–wave infrared region of the spectrum. dNBR was calculated accordingly by subtracting the pre-fire and post-fire index images of NBR.
All images were uploaded from the portal of the US Geological Survey (https://earthexplorer.usgs.gov/ (accessed on 20 February 2024)) (Table A2), and pre-processing and working with snapshots were performed in QGIS 3.28.0 software.
Subsequently, the sites were differentiated into affected and unaffected by fires; for this purpose, dNBR thresholds were determined as follows: pixels with values below 0.07–0.1 characterize unaffected or slightly (with almost complete survival of the stand) affected areas and dNBR values above 0.1 are considered as significantly affected, where a certain percentage of dead trees is recorded. These correspond to investigations [24,25] conducted in boreal forests of North America (USA) and in larch forests of Northern Mongolia, respectively.
2.5. Data Processing Methods
Data processing and analysis were performed in MS Excel 2016 and R-Studio version 4.2 software. Regression analysis was used to describe the relations between variables. Principal component analysis (PCA) was employed to visualize the relations between the main factors and variables.
3. Results
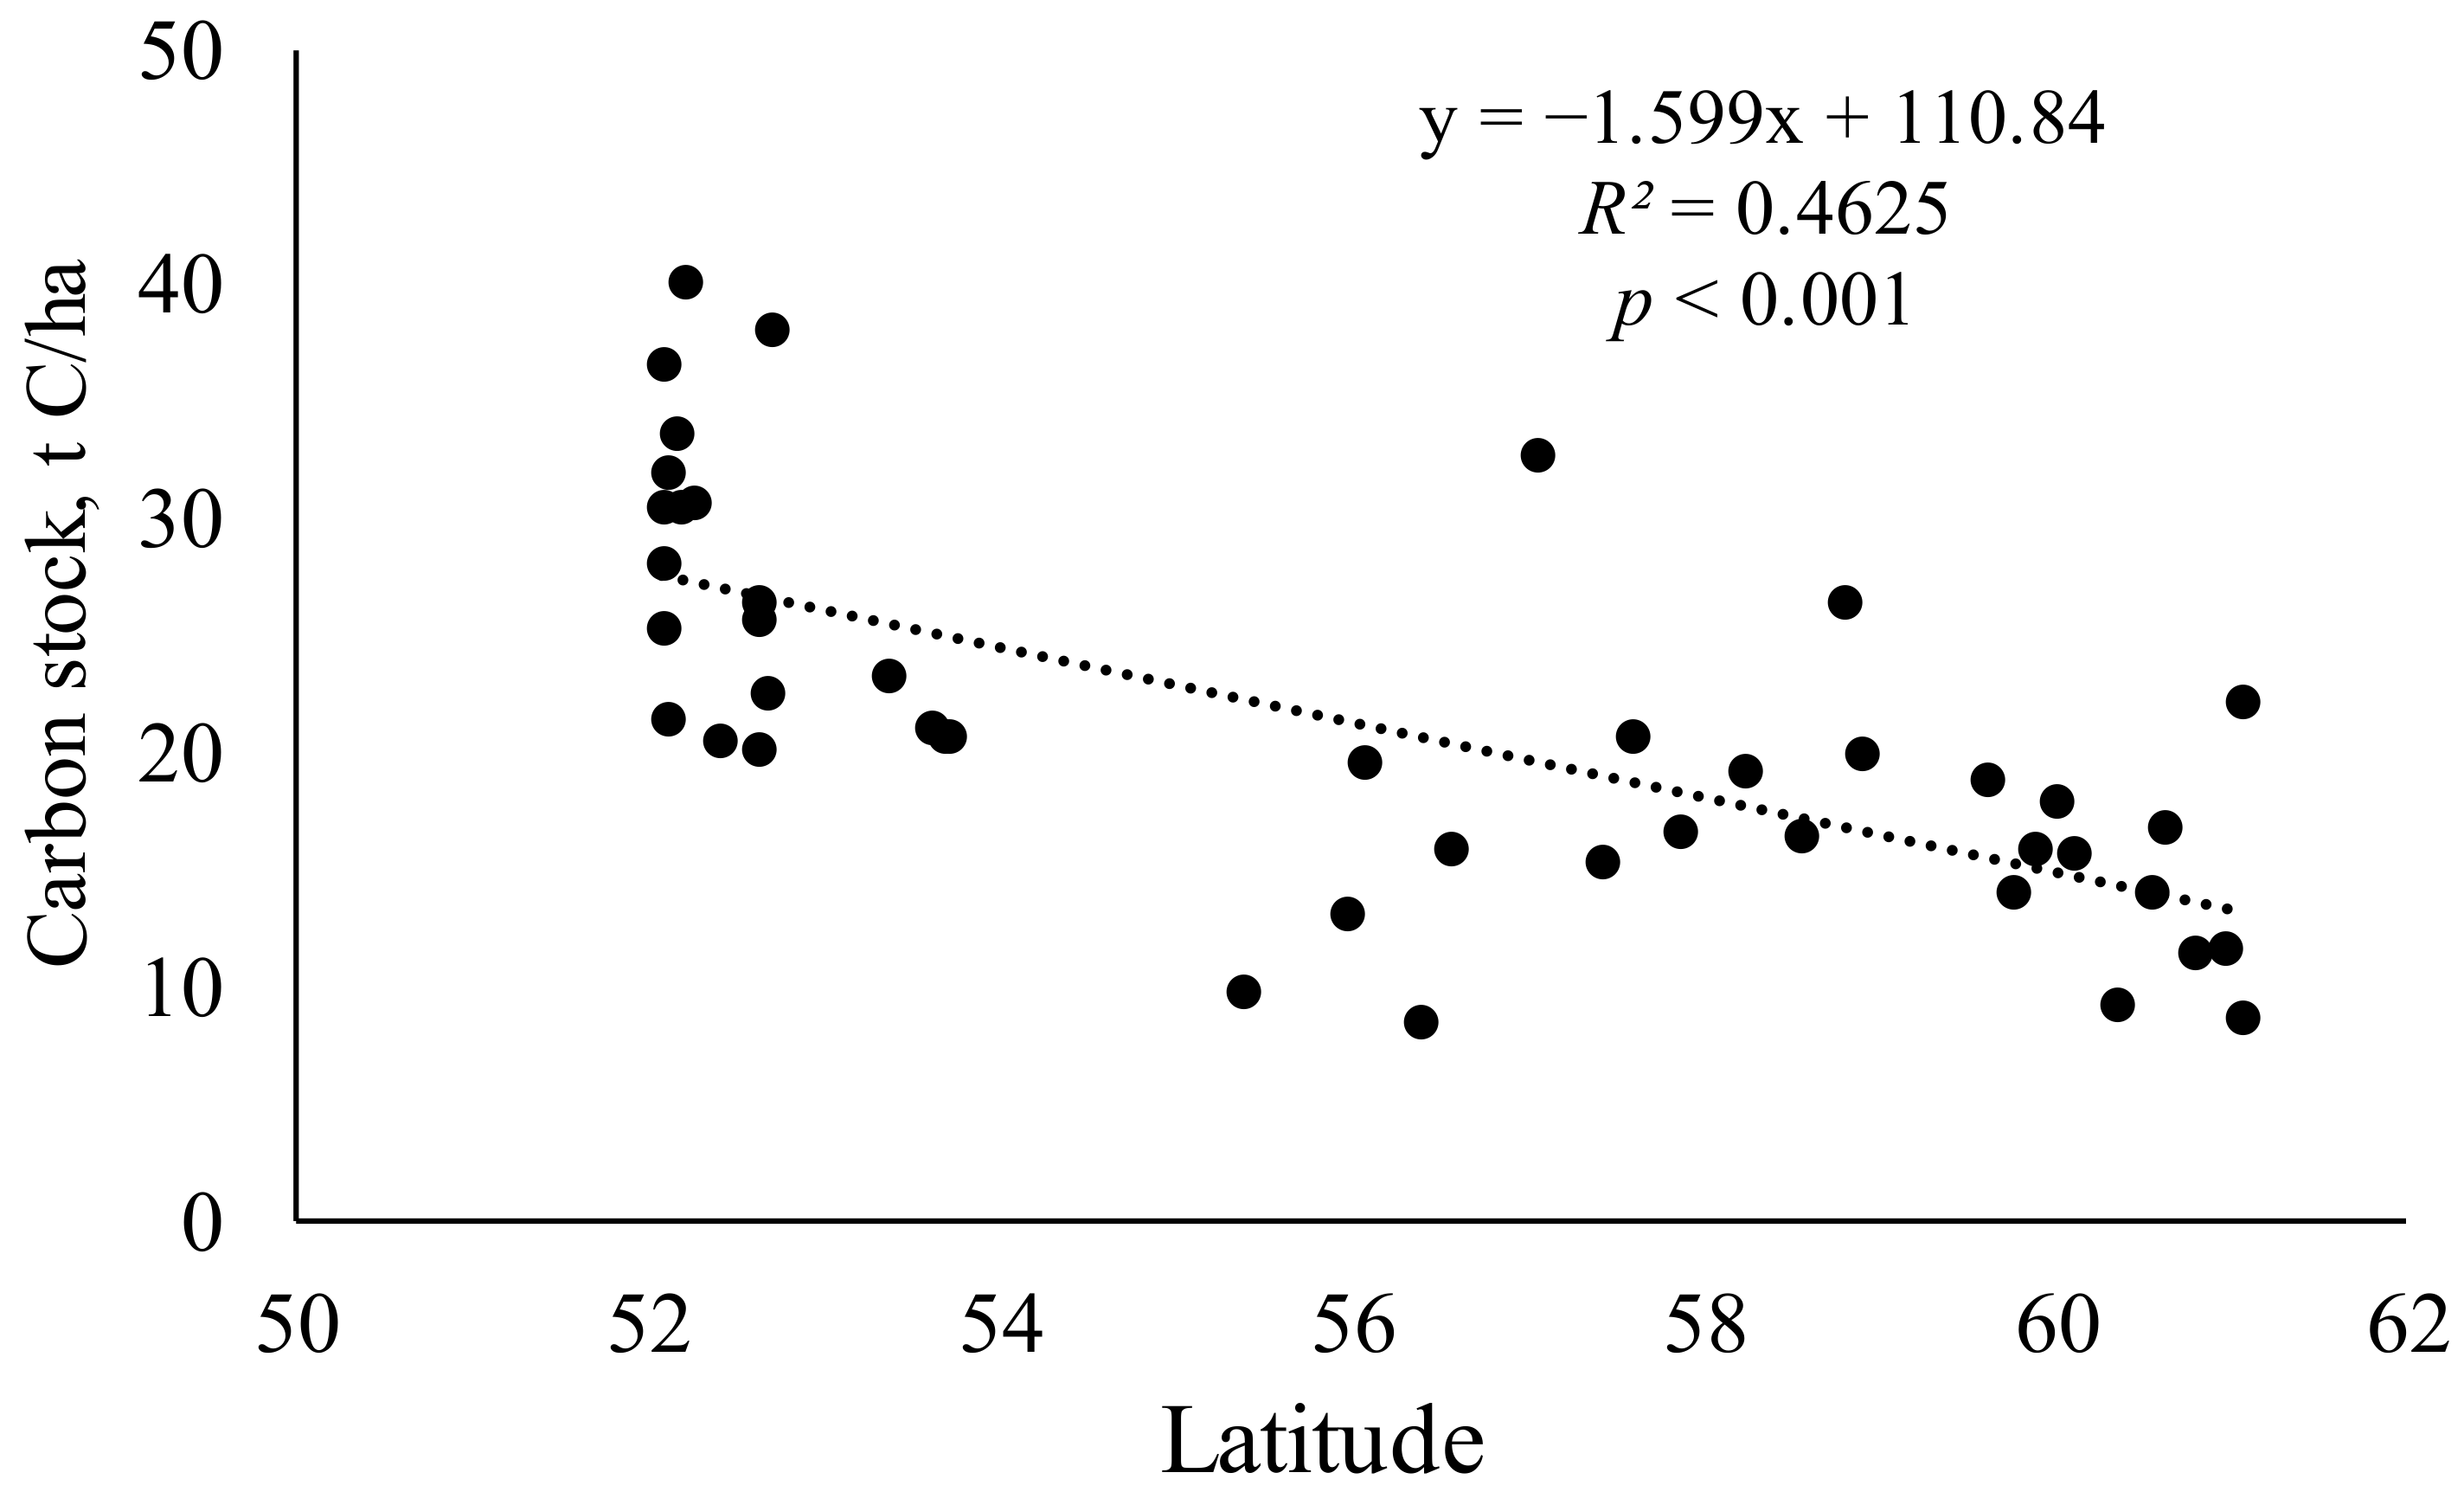
3.1. Biomass of Standing Trees
Depending on fire exposure and the stage of the recovery process, the C stocks of living biomass ranged from 0 to 33.5 t ha−1, and dead standing wood ranged from 0 to 12.5 t ha−1. Figure 4 shows total stand C stocks for living and dead standing wood.
Figure 4.
Total tree C stocks by forest type (see Table 1 for the forest type abbreviations).
The C stocks of the stand at the research sites are almost independent of the forest type. Forests with a dominance of Carex sp. in the ground cover are distributed mainly in the southern part; these stands were most productive among studied forests.
C stocks data allow us to establish a general trend of change in the C stock of aboveground phytomass (live + dry trees) in the direction from south to north (Figure 5).
Figure 5.
Change in total aboveground C stock by latitude.
Despite fire disturbances (which probably account for most of the dispersion of stand C stocks), a weak significant linear trend has been found, showing a decrease in forest productivity in the meridional direction at a rate of 1.6 t ha−1 per each degree of latitude.
3.2. Litter and CWD
Mean litter thickness was 7.3 cm with a maximum up to 26 cm, and mean litter stock ranged from 0.6 to 10.6 t ha−1 with a mean of 3.9 t ha−1 (Table 1). The fractional composition of the litter is dominated by larch litter. C stocks in CWD ranged from 0 to 8.7 t ha−1 with an average value of 1.99 t ha−1.
Table 1.
Locations, elevation, and stand and coverage characteristics of plants in the sample sites used. B—Betula platyphylla Sukaczev, L—Larix gmelinii (Rupr.) Kuzen,Larix cajanderi Mayr, Ps—Pinus sylvestris, L., Pt—Populus tremula L., Po—Picea obovata Ledeb. Car—Carex sp., Cal—Calamagrostis sp., Lp—Ledum palustre L., Pyr—Pyrola rotundifolia L., Pte—Pteridium aquilinum (L.) Kuhn, Shp—Sphagnum palustre L., Vu—Vaccinium uliginosum L., Vv—Vaccinium vitis-idaea L.
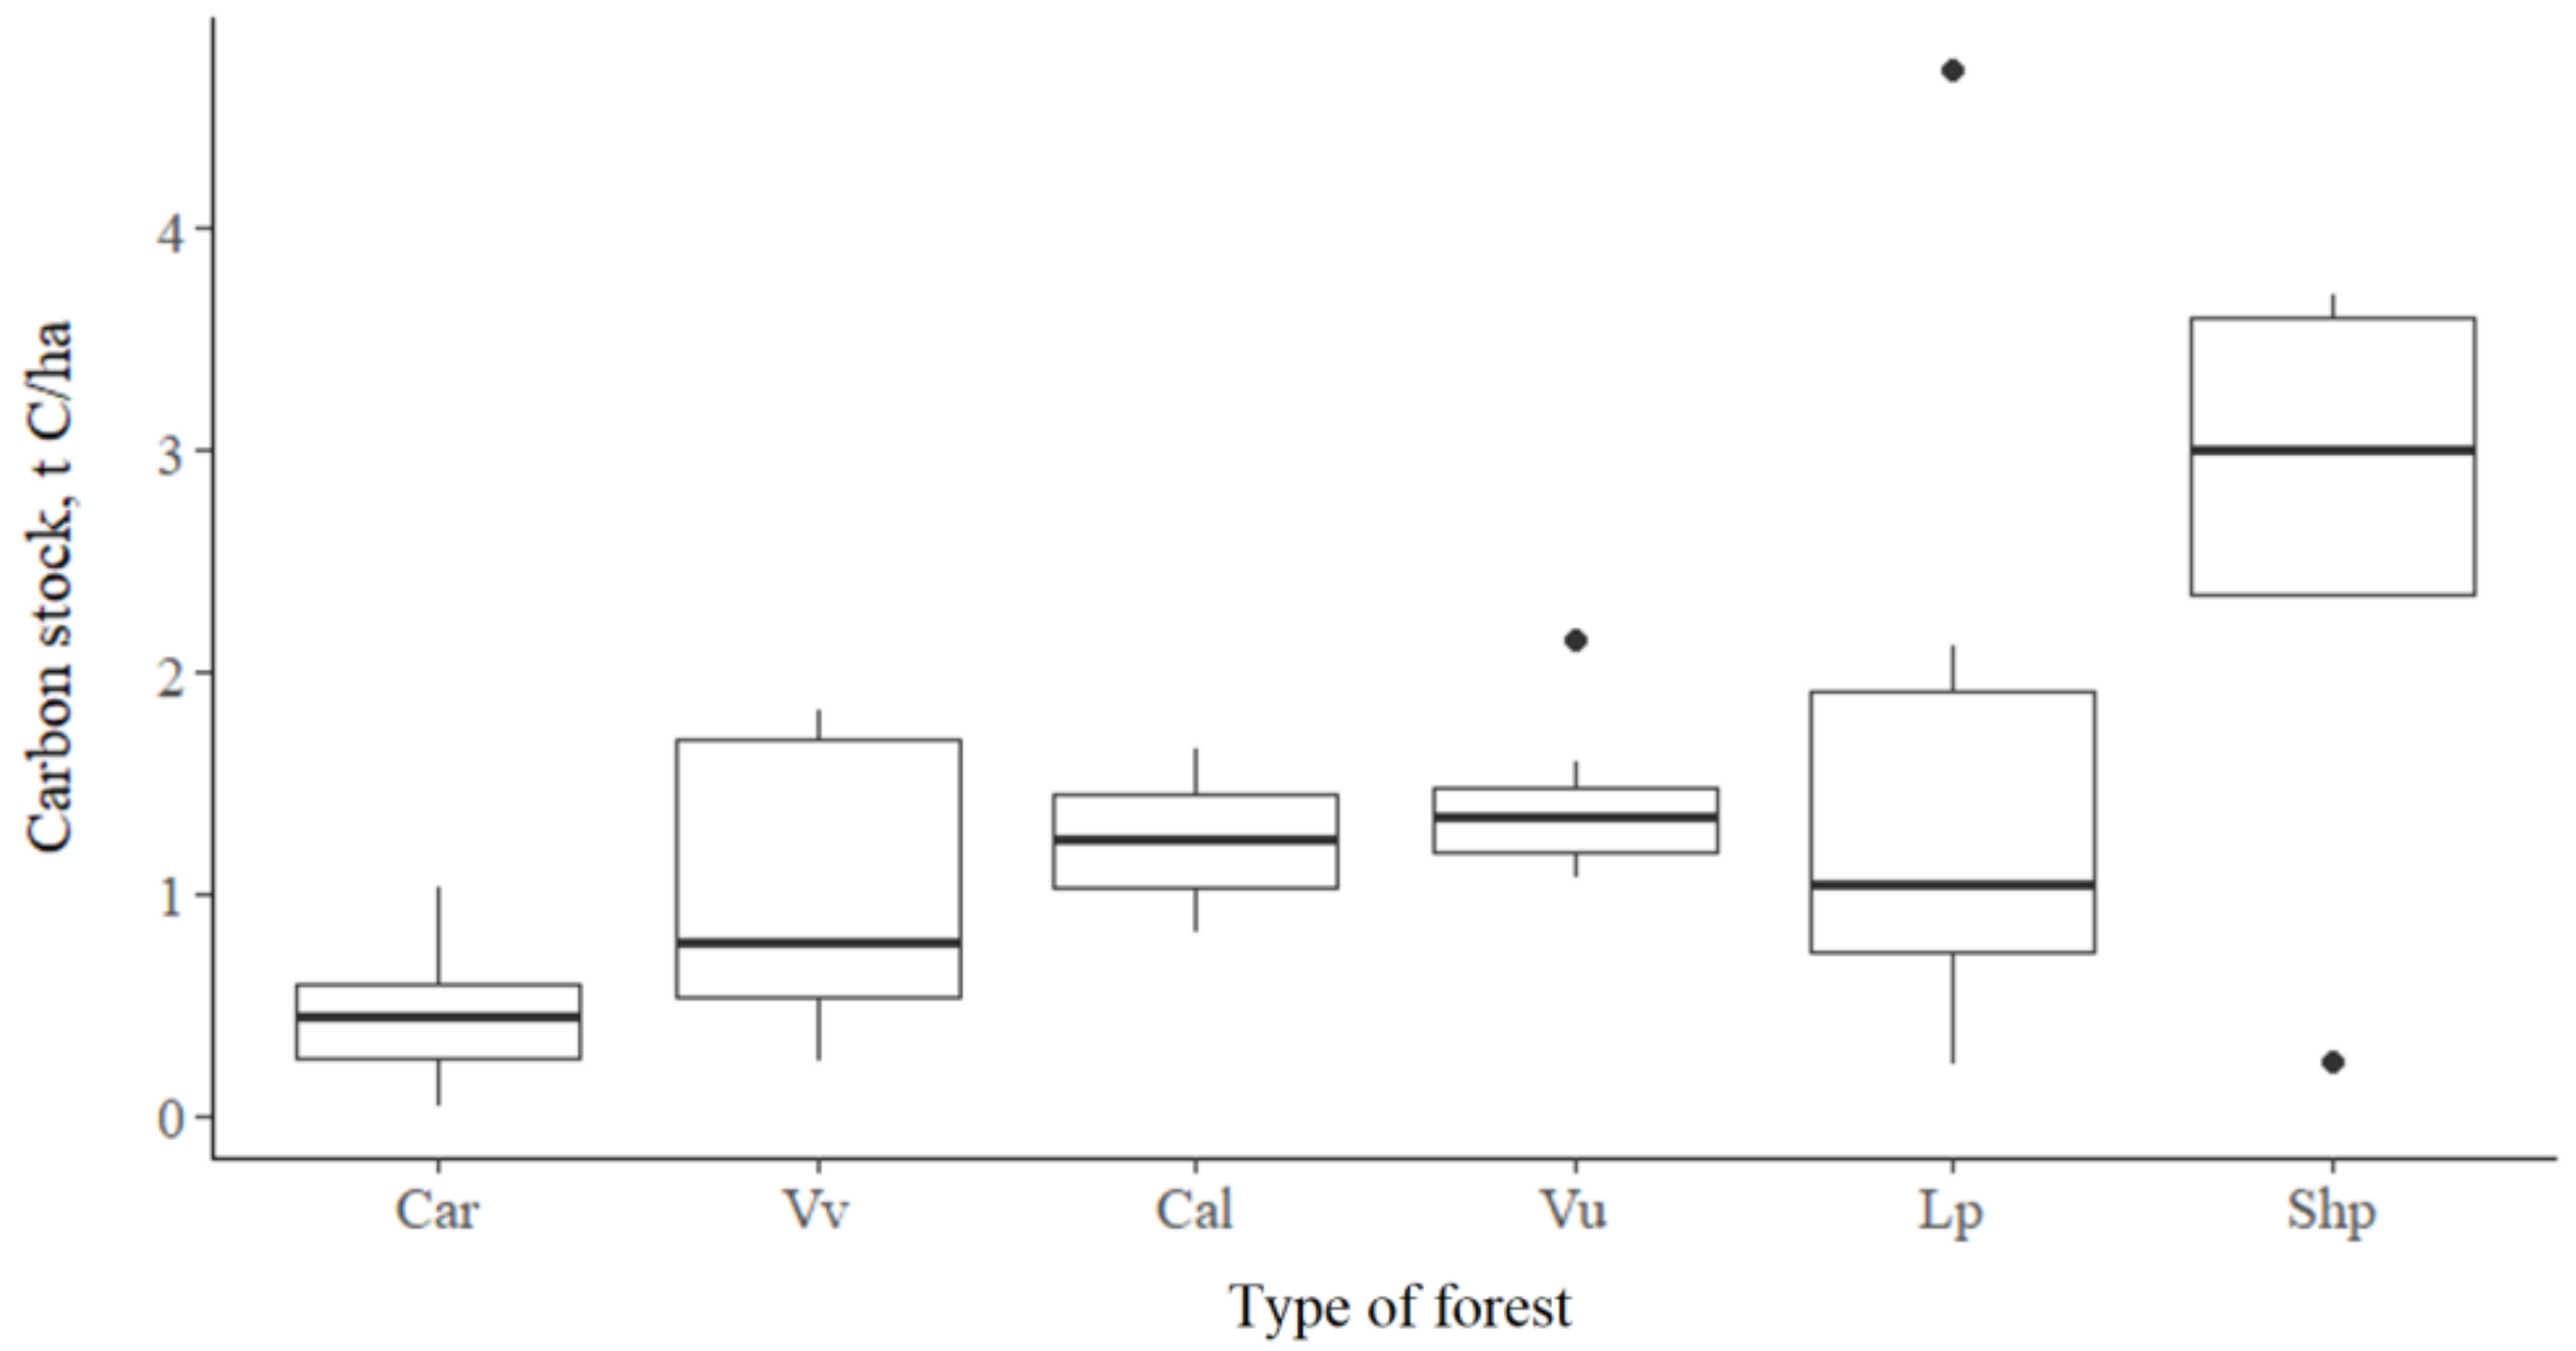
3.3. Plants of Ground Cover
Ground cover plays an important role in the functioning of larch forests, since C stocks in this pool reach 4.7 t ha−1; the average value was 1.2 t ha−1. The biomass of the ground cover depends on the dominant species and its coverage (Figure 6).
Figure 6.
C of ground cover biomass in different types of forests.Larch forests with sedge ground cover have the smallest stocks among studied forest types. Maximum stocks (2.5–3.5 t ha−1) were recorded in sphagnum larch forests occupying low moist areas. Forests, where the ground cover is represented by shrubs, are characterized by similar stocks of 1.0–2.0 t ha−1.
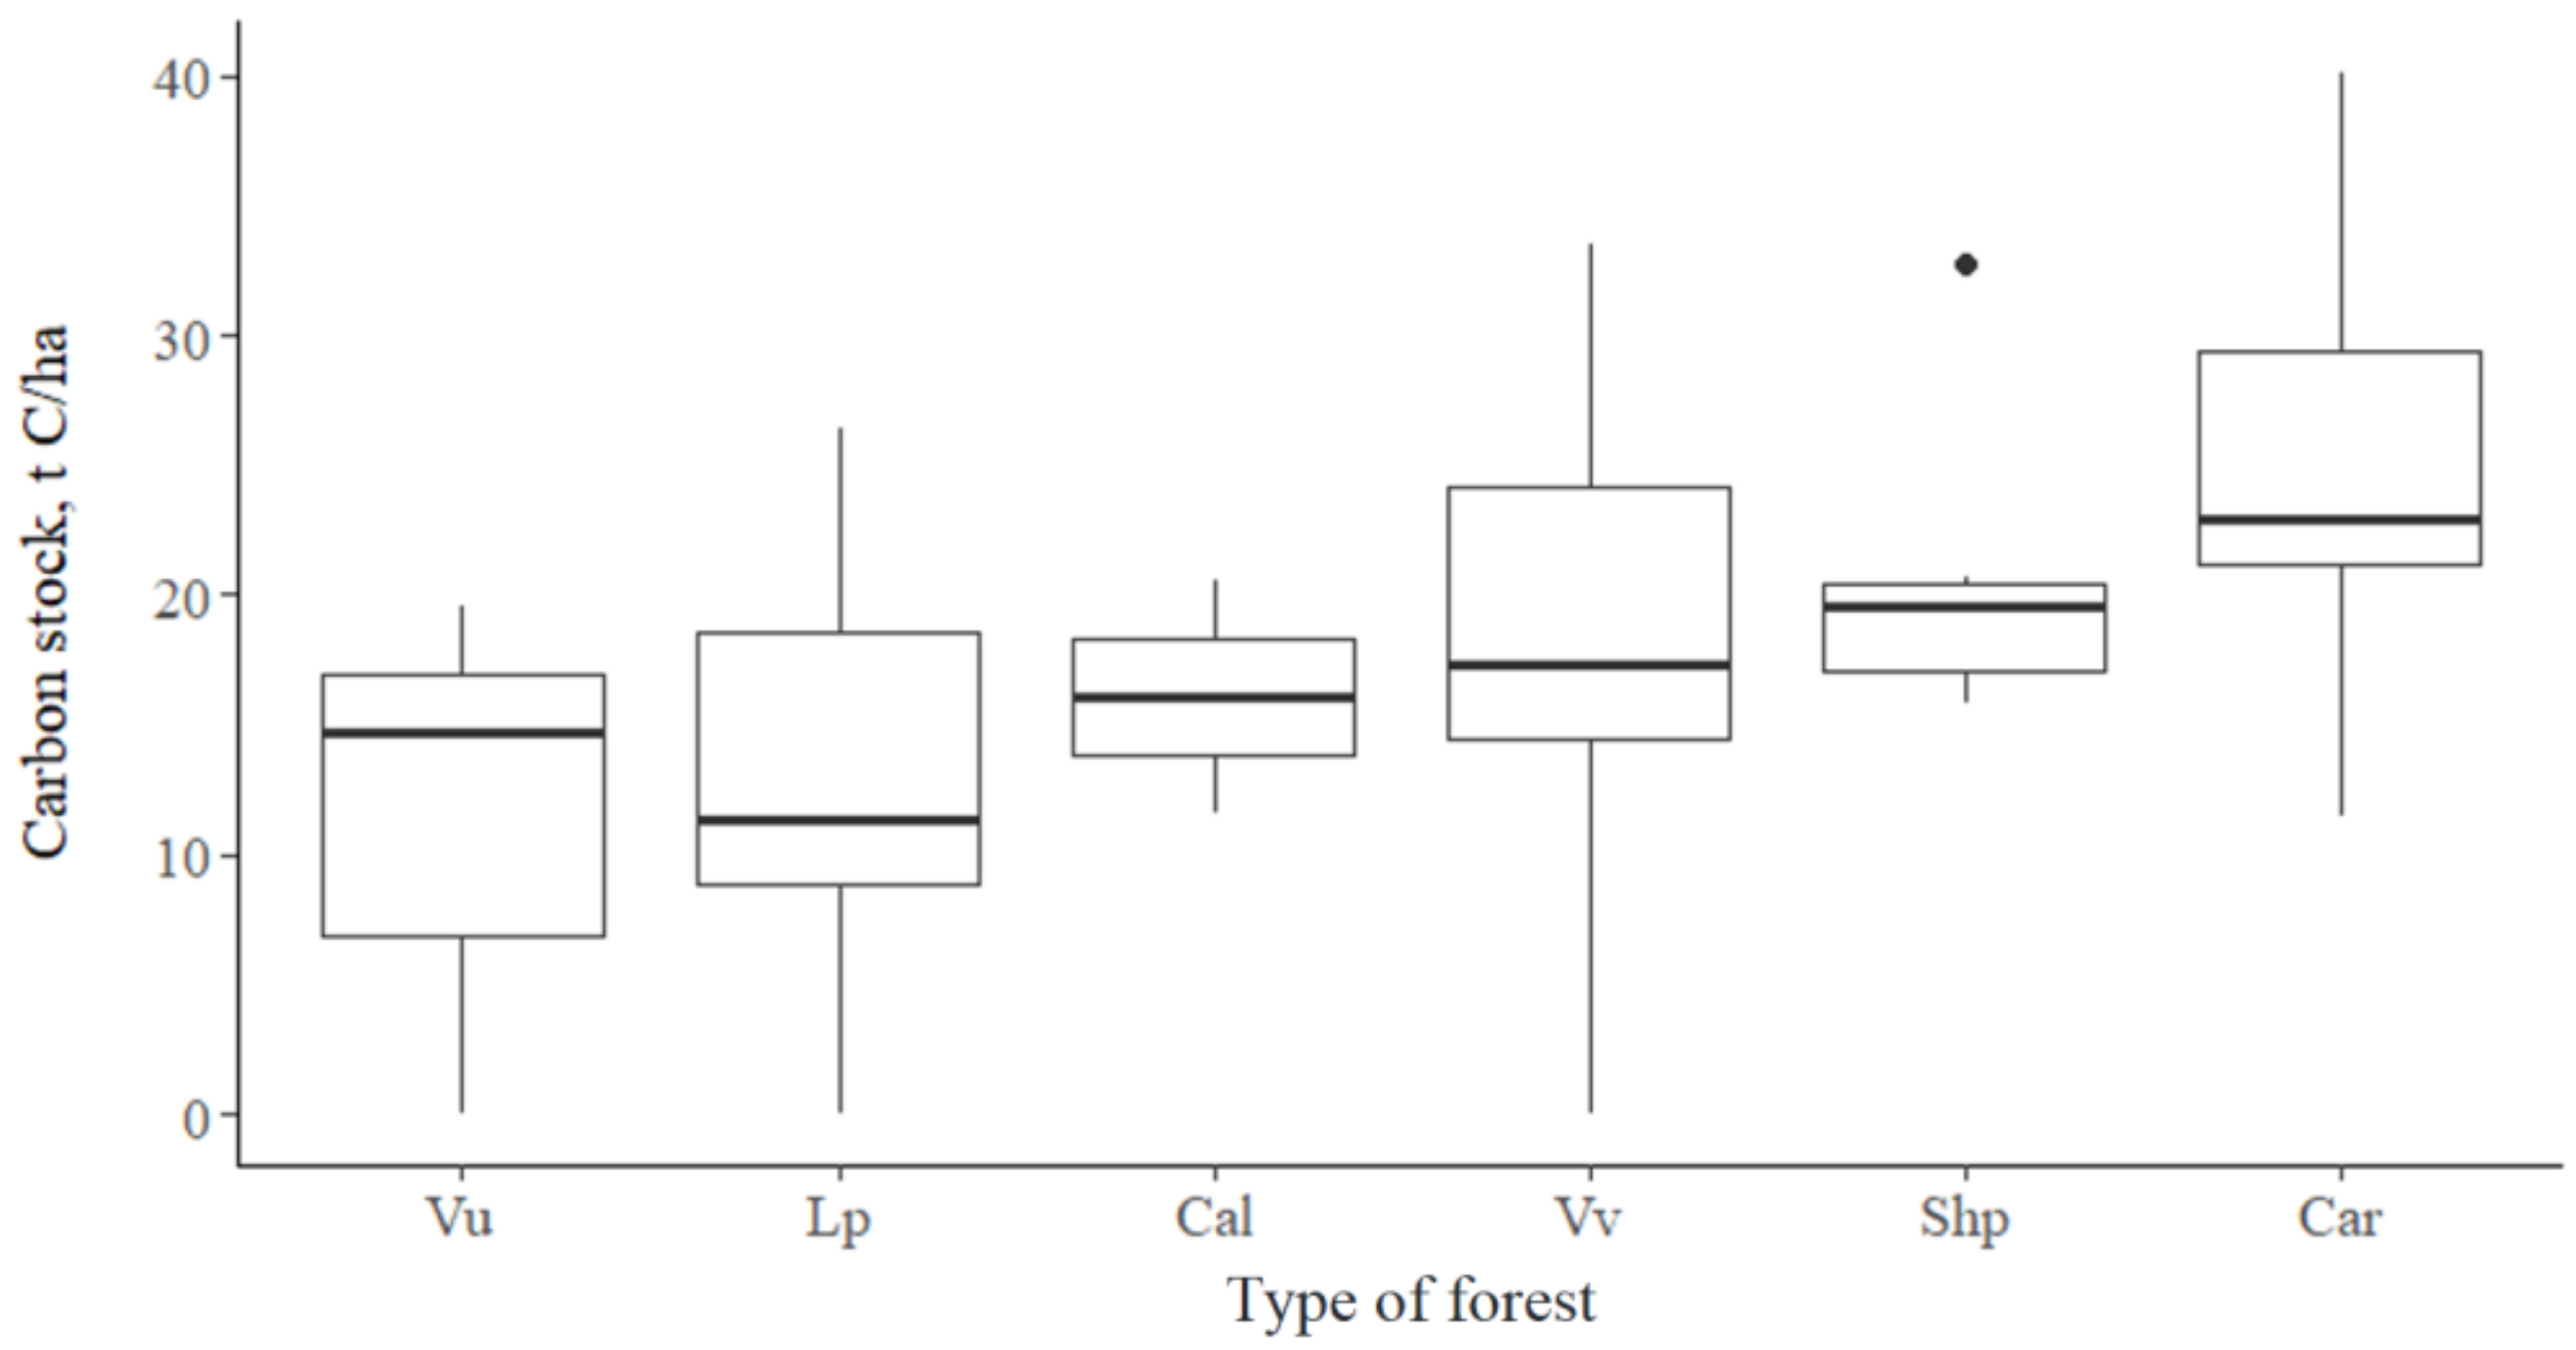
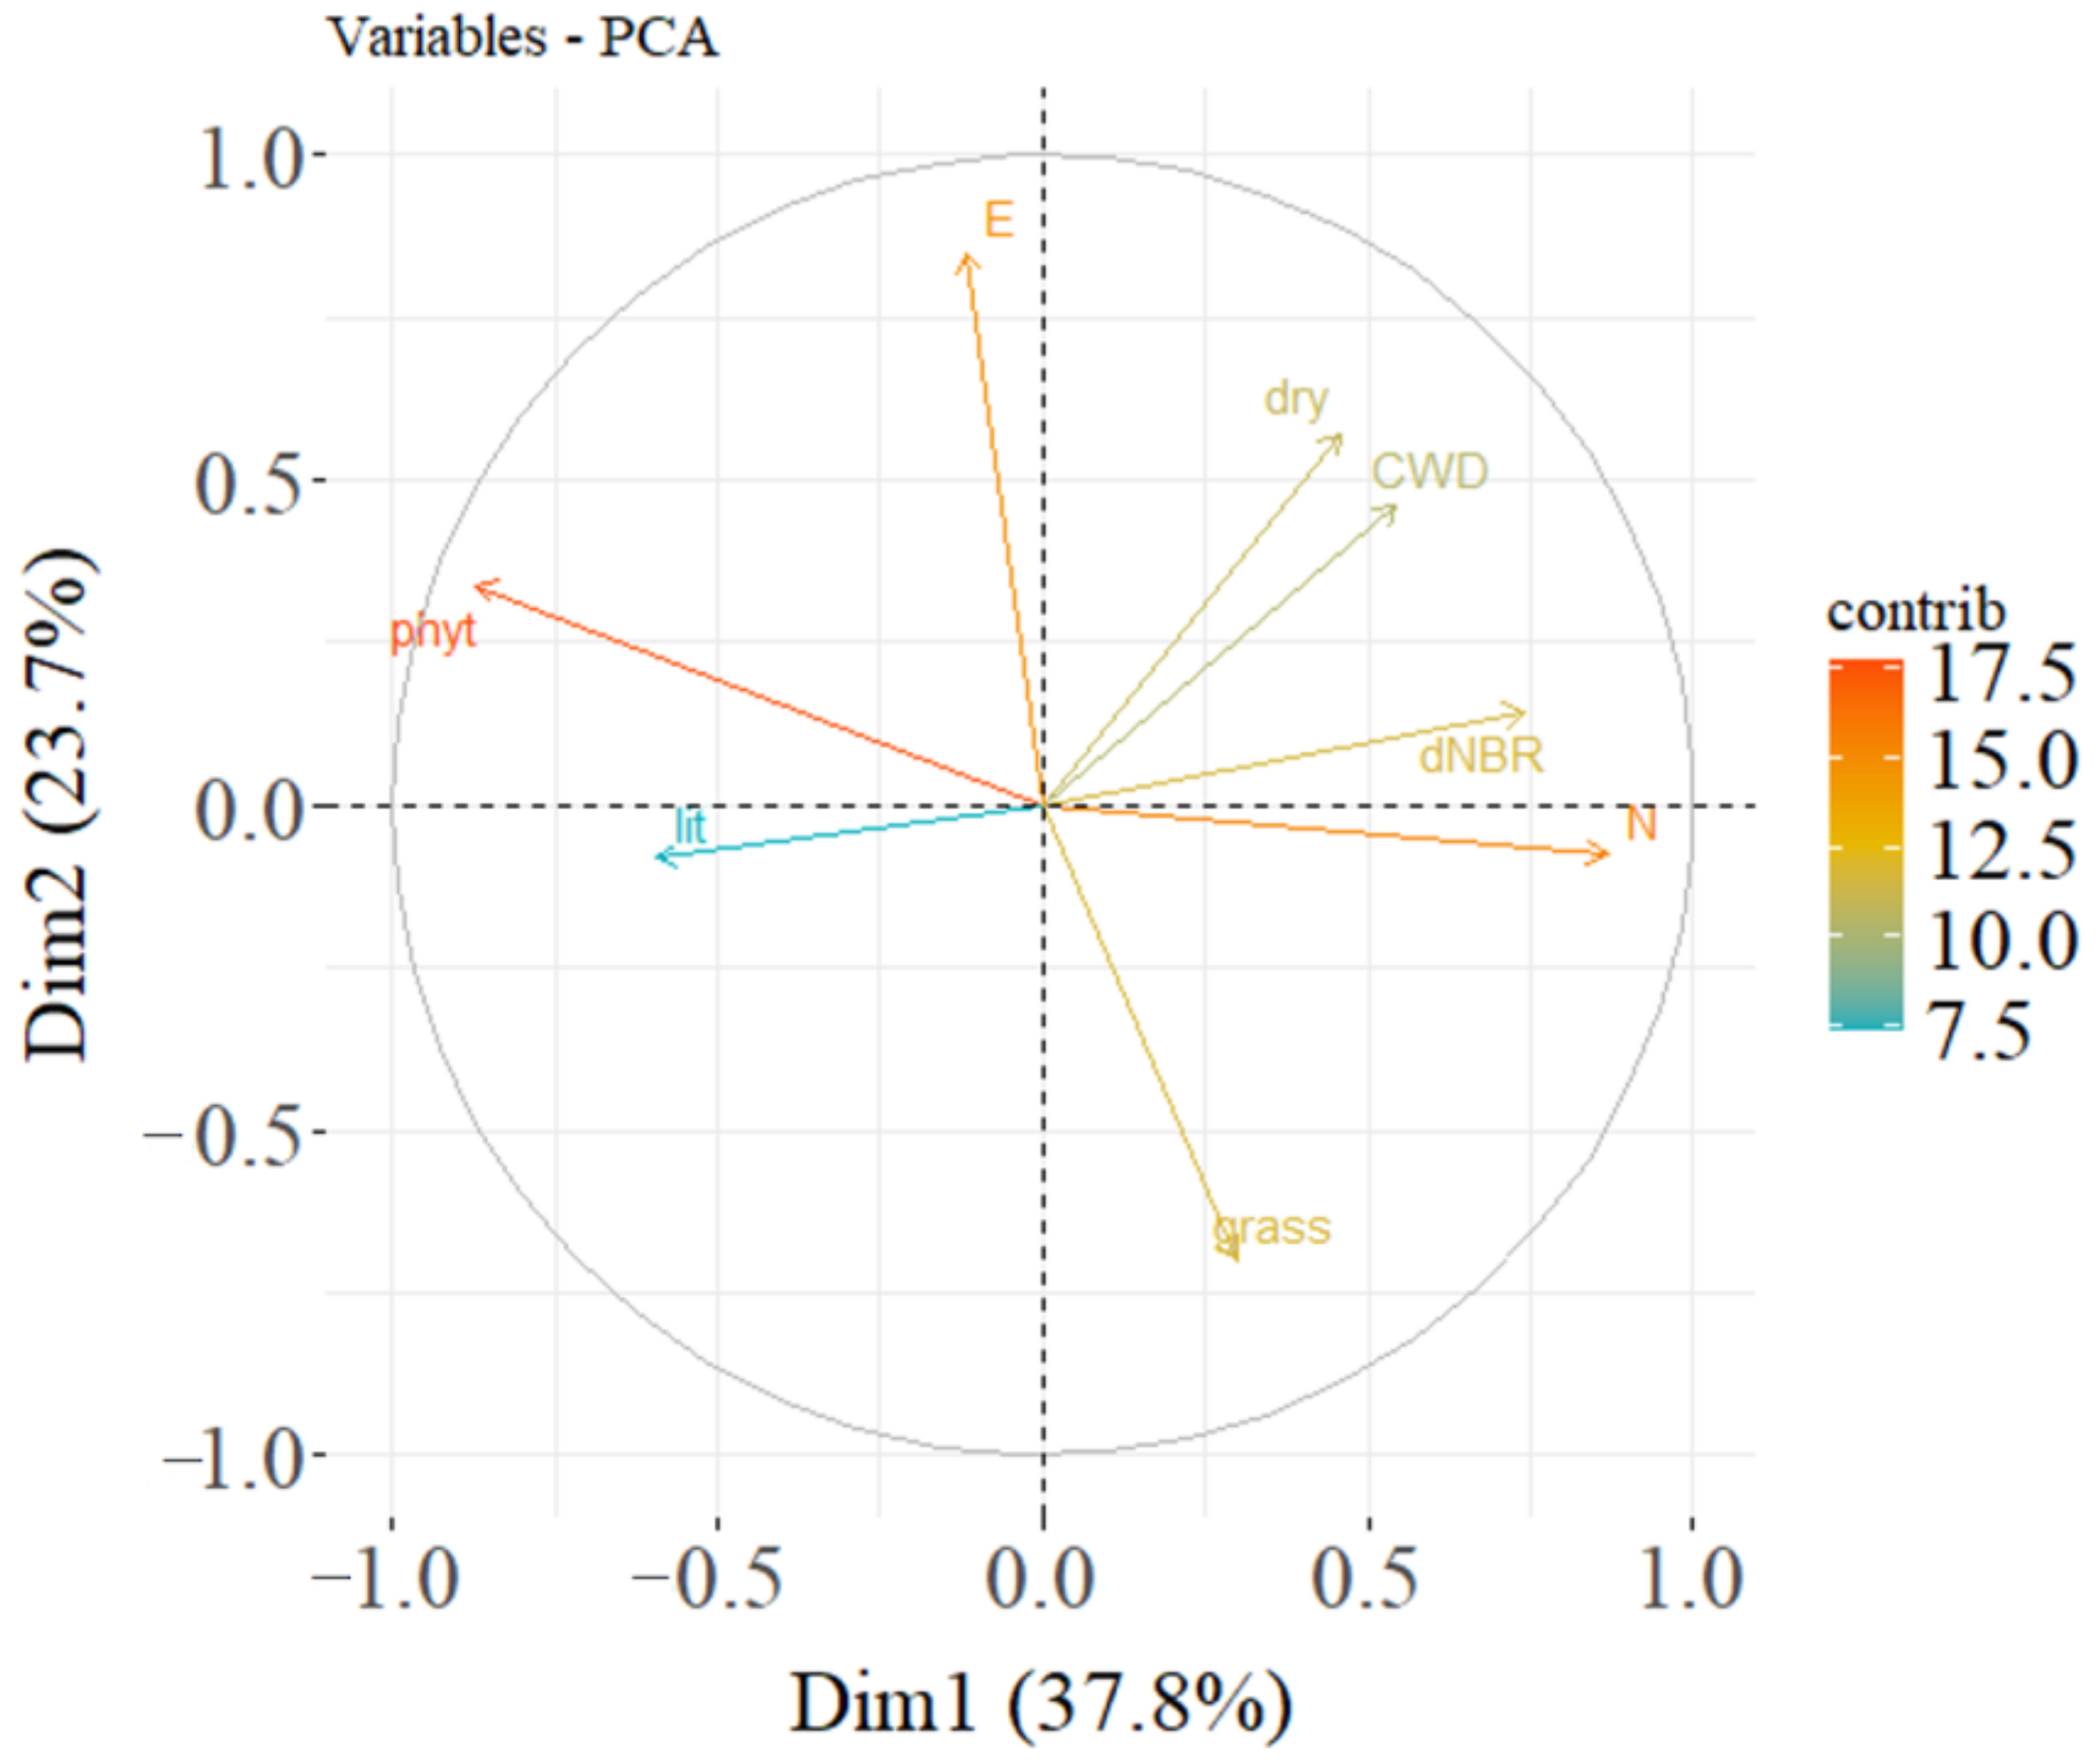
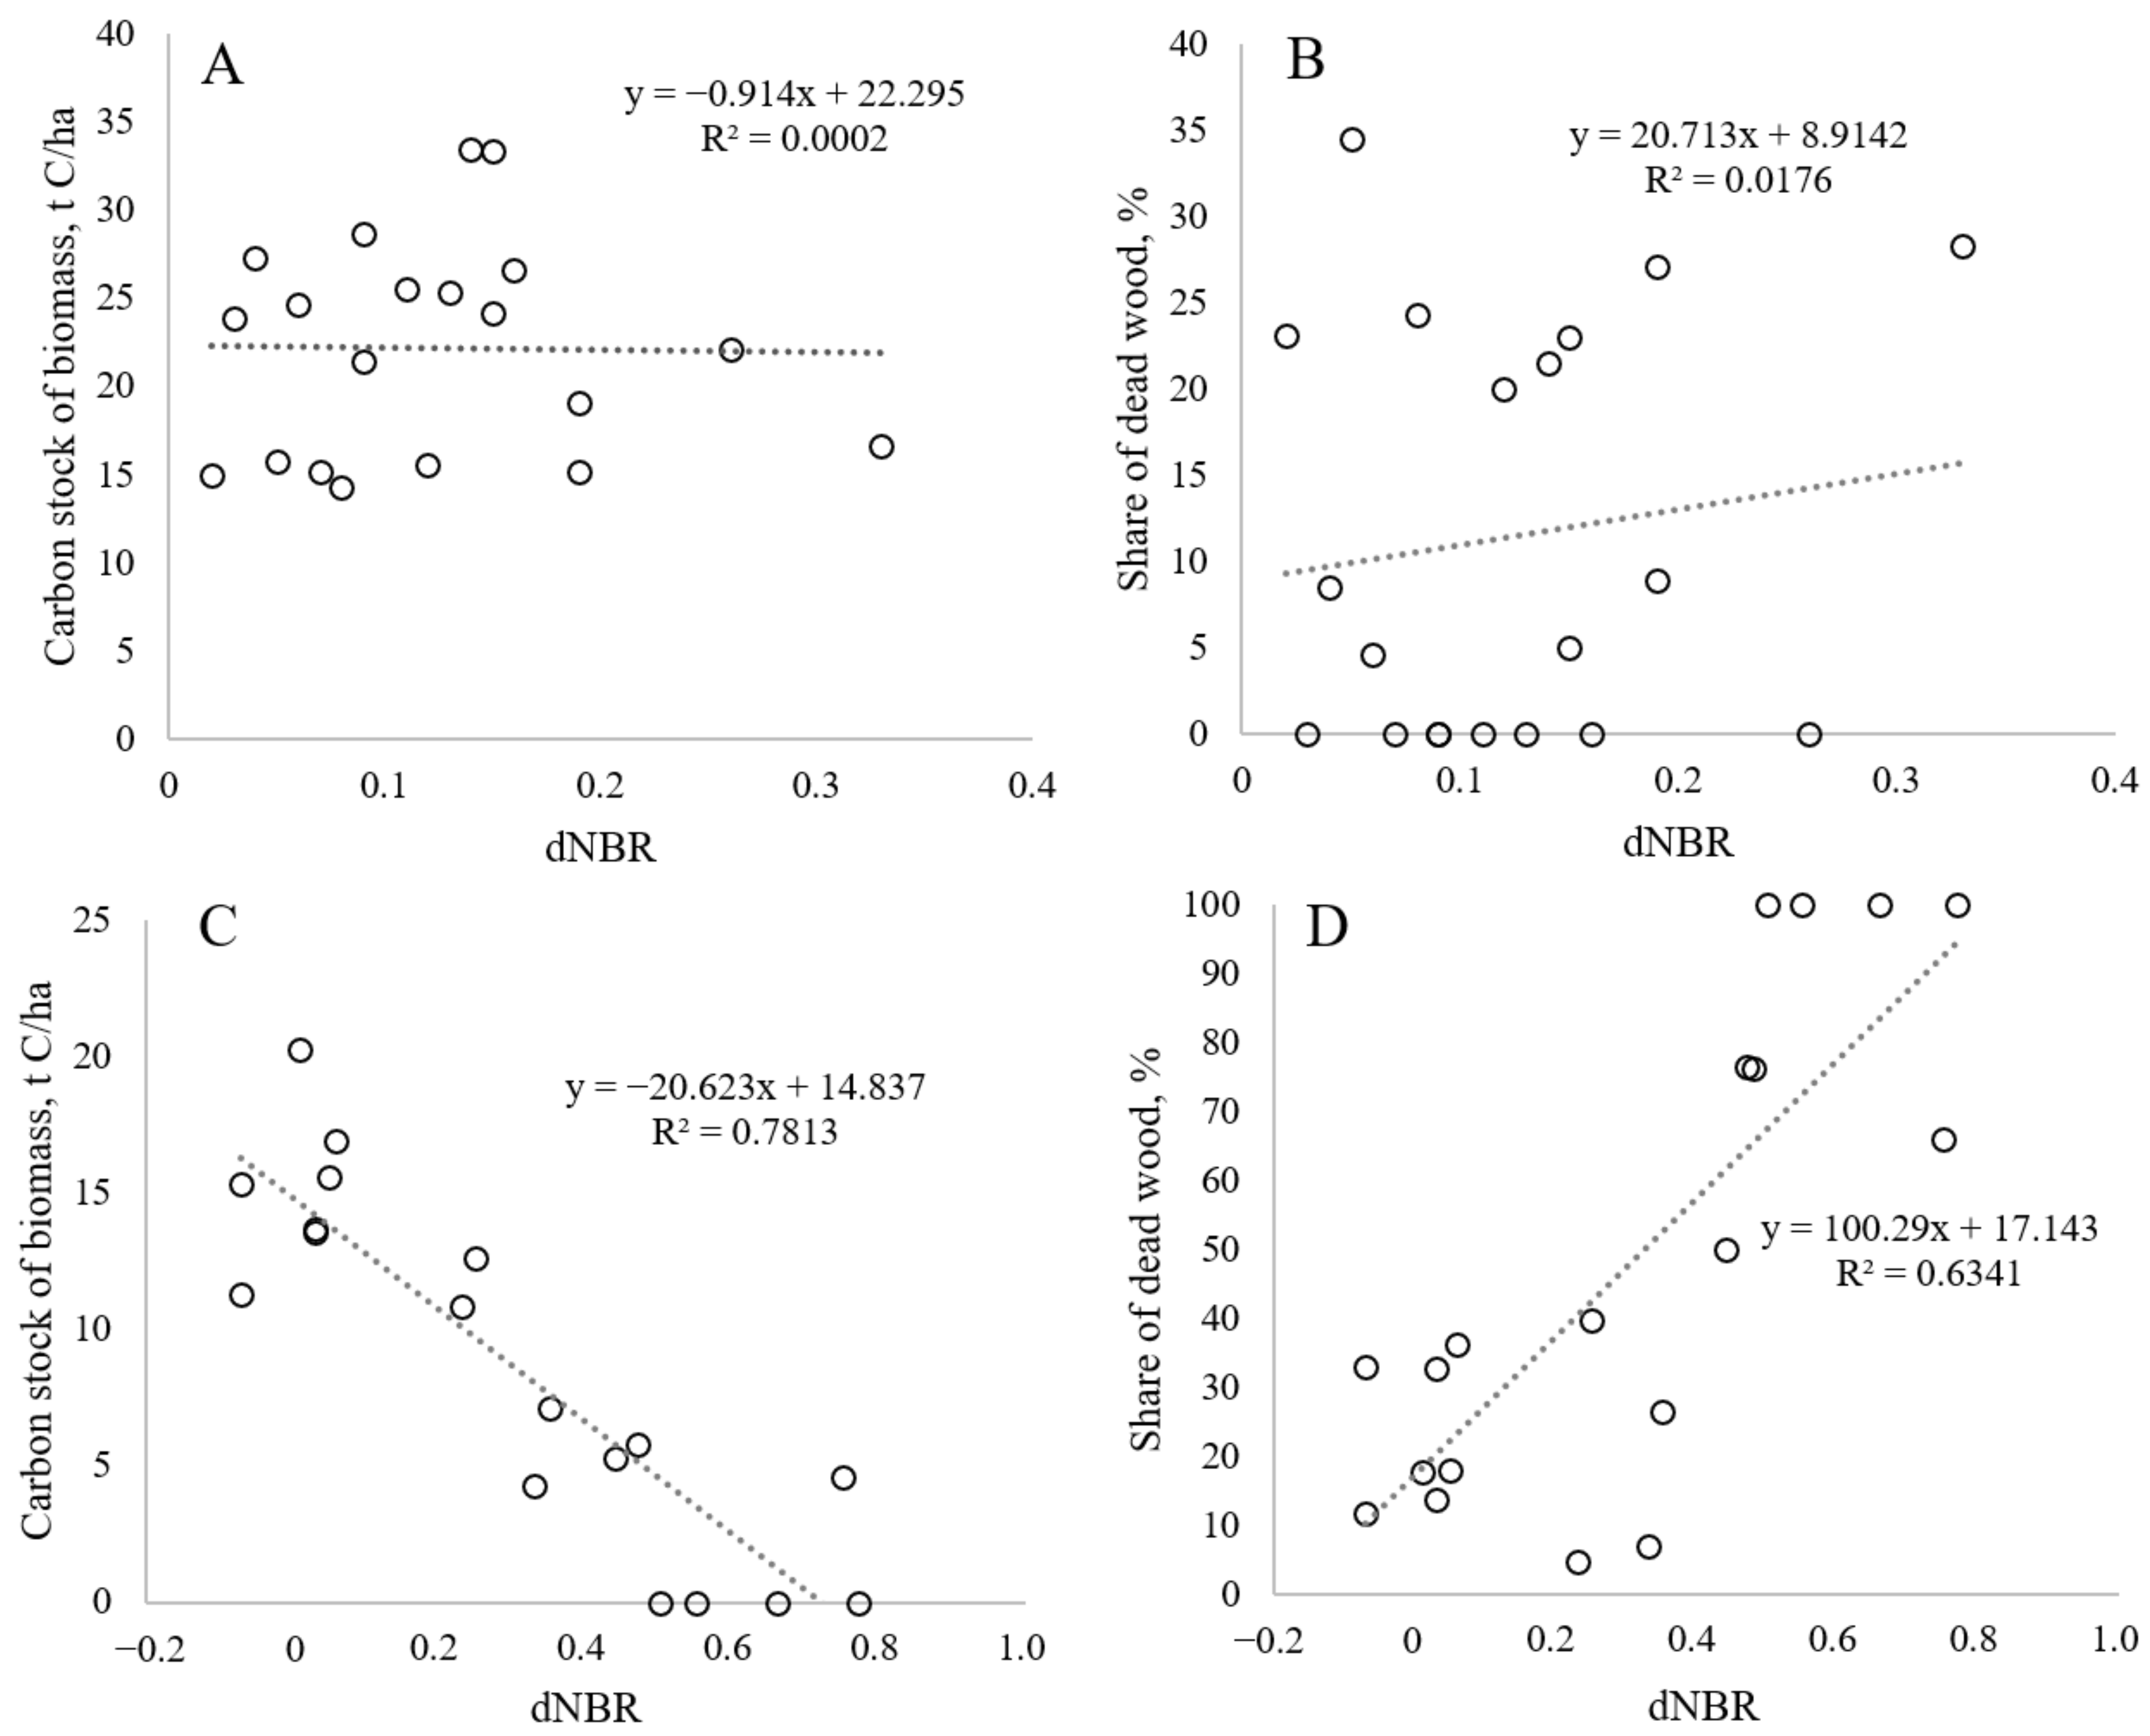
3.4. Aboveground C Stocks and dNBR
Appendix A has a summary table containing the C stock values of the main aboveground pools, as well as the dNBR values for each of the 49 sites. The dNBR varies from −0.07 to 0.77. The maximum values correspond to the greatest pyrogenic degradation of vegetation cover. A total of 65% of the plots have a dNBR > 0.07–0.1, that is, they were affected by fire to one degree or another. The result of the PCA is shown in Figure 7.
Figure 7.
Ordination of two principal components. Phyt—living tree biomass; dry—dead standing wood; CWD—coarse woody debris; lit—litter; grass—living ground cover; N—latitude; E—longitude; dNBR—burn index.
The dNBR shows a relationship with aboveground C pools (except ground cover biomass). As expected, dNBR has a direct correlation with pools of dead standing wood, and an inverse correlation with the living tree stock.
The C stocks of litter, ground cover, and dead standing wood have no relation to the dNBR. This is reasonable, since these forest components do not affect the spectral-reflective characteristics of pixels (reflection in the near and short-wave infrared channels). Phytomass, on the contrary, illustrates the close relationship with dNBR.
For a more detailed consideration, the data set was divided into two parts by latitude: northern (sites 21–49) and southern (sites 1–20). These two parts differ significantly in terms of forest vegetation conditions and the nature of restoration successions. For two clusters, dependences of the phytomass stock of the stand and the proportion of mortmass in the total stock of phytomass on the dNBR were constructed (Figure 8).
Figure 8.
The relationship of the dNBR with the stand phytomass stock in the southern (A) and northern (C) parts of the transect and with the proportion of dead standing wood in the total stock of phytomass, respectively (B,D).
With an increase in the dNBR value, the C stock of phytomass naturally decreases and the share of C stock of dead standing wood in the northern part increases. There is no such pattern in the southern part.
4. Discussion
Our study presents the structures of aboveground carbon pools for forest ecosystems in the Asian part of Russia exposed to different fire severities. These results contribute to the scarce data available for the Siberian region [2,26] and are probably the first such study for the Far East. Forest fires have a strong and uneven effect on the stocks of organic matter in different elements of forest ecosystems. Our data from 49 sites with the distribution of C stocks across five main pools (phytomass, dead standing wood, CWD, litter, and ground cover), as well as a burn severity characteristic (dNBR), allowed us to create a linear model illustrating the possibility of predicting the supply of aboveground phytomass in east Siberia and Far East larch forests affected by fires using remote data.
Larch belongs to the pyrophytic species, the renewal of which depends on a forest fire. In the past, fires with a recurrence exceeding 100 years were considered as a factor in the dynamics and renewal of boreal forests [12]. Nowadays, the forest is destroyed by fire faster than it is fully restored. The forests of the Far East are highly mosaic and far from the state of long-term undisturbed ecosystems [27]. The fire return interval for severe fires is estimated to be 53 years, according to De Groot et al., 2013 and 65 years according to recent estimates of Talucci et al., 2022 [6,28]. This interval is much less than the time of the full forest renewal cycle [4]. In the southern part of the studied region, the fire return interval decreases [6]. To understand the effects of forest fires on the ecosystem functions, it is of great importance to have algorithms for converting the spectral-reflective characteristics of satellite images into full-scale parameters of forest ecosystems, in particular aboveground C stocks. We found that an increase in dNBR by 0.1 leads to a decrease in the C stock of phytomass by an average of 2 t ha−1. This result shows the possibilities of an acceptable assessment of the quantitative characteristics of forest ecosystems in the north of the study region based on remote sensing data.
Regular changes in the C stock of phytomass and the proportion of C of dead standing wood were obtained in our study for the northern part of the region. This might be explained by differences in the reforestation process in the north and south part of the study region. In the southern part, under more favourable soil and climatic conditions, birch and aspen trees quickly overgrow and index values quickly increase. By contrast, in the northern part, regeneration by leaved species is hampered by harsh conditions: low precipitation, low average annual air temperatures, and a high occurrence of permafrost [15]. Mainly pure larch forests are being formed here and the process of their restoration is slower. Thus, the dNBR, as a predictor of C stocks of the phytomass of a stand, is the most effective in the northern part of the Far East.
Our results show that the average proportion of C in dead wood is 28%. The conversion of part of the stand to dead wood in some areas leads to a change in the C balance of the ecosystem, under which conditions forests become sources of CO2. A study from the spruce forests of European Russia showed that when 27% of the stand shrinks, the forest becomes a net source of C [29]. In our study, eight out of forty-nine sites have more than 50% of the C stock in the mortmass. This situation, against the background of an increasing pyrogenic load, requires a revision of the C budget for the study area. The Far East region of Russia has the lowest specific C sink among the Russian regions—0.11 t ha−1 yr—due to low productivity and high forest flammability [30].
We found that about 56% of aboveground C is in the phytomass, the remaining 44% can be considered as a potential fuel for forest fires. The probability of a severe fire decreases only in areas with small stocks of litter and ground cover, but the risk of water erosion increases [31].
Against the background of isolated or completely absent regional data on litter and ground cover [7,23], the results of our study provide the first representative field estimates for the larch habitat zone in the Far East. In Central Siberia, from 15 to 30 t ha−1 are stored in pools of litter and ground cover, which is comparable to C stocks in phytomass [23]. In the southern part of the Far Eastern region, this value varies between 3 and 8 t ha−1 [22]. There is a natural increase in the stock of litter and ground cover with an increase in latitude, and, consequently, the contribution of these pools to the total aboveground C stock. The average ratio between these pools in our study is 77% of the litter and 23% of the ground cover.
In natural conditions, litter and dead standing wood stocks in forests are formed under the action of two oppositely directed processes: intake from a living stand and decomposition. The fire factor unpredictably changes the stocks of deadwood and litter, creating a direct flow of C into the atmosphere. The effect of a fire on organic matter reserves is determined by the fire type (crown or surface) and strength of the fire itself, the seasons of the year, climate, and weather features. Thus, a spring surface fire can be accompanied by a slight burning of dry parts of herbaceous plants, while a steady fire in a dry period can destroy the forest floor and a significant part of the dead standing wood.
5. Conclusions
As a result of a comprehensive study on a large area of the Asian part of boreal forests, field estimates of C stocks in the main aboveground pools in larch forests with varying degrees of fire exposure are presented. Due to a combination of a number of factors, such as climate, type and age of the forest, and the strength of the fire impact, the structure of aboveground pools is extremely variable. Estimates of C stock performed by classical laboratory methods expand the database of empirical data on the state of forests in Siberia and the Far East. The noted trends of aridization and climate warming will lead not only to a decrease in the average age of forests but also to a decrease in all C stocks in including litter and ground cover.
The widespread dNBR, calculated on the basis of a series of Landsat images, can serve as a good predictor of the C stock of phytomass after a fire in the northern part of the Far East region, which opens up opportunities for approximate quantitative remote estimates of C losses.
Author Contributions
Conceptualization, A.I.; Methodology, A.I.; Validation, Y.M.; Formal analysis, Y.M. and E.S.; Investigation, A.I., E.S., A.D. and S.B.; Data curation, A.I., Y.M. and E.S.; Writing—original draft, A.I. and Y.M.; Writing—review & editing, A.I., E.Z. and S.B.; Visualization, Y.M.; Supervision, S.B.; Funding acquisition, S.B. All authors have read and agreed to the published version of the manuscript.
Funding
The study was funded by a grant from the Russian Science Foundation No. 23-27-00346, URL https://rscf.ru/en/project/23-27-00346/ (accessed on 1 March 2024).
Data Availability Statement
The data are available on request from the corresponding author.
Acknowledgments
We would like to thank Irina Smuskina for data visualization and statistical analysis.
Conflicts of Interest
The authors declare that the research was conducted without any commercial or financial relationships that could be construed as a potential conflict of interest.
Appendix A
Table A1.
Site position, characteristics of main aboveground C pools, and fire damage. PP—site ID; E—longitude; N—latitude; ALT—altitude; TBM—tree biomass; DSW—dead standing wood; LT—litter; GC—ground cover living plants; CWD—coarse woody debris; TSF—years since fire.
Table A1.
Site position, characteristics of main aboveground C pools, and fire damage. PP—site ID; E—longitude; N—latitude; ALT—altitude; TBM—tree biomass; DSW—dead standing wood; LT—litter; GC—ground cover living plants; CWD—coarse woody debris; TSF—years since fire.
| PP | E | N | ALT | Carbon Stock, t C/ha | ||||||
|---|---|---|---|---|---|---|---|---|---|---|
| TBM | DSW | LT | GC | CWD | dNBR | TSF | ||||
| E1 | 126.97 | 52.62 | 332.02 | 23.87 | 0.00 | 6.71 | 0.05 | 0.60 | 0.03 | - |
| E2 | 126.89 | 52.62 | 331.00 | 22.13 | 0.00 | 6.93 | 0.04 | 0.32 | 0.26 | 21 |
| E3 | 126.81 | 52.70 | 314.53 | 33.51 | 9.21 | 10.61 | 0.29 | 2.85 | 0.14 | 27 |
| E4 | 126.78 | 52.67 | 320.48 | 16.67 | 6.60 | 9.14 | 0.53 | 2.60 | 0.33 | 20 |
| E5 | 126.74 | 52.62 | 317.81 | 15.20 | 5.67 | 7.83 | 0.75 | 0.76 | 0.19 | 5 |
| E6 | 127.31 | 52.42 | 316.15 | 15.60 | 3.90 | 2.35 | 0.70 | 0.63 | 0.12 | 34 |
| E7 | 127.42 | 52.25 | 318.93 | 25.56 | 0.00 | 5.90 | 0.50 | 2.18 | −0.11 | 21 |
| E8 | 127.55 | 52.22 | 321.03 | 33.35 | 1.75 | 3.76 | 0.25 | 1.46 | 0.15 | 21 |
| E9 | 127.71 | 52.17 | 320.09 | 26.61 | 0.00 | 6.92 | 0.31 | 0.67 | 0.16 | 24 |
| E10 | 127.69 | 52.15 | 300.74 | 28.69 | 0.00 | 7.71 | 0.78 | 0.89 | 0.09 | 24 |
| E11 | 127.81 | 52.08 | 315.39 | 21.41 | 0.00 | 6.72 | 0.79 | 3.27 | 0.09 | 7 |
| E12 | 127.80 | 52.08 | 320.37 | 24.22 | 7.25 | 3.83 | 0.58 | 2.10 | −0.15 | 24 |
| E13 | 127.95 | 52.10 | 296.49 | 24.67 | 1.19 | 6.17 | 0.43 | 2.11 | 0.06 | 17 |
| E14 | 128.07 | 52.10 | 292.87 | 25.37 | 0.00 | 3.41 | 0.41 | 0.46 | 0.13 | 5 |
| E15 | 128.10 | 52.11 | 290.92 | 15.13 | 0.00 | 5.01 | 0.36 | 0.99 | 0.07 | 36 |
| E16 | 128.07 | 52.09 | 290.44 | 27.29 | 2.56 | 2.82 | 0.49 | 0.00 | 0.04 | 36 |
| E17 | 126.21 | 53.37 | 348.63 | 19.13 | 1.18 | 1.65 | 0.51 | 0.70 | 0.19 | 36 |
| E18 | 125.35 | 53.60 | 458.70 | 15.77 | 5.45 | 2.63 | 1.02 | 2.88 | 0.05 | 11 |
| E19 | 125.03 | 53.72 | 555.54 | 14.28 | 1.70 | 2.49 | 0.83 | 2.90 | 0.05 | 23 |
| E20 | 124.90 | 53.68 | 527.76 | 14.99 | 2.87 | 1.91 | 1.57 | 1.63 | 0.02 | 11 |
| E21 | 124.77 | 55.37 | 585.72 | 5.29 | 2.72 | 3.75 | 2.12 | 2.58 | 0.44 | 7 |
| E22 | 124.96 | 55.98 | 920.65 | 8.70 | 0.00 | 4.21 | 1.27 | 0.00 | - | - |
| E23 | 124.85 | 56.07 | 1056.63 | 14.48 | 0.00 | 3.11 | 1.21 | 2.20 | - | - |
| E24 | 124.73 | 56.39 | 899.61 | 4.27 | 0.00 | 6.66 | 4.72 | 0.32 | 0.33 | 27 |
| E25 | 124.78 | 56.55 | 786.66 | 0.00 | 1.18 | 0.59 | 1.60 | 0.96 | 0.77 | 8 |
| E26 | 124.83 | 56.59 | 929.73 | 0.00 | 1.18 | 6.72 | 1.34 | 1.35 | 0.66 | 15 |
| E27 | 124.81 | 56.57 | 858.57 | 11.77 | 1.13 | 3.74 | 3.59 | 0.82 | - | - |
| E28 | 124.85 | 57.07 | 759.96 | 20.03 | 0.00 | 2.15 | 3.69 | 0.06 | - | - |
| E29 | 124.97 | 57.42 | 985.03 | 10.81 | 0.00 | 3.95 | 1.35 | 0.53 | 0.23 | 24 |
| E30 | 125.17 | 57.61 | 1160.31 | 13.68 | 1.67 | 3.80 | 2.41 | 0.52 | 0.03 | - |
| E31 | 125.43 | 57.87 | 1180.21 | 10.44 | 6.06 | 3.62 | 1.43 | 8.70 | - | - |
| E32 | 125.40 | 58.23 | 866.22 | 15.29 | 3.04 | 8.65 | 3.61 | 4.50 | −0.07 | - |
| E33 | 125.38 | 58.56 | 682.70 | 11.26 | 1.13 | 3.19 | 2.33 | 0.36 | −0.07 | - |
| E34 | 125.41 | 58.67 | 535.22 | 0.00 | 1.50 | 3.74 | 0.23 | 2.70 | 0.55 | 15 |
| E35 | 125.52 | 58.80 | 382.56 | 20.26 | 1.67 | 3.06 | 0.81 | 2.70 | 0.01 | - |
| E36 | 125.80 | 58.90 | 440.20 | 15.60 | 1.30 | 4.48 | 0.24 | 2.10 | 0.05 | - |
| E37 | 127.01 | 59.42 | 380.37 | 0.00 | 3.65 | 0.69 | 0.33 | 2.60 | 0.50 | 18 |
| E38 | 127.08 | 59.62 | 313.62 | 13.52 | 4.10 | 2.72 | 1.83 | 2.50 | 0.03 | - |
| E39 | 127.21 | 59.76 | 383.01 | 8.59 | 2.13 | 3.27 | 2.15 | 0.07 | - | - |
| E40 | 127.22 | 59.88 | 465.75 | 10.96 | 3.60 | 1.93 | 1.78 | 1.30 | - | - |
| E41 | 127.25 | 60.01 | 554.36 | 14.17 | 2.37 | 2.74 | 1.07 | 2.05 | - | - |
| E42 | 127.29 | 60.11 | 433.07 | 10.38 | 4.62 | 1.52 | 1.74 | 1.90 | - | - |
| E43 | 127.46 | 60.35 | 444.69 | 4.57 | 5.87 | 0.82 | 1.11 | 2.99 | 0.75 | 12 |
| E44 | 128.00 | 60.54 | 478.96 | 10.39 | 1.09 | 1.15 | 0.63 | 1.99 | - | - |
| E45 | 128.23 | 60.63 | 471.60 | 12.62 | 6.77 | 1.41 | 0.72 | 1.50 | 0.25 | 21 |
| E46 | 128.60 | 60.79 | 355.25 | 7.08 | 2.49 | 1.39 | 0.61 | 0.06 | 0.35 | 14 |
| E47 | 128.77 | 60.96 | 381.57 | 5.79 | 12.55 | 1.12 | 1.65 | 6.15 | 0.47 | 2 |
| E48 | 128.83 | 61.07 | 363.13 | 16.90 | 3.54 | 2.29 | 0.20 | 6.08 | - | - |
| E49 | 128.85 | 61.07 | 332.01 | 4.35 | 5.86 | 1.19 | 0.25 | 8.00 | 0.48 | 21 |
Table A2.
Characteristics of Landsat images, used for fire identification and dNBR calculation (data show only areas subjected to fires).
Table A2.
Characteristics of Landsat images, used for fire identification and dNBR calculation (data show only areas subjected to fires).
| PP | N | E | ID Pre-Fire Landsat (path/row_yyyymmdd) | ID Fire Landsat (path/row_yyyymmdd) | ID Post-Fire Landsat (path/row_yyyymmdd) |
|---|---|---|---|---|---|
| 2 | 52.62 | 126.88 | 120/023_20010623 | 120/023_20020610 | 119/023_20030622 |
| 3 | 52.70 | 126.81 | 120/023_19950709 | 120/023_19960524 | 119/023_19970723 |
| 4 | 52.66 | 126.78 | 120/023_20020610 | 120/023_20030816 | 119/023_20040608 |
| 5 | 52.61 | 126.73 | 120/023_20170721 | 119/023_20180530 | 119/023_20190805 |
| 6 | 52.41 | 127.30 | 119/024_19880628 | 119/023_19890530 | 119/024_19900720 |
| 7 | 52.24 | 127.41 | 119/024_20010803 | 119/024_20020705 | 119/024_20030809 |
| 8 | 52.21 | 127.55 | 119/024_20010803 | 119/024_20020705 | 119/024_20030809 |
| 9 | 52.17 | 127.70 | 118/024_19980617 | 118/024_19990519 | 119/024_20000613 |
| 10 | 52.15 | 127.68 | 118/024_19980617 | 118/024_19990604 | 119/024_20000613 |
| 11 | 52.07 | 127.80 | 118/024_20150702 | 119/024_20160625 | 118/024_20170621 |
| 12 | 52.08 | 127.80 | 118/024_19980617 | 118/024_19990519 | 119/024_20000613 |
| 13 | 52.10 | 127.94 | 119/024_20050627 | 119/024_20060630 | 119/024_20070617 |
| 14 | 52.09 | 128.06 | 119/024_20170612 | 119/024_20180530 | 118/024_20190611 |
| 15 | 52.10 | 128.10 | 119/024_19860725 | 119/024_19870610 | 119/024_19880628 |
| 16 | 52.09 | 128.06 | 119/024_19860725 | 119/024_19870610 | 119/024_19880628 |
| 17 | 53.36 | 126.21 | 120/023_19860614 | 119/024_19870610 | 120/023_19880603 |
| 18 | 53.60 | 125.34 | 120/023_20110705 | 120/023_20120613 | 120/023_20130624 |
| 19 | 53.71 | 125.02 | 121/023_19990727 | 121/023_20000611 | 121/023_20010716 |
| 20 | 53.68 | 124.89 | 121/023_20110626 | 121/023_20120620 | 122/022_20130622 |
| 21 | 55.37 | 124.76 | 122/022_20150808 | 121/022_20160826 | 122/021_20170804 |
| 24 | 56.39 | 124.73 | 123/020_19940812 | 123/021_19960614 | 123/020_19970804 |
| 25 | 56.54 | 124.78 | 122/020_20150714 | 123/020_20150822 | 122/021_20160716 |
| 26 | 56.59 | 124.82 | 123/020_20070629 | 123/020_20080717 | 122/021_20090713 |
| 29 | 57.41 | 124.97 | 122/020_19970813 | 122/020_19990803 | 123/020_20000812 |
| 34 | 58.67 | 125.41 | 123/019_20070715 | 122/019_20080717 | 122/019_20090713 |
| 37 | 59.41 | 127.00 | 122/018_20030713 | 122/018_20050702 | 121/019_20060628 |
| 43 | 60.34 | 127.45 | 121/018_20100623 | 122/018_20110719 | 121/018_20120620 |
| 45 | 60.62 | 128.23 | 121/018_20010801 | 122/018_20020827 | 122/018_20030814 |
| 46 | 60.79 | 128.59 | 122/017_20080624 | 122/017_20090830 | 121/018_20100623 |
| 47 | 60.95 | 128.76 | 122/017_20200625 | 122/017_20210730 | 122/017_20220623 |
| 49 | 61.07 | 128.85 | 122/017_20000704 | 122/017_20020827 | 122/017_20040613 |
References
- Zhang, Y.H.; Wooster, M.J.; Tutubalina, O.; Perry, G.L.W. Monthly Burned Area and Forest Fire Carbon Emission Estimates for the Russian Federation from SPOT VGT. Remote Sens. Environ. 2003, 87, 1–15. [Google Scholar] [CrossRef]
- Osawa, A.; Kajimoto, T. Development of Stand Structure in Larch Forests. In Permafrost Ecosystems: Siberian Larch Forests; Osawa, A., Zyryanova, O., Matsuura, Y., Kajimoto, T., Wein, R., Eds.; Springer: Berlin/Heidelberg, Germany, 2010; Volume 209, pp. 123–148. [Google Scholar] [CrossRef]
- Romanov, A.A.; Tamarovskaya, A.N.; Gloor, E.; Brienen, R.; Gusev, B.A.; Leonenko, E.V.; Vasiliev, A.S.; Krikunov, E.E. Reassessment of Carbon Emissions from Fires and a New Estimate of Net Carbon Uptake in Russian Forests in 2001–2021. Sci. Total Environ. 2022, 846, 157322. [Google Scholar] [CrossRef] [PubMed]
- Kharuk, V.I.; Dvinskaya, M.L.; Petrov, I.A.; Im, S.T.; Ranson, K.J. Larch Forests of Middle Siberia: Long-Term Trends in Fire Return Intervals. Reg. Environ. Change 2016, 16, 2389–2397. [Google Scholar] [CrossRef]
- Ponomarev, E.I.; Zabrodin, A.N.; Shvetsov, E.G.; Ponomareva, T.V. Wildfire Intensity and Fire Emissions in Siberia. Fire 2023, 6, 246. [Google Scholar] [CrossRef]
- De Groot, W.J.; Cantin, A.S.; Flannigan, M.D.; Soja, A.J.; Gowman, L.M.; Newbery, A. A Comparison of Canadian and Russian Boreal Forest Fire Regimes. For. Ecol. Manag. 2013, 294, 23–34. [Google Scholar] [CrossRef]
- Sergeeva, O.V.; Mukhortova, L.V.; Krivobokov, L.V. Distribution of Forest Litter and Live Ground Cover Biomass in Northern Taiga of the Central Evenkia Depending on Relief. Sib. For. J. 2020, 1, 38–46. [Google Scholar] [CrossRef]
- Kasischke, E.S. Boreal Ecosystems in the Global Carbon Cycle. In Fire, Climate Change, and Carbon Cycling in the Boreal Forest; Springer: Berlin/Heidelberg, Germany, 2000; pp. 19–30. [Google Scholar] [CrossRef]
- Fraser, R.H.; Li, Z.; Cihlar, J. Hotspot and NDVI Differencing Synergy (HANDS): A New Technique for Burned Area Mapping over Boreal Forest. Remote Sens. Environ. 2000, 74, 362–376. [Google Scholar] [CrossRef]
- Alexander, H.D.; Paulson, A.K.; Loranty, M.M.; Mack, M.C.; Natali, S.M.; Pena, H.; Davydov, S.; Spektor, V.; Zimov, N. Linking Post-Fire Tree Density to Carbon Storage in High-Latitude Cajander Larch (Larix cajanderi) Forests of Far Northeastern Siberia. Ecosystems 2024, 27, 655–672. [Google Scholar] [CrossRef]
- Alexander, H.D.; Mack, M.C.; Goetz, S.; Loranty, M.M.; Beck, P.S.A.; Earl, K.; Zimov, S.; Davydov, S.; Thompson, C.C. Carbon Accumulation Patterns During Post-Fire Succession in Cajander Larch (Larix cajanderi) Forests of Siberia. Ecosystems 2012, 15, 1065–1082. [Google Scholar] [CrossRef]
- Kajimoto, T.; Osawa, A.; Usoltsev, V.A.; Abaimov, A.P. Biomass and Productivity of Siberian Larch Forest Ecosystems. In Permafrost Ecosystems: Siberian Larch Forests; Springer: Berlin/Heidelberg, Germany, 2010; ISBN 9781402096921. [Google Scholar]
- Mukhortova, L.; Krivobokov, L.; Schepaschenko, D. Postfire dynamics of standing dead tree stock in northern boreal forests. BIO Web Conf. 2022, 52, 00038. [Google Scholar] [CrossRef]
- Webb, E.E.; Heard, K.; Natali, S.M.; Bunn, A.G.; Alexander, H.D.; Berner, L.T.; Kholodov, A.; Loranty, M.M.; Schade, J.D.; Spektor, V.; et al. Variability in above- and belowground carbon stocks in a Siberian larch watershed. Biogeosciences 2017, 14, 4279–4294. [Google Scholar] [CrossRef]
- Ivanov, A.V.; Neumann, M.; Darman, G.F.; Danilov, A.V.; Susloparova, E.S.; Solovyov, I.D.; Kravchenko, O.M.; Smuskina, I.N.; Bryanin, S. Vulnerability of Larch Forests to Forest Fires along a Latitudinal Gradient in Eastern Siberia. Can. J. For. Res. 2022, 52, 1543–1552. [Google Scholar] [CrossRef]
- FAO. World Reference Base for Soil Resources 2014 International Soil Classification System for Naming Soils and Creating Legends for Soil Maps, 4th ed.; FAO: Rome, Italy, 2014; ISBN 978-92-5-108369-7. [Google Scholar]
- Utkin, A. Forest of Central Yakutia; Nauka: Moscow, Russia, 1965; 208p. [Google Scholar]
- Stamatellos, G.; Georgakis, A. Normal and Bootstrap Confidence Intervals in Bitterlich Sampling. Open J. For. 2020, 10, 58–65. [Google Scholar] [CrossRef]
- Van Wagner, C.E. The Line Intersect Method in Forest Fuel Sampling. For. Sci. 1968, 14, 20–26. [Google Scholar]
- Woldendorp, G.; Keenan, R.J.; Barry, S.; Spencer, R.D. Analysis of Sampling Methods for Coarse Woody Debris. For. Ecol. Manag. 2004, 198, 133–148. [Google Scholar] [CrossRef]
- Grabovsky, V.; Zamolodchikov, D. Models of Estimating Slash Reserves According to Data Obtained on Transects. Lesovedenie 2012, 2, 66–73. [Google Scholar]
- Ivanov, A.V.; Braun, M.; Zamolodchikov, D.G.; Lynov, D.V.; Panfilova, E.V. Forest Litters as a Link in the Carbon Cycle in Coniferous–Broadleaved Forests of the Southern Far East of Russia. Eurasian Soil Sci. 2018, 51, 1164–1171. [Google Scholar] [CrossRef]
- Prokushkin, S.G.; Abaimov, A.P.; Prokushkin, A.S.; Masyagina, O.V. Biomass of Ground Cover and Undergrowth in Larch Forests of the Permafrost Zone of Central Siberia. Sib. Ecol. J. 2006, 2, 131–139. [Google Scholar]
- Key, C.H.; Benson, N.C. Landscape Assessment (LA) Sampling and Analysis Methods. In USDA Forest Service General Technical Report RMRS-GTR; USDA: Washington, DC, USA, 2006. [Google Scholar]
- Chu, T.; Guo, X.; Takeda, K. Temporal Dependence of Burn Severity Assessment in Siberian Larch (Larix Sibirica) Forest of Northern Mongolia Using Remotely Sensed Data. Int. J. Wildland Fire 2016, 25, 685–698. [Google Scholar] [CrossRef]
- Webb, E.E.; Alexander, H.D.; Paulson, A.K.; Loranty, M.M.; DeMarco, J.; Talucci, A.C.; Spektor, V.; Zimov, N.; Lichstein, J.W. Fire-Induced Carbon Loss and Tree Mortality in Siberian Larch Forests. Geophys. Res. Lett. 2024, 51, e2023GL105216. [Google Scholar] [CrossRef]
- Song, X.; Wang, G.; Ran, F.; Chang, R.; Song, C.; Xiao, Y. Effects of topography and fire on soil CO2 and CH4 flux in boreal forest underlain by permafrost in northeast China. Ecol. Eng. 2017, 106, 35–43. [Google Scholar] [CrossRef]
- Talucci, A.C.; Loranty, M.M.; Alexander, H.D. Siberian Taiga and Tundra Fire Regimes from 2001–2020. Environ. Res. Lett. 2022, 17, 025001. [Google Scholar] [CrossRef]
- Karelin, D.V.; Zamolodchikov, D.G.; Shilkin, A.V.; Popov, S.Y.; Kumanyaev, A.S.; de Gerenyu, V.O.L.; Tel’nova, N.O.; Gitarskiy, M.L. The Effect of Tree Mortality on CO2 Fluxes in an Old-Growth Spruce Forest. Eur. J. For. Res. 2021, 140, 287–305. [Google Scholar] [CrossRef]
- Zamolodchikov, D.G.; Grabowsky, V.I.; Chestnykh, O.V. Dynamic Pattern of Carbon Balance in the Forests of Federal Districts of the Russian Federation. For. Sci. Issues 2019, 2, 1–19. [Google Scholar] [CrossRef]
- Halpern, C.B.; Lezberg, A.L.; Bigley, R.E. Broadcast Burning Has Persistent, but Subtle, Effects on Understory Composition and Structure: Results of a Long-Term Study in Western Cascade Forests. For. Ecol. Manag. 2024, 558, 121772. [Google Scholar] [CrossRef]
Disclaimer/Publisher’s Note: The statements, opinions and data contained in all publications are solely those of the individual author(s) and contributor(s) and not of MDPI and/or the editor(s). MDPI and/or the editor(s) disclaim responsibility for any injury to people or property resulting from any ideas, methods, instructions or products referred to in the content. |
© 2024 by the authors. Licensee MDPI, Basel, Switzerland. This article is an open access article distributed under the terms and conditions of the Creative Commons Attribution (CC BY) license (https://creativecommons.org/licenses/by/4.0/).