
Ecological Risk Assessment, Distribution and Source of Polycyclic Aromatic Hydrocarbons in the Soil of Urban and Suburban Forest Areas of Southern Poland


Abstract
1. Introduction
2. Materials and Methods
2.1. Study Area and Soil Sampling
2.2. Laboratory Analysis
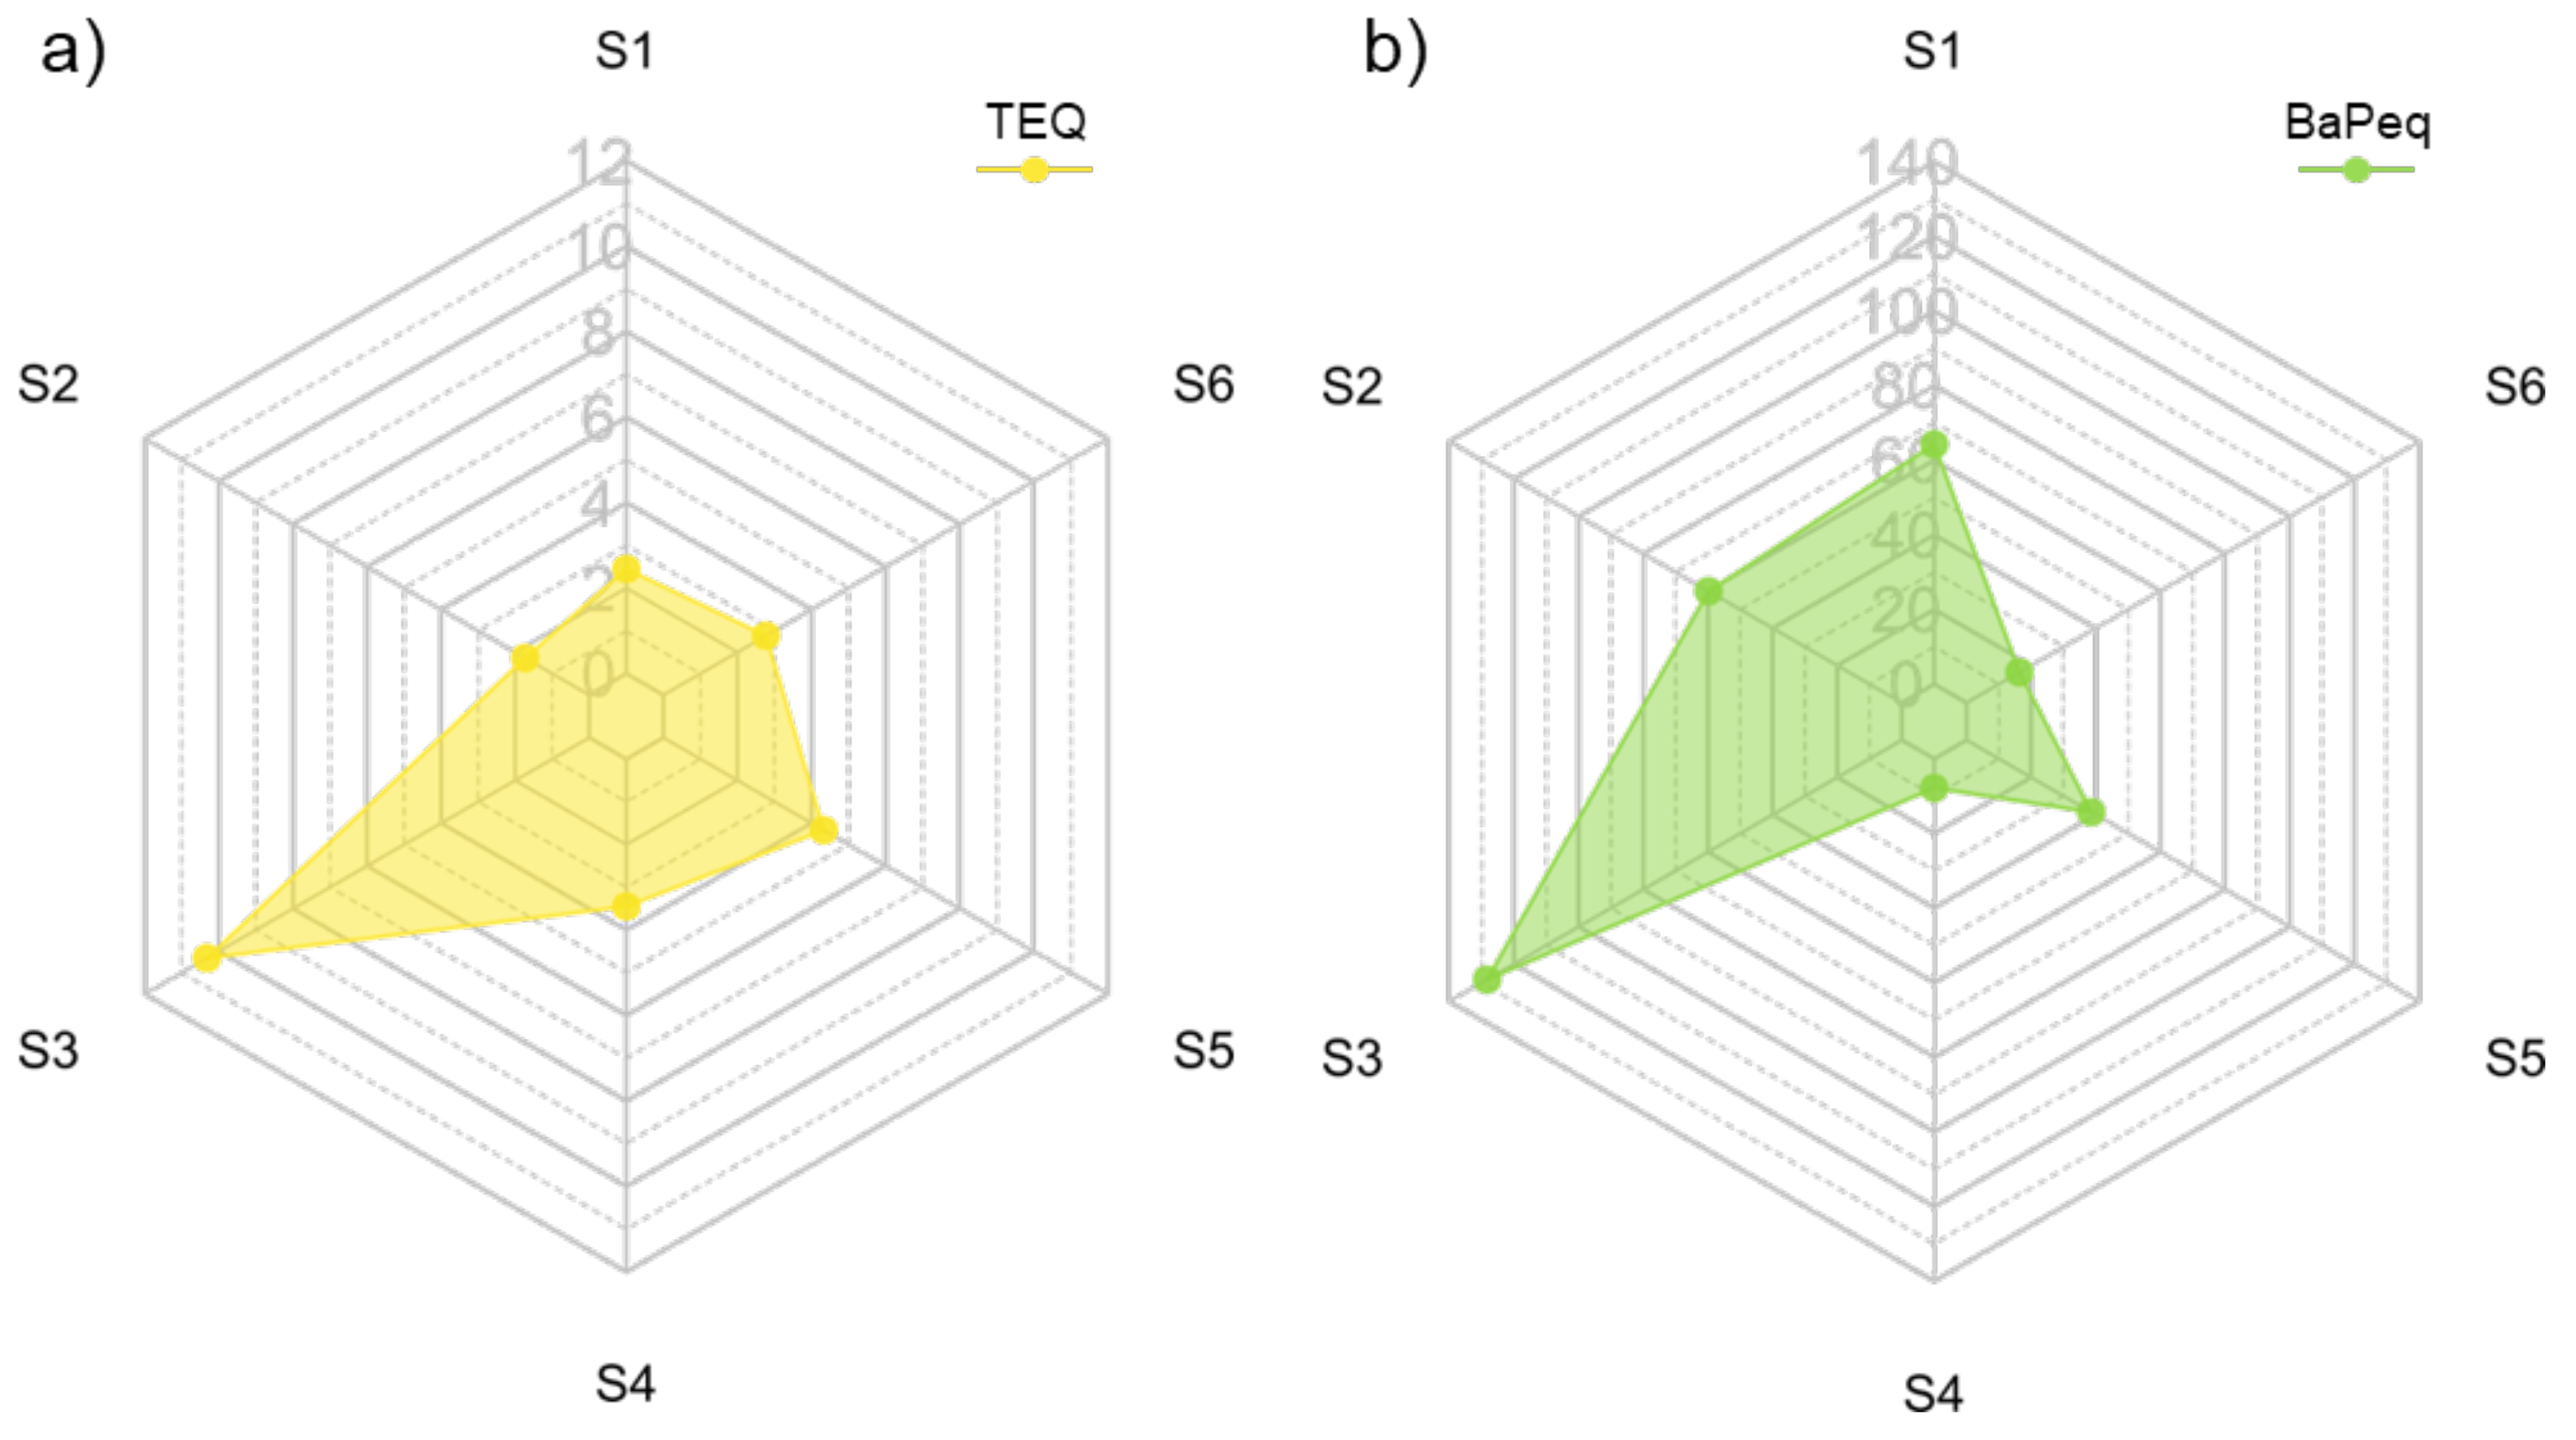
2.3. Toxicity Equivalent Quotient
2.4. Assessment of the Toxicity of PAHs in Soils
2.5. Potential Ecological Risk Assessment
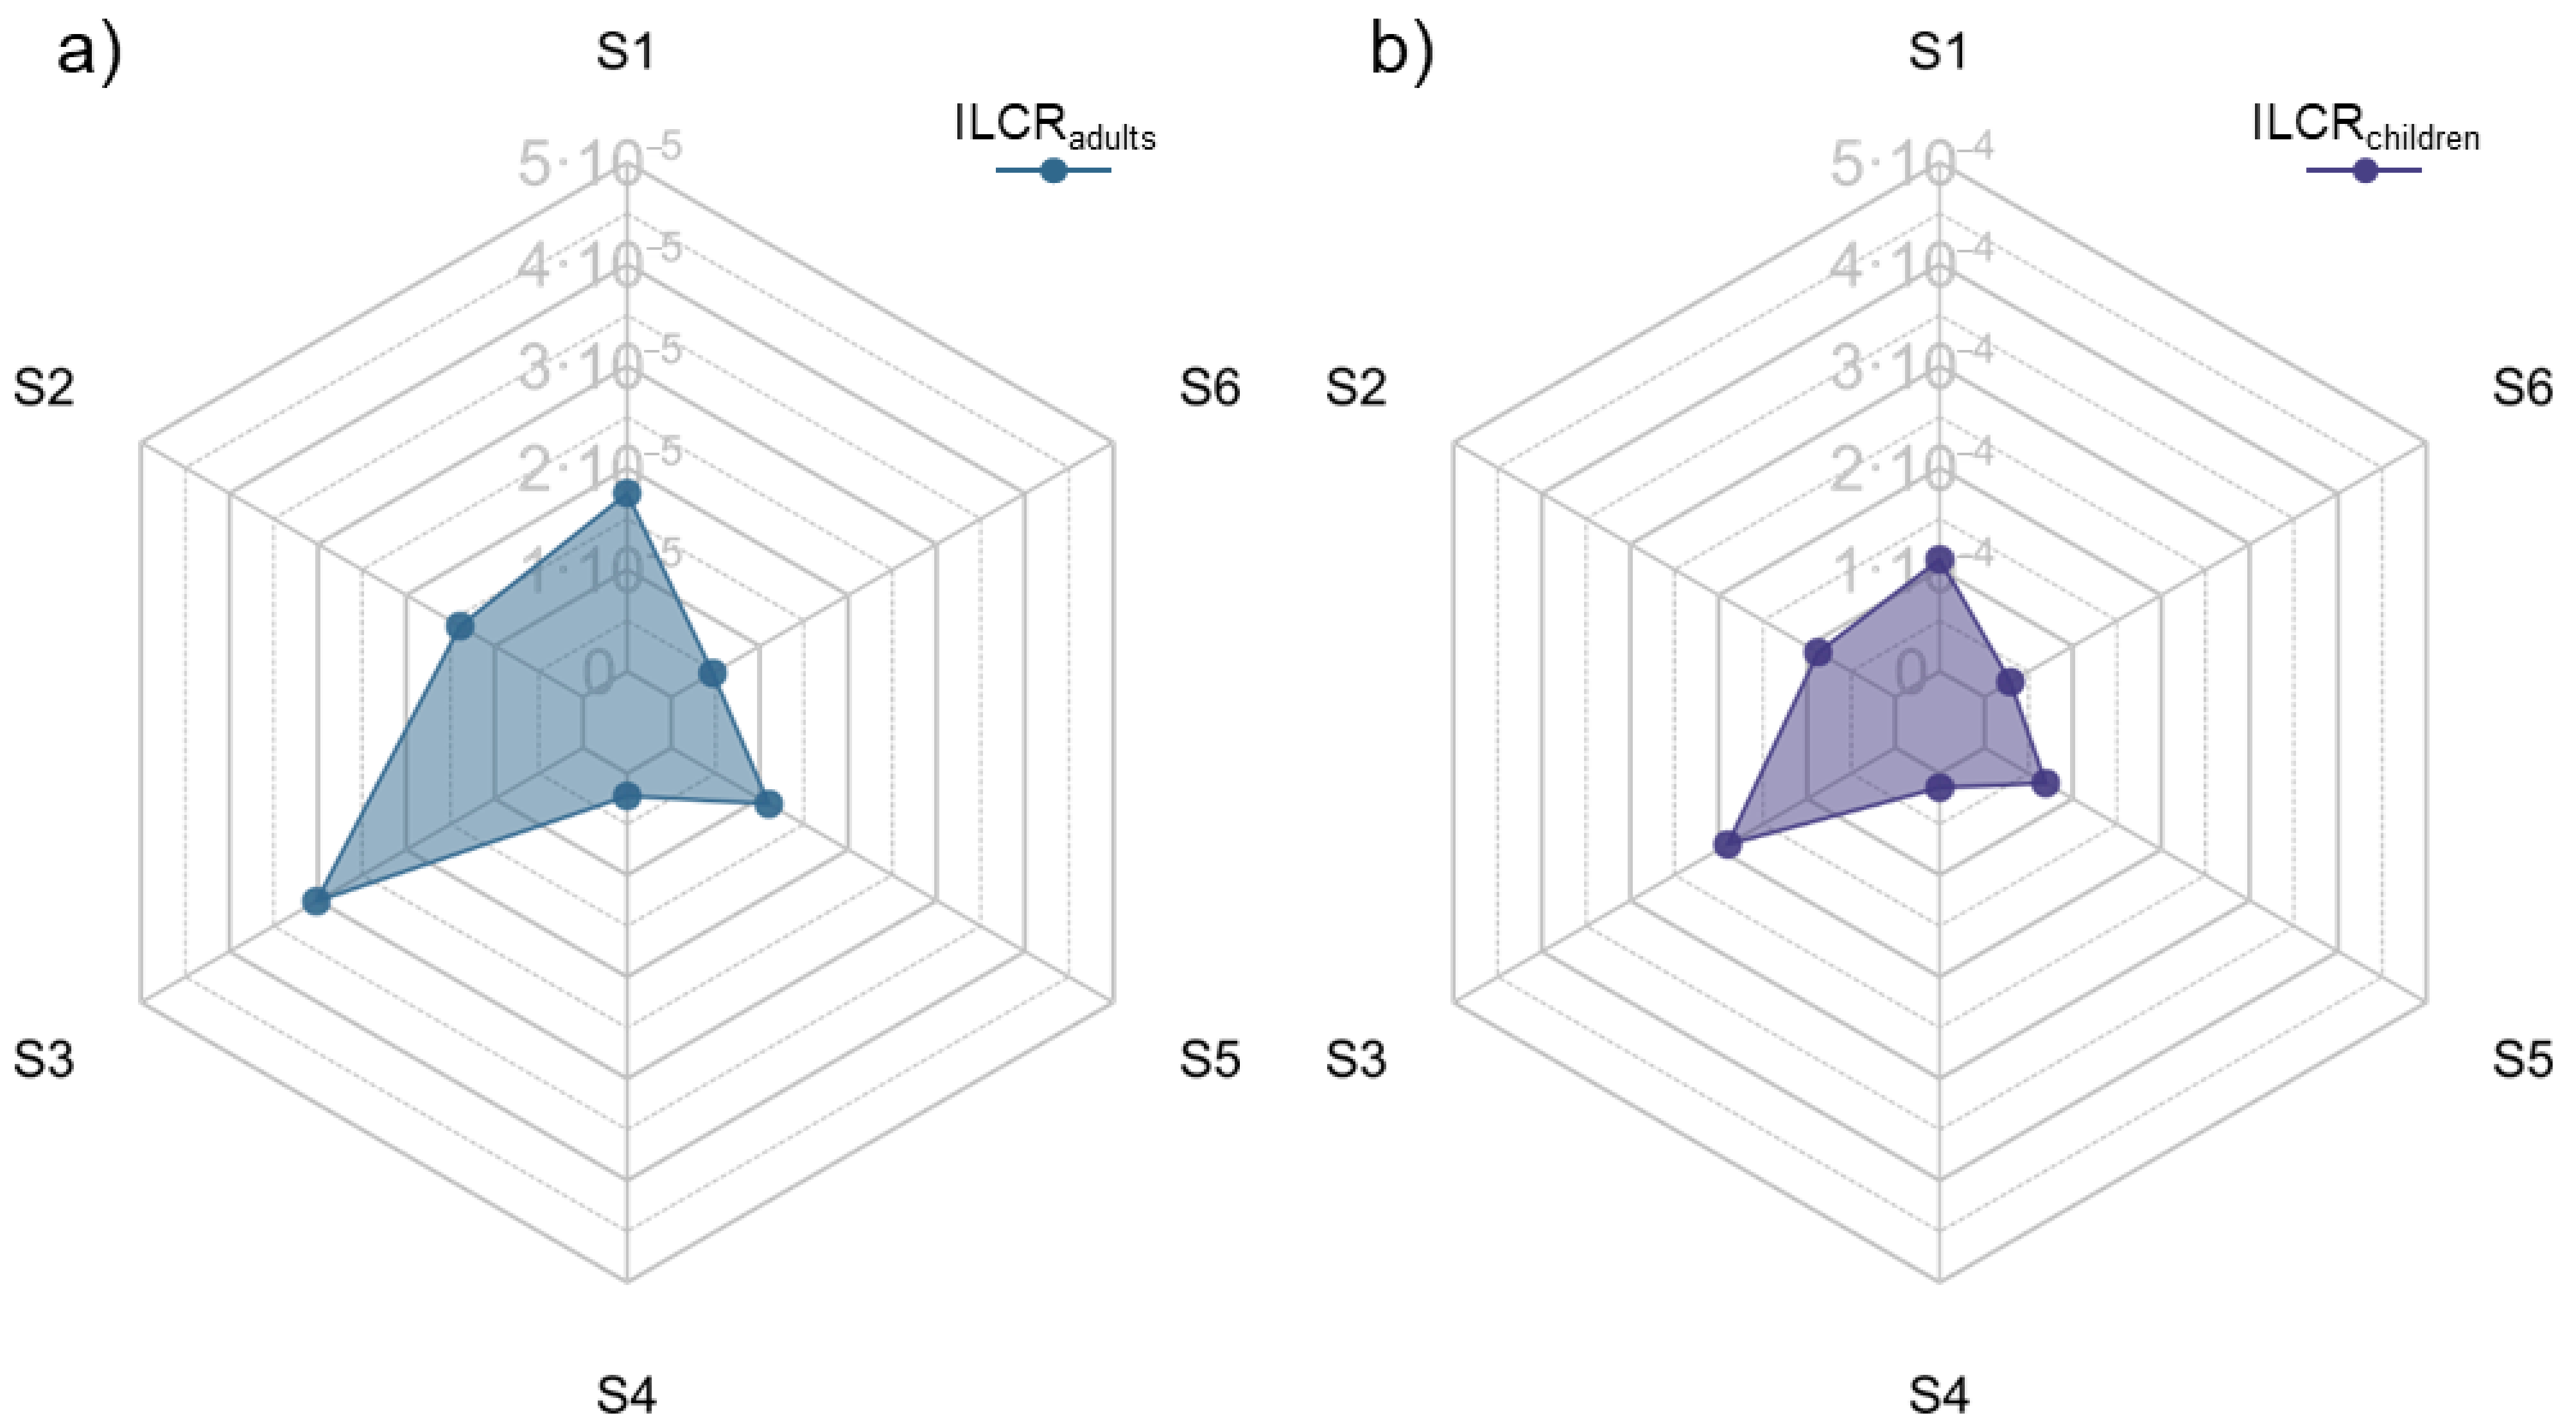
2.6. Incremental Lifetime Cancer Risk Ratio
2.7. Diagnostic Indicators for the Identification of Sources of PAH Pollution Emissions
2.8. Statistical Analysis
3. Results
4. Discussion
5. Conclusions
Author Contributions
Funding
Data Availability Statement
Conflicts of Interest
References
- Samuelsson, K.; Barthel, S.; Giusti, M.; Hartig, T. Visiting Nearby Natural Settings Supported Wellbeing during Sweden’s “Soft-Touch” Pandemic Restrictions. Landsc. Urban Plan. 2021, 214, 104176. [Google Scholar] [CrossRef]
- Da Schio, N.; Phillips, A.; Fransen, K.; Wolff, M.; Haase, D.; Ostoić, S.K.; De Vreese, R. The Impact of the COVID-19 Pandemic on the Use of and Attitudes towards Urban Forests and Green Spaces: Exploring the Instigators of Change in Belgium. Urban For. Urban Green. 2021, 65, 127305. [Google Scholar] [CrossRef] [PubMed]
- Weinbrenner, H.; Breithut, J.; Hebermehl, W.; Kaufmann, A.; Klinger, T.; Palm, T.; Wirth, K. “The Forest Has Become Our New Living Room”—The Critical Importance of Urban Forests During the COVID-19 Pandemic. Front. For. Glob. Change 2021, 4, 683. [Google Scholar] [CrossRef]
- Ghosal, D.; Ghosh, S.; Dutta, T.K.; Ahn, Y. Current State of Knowledge in Microbial Degradation of Polycyclic Aromatic Hydrocarbons (PAHs): A Review. Front. Microbiol. 2016, 7, 13691. [Google Scholar] [CrossRef] [PubMed]
- Cao, H.; Wang, C.; Liu, H.; Jia, W.; Sun, H. Enzyme Activities during Benzo[a]pyrene Degradation by the Fungus Lasiodiplodia theobromae Isolated from a Polluted Soil. Sci. Rep. 2020, 10, 865. [Google Scholar] [CrossRef] [PubMed]
- Tiwari, J.N.; Chaturvedi, P.; Ansari, N.G.; Patel, D.K.; Jain, S.K.; Murthy, R.C. Assessment of Polycyclic Aromatic Hydrocarbons (PAH) and Heavy Metals in the Vicinity of an Oil Refinery in India. Soil Sediment Contam. 2011, 20, 315–328. [Google Scholar] [CrossRef]
- Lui, K.H.; Chan, C.S.; Tian, L.; Ning, B.F.; Zhou, Y.; Song, X.; Ho, K.F. Elements in Fine Particulate Matter (PM2.5) from Indoor Air During Household Stoves Coal Combustion at Xuanwei, China. Aerosol Sci. Eng. 2017, 1, 41–50. [Google Scholar] [CrossRef]
- Wilcke, W. Synopsis polycyclic aromatic hydrocarbons (PAHs) in soil—A review. J. Plant Nutr. Soil Sci. 2000, 163, 229–248. [Google Scholar] [CrossRef]
- Dai, C.; Han, Y.; Duan, Y.; Lai, X.; Fu, R.; Liu, S.; Leong, H.L.; Yaojen, T.; Zhou, L. Review on the contamination and remediation of polycyclic aromatic hydrocarbons (PAHs) in coastal soil and sediments. Environ. Res. 2022, 205, 112423. [Google Scholar] [CrossRef]
- Li, H.; Lai, Z.; Zeng, Y.; Gao, Y.; Yang, W.; Mai, Y.; Wang, C. Occurrence, Source Identification, and Ecological Risk Assessment of Polycyclic Aromatic Hydrocarbons in Sediments of the Pearl River Delta, China. Mar. Pollut. Bull. 2021, 170, 112666. [Google Scholar] [CrossRef]
- Agarwal, T.; Khillare, P.S.; Shridhar, V.; Ray, S. Pattern, Sources and Toxic Potential of PAHs in the Agricultural Soils of Delhi, India. J. Hazard. Mater. 2009, 163, 1033–1039. [Google Scholar] [CrossRef]
- Liu, W.; Wang, D.; Wang, Y.; Zeng, X.; Ni, L.; Tao, Y.; Zhang, J. Improved Comprehensive Ecological Risk Assessment Method and Sensitivity Analysis of Polycyclic Aromatic Hydrocarbons (PAHs). Environ. Res. 2020, 187, 1095001. [Google Scholar] [CrossRef]
- Tobiszewski, M.; Namieśnik, J. PAH Diagnostic Ratios for the Identification of Pollution Emission Sources. Environ. Pollut. 2012, 162, 110–119. [Google Scholar] [CrossRef]
- Cachada, A.; Pato, P.; Rocha-Santos, T.; da Silva, E.F.; Duarte, A.C. Levels, Sources and Potential Human Health Risks of Organic Pollutants in Urban Soils. Sci. Total Environ. 2012, 430, 184–192. [Google Scholar] [CrossRef]
- Manoli, E.; Kouras, A.; Samara, C. Profile Analysis of Ambient and Source Emitted Particle-Bound Polycyclic Aromatic Hydrocarbons from Three Sites in Northern Greece. Chemosphere 2004, 56, 867–878. [Google Scholar] [CrossRef]
- Kendall, C.; Silva, S.R.; Kelly, V.J. Carbon and Nitrogen Isotopic Compositions of Particulate Organic Matter in Four Large River Systems across the United States. Hydrol. Process. 2001, 15, 1301–1346. [Google Scholar] [CrossRef]
- Haritash, A.K.; Kaushik, C.P.J. Biodegradation aspects of polycyclic aromatic hydrocarbons (PAHs): A review. Hazard. Mater. 2009, 169, 1–15. [Google Scholar] [CrossRef] [PubMed]
- Couto, M.N.P.; Monteiro, E.; Vasconcelos, M.T.S. Mesocosm trials of bioremediation of contaminated soil of a petroleum refinery: Comparison of natural attenuation, biostimulation and bioaugmentation. Environ. Sci. Pollut. Res. 2010, 17, 1339–1346. [Google Scholar] [CrossRef] [PubMed]
- Wang, X.T.; Miao, Y.; Zhang, Y.; Li, Y.C.; Wu, M.H.; Yu, G. Polycyclic Aromatic Hydrocarbons (PAHs) in Urban Soils of the Megacity Shanghai: Occurrence, Source Apportionment and Potential Human Health Risk. Sci. Total Environ. 2013, 447, 80–89. [Google Scholar] [CrossRef] [PubMed]
- EEA. Air Quality E-Reporting Database; European Environment Agency: Copenhagen, Denmark, 2020. Available online: http://discomap.eea.europa.eu/map/fme/AirQualityExport.htm (accessed on 6 March 2022).
- Fabiańska, M.J.; Kozielska, B.; Konieczyński, J.; Kowalski, A. Sources of organic pollution in particulate matter and soil of Silesian Agglomeration (Poland): Evidence from geochemical markers. Environ. Geochem. Health 2016, 38, 821–842. [Google Scholar] [CrossRef]
- Godzik, B. Use of Bioindication Methods in National, Regional and Local Monitoring in Poland—Changes in the Air Pollution Level over Several Decades. Atmosphere 2020, 11, 143. [Google Scholar] [CrossRef]
- The State of The Environment in the Silesian Voivodship; Chief Inspectorate for Environmental Protection, Department of Environmental Monitoring, Regional Department of Environmental Monitoring in Katowice: Katowice, Poland, 2020. Available online: https://www.gios.gov.pl/images/dokumenty/pms/raporty/stan_srodowiska_2020_slaskie.pdf (accessed on 6 March 2022).
- The State of The Environment in the Lesser Poland Voivodship; Chief Inspectorate for Environmental Protection, Department of Environmental Monitoring, Regional Department of Environmental Monitoring in Kraków: Kraków, Poland, 2020. Available online: https://www.gios.gov.pl/images/dokumenty/pms/raporty/stan_srodowiska_2020_malopolskie.pdf (accessed on 6 March 2022).
- IUSS Working Group WRB. World Reference Base for Soil Resources 2014, Update 2015: International Soil Classification System for Naming Soils and Creating Legends for Soil Maps. In World Soil Resources Reports No. 106; FAO: Rome, Italy, 2015. [Google Scholar]
- Van den Berg, M.; Birnbaum, L.S.; Denison, M.; De Vito, M.; Farland, W.; Feeley, M.; Fiedler, H.; Hakansson, H.; Hanberg, A.; Haws, L.; et al. The 2005 World Health Organization reevaluation of human and mammalian toxic equivalency factors for dioxins and dioxin-like compounds. Toxicol. Sci. 2006, 93, 223–241. [Google Scholar] [CrossRef]
- Tsai, W.T.; Mi, H.H.; Chang, J.H.; Chang, Y.M. Levels of Polycyclic Aromatic Hydrocarbons in the Bio-Oils from Induction-Heating Pyrolysis of Food-Processing Sewage Sludges. J. Anal. Appl. Pyrolysis 2009, 86, 364–368. [Google Scholar] [CrossRef]
- Li, G.; Lang, Y.; Yang, W.; Peng, P.; Wang, X. Source Contributions of PAHs and Toxicity in Reed Wetland Soils of Liaohe Estuary Using a CMB–TEQ Method. Sci. Total Environ. 2014, 490, 199–204. [Google Scholar] [CrossRef]
- United States Environmental Protection Agency (USEPA). Guidelines for Ecological Risk Assessment; Risk Assessment Forum, US Environmental Protection Agency: Washington, DC, USA, 1998; Volume 63, pp. 846–924.
- Chen, J.; Fan, B.; Li, J.; Wang, X.; Li, W.; Cui, L.; Liu, Z. Development of human health ambient water quality criteria of 12 polycyclic aromatic hydrocarbons (PAH) and risk assessment in China. Chemosphere 2020, 252, 126590. [Google Scholar] [CrossRef]
- Nisbet, I.C.; Lagoy, P.K. Toxic Equivalency Factors (TEFs) for Polycyclic Aromatic Hydrocarbons (PAHs). Regul. Toxicol. Pharmacol. 1992, 16, 290–300. [Google Scholar] [CrossRef]
- Kalf, D.F.; Crommentuijn, T.; van de Plassche, E.J. Environmental Quality Objectives for 10 Polycyclic Aromatic Hydrocarbons (PAHs). Ecotoxicol. Environ. Saf. 1997, 36, 89–97. [Google Scholar] [CrossRef] [PubMed]
- US EPA. Supplemental Guidance for Developing Soil Screening Levels for Superfund Sites; OSWER, 2002 [9355.4-24]; US EPA: Washington, DC, USA, 2002.
- Liu, G.R.; Peng, X.; Wang, R.K.; Tian, Y.Z.; Shi, G.L.; Wu, J.H.; Feng, Y.C. A New Receptor Model-Incremental Lifetime Cancer Risk Method to Quantify the Carcinogenic Risks Associated with Sources of Particle-Bound Polycyclic Aromatic Hydrocarbons from Chengdu in China. J. Hazard. Mater. 2015, 283, 462–468. [Google Scholar] [CrossRef] [PubMed]
- US EPA. Human Health Risk Assessment: Risk-Based Concentration Table; US EPA: Washington, DC, USA, 2015. Available online: https://www.epa.gov/sites/default/files/2015-10/documents/strap_2016_hhra_508.pdf (accessed on 6 March 2022).
- U.S. Environmental Protection Agency. Risk Assessment Guidance for Superfund Volume I: Human Health Evaluation Manual (Part E); U.S. Environmental Protection Agency: Washington, DC, USA, 2004.
- U.S. Environmental Protection Agency. Screening Level (RSL) for Chemical Contaminants at Superfund Sites; U.S. Environmental Protection Agency: Washington, DC, USA, 2011.
- U.S. Environmental Protection Agency. Human Health Evaluation Manual, Supplemental Guidance: Update of Standard Default Exposure Factors [Online]; U.S. Environmental Protection Agency, Office of Solid Waste and Emergency Response: Washington, DC, USA, 2014. Available online: https://nepis.epa.gov/Exe/ZyNET.exe/P100NQNA.TXT?ZyActionD=ZyDocument&Client=EPA&Index=2011+Thru+2015&Docs=&Query=&Time=&EndTime=&SearchMethod=1&TocRestrict=n&Toc=&TocEntry=&QField=&QFieldYear=&QFieldMonth=&QFieldDay=&IntQFieldOp=0&ExtQFieldOp=0&XmlQuery=&File=D%3A%5Czyfiles%5CIndex%20Data%5C11thru15%5CTxt%5C00000018%5CP100NQNA.txt&User=ANONYMOUS&Password=anonymous&SortMethod=h%7C-&MaximumDocuments=1&FuzzyDegree=0&ImageQuality=r75g8/r75g8/x150y150g16/i425&Display=hpfr&DefSeekPage=x&SearchBack=ZyActionL&Back=ZyActionS&BackDesc=Results%20page&MaximumPages=1&ZyEntry=1&SeekPage=x&ZyPURL (accessed on 6 March 2022).
- Yunker, M.B.; Macdonald, R.W.; Vingarzan, R.; Mitchell, R.H.; Goyette, D.; Sylvestre, S. PAHs in the Fraser River Basin: A Critical Appraisal of PAH Ratios as Indicators of PAH Source and Composition. Org. Geochem. 2002, 33, 489–515. [Google Scholar] [CrossRef]
- De La Torre-Roche, R.J.; Lee, W.-Y.; Campos-Díaz, S.I. Soil-Borne Polycyclic Aromatic Hydrocarbons in El Paso, Texas: Analysis of a Potential Problem in the United States/Mexico Border Region. J. Hazard. Mater. 2009, 163, 946–958. [Google Scholar] [CrossRef]
- Akyüz, M.; Çabuk, H. Gas–Particle Partitioning and Seasonal Variation of Polycyclic Aromatic Hydrocarbons in the Atmosphere of Zonguldak, Turkey. Sci. Total Environ. 2010, 408, 5550–5558. [Google Scholar] [CrossRef]
- Katsoyiannis, A.; Terzi, E.; Cai, Q.Y. On the Use of PAH Molecular Diagnostic Ratios in Sewage Sludge for the Understanding of the PAH Sources. Is This Use Appropriate? Chemosphere 2007, 69, 1337–1339. [Google Scholar] [CrossRef]
- Everitt, B.S. Cluster Analysis, 2nd ed.; Garner: London, UK, 1980. [Google Scholar]
- R Core Team. R: A Language and Environment for Statistical Computing [Online]; R Foundation for Statistical Computing: Vienna, Austria, 2020; Available online: http://www.R-project.org (accessed on 6 March 2022).
- RStudio Team. RStudio: Integrated Development for R [Online]; RStudio, PBC: Boston, MA, USA, 2020; Available online: http://www.rstudio.com (accessed on 6 March 2022).
- Golden Software, LLC. Surfer, Version 15; Golden Software, LLC: Golden, CO, USA, 2015.
- Jensen, H.; Reimann, C.; Finne, T.E.; Ottesen, R.T.; Arnoldussen, A. PAH-Concentrations and Compositions in the Top 2 cm of Forest Soils along a 120 km Long Transect through Agricultural Areas, Forests and the City of Oslo, Norway. Environ. Pollut. 2007, 145, 829–838. [Google Scholar] [CrossRef]
- Aichner, B.; Bussian, B.M.; Lehnik-Habrink, P.; Hein, S. Regionalized Concentrations and Fingerprints of Polycyclic Aromatic Hydrocarbons (PAHs) in German Forest Soils. Environ. Pollut. 2015, 203, 31–39. [Google Scholar] [CrossRef] [PubMed]
- Aichner, B.; Bussian, B.; Lehnik-Habrink, P.; Hein, S. Levels and Spatial Distribution of Persistent Organic Pollutants in the Environment: A Case Study of German Forest Soils. Environ. Sci. Technol. 2013, 47, 12703–12714. [Google Scholar] [CrossRef]
- Vane, C.H.; Kim, A.W.; Beriro, D.J.; Cave, M.R.; Knights, K.; Moss-Hayes, V.; Nathanail, P.C. Polycyclic Aromatic Hydrocarbons (PAH) and Polychlorinated Biphenyls (PCB) in Urban Soils of Greater London, UK. Appl. Geochem. 2014, 51, 303–314. [Google Scholar] [CrossRef]
- Łyszczarz, S.; Lasota, J.; Staszel, K.; Błońska, E. Effect of Forest and Agricultural Land Use on the Accumulation of Polycyclic Aromatic Hydrocarbons in Relation to Soil Properties and Possible Pollution Sources. For. Ecol. Manag. 2021, 490, 119105. [Google Scholar] [CrossRef]
- Łyszczarz, S.; Lasota, J.; Błońska, E. Polycyclic Aromatic Hydrocarbons (PAHs) Accumulation in Soil Horizons of Different Temperate Forest Stands. Land Degrad. Dev. 2021, 33, 945–959. [Google Scholar] [CrossRef]
- Bojakowska, I. Characteristic of Polycyclic Aromatic Hydrocarbons and Their Occurrence in Environment. Bull. Natl. Geol. Inst. 2003, 405, 5–28. [Google Scholar]
- Howsam, M.; Iones, K. Sources of PAHs in the Environment. In PAHs and Related Compounds: Chemistry; Neilson, A.H., Ed.; Springer: Berlin/Heidelberg, Germany, 1998; pp. 137–174. [Google Scholar]
- Maliszewska-Kordybach, B.; Smreczak, B.; Klimkowicz-Pawlas, A.; Terelak, H. Monitoring of the Total Content of Polycyclic Aromatic Hydrocarbons (PAHs) in Arable Soils in Poland. Chemosphere 2008, 73, 1284–1291. [Google Scholar] [CrossRef]
- Li, Y.; Wang, X.; Gong, P. Combined Risk Assessment Method Based on Spatial Interaction: A Case for Polycyclic Aromatic Hydrocarbons and Heavy Metals in Taihu Lake Sediments. J. Clean. Prod. 2021, 328, 129590. [Google Scholar] [CrossRef]
- Zhao, Y.; Li, J.; Qi, Y.; Guan, X.; Zhao, C.; Wang, H.; He, J. Distribution, Sources, and Ecological Risk Assessment of Polycyclic Aromatic Hydrocarbons (PAHs) in the Tidal Creek Water of Coastal Tidal Flats in the Yellow River Delta, China. Mar. Pollut. Bull. 2021, 173, 113110. [Google Scholar] [CrossRef]
- Health Canada. Federal Contaminated Site Risk Assessment in Canada Part I: Guidance on Human Health Preliminary Quantitative Risk Assessment (PQRA); Cat. H46-2/04-367E; Health Canada: Ottawa, ON, Canada, 2004; ISBN 0-662-38244-7. Available online: https://abandoned-mines.org/pdfs/RiskAssessmentWorkshop2008-pdfs/humanhealth-healthcanada.pdf (accessed on 6 March 2022).
- Kang, F.; Mao, X.; Wang, X.; Wang, J.; Yang, B.; Gao, Y. Sources and Health Risks of Polycyclic Aromatic Hydrocarbons during Haze Days in Eastern China: A 1-Year Case Study in Nanjing City. Ecotoxicol. Environ. Saf. 2017, 140, 76–83. [Google Scholar] [CrossRef] [PubMed]
- Han, F.; Guo, H.; Hu, J.; Zhang, J.; Ying, Q.; Zhang, H. Sources and Health Risks of Ambient Polycyclic Aromatic Hydrocarbons in China. Sci. Total Environ. 2020, 698, 134229. [Google Scholar] [CrossRef] [PubMed]
- Adly, H.M.; Saleh, S.A.K. Evaluation of Carcinogenic Polyaromatic Hydrocarbon Levels in Airborne Particulates Associated with Long-Term Exposure throughout the COVID-19 Pandemic in Makkah, Saudi Arabia. Int. J. Environ. Res. Public Health 2021, 18, 127451. [Google Scholar] [CrossRef] [PubMed]
- Anand, U.; Bianco, F.; Suresh, S.; Tripathi, V.; Núñez-Delgado, A.; Race, M. SARS-CoV-2 and Other Viruses in Soil: An Environmental Outlook. Environ. Res. 2021, 198, 111297. [Google Scholar] [CrossRef]


| Risk Level | TEQCARC/TEQQV |
|---|---|
| No risk | <0.1 |
| Low risk | 0.1–1 |
| Low-to-moderate risk | 1–10 |
| Moderate-to-high risk | 10–100 |
| High risk | ≥100 |
| PAHs | Lowest and Highest Standard Risk Values | |
|---|---|---|
| NCs | MPCs | |
| (ng∙kg−1) | ||
| Nft | 12 | 1200 |
| Ace | 0.7 | 70 |
| Flu | 0.7 | 70 |
| Phe | 3 | 300 |
| Ant | 0.7 | 70 |
| Flt | 3 | 300 |
| Pyr | 0.7 | 70 |
| BaA | 0.1 | 10 |
| Chr | 3.4 | 340 |
| BbF | 0.1 | 10 |
| BkF | 0.4 | 40 |
| BaP | 0.5 | 50 |
| DBahA | 0.5 | 50 |
| BghiP | 0.3 | 30 |
| IcdP | 0.4 | 40 |
| Risk Level | Individual PAHs | Risk Level | Total PAHs | ||
|---|---|---|---|---|---|
| RQ(NCs) | RQ(MPCs) | RQ(NCs) | RQ(MPCs) | ||
| No risk | <1 | No risk | =0 | ||
| Low risk | ≥1; <800 | =0 | |||
| Moderate risk | ≥1 | <1 | Moderate risk 1 | ≥800 | =0 |
| Moderate risk 2 | <800 | ≥1 | |||
| High risk | ≥1 | High risk | ≥800 | ≥1 | |
| Exposure Parameters | Units | Adults | Children |
|---|---|---|---|
| Ingestion Rate (IR) | mg·d−1 | 100 | 200 |
| Inhalation Rate (HR) | m3·d−1 | 20 | 10 |
| Exposure frequency (EF) | d·yr−1 | 350 | |
| Exposure duration (ED) | yr | 20 | 6 |
| Conversion factor (CF) | - | 10−6 | |
| Body weight (BW) | kg | 70 | 15 |
| Average time (AT) | d·yr−1 | 25,550 | |
| Surface area (SA) | cm2 | 5700 | 2800 |
| Skin adherence factor (AF) | mg·cm−2 | 0.07 | 0.2 |
| Particulate emission factor (PEF) | m3·kg−1 | 1.36 × 10⁹ | |
| Adsorption factor (ABS) | - | 0.13 | |
| CSFinhalation | mg·kg−1·d−1 | 3.85 | |
| CSFingestion | mg·kg−1·d−1 | 7.3 | |
| CSFdemal | mg·kg−1·d−1 | 25 | |
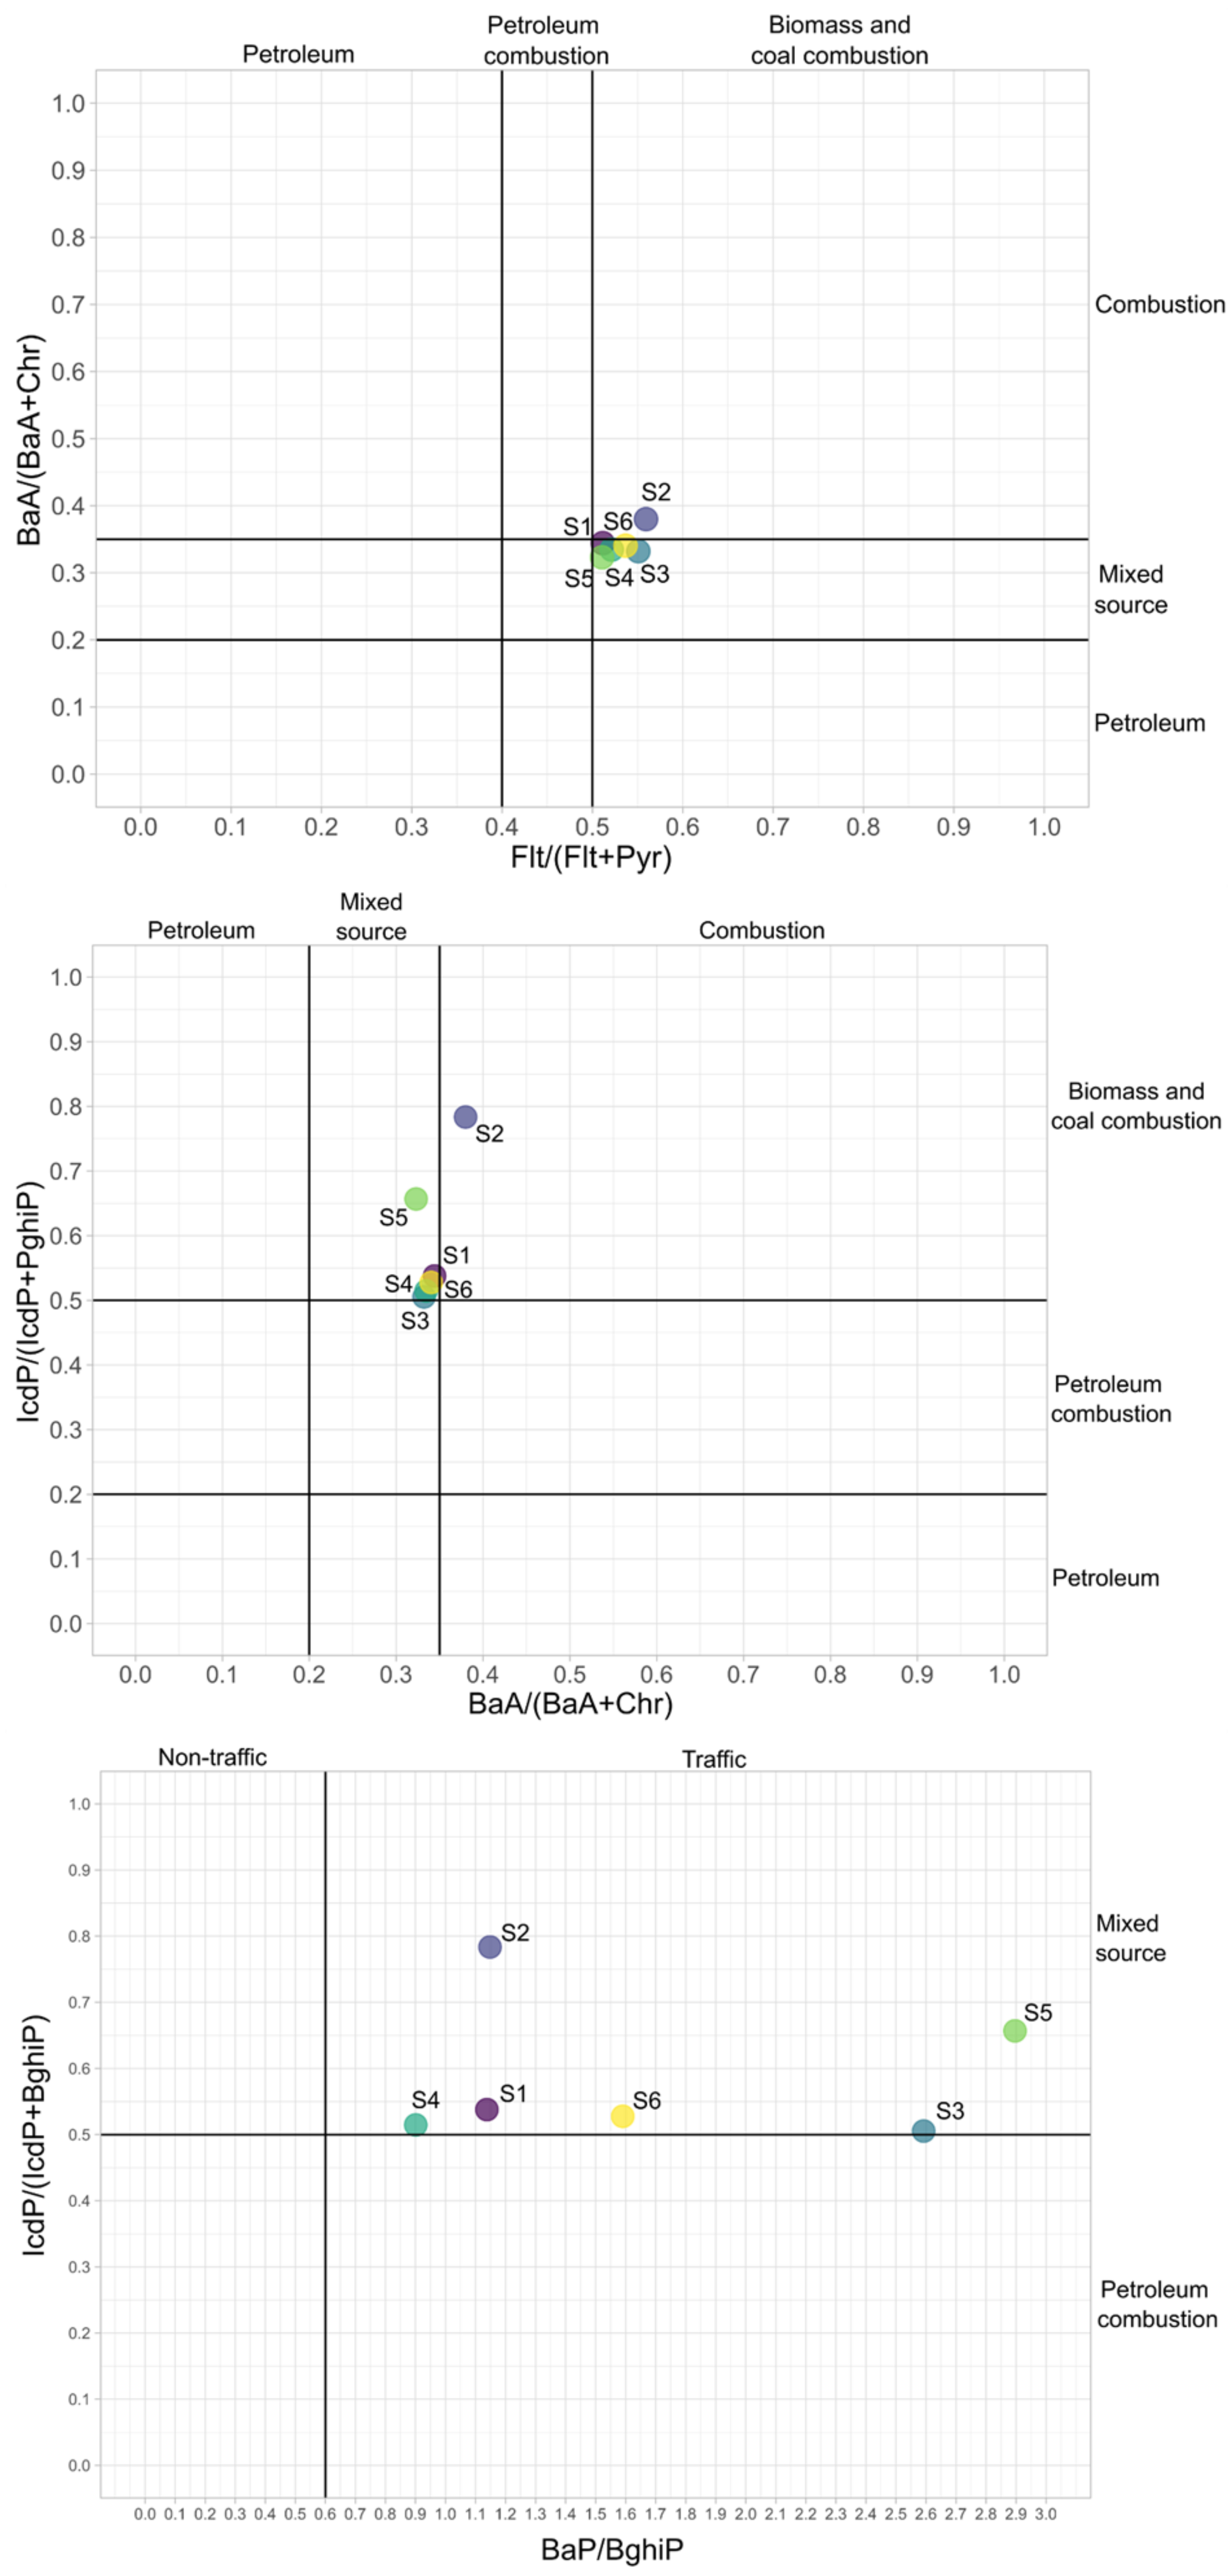
| PAH Ratios | Range | Source Type | References |
|---|---|---|---|
| Flt/(Flt + Pyr) | <0.4 | Petrogenic | [40] |
| 0.4–0.5 | Fossil fuel combustion | ||
| >0.5 | Grass, wood, coal combustion | ||
| BaA/(BaA + Chr) | 0.2–0.35 | Coal combustion | [39,41] |
| >0.35 | Vehicular emissions | ||
| <0.2 | Petrogenic | ||
| >0.35 | Combustion | ||
| IcdP/(IcdP + BghiP) | <0.2 | Petrogenic | [39] |
| 0.2–0.5 | Petroleum combustion | ||
| >0.5 | Grass, wood and coal combustion | ||
| BaP/BghiP | <0.6 | Non-traffic emissions | [42] |
| >0.6 | Traffic emissions |
| Molecular Weight | Number of Rings | Name of PAH | S1 | S2 | S3 | S4 | S5 | S6 |
|---|---|---|---|---|---|---|---|---|
| LMW | 2-rings | Nft | - | 1.82 ± 0.00 b | 14.66 ± 6.33 a | - | - | - |
| 3-rings | Ace | 2.60 ± 1.97 a | 3.81 ± 2.73 a | - | 0.82 ± 0.50 b | 3.12 ± 1.21 a | 0.87 ± 0.18 b | |
| Flu | 79.56 ± 51.55 ab | 100.70 ± 142.99 a | 43.55 ± 38.15 b | - | - | - | ||
| Phe | 51.36 ± 40.39 a | 23.78 ± 19.88 ab | 15.13 ± 7.50 bc | 6.23 ± 1.58 c | 37.55 ± 3.03 a | 9.52 ± 2.77 c | ||
| Ant | - | 51.44 ± 44.35 | - | - | - | - | ||
| 4-rings | Flt | 88.51 ± 68.40 a | 82.37 ± 56.05 a | 61.74 ± 53.06 ab | 24.04 ± 10.15 b | 61.17 ± 19.69 ab | 19.45 ± 7.44 b | |
| Pyr | 84.53 ± 61.09 a | 64.89 ± 37.90 ab | 50.34 ± 12.54 ab | 21.91 ± 9.08 b | 58.61 ± 19.56 ab | 16.79 ± 9.50 b | ||
| BaA | 52.28 ± 37.59 a | 41.13 ± 30.40 a | 19.80 ± 8.71 ab | 10.23 ± 4.80 b | 26.13 ± 7.57 ab | 12.12 ± 3.49 b | ||
| Chr | 99.58 ± 78.96 a | 67.12 ± 17.13 b | 39.81 ± 12.16 bc | 19.26 ± 7.99 c | 54.75 ± 14.72 b | 23.48 ± 1.52 c | ||
| HMW | 5-rings | BbF | 66.80 ± 57.72 a | 46.67 ± 9.37 b | 54.52 ± 46.08 ab | 20.23 ± 10.69 c | 34.85 ± 8.70 bc | 20.99 ± 3.27 c |
| BkF | 26.44 ± 21.80 a | 16.38 ± 4.11 ab | 17.99 ± 12.90 ab | 7.20 ± 3.77 b | 4.57 ± 1.01 b | 7.15 ± 0.65 b | ||
| BaP | 35.74 ± 27.75 b | 24.03 ± 6.10 bc | 113.62 ± 193.92 a | 9.91 ± 5.77 c | 28.82 ± 10.84 b | 11.23 ± 0.62 c | ||
| DBahA | 8.71 ± 7.05 b | 16.12 ± 10.00 a | - | - | 0.53 ± 0.16 | - | ||
| 6-rings | BghiP | 31.41 ± 33.94 a | 20.93 ± 6.14 ab | 43.83 ± 37.37 a | 8.53 ± 4.94 b | 9.95 ± 2.38 b | 7.06 ± 3.07 b | |
| IcdP | 36.55 ± 33.36 ab | 75.77 ± 143.10 a | 44.78 ± 40.21 ab | 9.06 ± 5.26 c | 19.05 ± 5.36 b | 7.89 ± 2.90 c | ||
| ∑ | 52.76 a | 47.13 a | 44.67 a | 12.49 b | 28.26 ab | 12.41 b |
Disclaimer/Publisher’s Note: The statements, opinions and data contained in all publications are solely those of the individual author(s) and contributor(s) and not of MDPI and/or the editor(s). MDPI and/or the editor(s) disclaim responsibility for any injury to people or property resulting from any ideas, methods, instructions or products referred to in the content. |
© 2024 by the authors. Licensee MDPI, Basel, Switzerland. This article is an open access article distributed under the terms and conditions of the Creative Commons Attribution (CC BY) license (https://creativecommons.org/licenses/by/4.0/).
Share and Cite
Łyszczarz, S.; Lasota, J.; Błońska, E. Ecological Risk Assessment, Distribution and Source of Polycyclic Aromatic Hydrocarbons in the Soil of Urban and Suburban Forest Areas of Southern Poland. Forests 2024, 15, 595. https://doi.org/10.3390/f15040595
Łyszczarz S, Lasota J, Błońska E. Ecological Risk Assessment, Distribution and Source of Polycyclic Aromatic Hydrocarbons in the Soil of Urban and Suburban Forest Areas of Southern Poland. Forests. 2024; 15(4):595. https://doi.org/10.3390/f15040595
Chicago/Turabian StyleŁyszczarz, Stanisław, Jarosław Lasota, and Ewa Błońska. 2024. "Ecological Risk Assessment, Distribution and Source of Polycyclic Aromatic Hydrocarbons in the Soil of Urban and Suburban Forest Areas of Southern Poland" Forests 15, no. 4: 595. https://doi.org/10.3390/f15040595
APA StyleŁyszczarz, S., Lasota, J., & Błońska, E. (2024). Ecological Risk Assessment, Distribution and Source of Polycyclic Aromatic Hydrocarbons in the Soil of Urban and Suburban Forest Areas of Southern Poland. Forests, 15(4), 595. https://doi.org/10.3390/f15040595