Article

Dynamic Evaluation and Forecasting Analysis of Touristic Ecological Carrying Capacity of Forest Parks in China

School of Finance and Economics, Jiangsu University, 301 Xuefu Road, Zhenjiang 212013, China
*
Author to whom correspondence should be addressed.
Forests 2024, 15(1), 38; https://doi.org/10.3390/f15010038
Submission received: 11 November 2023 / Revised: 29 November 2023 / Accepted: 21 December 2023 / Published: 23 December 2023
(This article belongs to the Section Forest Economics, Policy, and Social Science)

Abstract

:
Forest park tourism ecological security is the cornerstone of ensuring ecological tourism safety. Delineating the ecological carrying capacity within forest parks is crucial for enhancing the security of forest tourism resources. This study utilizes statistical data from China’s forest parks spanning 2004 to 2019, employing methodologies to comprehensively depict the spatiotemporal dynamic characteristics of forest park tourism ecology in China. Subsequently, this research forecasts the prospective trajectory of forest park tourism ecology in China from 2020 to 2029. The research findings reveal that China’s forest park tourism ecological footprint exhibits oscillating characteristics, while the overall touristic ecological carrying capacity shows a sustained upward trend. However, a significant portion of regions experience deficits in tourism ecology. Notably, the coldspot regions with ecological security features demonstrate relative stability, while the hotspot areas gradually transition from inland to eastern coastal regions. Spatially and temporally, the disparities in touristic ecological profit and deficit depict a “U”-shaped distribution, more pronounced along the east–west axis than the north–south orientation. The migratory shift in the touristic ecological surplus and deficit center gravitates towards the southwest, demonstrating a fluctuating trend characterized by varying migration speeds. The discernible difference between the east and west concerning touristic ecological profit and deficit amplifies the likelihood of imbalance, surpassing disparities between the north and south. Projections suggest a deepening forest park tourism ecological deficit in China from 2020 to 2029, particularly accentuating the unsustainable development of forest park resources in economically developed regions. Through this study, a more comprehensive understanding of the current status and changing trends in the ecological carrying capacity of forest park tourism can be obtained. This research provides theoretical and practical support to promote sustainable tourism development and establishes a solid foundation for the ecological security of future forest park tourism.

1. Introduction

Forest parks, as a vital component of the modern forestry industry, actively engage in forest tourism, achieving not only economic and ecological balance under the “forest + tourism” model but also holding significant implications for optimizing the forestry industry structure and realizing the national strategy of “peak carbon emissions and carbon neutrality”. As tourist destinations, forest parks provide abundant resources for eco-tourism, attracting many visitors and injecting vitality into regional economies [1]. Simultaneously, these parks safeguard habitats for numerous endangered species, maintaining ecosystem stability and biodiversity, playing a pivotal role in wildlife conservation [2]. Functioning as carbon sinks, they absorb carbon dioxide and store it within trees and soil, which is crucial in mitigating climate change [3,4]. This role significantly contributes to achieving carbon neutrality and combating global warming.
Forest resources are essential for providing tourism services and serve as assets for ecological conservation [5,6]. They significantly contribute to ecosystem services in rural areas with relatively low population density and urban areas with higher population density [7,8]. Forests constitute a crucial component of ecosystems, playing a vital role in maintaining Earth’s ecological balance [9]. They contribute to air purification [10,11], water resource protection [12], soil conservation [13], and prevention of natural disasters [14] while serving as habitats for numerous flora and fauna. Forests are crucial in climate regulation, making them pivotal in mitigating global warming [15].
China’s current development of forest parks has achieved significant progress under government support and guidance. The Chinese government highly prioritizes the establishment and development of forest parks. Under legal frameworks like the “Forest Law of the People’s Republic of China” and the “Regulations on the Management of National Nature Reserves”, policies aimed at environmental protection and sustainable development have been proposed to support forest park planning, construction, and management. By 2019, China had constructed a network of 897 national forest parks, marking the largest-ever establishment of forest park networks in Chinese history [16]. The State Forestry and Grassland Administration aims to accelerate the construction of China’s forest park network by enhancing policy support, development planning guidance, and implementation.
However, the Chinese government currently faces challenges in forest park management. Some regions experience excessive exploitation of forest resources, leading to human-induced forest fragmentation, degradation, and reduced functionality [17]. Urban forests suffer from rapid encroachment due to the swift pace of urbanization and weak regulatory frameworks. These urban forests are affected by rapid material development and unauthorized activities of urban residents [18,19]. Pressure from land development, construction, and pollution around urban areas lead to decreased forest cover, degradation, and diminished ecological functions. While China’s forest park development has progressed with government support, challenges such as safety concerns, forest fragmentation, and encroachment in urban forests persist. Strengthening management, protecting the environment, and promoting ecological restoration through government frameworks and policies remain crucial measures to address these challenges.
The construction of forest parks requires ecological environment restoration, protection, and maintenance to ensure the effective supply of forest park tourism products [20]. Balancing the demand for forest tourism with the ecological conservation of forest parks is crucial in ensuring their sustainable development. Protecting the diversity of natural resource species within the carrying capacity of forest ecosystems is essential, ensuring a balanced ecological footprint and ecological carrying capacity [21,22]. This necessitates consideration of environmental protection, biodiversity preservation, provision of ecosystem services, and the formulation of appropriate policies and management measures to meet people’s natural needs while safeguarding nature. Forest parks are integral to natural ecosystems, and safeguarding their ecological environment is crucial for maintaining ecological balance. An excessive influx of tourists may lead to ecosystem disruption, damaging vegetation, wildlife habitats, geological structures, and water resources, and exacerbating land erosion issues. The construction of forest parks requires leveraging ecological environment restoration, protection, and maintenance to ensure the adequate provision of forest park tourism products [20]. Protecting forest parks entails safeguarding rare species, maintaining ecological balance, and ensuring the long-term stability of these ecosystems.
This study proposes a dynamic assessment method that integrates theories from various aspects, such as ecological footprint, carrying capacity, and spatial analysis, offering a more comprehensive perspective to evaluate the ecological impact of forest park tourism. This methodology might be innovative within the field of tourism ecology, providing a new approach to assessing the impact of tourism activities on ecosystems. Additionally, this research delves into the spatial distribution and pattern changes of ecological footprints in different regions of Chinese forest park tourism. Comparing and analyzing the ecological carrying capacity and footprints across diverse regions uncovers disparities in the ecological impacts of tourism among these areas. This novel in-depth spatial analysis contributes to a better understanding and management of ecological tourism resources. Furthermore, the study presents a forecast indicating a potential deepening of the ecological deficit in Chinese forest park tourism in the coming years, especially in economically developed regions. This predictive analysis offers crucial warnings for decisionmakers and managers, emphasizing balancing economic development and ecological conservation. These contributions demonstrate the novelty and originality of this research in terms of methodologies, profound analysis, and forecasting future trends. They provide a fresh perspective and guidance for the ecological management of forest park tourism.

2. Literature Review

It is necessary to maintain human tourism demand for forest ecological resources within a controllable range to realize the sustainable development of forest park tourism, not to break through the supply capacity of forest park tourism resources, not to jeopardize the ecological environment of forest parks, and to protect the diversity of natural resource species, rationally utilize tourism resources, and ensure the balance between the ecological footprint and the ecological carrying capacity under the carrying capacity of forest ecosystems [21,22]. In addition, the need for an equal distribution of benefits from the forest centered on forest fringe communities will help to minimize the annual conflicts that have come to characterize the parks and ensure sustainable forest resource management [23]. Therefore, forest park tourism development must be based on and guaranteed by ecological carrying capacity. The relationship between forest park tourism development and ecological carrying capacity must be grasped. The need to strengthen forest resilience and management is becoming increasingly urgent [24].
With the concern for biodiversity conservation and ecological sustainability, the traditional conservation management evaluation methods based on single elements such as timber production, stand structure, and forest area are no longer applicable [25]. Many scholars have attempted to construct models [25] and theories [7] capable of comprehensively evaluating the effectiveness of conservation management of natural ecosystems to address the fact that forest tourism development and ecosystem management exhibit a relative imbalance [26,27,28]. Spatial ecological niche suitability modeling (SNSM) [29], super SBM–Malmquist modeling [30], geographic information system (GIS) with hierarchical analysis (AHP) [31], the critical (Criteria Importance Through Intercriteria Correlation) method [32], and class-level pattern metrics for Landsat and Sentinel imagery [17] have all been utilized in the context of ecological distribution of forest parks and sensitivity measurements. In addition, monetary values [33], changes in forest harvesting [34], knowledge inputs [35], and increased visitor arrivals [36,37] have all been chosen to predict the future sustainable development of forest parks.
Eco-tourism is a potential lever for sustainable development [38,39], but there is a lack of common standards and methodologies to manage and monitor the impacts of identified packages on natural resources and local communities [35]. With the increasing effects of human activities on nature reserve ecosystems, there is an urgent need to assess the ecological carrying capacity (ECC) of nature reserves and use it as a benchmark for evaluating regional sustainability [40]. Considered a critical link between natural ecosystems and human systems, ecological carrying capacity (ECC) has gradually become an essential tool for interdisciplinary research in ecology, resource science, and environmental science, as well as for regional sustainability studies [41,42,43,44].
Compared with ecological carrying capacity, ecological footprint modeling is more capable of evaluating the sustainability of regional development [45]. The ecological footprint is an operational quantitative method for converting human consumption of biological resources and emissions of waste into biologically productive land areas. As ecological footprint analysis emphasizes, energy and material use associated with tourism and local activities can erode the natural capital if it exceeds the biologically supportive capacity of the area. Using the ecological footprint as a dynamic and iterative process of management feedback allows us to more accurately view sustainability as a transition and a journey rather than a static destination that must be reached for management [46,47]. Calculating the ecological footprint at the regional scale is a crucial step for local policymakers to develop relevant and feasible policies to guide sustainable regional development [48], and thus the ecological footprint can effectively be used to analyze the ecological sustainability of tourism environments in poor areas [47,49,50], and strategies can be proposed for sustainable tourism development [48,51].
In summary, there has been considerable research within the academic community regarding the ecological development of forest parks and ecological tourism, particularly concerning ecological footprint and carrying capacity. However, comprehensive studies on Chinese forest parks’ ecological footprint and carrying capacity remain scarce. Many existing studies lack a comprehensive perspective, have imperfect indicator systems, employ singular research methods, and thus yield incomplete results. Most studies rely on historical data for empirical analysis, often neglecting systematic predictions of the future development trends in the ecological carrying capacity of Chinese forest parks. Additionally, there is a lack of research in the existing literature on the spatial migration trajectory of the ecological carrying capacity of Chinese forest parks. Therefore, this paper focuses on Chinese forest parks, employing an improved ecological footprint model, hotspot analysis, trend surface analysis, standard deviation ellipse analysis, and grey prediction model to explore the spatiotemporal evolution characteristics of the ecological carrying capacity of Chinese forest park tourism and predict its future development trends. The objective is to provide realistic insights into the production capacity of Chinese forest park tourism and the ecological safety status of forest parks. This study offers a scientific basis for effectively preventing and controlling forest degradation, rationalizing forest resource allocation, and implementing forest protection projects. Moreover, it endeavors to support the sustainable development and utilization of forest park resources, ensuring the safety of national forest parks by providing scientific references.

3. Methods

3.1. Ecological Footprint Model

3.1.1. Ecological Footprint

Ecological footprint (EF) measures the amount of Earth’s resources used by a person or a population that lives in a particular way. The formula is shown in Equation (1) [52].
E F = N × e f = N × r × P + I E / Y × 1 / N
In Equation (1), EF is the ecological footprint, ef is the ecological footprint per capita, N is the total number of people traveling to forest parks in China’s provinces and cities, P is the total number of people traveling to forest parks in China’s provinces, I is the total number of people traveling to parks in China’s provinces, E is the total number of people traveling to forest parks in China’s provinces, r is the equivalence factor, and Y is the average number of people traveling to forest parks nationwide in the area of one unit of forest park tourism. It is the ratio of the total number of people traveling to forest parks nationwide to the size of forest parks.

3.1.2. Ecological Capacity

Ecological capacity (EC) refers to the intensity with which an ecosystem can withstand the biological resources that humans need to consume and absorb the wastes produced by humans without destroying the productivity and functional integrity of the ecosystem [53]. It is expressed in terms of the total area of biologically productive land. The formula is shown in Equation (2).
E C = N × e c = N × A × r × y
In Equation (2), EC is the ecological carrying capacity, ec is the ecological carrying capacity per capita, N is the total number of tourists in forest parks in each province and city in China, A is the per capita area of tourists in forest parks in each province in China, which is the ratio of the total area of forest parks in each province in China to the total number of tourists in forest parks, r is the equivalence factor, and y is the factor for the capacity of CO2 absorption of the unit of forest land area.

3.1.3. Ecological Surplus and Deficit

Ecological surplus (ES) and ecological deficit (ED) refer to the difference between the ecological carrying capacity and the ecological footprint of a region, which can visually and quantitatively reflect the sustainable development status of the region [54]. If the difference between the ecological carrying capacity and the ecological footprint is greater than zero, the region is said to be in a state of ecological surplus, which also indicates that the region is in sustainable development; conversely, the region is in ecological deficit and unsustainable development, as shown in Equations (3) and (4).
E S = E C E F > 0
E D = E C E F < 0
In Equations (3) and (4), ES is ecological surplus, EC is ecological carrying capacity, EF is ecological footprint, and ED is the ecological deficit.

3.1.4. Ecological Footprint Index

Ecological footprint index (EFI), as an evaluation index of sustainable development of a region, refers to the difference between the regional ecological footprint and ecological carrying capacity and the ratio of ecological carrying capacity. The residents’ touristic ecological footprint (EF) and ecological footprint area are smaller than the ecological capacity. The formed EF is also within the ecological capacity range, indicating that the social and economic development of the tourism area is in a sustainable development state [55], as shown in Equation (5). Liu [56] developed the corresponding judging criteria, as shown in Table 1.
E F I = E C E F / E C
In Equation (5), EFI is the ecological footprint index, EC is the ecological carrying capacity, and EF is the ecological footprint.

3.1.5. Ecological Tension Index

The ecological tension index (ETI), an evaluation index of ecological security in a region, refers to the ratio of the ecological footprint per capita to the ecological carrying capacity per capita in the region and has been divided into corresponding index-level criteria [57] (Table 2). The specific formula is shown in Equation (6).
E T I = e f / e c
In Equation (6), ETI is the ecological pressure index, ef is the per capita ecological footprint, and ec is the per capita ecological carrying capacity.

3.2. Hotspot Analysis

The Getis–Ord Gi* model allows for the spatial division of the study object’s hot- and coldspot areas [58,59]. The hotspot analysis method explores geographic attributes’ local spatial clustering characteristics and determines whether a high- or low-value aggregation is commonly used to study regional spatial patterns’ evolution. Its formula is
G i = i = 1 n j = 1 n W i j d X i X j i = 1 n j = 1 n X i X j i j , Z G i = G i E G i V a r G i G i = i = 1 n j = 1 n W i j d X i X j / i = 1 n j = 1 n X i X j
where xi and xj denote the ecological development level of forest park tourism in areas i and j, Gi is the statistical score, and Wij is its spatial weight, 1 if it is neighboring and 0 if it is not neighboring. E(Gi) and Var(Gi) are the mathematical expectation and variance. If the value of Z(Gi) is positive and significant, the region is a hotspot; if the value of Z(Gi) is negative and significant, the region is a coldspot.

3.3. Trend Surface Analysis

The trend surface analysis method can visually present the spatial distribution law and the trend in research objects with a large spatial span, which has significant application value in spatial analysis [60]. Its essence is using the least squares method to fit a binary nonlinear function and to show the trend in geographic elements in the geographical space to simulate the spatial distribution pattern of geographic elements through regression analysis. This paper uses trend surface analysis to reveal the spatial differentiation law of tourism ecological pressure and ecological security in China’s forest parks.

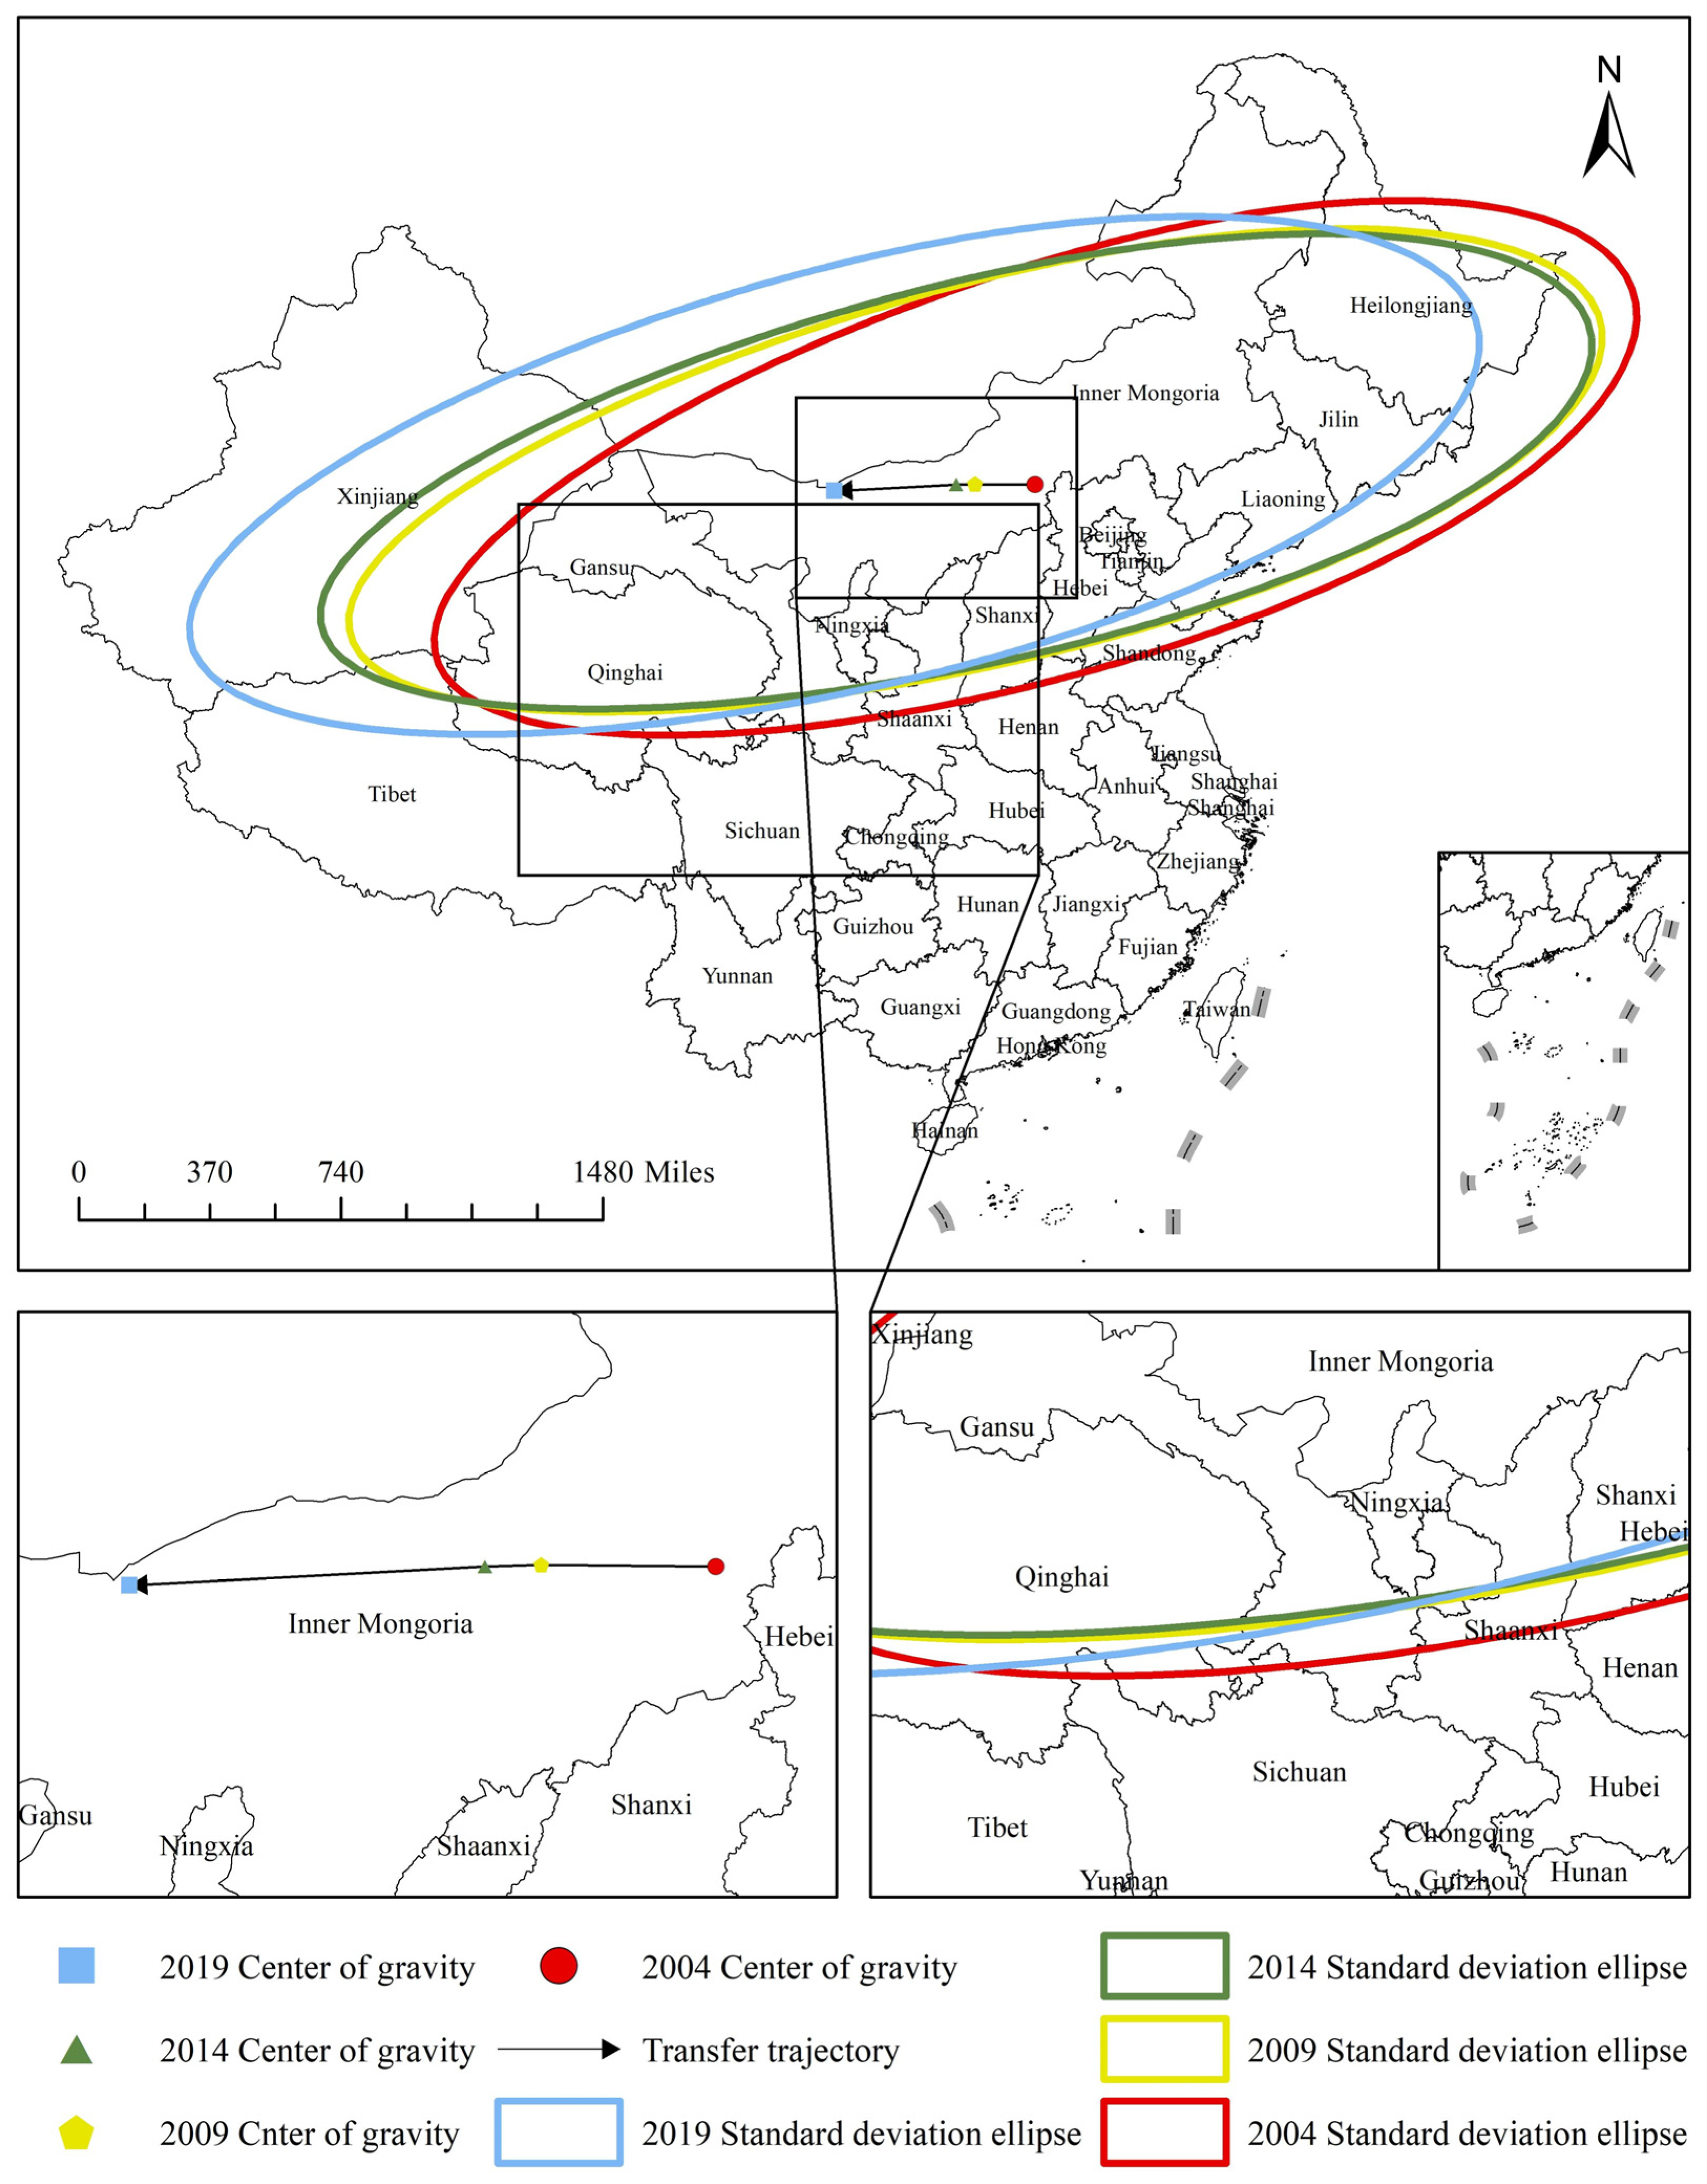
3.4. The Standard Deviation Ellipse

The standard deviation ellipse can reveal the research object’s spatial distribution direction, aggregation, and trend characteristics. It contains the mean center, principal axis, auxiliary axis, and azimuth [61]. The principal axis (long semi-axis) and auxiliary axis (short semi-axis) of the ellipse represent the direction and range of the research object. The longer the principal axis, the more pronounced the direction of the research object; the shorter the auxiliary axis, the more pronounced the centripetal force of the research object. The flatness of the ellipse represents the spatial distribution pattern, which is calculated from the long and short semi-axes. The more significant the difference between the values of the long and short semi-axes, the larger the flatness. The center of the ellipse represents the center of gravity of the spatial distribution.

3.5. The Grey Prediction Model

Grey prediction GM(1,1) is a kind of model with strong universality in grey series prediction. The essence of the grey GM(1,1) model is to convert the original time series to generate a new series and then build a model to predict the future development trend in the target object from the sorted data. This paper takes the estimation results of the touristic ecological footprint and carrying capacity per capita of forest parks in China from 2004 to 2019 as the original data (simulation period). It evaluates the ecological carrying capacity and sustainable development capacity of forest parks in China in the next ten years based on the grey prediction GM(1,1) model.

4. Data

This section describes the basic situation of China’s forest parks in each province and city. Then, data including the total area of forest parks nationwide, the total number of tourists in forest parks, the total number of overseas tourists in forest parks, the total area of forest parks in China’s provinces, the number of tourists visiting forest parks in China, and the number of overseas tourists in regions are considered. The data were analyzed with descriptive statistics.

4.1. Data Sources

The research data of national forest parks and forest parks of various provinces in this paper are all from the China Forestry Statistical Yearbook (2004–2017) and China Forestry and Grassland Statistical Yearbook (2018–2019). In selecting the equivalence factor and yield factor, this paper adopts the equivalence factor and yield factor based on the net primary productivity of vegetation [62,63]. Since the data on the number of Chinese residents visiting foreign forest parks are complex to calculate and the amount is small, they will not affect the results, so they are not included in the calculation.

4.2. Descriptive Statistics

This paper selects the data from 2004–2019 and analyzes them with descriptive statistics. The results are shown in Table 3. The total area of China’s forest parks from 2004 to 2019 showed a relatively significant increase, with an annual average of 17,203,052.77 hm2, and the total area of national forest parks showed a relatively small fluctuation and reached a peak of 144,105,020.00 hm2 in 2017. Moreover, the number of forest park tourists increased yearly, and the growth rate from 2004 to 2019 was more than 618.10%. The total number of forest park tourists in China during the 16 years averaged 551,226,200 person-times per year, of which the number of foreign tourists averaged 11,849,700 person-times per year. Overall, forest park tourism in China has received public attention, while the development and exploitation of forest park tourism have continued to expand.

5. Temporal and Spatial Evolution of Tourism Ecology in China’s Forest Parks

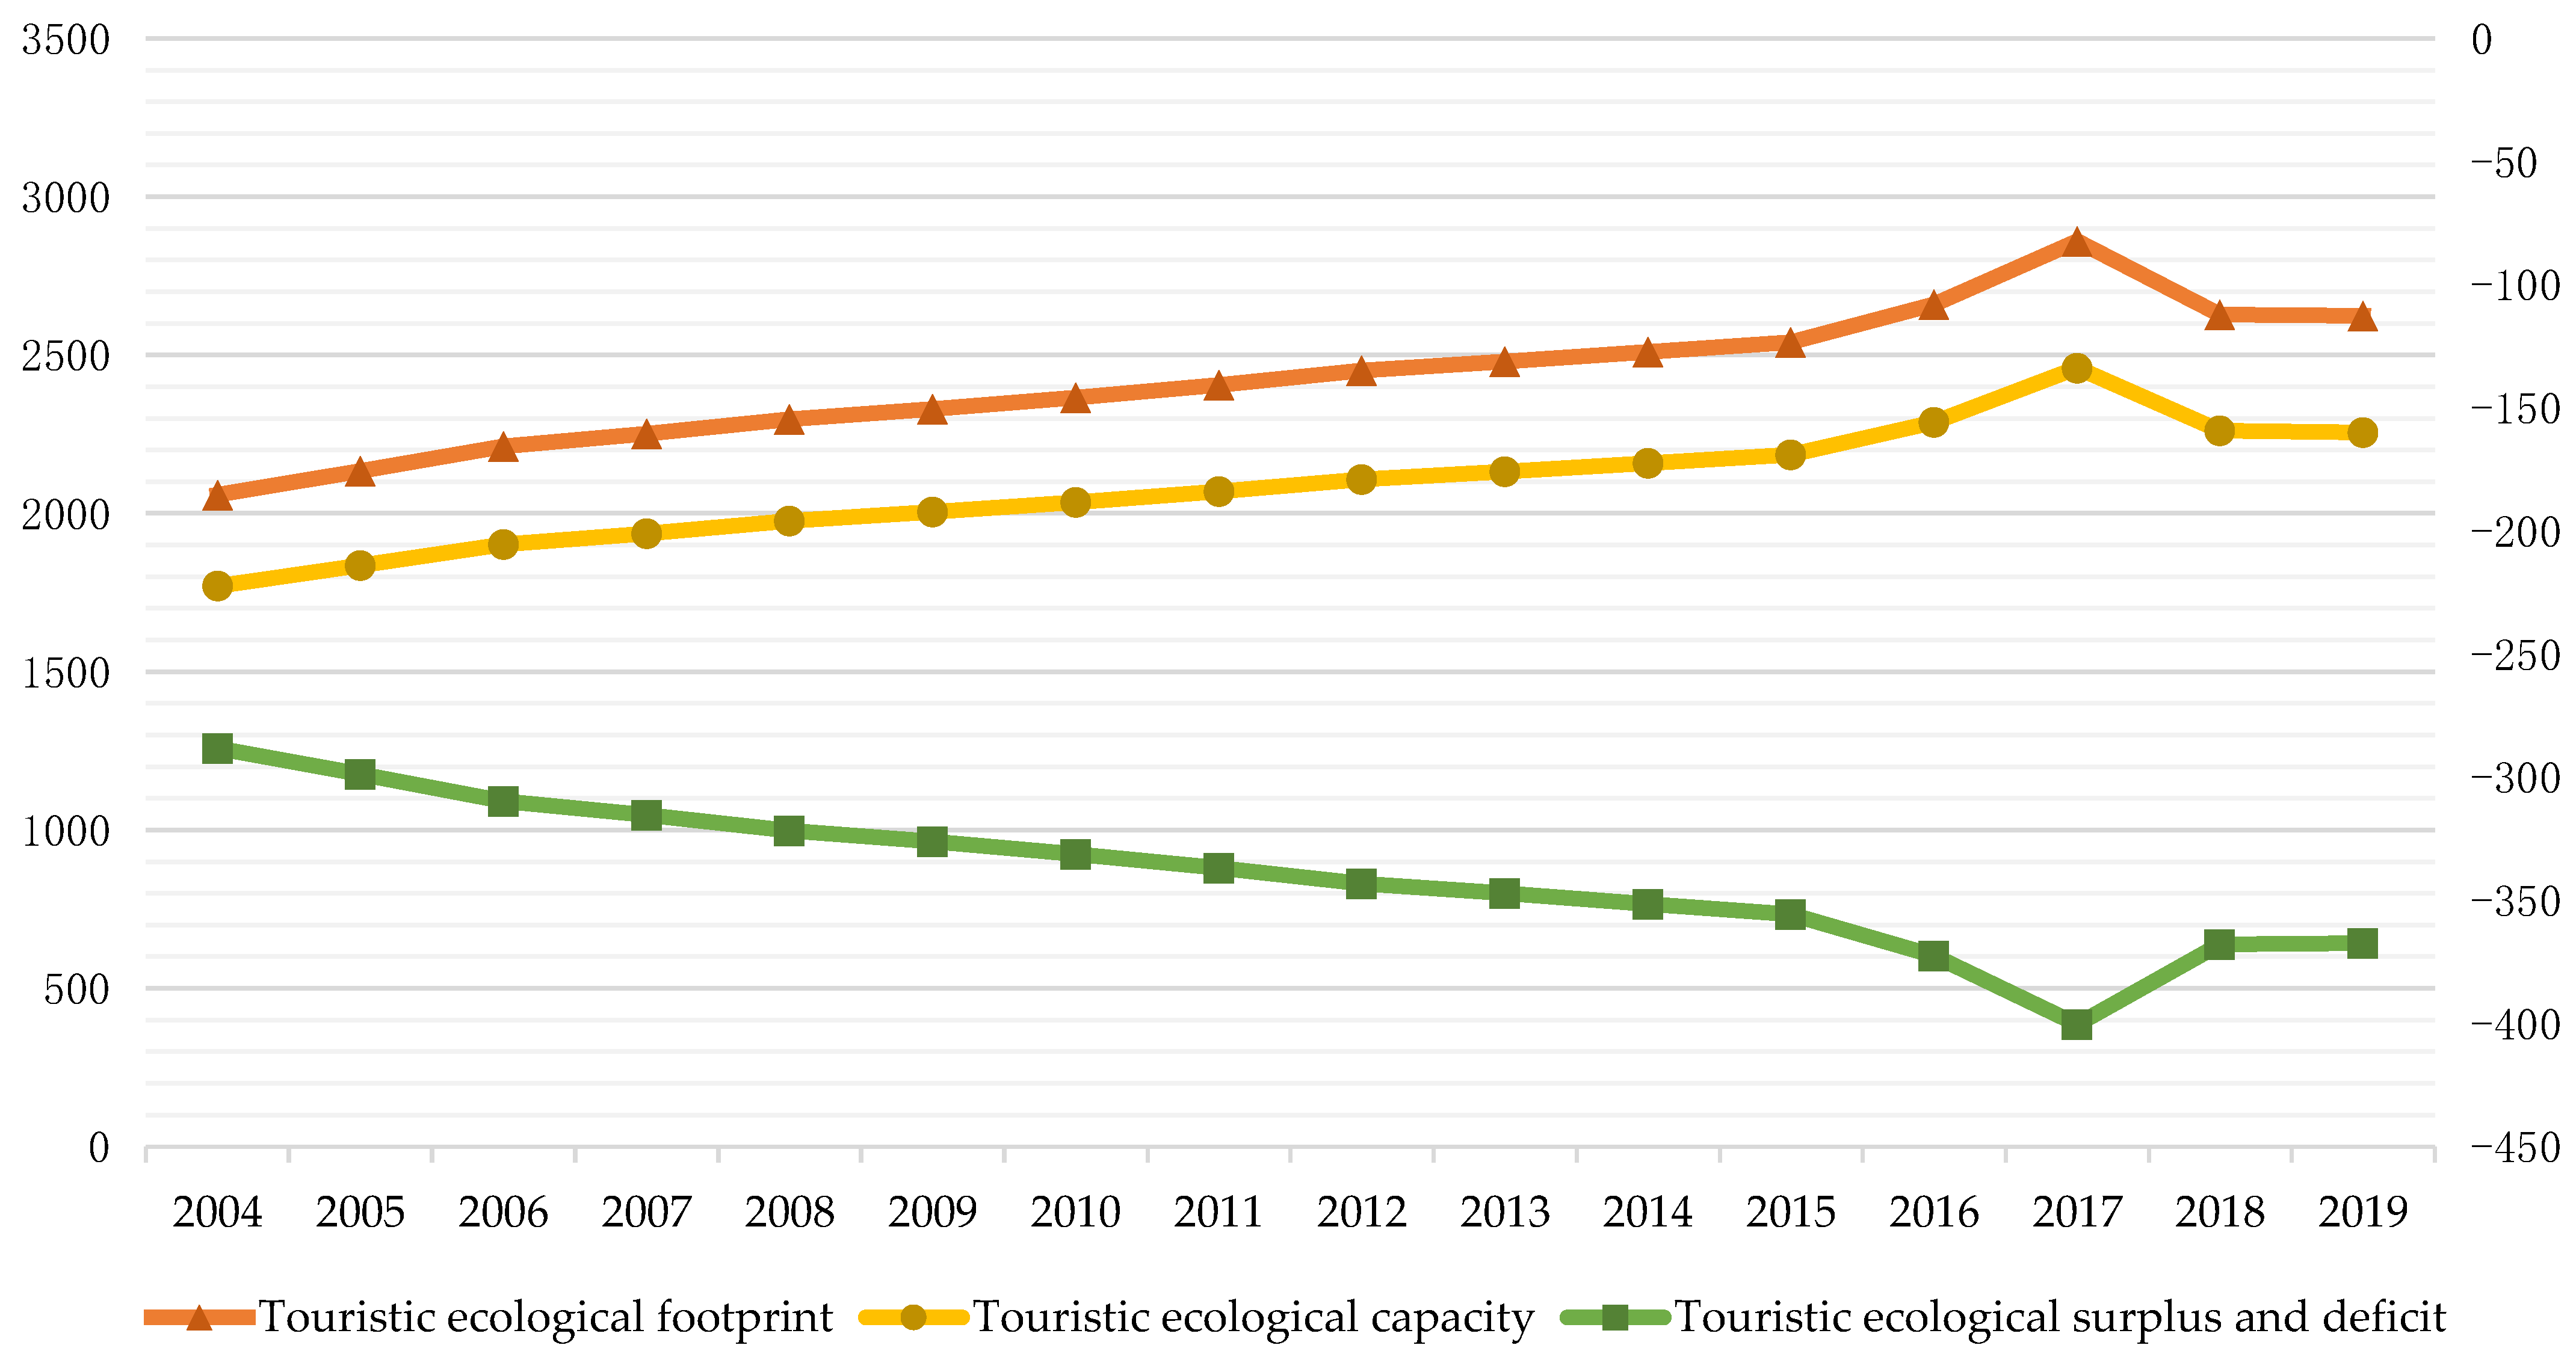
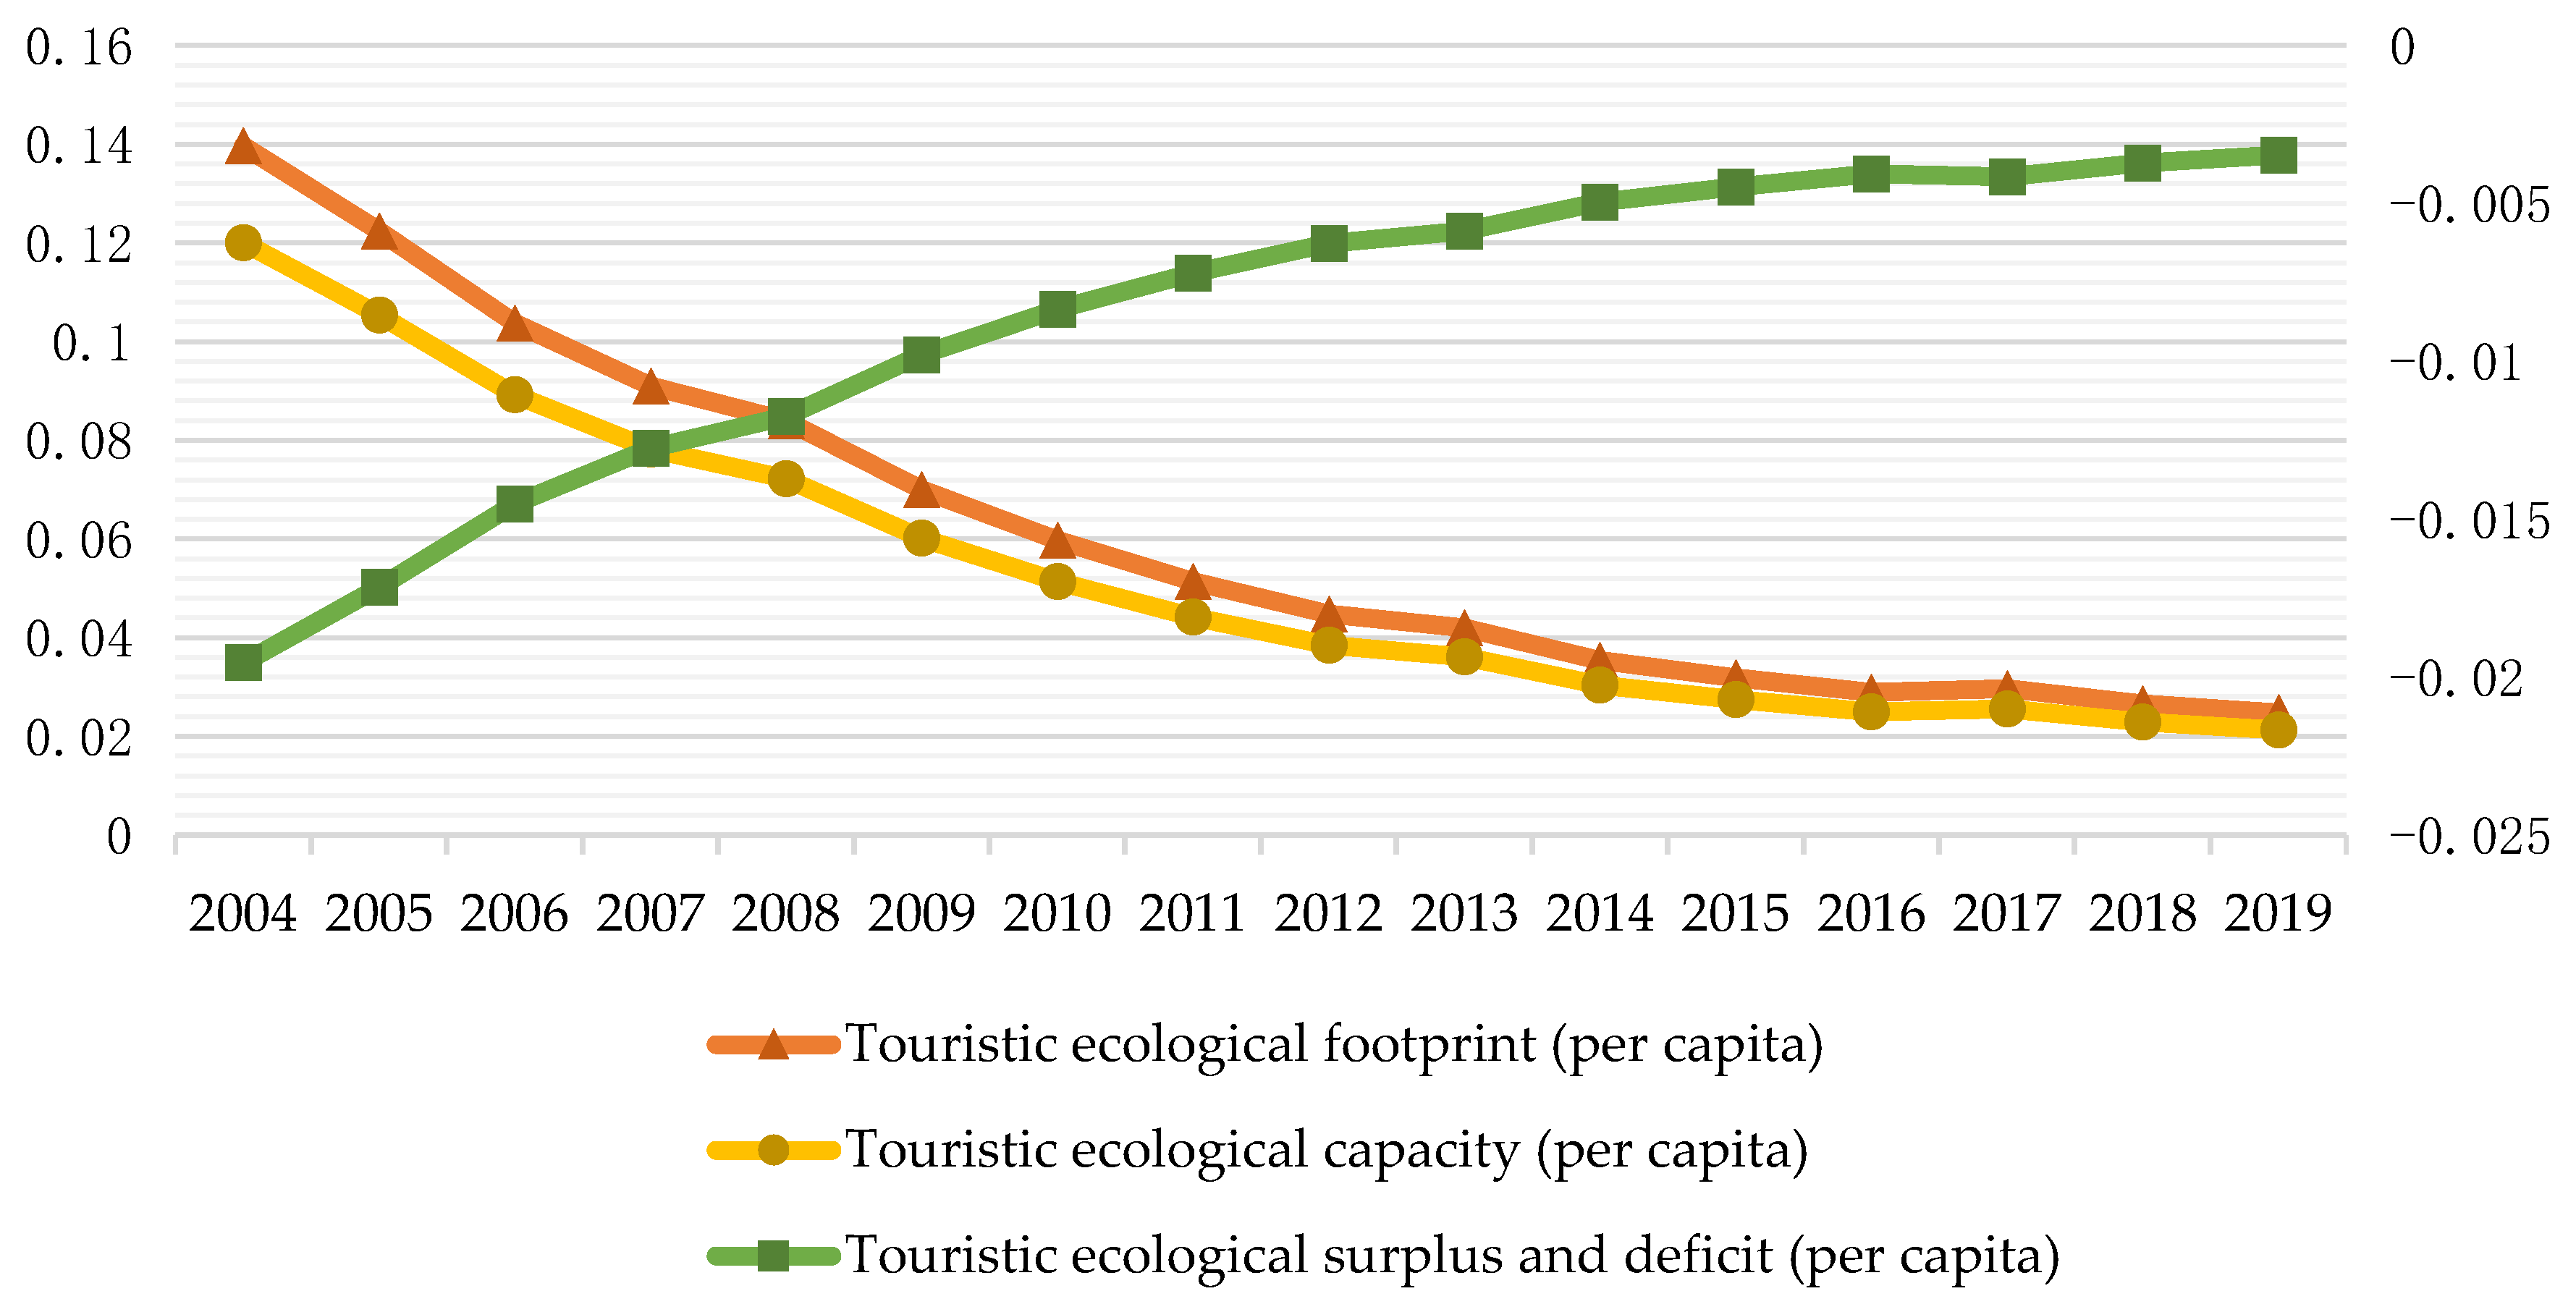
5.1. Analysis of the Time Evolution of the Ecological Status of Forest Parks in China

The touristic ecological footprint in China’s forest parks has been roughly on the rise, with the total touristic ecological footprint in forest parks rising from 2058.8617 × 104 ha in 2004 to 2859.7479 × 104 ha in 2017 (Table 4), reaching the peak of growth, with a significant growth trend (Figure 1), and then experiencing a slight decline. The reason for this trend is that the process of change in the touristic ecological footprint of China’s forest parks is closely related to China’s forest protection, China’s forest park construction, and the status of consumer tourism preferences. Tourism activities such as health preservation in the forest, nature education, snow and ice tourism, and forest trails have attracted widespread attention. The large-scale development of forest park tourism activities will inevitably harm the ecological environment of forest parks. An increase in the touristic ecological footprint of forest parks often accompanies an increase in tourists. Forest parks contain many forests, woodlands, and other natural resources. However, the increase in visitors leads to the construction of infrastructure projects, indirectly reflecting the increased demand capacity of the population for forest resources and the increased degree of occupation. All these factors contribute to further expansion of the touristic ecological footprint of forest parks. However, the per capita ecological footprint of China’s forest parks decreased from 0.1396 hectares per person in 2004 to 0.0248 hectares per person in 2019, a decrease of 82.23%, which may be attributed to the large gap between the speed of infrastructure construction in scenic spots and the growth rate of tourists, such as hotels, amusement, and other facilities, which have not increased, while the number of tourists has increased dramatically. Thus, the ecological footprint occupied by each tourist has decreased on average. Therefore, the ecological footprint occupied by each tourist has been reduced. Thus, the evolution of the per capita ecological footprint of forest parks is opposite to the total ecological footprint in the region.
The touristic carrying capacity of forest parks in China initially increased and then decreased. The evolution process of the touristic carrying capacity of forest parks per capita was roughly opposite to that of total forest parks (Figure 1 and Figure 2). The tourism eco-carrying capacity of China’s forest parks showed different changes in 2017. From 2004 to 2017, the touristic carrying capacity of total forest parks showed a gentle growth trend, with an increase rate of 38.90%. Moreover, 2017–2019 showed a significant downward trend, decreasing 8.26%. According to the connotation and calculation formula of ecological carrying capacity, changes in forest area and tourist numbers will cause changes in the direction of forest parks’ touristic ecological carrying capacity. In the short term, the expansion effect of the forest area of forest parks has a positive promoting effect on the development of the forest industry. However, in the long run, the highly concentrated production behavior breaks the appropriate balance of the forest tourism ecosystem. It leads to the degradation of forest park forest carrying advantage potential, resulting in a decline in national forest park touristic ecological carrying capacity.
A comparison of the touristic ecological footprint and ecological carrying capacity of forest parks shows that China’s forest parks are in a state of ecological deficit and can be divided into two phases. From 2004 to 2017, forest parks’ touristic ecological footprint and carrying capacity showed an upward trend simultaneously. In this stage, forest tourism was rapidly developing, with 1771 forest parks created nationwide, an increase of 97.91%. The rapid development of forest tourism in the carrying region led to a substantial reduction in forest resources, forest economic restructuring, and a sharp decrease in forest parks’ overall touristic ecological surplus space. Forest parks’ touristic ecological footprint and carrying capacity in 2017–2019 turned to a downward trend simultaneously. This result is mainly because forest parks reached the steady development and enhancement stage, the construction amplitude was reduced, and the area of national and provincial forest parks shrunk. At the same time, the government realized the necessity and urgency of forest resource protection and promoted the management of forest parks. However, regarding the overall situation, the ecological situation of forest park tourism nationwide is still in a severe deficit, and the case is not optimistic.

5.2. Analysis of the Temporal Evolution of the Tourism Ecological Status of Forest Parks in China’s Provinces

The touristic ecological footprint of forest parks in most provinces in China shows a fluctuating upward trend, with Shandong and Guangdong having significantly higher ecological footprints than other provinces and cities. The touristic ecological footprint of forest parks is most elevated in Guangdong because Guangdong Province has the highest number of tourists and the lowest in Tianjin. From 2014 to 2019, the touristic ecological footprint of forest parks in the 11 provinces showed a downward trend, and, due to objective factors such as ecological compensation measures for forest parks and constraints on the external policy environment, the behavior of forest park tourism in terms of high-intensity output tends to be converged, and the conflicts between people and land have also been slightly eased. The human–land competition has also reduced somewhat (Table 5).
The forest parks in all provinces of China, except Jilin and Tianjin, have generally shown a steady upward evolution in touristic ecological carrying capacity. The tourism ecological carrying capacity of forest parks in Jilin, Xinjiang, Guangdong, and Heilongjiang is significantly better than that of other provinces. The highest tourism ecological carrying capacity in forest parks in Jilin is mainly attributed to the high forest coverage rate and the low investment in the development of the parks, which still have higher space for development. Between 2014 and 2019, the tourism ecological carrying capacity of forest parks per capita in each province, except in Xinjiang, Heilongjiang, and Liaoning, has been consistently low.
Through the changes in ecological footprint and ecological carrying capacity of forest park tourism in each province, it can be seen that, as of 2019, except for Gansu, Hainan, Jilin, Heilongjiang, Jilin, Liaoning, Inner Mongolia, Shaanxi, Xizang, Xinjiang, and Yunnan, which maintain an ecological surplus, the values of ecological carrying capacity in the remaining regions are lower than those of touristic ecological footprint in forest parks. Most of China’s forest park tourism resources are in unsustainable development and utilization. Most provinces, especially the more developed regions, face increasingly severe ecological problems in forest park tourism. Currently, the occupancy intensity of forest park tourism resources has reached saturation.

5.3. Spatial Distribution Characteristics of the Ecological Status of Forest Parks in China

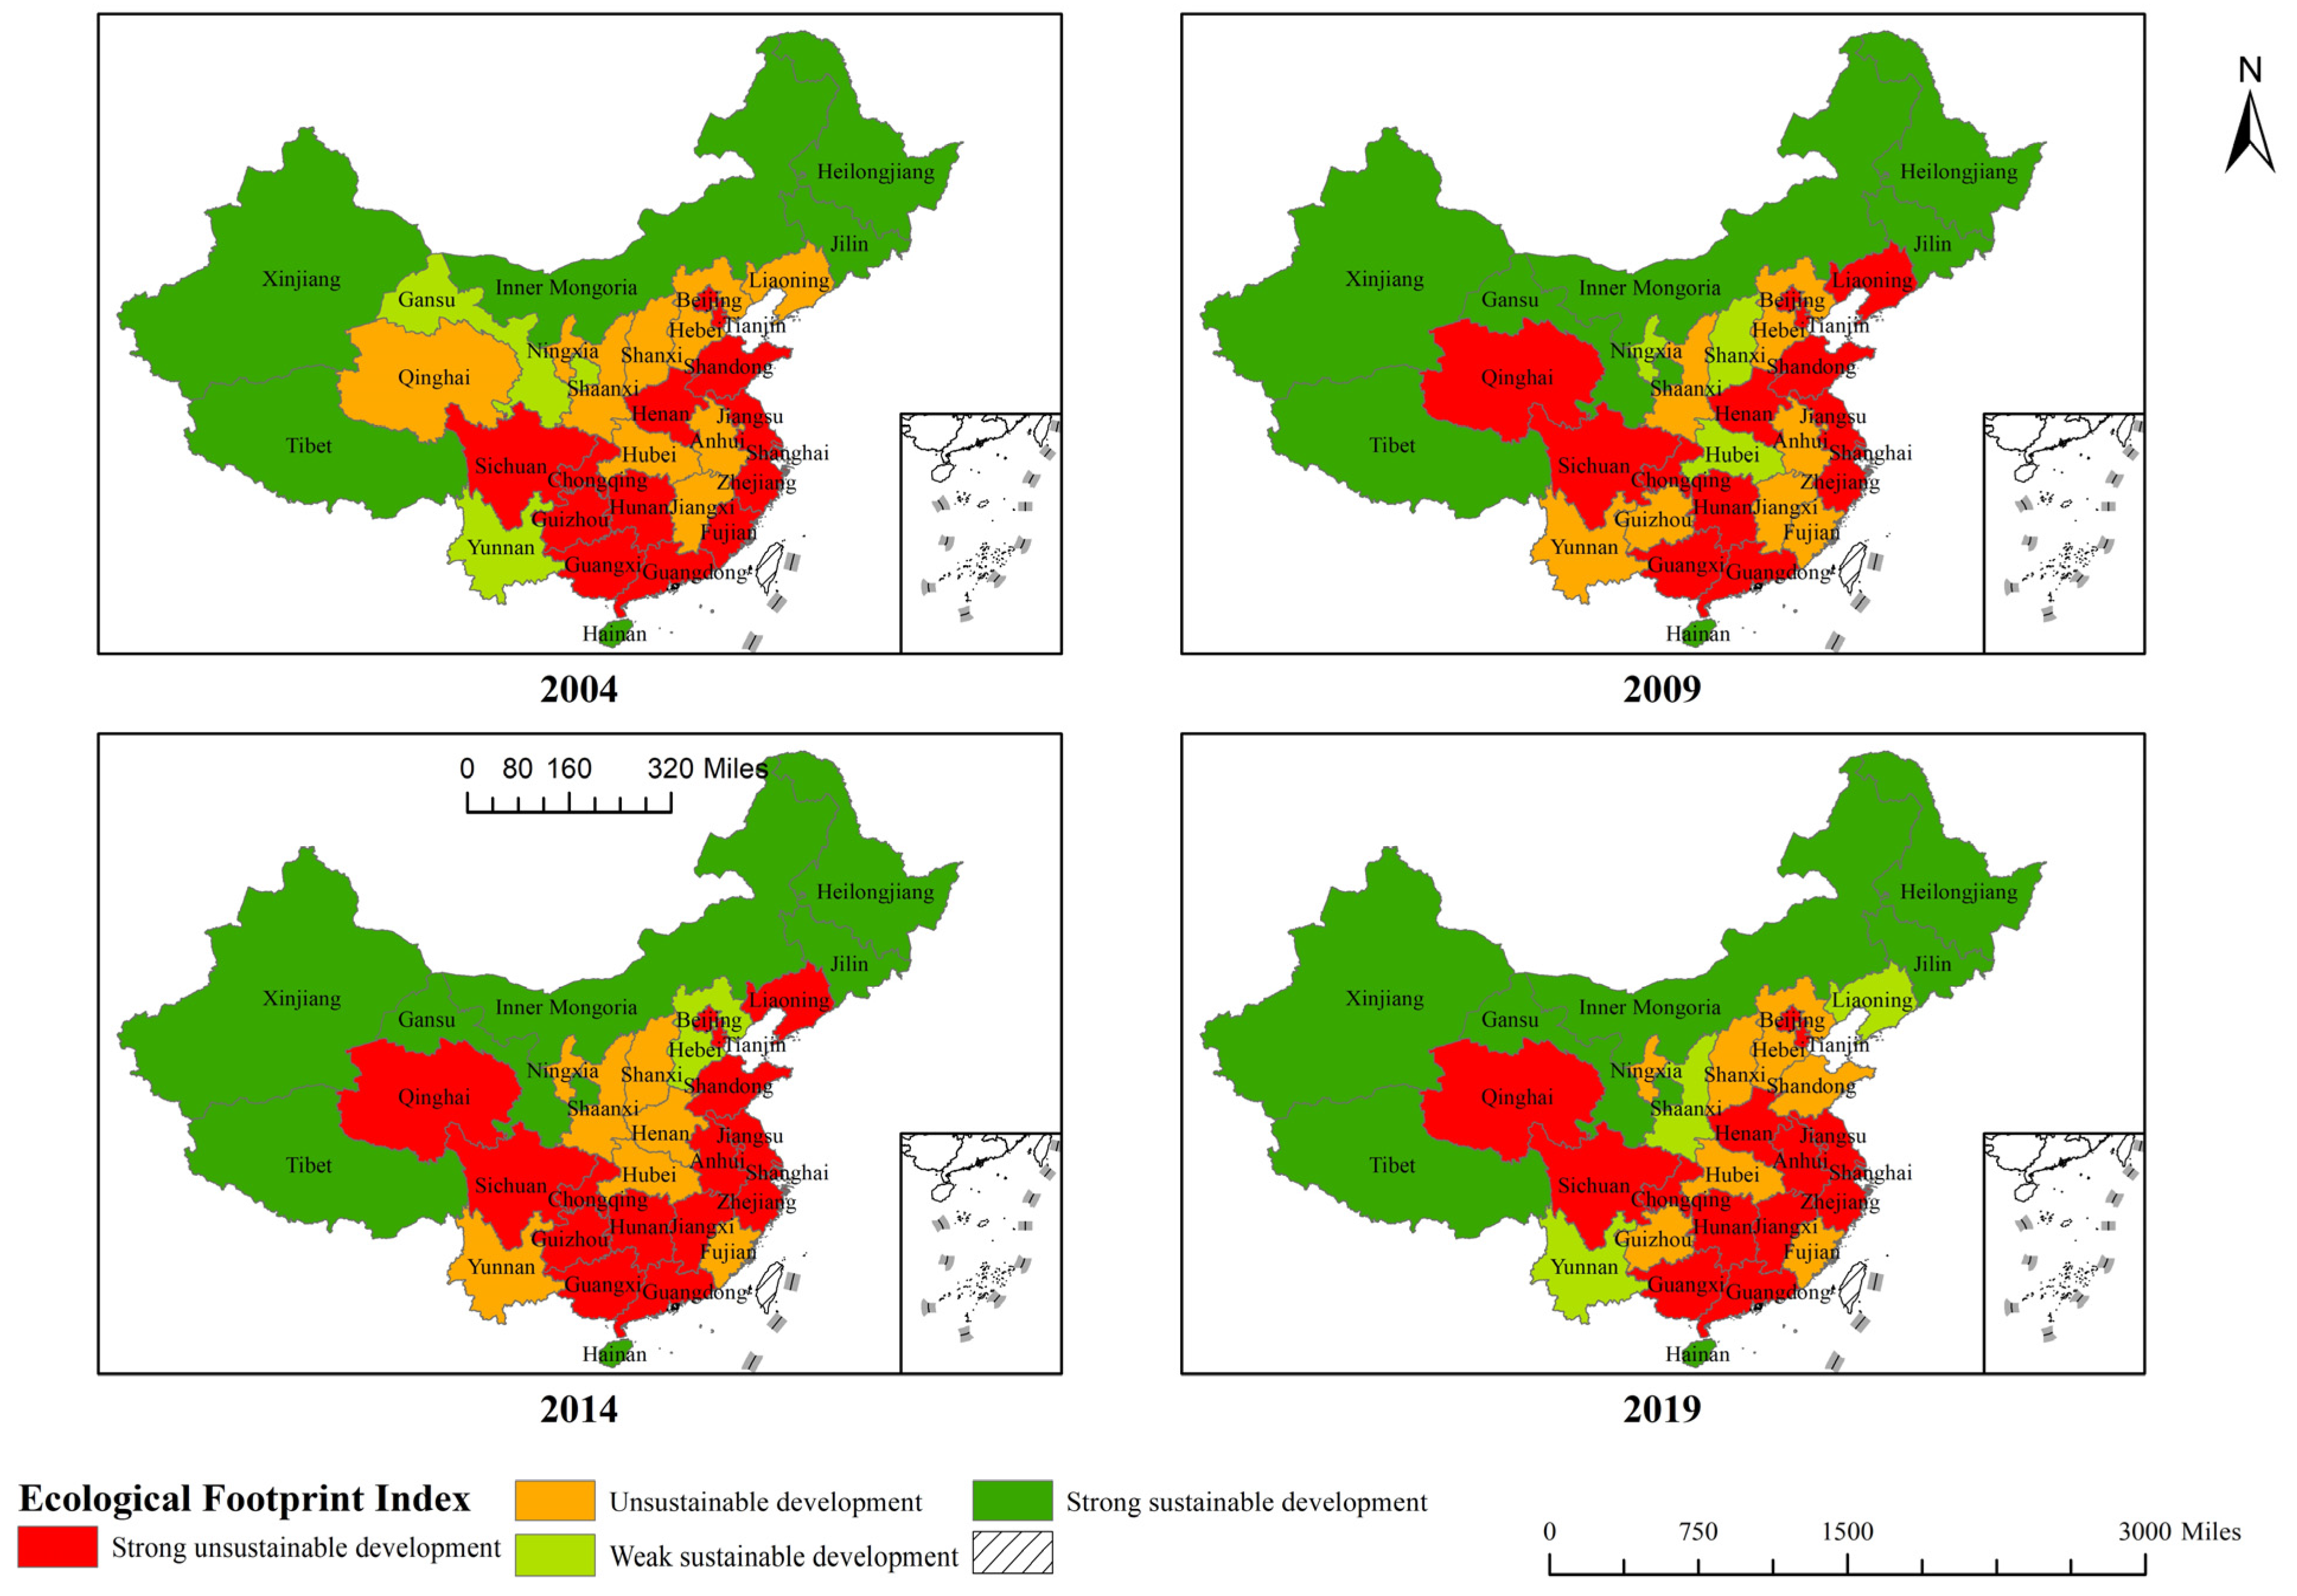
5.3.1. Spatial Distribution Characteristics of Sustainable Development of Forest Parks in China

The years 2004, 2009, 2014, and 2019 were selected to visualize the forest touristic ecological footprint index in four categories and to judge the sustainable development status. In Figure 3, the national sustainable development level gradually increased from 2004 to 2019. There are five provinces with solidified sustainable development levels of forest park touristic ecological footprint during the study period, namely Heilongjiang, Jilin, Inner Mongolia, Xinjiang, and Tibet. The regions with long-term severe unsustainable development status are Beijing, Shanghai, Jiangsu, Zhejiang, Guangdong, Guangxi, Anhui, Hunan, and Sichuan. Sub-regionally, Northeast China, Heilongjiang, and Jilin provinces have been in a state of solid sustainability for a long time. Liaoning has realized a transition to weak sustainability after deteriorating from an unsustainable state to a solid unsustainable state. In North China, Beijing and Tianjin have been in a state of severe unsustainability for a long time. Shanxi and Hebei have both briefly appeared to be in a good state of weakly sustainable development but eventually returned to an unsustainable condition. Only Inner Mongolia has realized long-term sustainable development due to its vast land area and sparsely populated area. East and Central China are generally in a state of unsustainable development. In South China, only Hainan Province is due to the unique geographic location of the long-term sustainable development of the state. In addition to Yunnan and Tibet in southwest China due to geographical factors, Sichuan, Chongqing, and Guizhou are in a long-term state of unsustainable development. Northwest China has the best state of sustainable development, except Shaanxi and Ningxia, which are both in a better state of sustainable development.

5.3.2. Spatial Characteristics of Ecological Pressure in Forest Parks in China

Based on the Getis–Ord Gi*, this paper explores the spatial clustering characteristics of tourism ecological security in China’s forest parks from 2004 to 2019. It divides the study area into four categories, hotspot, sub-hotspot, sub-coldspot, and coldspot, descending from high to low by the natural fracture point method (see Figure 4).
The coldspots and hotspots in China’s forest park ecological safety level are relatively stable. Northeast China, Inner Mongolia, Xinjiang, and Tibet became solid forest park tourism ecological security coldspot areas during the study period. Hotspot and sub-hotspot areas were mainly concentrated in East China, Central China, and Southwest China. From the change in hotspot areas from 2004 to 2019, Central China and Yunnan have been in hotspot areas, indicating that these four provinces have been in a very insecure state of tourism ecology for a long time. The safe hotspot areas covered Central and South China and Southwest China by 2014. In addition, the sub-hotspots and hotspots gradually migrated from inland areas to the eastern coastal areas, and, as of 2019, the hotspots and sub-hotspots shifted to the eastern areas.

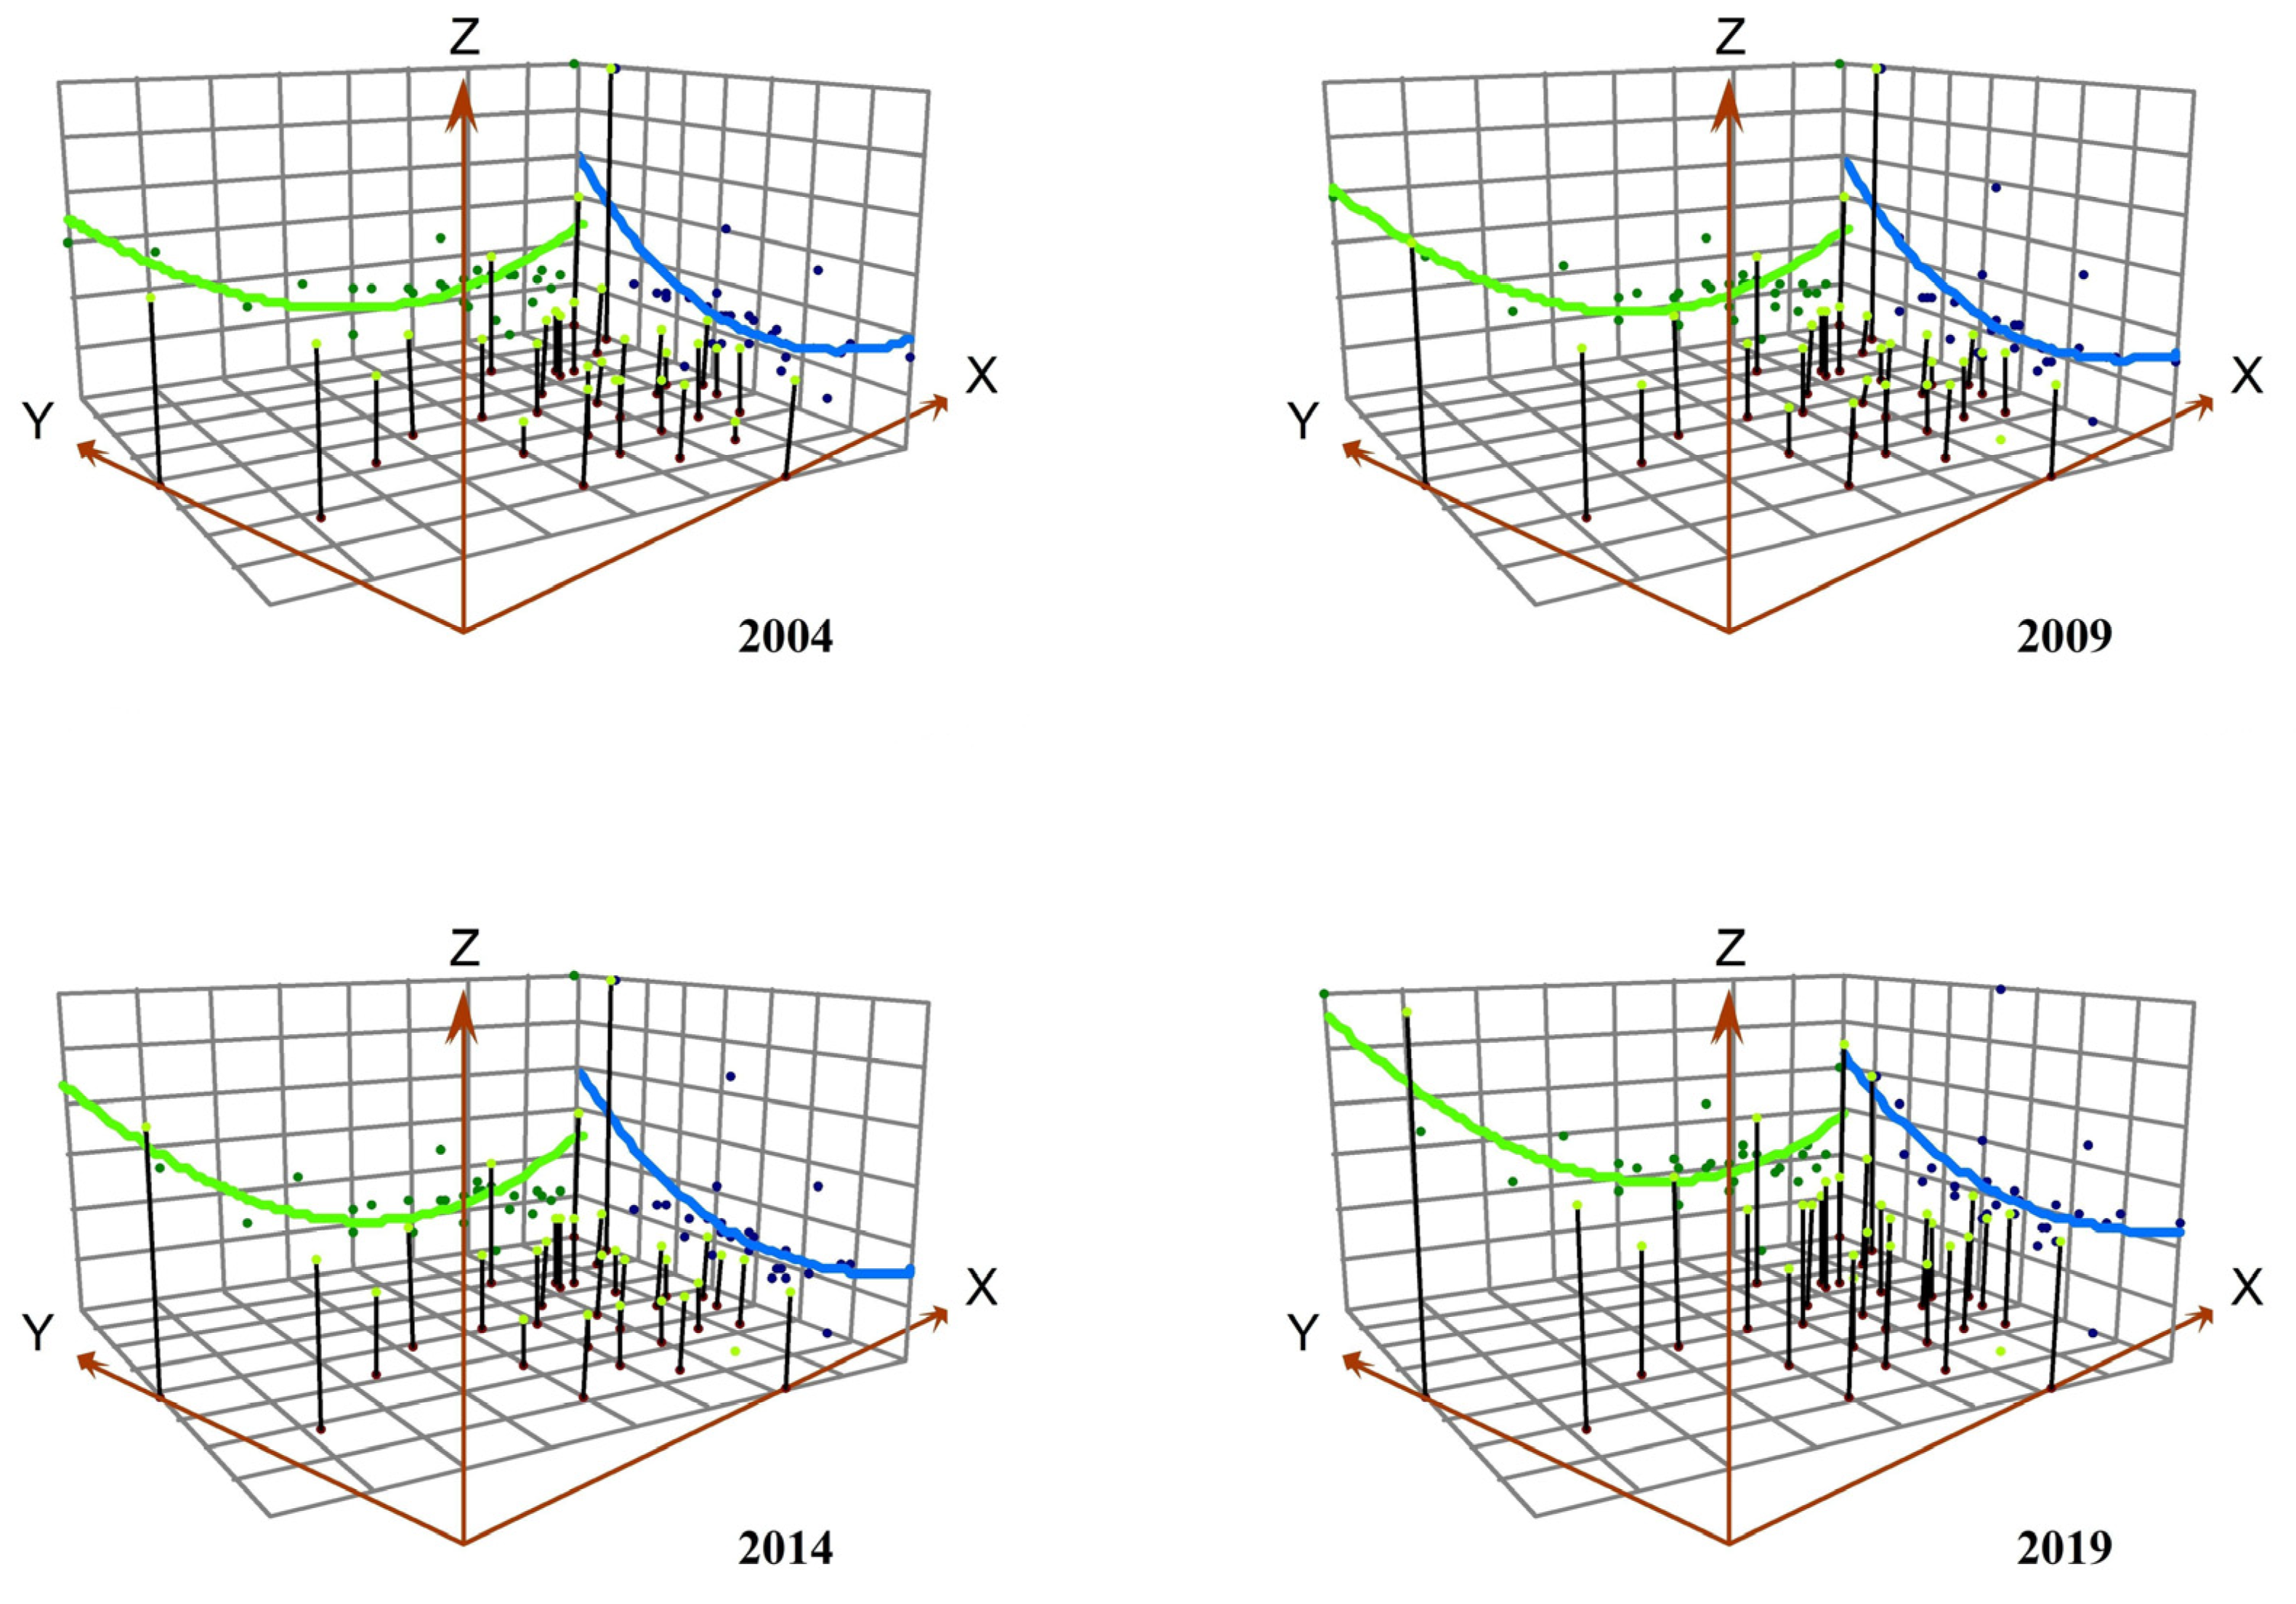
5.3.3. Characterization of the Spatial Trend in Ecological Surplus and Deficit in China’s Forest Parks

Using the global trend surface analysis tool in ArcGIS, the touristic ecological surplus and deficit in China’s forest parks from 2004 to 2019 was fitted with a second-order polynomial as the height attribute Z value and the geographic coordinates of each region as the level attributes X and Y values. The results are shown in Figure 5 (where the X axis represents the east–west direction and the Y axis represents the north–south direction). The touristic ecological surplus and deficit in China’s forest parks shows a U-shaped spatial differentiation in both the east–west and the north–south directions, and the east–west direction is more prominent than the north–south. From the trend in spatial differentiation each year, the spatial differentiation law of touristic ecological surplus and deficit in China’s forest parks remained unchanged from 2004 to 2019. There are differences in the ecological surplus and deficit in forest parks in the north–south direction. However, the differences in the north–south direction are more minor than those in the east–west direction. In the north–south direction, the ecological surplus appeared higher in the south and north and lower in the center, indicating that the touristic ecological surplus of the forest park is higher in the south than in the center of the characteristics. In the east–west direction, the difference in the ecological surplus in forest parks is more extensive, and the ecological surplus shows a decreasing trend from west to east, indicating that the level of ecological surplus in tourism in forest parks is characterized by the west being higher than the east.

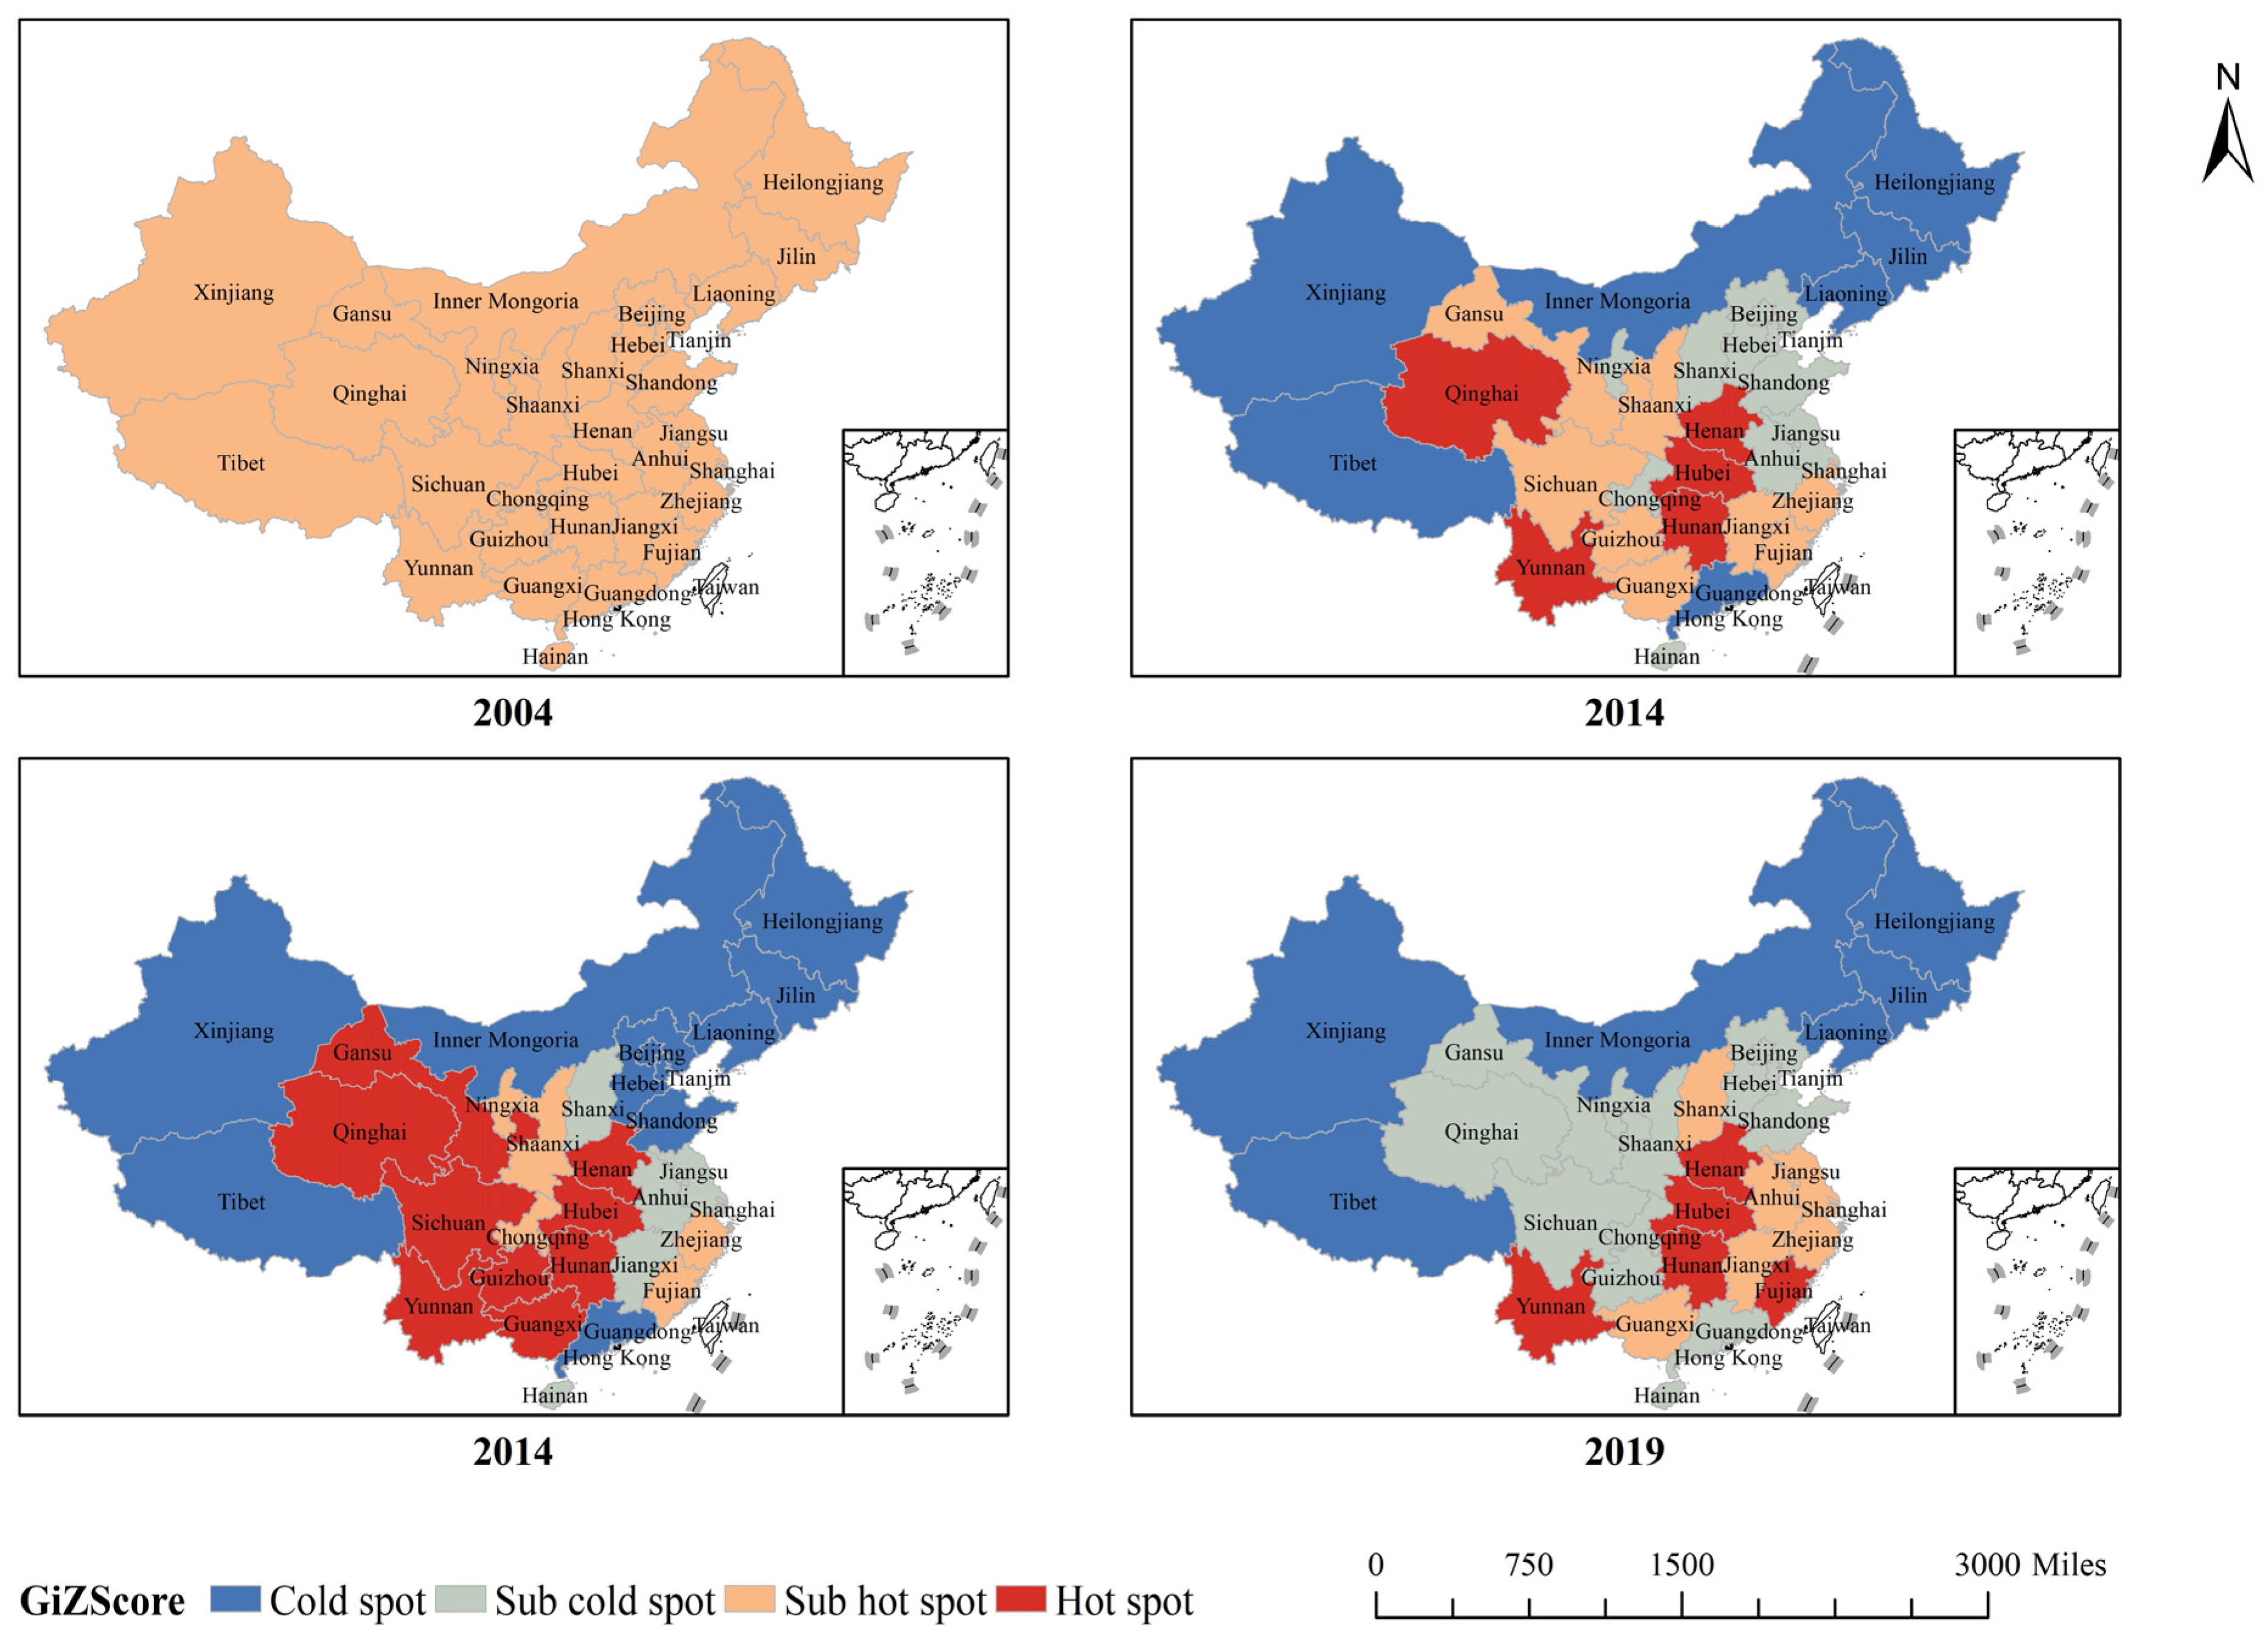
5.3.4. Spatial Change in Touristic Ecological Surplus and Deficit in China’s Forest Parks

The standard deviation ellipse (SDE) can well reflect the spatial distribution pattern and macro-evolution law of touristic ecological surplus and deficit in China’s forest parks. This paper explores the spatial migration trajectory of touristic ecological surplus and deficit from 2004 to 2019 based on the standard deviation ellipse method (SDE) and center of gravity migration, which is realized in the spatial statistics tool module of ArcGIS 10.7. The standard deviation ellipse is calculated using the standard of 65% of the data package content. The results are shown in Table 6 and Figure 6.
In 2004–2006, there was significant regional variability in the growth rate of the touristic ecological surplus in the forest parks in each region. In 2007–2017, the enhancement in the ecological surplus of tourism in the forest parks in each region was relatively consistent, and the differences were relatively small. From the perspective of the center of gravity migration distance, the cumulative movement distance of the center of gravity of touristic ecological surplus development in China’s forest parks from 2004 to 2019 was about 1184.06 km, of which the east–west movement distance was about 743.80 km and the north–south direction movement distance was approximately 33.48 km. This result suggests that the east–west difference in the level of touristic ecological surplus is more significant than the north–south difference and is more prone to the uneven development of regional touristic ecological surplus. From the standard deviation ellipse-like changes, from 2004 to 2019, the standard deviation ellipse gradually moved in the southwest direction. The long semi-axis was more significant than the short semi-axis, indicating that the southwest direction of China’s forest parks’ touristic ecological surplus development increased more than the northeast. The east–west direction showed prominent trend characteristics. From the perspective of azimuth change, the study period showed an increasing and decreasing trend, but, generally, the change was insignificant. From the ellipse generation area, the range of touristic ecological surplus in China’s forest parks in 2019 was more prominent than in 2004. The flattening generation rate in 2019 was higher than in 2004, indicating that the spatial distribution of touristic ecological surplus in China’s forest parks was more decentralized. However, the directional trend was more evident than that in 2004.

5.4. Analysis of Touristic Ecological Surplus and Deficit Prediction of Forest Parks in China

This paper predicts the touristic ecological security status of forest parks in the study area in the next ten years by simulating the evolutionary trends and characteristics of per capita forest park touristic ecological footprint and ecological carrying capacity of forest parks in China from 2004 to 2019, with the following prediction model:
XEF(t + 1) = 1.31E+5e1.65E−2t − 1.29E+05
Xef(t + 1) = −9.86E−01e−1.28E−01t + 1.13E+00
XEC(t + 1) = 1.12E+05e1.65E−02t − 1.11E+05
Xec(t + 1) = −8.48E−01e−1.28E−01t + 9.68E−01
Equation (8) is the total forest park touristic ecological footprint simulation equation, Equation (9) is the total forest park tourism ecological carrying capacity simulation equation, Equation (10) is the per capita forest park touristic ecological footprint simulation equation, and Equation (11) is the per capita forest park tourism ecological carrying capacity simulation equation. By evaluating and testing the grey prediction model, it can be obtained that the testifying ratio after prediction is C = 0.3261 in Equation (8), and the testifying ratio after prediction is p = 0.9333. The testifying ratio after prediction is C = 0.0819 in Equation (9), and the small error probability is p = 1.0000. In Equation (10), the testifying ratio after prediction is C = 0.3261, and the small error probability is p = 0.9333. In Equation (11), the testifying ratio after prediction is C = 0.0819, and the small error probability is p = 1.0000. Based on the model fitting accuracy level, it can be seen that the above four models have reached the standard of “good”. In addition, the model’s relative error is also within a reasonable range, and the model’s credibility is high, comparing the results of the predicted and actual values (Table 7 and Table 8). It can be used to make predictions. The specific results of this paper applying the grey GM(1,1) model to predict the touristic ecological footprint and ecological carrying capacity of China’s forest parks from 2020 to 2029 are shown in Table 7 and Table 8.
The prediction results (Table 9) show that China’s forest parks’ overall touristic ecological footprint will grow steadily at an average annual rate of 1.67% in the coming period. By 2029, the total touristic ecological footprint will increase to 3236.35 hectares (ha), while the per capita touristic ecological footprint will decrease steadily at an average annual rate of 12.06% to 0.00544 ha/person, which reflects the enhancement in consumers’ preference for forest tourism and tourism. The tremendous economic development has continuously increased the occupancy rate of forest parks. The demand for forest resources in the tourism industry has also increased, and it has become an indispensable key element in China’s tourism industry. However, the state’s protection of forest resources and restriction of scenic spot development have gradually reduced the touristic ecological footprint per capita.
The touristic ecological carrying capacity of China’s forest parks is growing steadily at a rate of 1.67%, increasing to 2783.26 hectares (ha) by 2029, while the ecological carrying capacity of forest parks for tourism per capita is slowly decreasing at an average annual rate of 12.05%, falling to 0.00468 ha/person by 2029. Forest parks continue to be damaged by disturbances from external factors while facing potential threats, such as the invasion of non-native tree species, dwelling forest fires, and biodiversity. Overall, the per capita forest park touristic ecological surplus in 2019 has far exceeded the upper limit of the touristic carrying capacity of the forest park ecosystem, and the degree of the touristic ecological deficit has been deepening over time. It can be seen that a series of practical measures must be taken to actively improve the internal ecological environment of forest parks. The government should transform the existing forest park tourism model to cater to forest parks’ actual tourism production capacity. Otherwise, the regional forest park tourism ecological security situation will further deteriorate.

6. Discussion

This paper takes China’s forest parks as the research object, constructs the touristic ecological footprint model, and analyzes the spatial distribution, aggregation, and trend evolution characteristics of ecological surplus and deficit in China’s forest parks with the help of ArcGIS. Then, this paper further analyzes the spatial trajectory of its change and adopts the grey system GM(1,1) model to create medium-term forecasts of China’s forest parks’ touristic ecological carrying capacity from 2020 to 2029.
The results indicate that the ecological footprint of Chinese forest park tourism has shown a significant year-on-year increase. In contrast, the ecological carrying capacity exhibits a trend in initial rise followed by decline. A comparison between the ecological footprint and carrying capacity reveals an overall ecological deficit in Chinese forest parks and an uneven distribution among regions. This demonstrates an inverse relationship between the sustainable development level of forest park tourism and the economic development level of different areas. These findings align with previous studies on the relationship between the development level of Chinese forest park tourism and ecological carrying capacity [20,64]. It is noted that there are still many provincial regions experiencing varying degrees of mild, moderate, high, and severe ecological insecurity.
The second point is the relatively stable pattern of hotspots and coldspots. During the study period, the Northeast region, Inner Mongolia, Xinjiang, and Tibet maintained consistent coldspot areas regarding forest park ecological security levels. The hotspots and sub-hotspots have gradually shifted from inland areas towards eastern coastal provinces. This conclusion largely corroborates previous findings derived from forestry ecological security assessments based on ecological footprints and their influencing factor analyses [22]. It suggests that Tibet and Inner Mongolia are in a secure state, Qinghai and Hainan are relatively secure, and Xinjiang and Heilongjiang are in a critical secure state. At the same time, other regions remain in an insecure state.
Building upon previous research, we delved deeper into the spatial trend characteristics of forest park ecological surplus and deficit and the spatial changes in the ecological surplus and deficit in forest park tourism in China. The study revealed that the ecological surplus and deficit levels in Chinese forest parks exhibit a general “U”-shaped spatiotemporal differentiation in both the east–west and north–south directions. This trend is more pronounced in the east–west direction, indicating a lower level in the east compared to the west. In the north–south direction, the southern part generally has higher levels than the northern part, with the central part showing lower levels. Analyzing the shape of standard deviation ellipses and the trajectory of the center of gravity migration, the growth in ecological surplus and deficit levels in Chinese forest parks is more significant towards the southwest than the northeast. This trend is notably apparent in the east–west direction. Overall, the center of gravity tends to shift towards the southwest, displaying a pattern of faster movement followed by slower movement. The disparity between the east and west in China is more significant than the north–south difference, contributing to potential regional imbalances in the ecological surplus and deficit development in forest tourism.
Finally, based on the spatiotemporal characteristics of the development of forest park tourism ecology in China, we conducted pioneering forecasts regarding the future trends in forest park tourism ecology in the next decade. From 2020 to 2029, the overall development of forest park tourism ecology in China will continue the evolutionary patterns observed from 2004 to 2019. The ecological footprint and carrying capacity show a continuous upward trend, while the severity of the ecological deficit is deepening. Consequently, using forest park resources will contribute to entering an unsustainable development stage. The predicted outcome contrasts with previous scholars’ belief that the development of forest park tourism in China, in the context of ecological civilization, was showing a positive transformation [65]. This could be due to differences in the years of study selected compared to previous scholars. With the rapid development of forest park utilization and the tourism industry, there have been significant changes in the forest park ecosystems, leading to differences in forecasting future scenarios. Also, previous scholars’ estimation of the development of forest ecosystems was limited to interpreting the forest protection status and government policies of some provinces. They did not employ a more scientifically systematic approach to forecast the future of forest ecosystems. Consequently, their opinions might have been overly optimistic.

7. Conclusions and Suggestions

7.1. Conclusions

The paper integrates theories from aspects such as ecological footprint, carrying capacity assessment, and spatial analysis, offering a new method to assess the impact of forest park tourism on ecosystems. The study reveals that China’s forest parks are generally in an ecological deficit state, with unevenness among regions. The ecological security level of forest parks nationwide gradually declines from inland to coastal areas, with significantly higher ecological deficits in the eastern regions than the western ones. The research further delves into the spatial distribution and pattern changes in ecological footprints in different regions of Chinese forest park tourism. It demonstrates an overall trend of ecological surplus levels in China’s forest parks moving southwestward, shifting from fast to slow. Finally, predictions for the next decade indicate a deepening ecological deficit, especially in the economically developed areas of China’s forest park tourism, suggesting an unsustainable development status. The study’s theoretical contributions provide a new perspective and methodology for the ecological management of forest park tourism, ecological footprint assessment, and strategies for sustainable development, offering insights and guidance for relevant research fields.

7.2. Suggestions

The government should evaluate forest park quality grades regularly. Significant regional differences exist in the ecological security of tourism in forest parks in various regions, and the quantity, quality, and ecology of black soil are being controlled in an all-around manner. Comprehensive and systematic ecological maintenance will be provided to areas with relatively stable tourism ecological conditions. Provinces with relatively fragile tourism ecological bases will be designated as critical ecological restoration zones to effectively take into account the conditions of regional natural resources and the characteristics of tourism economic development, repair the ecosystem barriers and service functions of forest parks, and realize the coordinated development of the overall tourism ecological landscape of forest parks.
Supportive policies and diverse strategies can strengthen the capacity of forest parks in developing areas. This enhancement encourages the development of additional forest parks, redirecting tourists from regions where forest resources are overused. Such a strategy boosts the local tourism economy while also balancing the ecological effects of tourism on these parks.
For economically developed regions with low ecological security in forest park tourism, the number of tourists in forest parks should be strictly controlled based on touristic ecological carrying capacity to prevent the destruction of the ecological environment of forest parks and threats to the ecological security of forest park ecosystems. For popular forest parks, measures such as “reservation, flow restriction, an d staggered peaks” can be adopted to limit the number of tourists and reduce the damage to forest parks, thereby reducing the touristic ecological footprint.

7.3. Limitation

This paper also has some shortcomings. One is that the equivalence and yield factors used in the ecological footprint model are not calculated according to each province’s biological production situation. This result may lead to the touristic ecological footprint in forest parks in each province being more extensive than the calculated results. The second is that, in the future, we should try to excavate the driving factors affecting the touristic ecological footprint in China’s forest parks and seek the deep-rooted reasons for the changes in the touristic ecological footprint in forest parks.

Author Contributions

Conceptualization, J.L. and H.C.; methodology, J.L.; software, J.L.; validation, Lu, J. and H.C.; formal analysis, J.L.; writing—original draft preparation, J.L.; writing—review and editing, H.C.; supervision, H.C.; project administration, H.C.; funding acquisition, J.L. and H.C. All authors have read and agreed to the published version of the manuscript.

Funding

This work was supported by the [General Project of National Social Science Fund] under Grant [18BJY198]; and [Postgraduate Research & Practice Innovation Program of Jiangsu Province] under Grant [KYCX22_3592]; and [Philosophy and Social Sciences Excellent Innovation Team Construction foundation of Jiangsu Province] under Grant [SJSZ2020-20].

Data Availability Statement

Data are contained within the article.dentifiable human images or data are presented in this study.

Conflicts of Interest

The authors declare no conflicts of interest.

References

  1. Limaei, S.M.; Ghesmati, H.; Rashidi, R.; Yamini, N. Economic Evaluation of Natural Forest Park Using the Travel Cost Method (Case Study; Masouleh Forest Park, North of Iran). J. For. Sci. 2014, 60, 254–261. [Google Scholar] [CrossRef]
  2. Safe’i, R.; Darmawan, A.; Kaskoyo, H.; Rezinda, C.F.G. Analysis of Changes in Forest Health Status Values in Conservation Forest (Case Study: Plant and Animal Collection Blocks in Wan Abdul Rachman Forest Park (Tahura WAR)). J. Phys. Conf. Ser. 2021, 1842, 012049. [Google Scholar] [CrossRef]
  3. Singkran, N. Carbon Sink Capacity of Public Parks and Carbon Sequestration Efficiency Improvements in a Dense Urban Landscape. Env. Monit. Assess. 2022, 194, 750. [Google Scholar] [CrossRef]
  4. Allen, K.A.; Lehsten, V.; Hale, K.; Bradshaw, R. Past and Future Drivers of an Unmanaged Carbon Sink in European Temperate Forest. Ecosystems 2016, 19, 545–554. [Google Scholar] [CrossRef]
  5. Huang, X.; An, R.; Yu, M.-M.; He, F. Tourism Efficiency Decomposition and Assessment of Forest Parks in China Using Dynamic Network Data Envelopment Analysis. J. Clean. Prod. 2022, 363, 132405. [Google Scholar] [CrossRef]
  6. Kumar, H.; Pandey, B.W.; Anand, S. Analyzing the Impacts of Forest Ecosystem Services on Livelihood Security and Sustainability: A Case Study of Jim Corbett National Park in Uttarakhand. Int. J. Geoheritage Parks 2019, 7, 45–55. [Google Scholar] [CrossRef]
  7. Ahammad, R.; Hossain, M.K.; Sobhan, I.; Hasan, R.; Biswas, S.R.; Mukul, S.A. Social-Ecological and Institutional Factors Affecting Forest and Landscape Restoration in the Chittagong Hill Tracts of Bangladesh. Land Use Policy 2023, 125, 106478. [Google Scholar] [CrossRef]
  8. Danielson, S.C.; Mascia, R.; Metzger, M.; Stuble, K.L.; Medeiros, J.S. Stress-Resistant Trees Are More Common in Urban than Rural Forests: A Case Study of Cleveland, Ohio’s Natural Parks. Urban For. Urban Green. 2023, 82, 127864. [Google Scholar] [CrossRef]
  9. Ulrich, B. Forest Ecosystem Theory Based on Material Balance. Ecol. Model. 1992, 63, 163–183. [Google Scholar] [CrossRef]
  10. Nowak, D.J.; Hirabayashi, S.; Bodine, A.; Greenfield, E. Tree and Forest Effects on Air Quality and Human Health in the United States. Environ. Pollut. 2014, 193, 119–129. [Google Scholar] [CrossRef]
  11. Amini Parsa, V.; Salehi, E.; Yavari, A.R.; van Bodegom, P.M. Analyzing Temporal Changes in Urban Forest Structure and the Effect on Air Quality Improvement. Sustain. Cities Soc. 2019, 48, 101548. [Google Scholar] [CrossRef]
  12. Kreye, M.M.; Adams, D.C.; Escobedo, F.J. The Value of Forest Conservation for Water Quality Protection. Forests 2014, 5, 862–884. [Google Scholar] [CrossRef]
  13. Zhang, P.; Dong, Y.; Guo, Y.; Wang, C.; Wang, G.; Ma, Z.; Zhou, W.; Zhang, D.; Ren, Z.; Wang, W. Urban Forest Soil Is Becoming Alkaline under Rapid Urbanization: A Case Study of Changchun, Northeast China. CATENA 2023, 224, 106993. [Google Scholar] [CrossRef]
  14. Agarwal, P.; Sahoo, D.; Parida, Y.; Ranjan Paltasingh, K.; Roy Chowdhury, J. Land Use Changes and Natural Disaster Fatalities: Empirical Analysis for India. Ecol. Indic. 2023, 154, 110525. [Google Scholar] [CrossRef]
  15. Vacek, Z.; Vacek, S.; Cukor, J. European Forests under Global Climate Change: Review of Tree Growth Processes, Crises and Management Strategies. J. Environ. Manag. 2023, 332, 117353. [Google Scholar] [CrossRef] [PubMed]
  16. China Has Added 11 New National Forest Parks, with a Total of 897—Economy, Science and Technology—People’s Daily Online. Available online: http://finance.people.com.cn/n1/2019/0213/c1004-30642222.html (accessed on 26 November 2023).
  17. Fitz, J.; Adenle, A.A.; Ifejika Speranza, C. Increasing Signs of Forest Fragmentation in the Cross River National Park in Nigeria: Underlying Drivers and Need for Sustainable Responses. Ecol. Indic. 2022, 139, 108943. [Google Scholar] [CrossRef]
  18. Ballantyne, M.; Pickering, C.M. Recreational Trails as a Source of Negative Impacts on the Persistence of Keystone Species and Facilitation. J. Environ. Manag. 2015, 159, 48–57. [Google Scholar] [CrossRef]
  19. Cobbinah, P.B.; Asibey, M.O.; Azumah, A.D. Urban Forest and the Question of Planning-Sustainability Inadequacy. Cities 2023, 140, 104453. [Google Scholar] [CrossRef]
  20. Chen, L. Study on Tourism Development Level of China’s Forest Parks Based on Ecological Carrying Capacity. Ph.D. Thesis, Northeast Forestry University, Harbin, China, 2022. [Google Scholar]
  21. Tussadiah, A.; Sujiwo, A.S.; Andesta, I.; Daeli, W. Assessment of Coastal Ecosystem Services and Its Condition for Policy Management Plan in East Nusa Tenggara, Indonesia. Reg. Stud. Mar. Sci. 2021, 47, 101941. [Google Scholar] [CrossRef]
  22. Yu, X. Measurement Study of Forestry Ecological Security and Analysis of Its Influencing Factors Based on Ecological Footprint. Ph.D. Thesis, Nanjing Forestry University, Harbin, China, 2017. [Google Scholar]
  23. Bonye, S.Z.; Yiridomoh, G.Y.; Nsiah, V. Our Forest, Our Livelihood: Natural Resources’ Use Controversies and Community Livelihood Sustainability in the Mole National Park, Ghana. Land Use Policy 2023, 127, 106589. [Google Scholar] [CrossRef]
  24. Nikinmaa, L.; Lindner, M.; Cantarello, E.; Gardiner, B.; Jacobsen, J.B.; Jump, A.S.; Parra, C.; Plieninger, T.; Schuck, A.; Seidl, R.; et al. A Balancing Act: Principles, Criteria and Indicator Framework to Operationalize Social-Ecological Resilience of Forests. J. Environ. Manag. 2023, 331, 117039. [Google Scholar] [CrossRef] [PubMed]
  25. Jia, H.; Luo, P.; Yang, H.; Luo, C.; Li, H.; Cheng, Y.; Huang, Y. Constructing an Indices System for Evaluating the Ecological Integrity of Forests in Western Sichuan, China Based on Structural Equation Modeling. Ecol. Indic. 2023, 146, 109745. [Google Scholar] [CrossRef]
  26. Kurniawan, F.; Adrianto, L.; Bengen, D.G.; Prasetyo, L.B. The Social-Ecological Status of Small Islands: An Evaluation of Island Tourism Destination Management in Indonesia. Tour. Manag. Perspect. 2019, 31, 136–144. [Google Scholar] [CrossRef]
  27. Sgroi, F. Forest Resources and Sustainable Tourism, a Combination for the Resilience of the Landscape and Development of Mountain Areas. Sci. Total Environ. 2020, 736, 139539. [Google Scholar] [CrossRef] [PubMed]
  28. Viccaro, M.; Cozzi, M.; Fanelli, L.; Romano, S. Spatial Modelling Approach to Evaluate the Economic Impacts of Climate Change on Forests at a Local Scale. Ecol. Indic. 2019, 106, 105523. [Google Scholar] [CrossRef]
  29. Han, X.; Sun, T.; Cao, T. Study on Landscape Quality Assessment of Urban Forest Parks: Take Nanjing Zijinshan National Forest Park as an Example. Ecol. Indic. 2021, 120, 106902. [Google Scholar] [CrossRef]
  30. Su, L.; Ji, X. Spatial-Temporal Differences and Evolution of Eco-Efficiency in China’s Forest Park. Urban For. Urban Green. 2021, 57, 126894. [Google Scholar] [CrossRef]
  31. Zheng, Y.; Lan, S.; Chen, W.Y.; Chen, X.; Xu, X.; Chen, Y.; Dong, J. Visual Sensitivity versus Ecological Sensitivity: An Application of GIS in Urban Forest Park Planning. Urban For. Urban Green. 2019, 41, 139–149. [Google Scholar] [CrossRef]
  32. Xu, Y.; Liu, R.; Xue, C.; Xia, Z. Ecological Sensitivity Evaluation and Explanatory Power Analysis of the Giant Panda National Park in China. Ecol. Indic. 2023, 146, 109792. [Google Scholar] [CrossRef]
  33. Bernard, F.; de Groot, R.S.; Campos, J.J. Valuation of Tropical Forest Services and Mechanisms to Finance Their Conservation and Sustainable Use: A Case Study of Tapantí National Park, Costa Rica. For. Policy Econ. 2009, 11, 174–183. [Google Scholar] [CrossRef]
  34. Coppinger, C.R.; Gorman, M.; Markey, A.; Stanley, D.A. Are Indicators Useful for Measuring and Supporting the Sustainability of Forest Use? A Zambian Case Study. For. Policy Econ. 2023, 149, 102926. [Google Scholar] [CrossRef]
  35. Mancini, M.S.; Barioni, D.; Danelutti, C.; Barnias, A.; Bračanov, V.; Capanna Piscè, G.; Chappaz, G.; Đuković, B.; Guarneri, D.; Lang, M.; et al. Ecological Footprint and Tourism: Development and Sustainability Monitoring of Ecotourism Packages in Mediterranean Protected Areas. J. Outdoor Recreat. Tour. 2022, 38, 100513. [Google Scholar] [CrossRef]
  36. Dvarskas, A. Dynamically Linking Economic Models to Ecological Condition for Coastal Zone Management: Application to Sustainable Tourism Planning. J. Environ. Manag. 2017, 188, 163–172. [Google Scholar] [CrossRef]
  37. Ferguson, M.D.; Giles, G.; Ferguson, L.A.; Barcelona, R.; Evensen, D.; Barrows, C.; Leberman, M. Seeing the Forest for the Trees: A Social-Ecological Systems Approach to Managing Outdoor Recreation Visitation in Parks and Protected Areas. J. Outdoor Recreat. Tour. 2022, 38, 100473. [Google Scholar] [CrossRef]
  38. Brandt, J.S.; Buckley, R.C. A Global Systematic Review of Empirical Evidence of Ecotourism Impacts on Forests in Biodiversity Hotspots. Curr. Opin. Environ. Sustain. 2018, 32, 112–118. [Google Scholar] [CrossRef]
  39. Vakhlamova, T.; Rusterholz, H.-P.; Kamkin, V.; Baur, B. Recreational Use of Urban and Suburban Forests Affects Plant Diversity in a Western Siberian City. Urban For. Urban Green. 2016, 17, 92–103. [Google Scholar] [CrossRef]
  40. Shan, S.; Xu, H.; Qi, X.; Chen, T.; Wang, X. Evaluation and Prediction of Ecological Carrying Capacity in the Qilian Mountain National Park, China. J. Environ. Manag. 2023, 339, 117856. [Google Scholar] [CrossRef]
  41. Du, W.; Yan, H.; Yang, Y.; Liu, F. Evaluation methods and research trends for ecological carrying capacity. J. Resour. Ecol. 2018, 9, 115–124. [Google Scholar]
  42. Zhang, Z.; Hu, B.; Jiang, W.; Qiu, H. Spatial and Temporal Variation and Prediction of Ecological Carrying Capacity Based on Machine Learning and PLUS Model. Ecol. Indic. 2023, 154, 110611. [Google Scholar] [CrossRef]
  43. Adrianto, L.; Kurniawan, F.; Romadhon, A.; Bengen, D.G.; Sjafrie, N.D.M.; Damar, A.; Kleinertz, S. Assessing Social-Ecological System Carrying Capacity for Urban Small Island Tourism: The Case of Tidung Islands, Jakarta Capital Province, Indonesia. Ocean Coast. Manag. 2021, 212, 105844. [Google Scholar] [CrossRef]
  44. He, H.; Shen, L.; Wong, S.W.; Cheng, G.; Shu, T. A “Load-Carrier” Perspective Approach for Assessing Tourism Resource Carrying Capacity. Tour. Manag. 2023, 94, 104651. [Google Scholar] [CrossRef]
  45. Dai, J.; Ouyang, Y.; Hou, J.; Cai, L. Long-Time Series Assessment of the Sustainable Development of Xiamen City in China Based on Ecological Footprint Calculations. Ecol. Indic. 2023, 148, 110130. [Google Scholar] [CrossRef]
  46. Castellani, V.; Sala, S. Ecological Footprint and Life Cycle Assessment in the Sustainability Assessment of Tourism Activities. Ecol. Indic. 2012, 16, 135–147. [Google Scholar] [CrossRef]
  47. Patterson, T.M.; Niccolucci, V.; Marchettini, N. Adaptive Environmental Management of Tourism in the Province of Siena, Italy Using the Ecological Footprint. J. Environ. Manag. 2008, 86, 407–418. [Google Scholar] [CrossRef] [PubMed]
  48. Guan, M.; Jiang, Y.; Du, W.; Cao, P.; Wang, Z.; Lei, J. A Modified Ecological Footprint Calculation Method for Drylands and Its Application to Xinjiang Uygur Autonomous Region, China. J. Clean. Prod. 2023, 419, 138176. [Google Scholar] [CrossRef]
  49. Lee, C.-C.; Chen, M.-P. Ecological Footprint, Tourism Development, and Country Risk: International Evidence. J. Clean. Prod. 2021, 279, 123671. [Google Scholar] [CrossRef]
  50. Rendeiro Martín-Cejas, R.; Pablo Ramírez Sánchez, P. Ecological Footprint Analysis of Road Transport Related to Tourism Activity: The Case for Lanzarote Island. Tour. Manag. 2010, 31, 98–103. [Google Scholar] [CrossRef]
  51. Wang, B.; Feng, Y.; Wang, Y.; Yao, S. SWOT Analysis on Tourist Eco-Footprint and Ecological Carrying Capacity in Poverty-Stricken Areas. Environ. Eng. Manag. J. 2020, 19, 1481–1489. [Google Scholar]
  52. Shang, H.; Na, S. Study of tourism ecological footprint of forest park based on comprehensive method. For. Econ. 2021, 43, 45–56. [Google Scholar] [CrossRef]
  53. Wang, H.; Chen, Q.; Xiu, X.; Lin, P.; Huang, Y.; Liu, L. Study on Low-Carbon Development of Forest Tourism in Fujian Province Based on Ecological Footprint Model. China For. Econ. 2016, 7, 77–83. [Google Scholar] [CrossRef]
  54. Chen, K.; Zhang, Y. Evolution and Enlightenment of Ecological Footprint of Forest Tourism in Beijing: Based on Statistical Data of Forest Parks from 1999 to 2011. J. Hunan Agric. Univ. (Soc. Sci.) 2015, 16, 5. [Google Scholar]
  55. Zhang, J.; Sui, Y. Theoretical Research on Sustainable Ecological Environment Based on the Concept of Green Tourism Consumption. Int. J. Environ. Technol. Manag. 2020, 23, 83. [Google Scholar] [CrossRef]
  56. Liu, T.; Liu, C.; Zeng, K.; Yi, Y. Assessment of sustainable development of Wujiang Karst National Geo-park in Sinan, Guizhou province based on ecological footprint index. Sci. Technol. Manag. Land Resour. 2013, 30, 46–51. [Google Scholar]
  57. Zhao, X.; Ma, C.; Gao, L.; Wei, L. Evaluation of regional ecological security at different scales based on ecological pressure index. Chin. J. Eco-Agric. 2007, 6, 135–138. [Google Scholar]
  58. Feng, Y.; Chen, X.; Gao, F.; Liu, Y. Impacts of Changing Scale on Getis-Ord Gi Hotspots of CPUE: A Case Study of the Neon Flying Squid (Ommastrephes Bartramii) in the Northwest Pacific Ocean. Acta Oceanol. Sin.-Engl. Ed. 2018, 37, 67–76. [Google Scholar] [CrossRef]
  59. Getis, A.; Ord, J.K. The Analysis of Spatial Association by Use of Distance Statistics. Geogr. Anal. 1992, 24, 189–206. [Google Scholar] [CrossRef]
  60. Yang, C.; He, G. Spatio-temporal evolution and prediction of the development level of rural revitalization in the Yangtze River Economic Belt. Stat. Decis. 2023, 39, 77–82. [Google Scholar] [CrossRef]
  61. Lefever, D.W. Measuring Geographic Concentration by Means of the Standard Deviational Ellipse. Am. J. Sociol. 1926, 32, 88–94. [Google Scholar] [CrossRef]
  62. Liu, M.; Li, W. Calculation of equivalence factor used in ecological footprint for China and its provinces based on net primary production. J. Ecol. Rural Environ. 2010, 26, 401–406. [Google Scholar]
  63. Liu, M.; Li, W.; Xie, G. Estimation of China ecological footprint production coefficient based on net primary productivity. Chin. J. Ecol. 2010, 29, 592–597. [Google Scholar] [CrossRef]
  64. Shang, H. Study on Tourism Ecological Footprint Analysis and Development Countermeasures of Forest Parks in Heilongjiang Province. Master’s Thesis, Northeast Forestry University, Harbin, China, 2022. [Google Scholar]
  65. Chen, L.; Su, J.; Wan, Z. Study on the temporal evolution of tourism ecological carrying capacity of forest park from the perspective of ecological civilization. For. Econ. 2019, 25–29. [Google Scholar]
Figure 1. Touristic ecological footprint and touristic ecological carrying capacity of forest parks in China.
Forests 15 00038 g001
Figure 2. Dynamic change trend in per capita touristic ecological footprint of forest parks in China.
Forests 15 00038 g002
Figure 3. Sustainable development distribution of forest parks in China.
Forests 15 00038 g003
Figure 4. Distribution of ecological pressure index of China’s forest parks.
Forests 15 00038 g004
Figure 5. Characteristics of the spatial trend in ecological surplus and deficit in forest parks in China.
Forests 15 00038 g005
Figure 6. Ecological standard deviation ellipse of profit and deficit and center of gravity migration results for forest parks in China.
Forests 15 00038 g006
Table 1. Criteria for judging the regional sustainability status of the ecological footprint index of forest tourism.
EFI≤−1−1–00–0.50.5–1
Degree of sustainable developmentStrong unsustainable developmentUnsustainable developmentWeak sustainable developmentStrong sustainable development
Table 2. Criteria for classifying the regional ecological security status of the ecological stress index for forest tourism.
1234
ETI<0.50.5–0.80.8–1.5>1.5
Ecological securityVery safeRelatively safeUnsafeVery unsafe
Table 3. Descriptive statistics.
YearArea of Forest Park
(hm2)
Area of National Forest Park
(hm2)
Total Tourists
(104)
Overseas Tourists
(104)
200414,601,855.8010,586,692.6714,745.03448.26
200515,134,174.7011,051,517.3017,427.19541.73
200615,693,203.3111,252,047.1321,321.77543.56
200715,974,702.4811,249,409.9324,746.00714.00
200816,298,336.0011,432,664.0027,379.00693.00
200916,525,010.0011,519,312.0033,287.00912.00
201016,776,936.0011,776,635.0039,611.001077.00
201117,063,066.0011,764,849.0046,808.001207.00
201217,382,116.0012,051,117.0054,797.001542.00
201317,580,006.0012,143,291.0058,948.002169.00
201417,805,428.0012,260,972.0070,987.001371.00
201518,017,072.0012,510,602.0079,512.001414.00
201618,866,757.0013,200,939.0091,682.001498.00
201720,281,900.0014,410,502.0096,189.001361.00
201818,640,888.0012,819,329.0098,638.001572.00
201918,607,393.0012,799,963.00105,884.001896.00
Mean17,203,052.7712,051,865.1355,122.621184.97
SD1,501,128.30950,471.3331,651.62508.96
Min14,601,855.8010,586,692.6714,745.03448.26
Max20,281,900.0014,410,502.00105,884.002169.00
Table 4. The touristic ecological footprint of forest parks in China from 2004 to 2019.
YearTouristic Ecological FootprintTouristic Ecological CapacityTouristic Ecological Surplus and Deficit
Total (104 hm2)Per Capita (hm2)Total (104 hm2)Per Capita (hm2)Total (104 hm2)Per Capita (hm2)
20042058.86170.13961770.62100.1201−288.2406−0.0195
20052133.91860.12241835.17000.1053−298.7486−0.0171
20062212.74170.10381902.95780.0892−309.7838−0.0145
20072252.43300.09101937.09240.0783−315.3406−0.0127
20082298.06540.08391976.33620.0722−321.7292−0.0118
20092330.02640.07002003.82270.0602−326.2037−0.0098
20102365.54800.05972034.37130.0514−331.1767−0.0084
20112405.89230.05142069.06740.0442−336.8249−0.0072
20122450.87840.04472107.75540.0385−343.1230−0.0063
20132478.78080.04212131.75150.0362−347.0293−0.0059
20142510.56530.03542159.08620.0304−351.4791−0.0050
20152540.40720.03192184.75020.0275−355.6570−0.0045
20162660.21270.02902287.78300.0250−372.4298−0.0041
20172859.74790.02972459.38320.0256−400.3647−0.0042
20182628.36520.02662260.39410.0229−367.9711−0.0037
20192623.64240.02482256.33250.0213−367.3099−0.0035
Table 5. Ecological footprint and ecological carrying capacity of forest parks in Chinese provinces.
Province2004200920142019
EFECEFECEFECEFEC
Anhui19.5410.2922.3311.6238.3013.0554.0813.57
Beijing12.031.179.862.7712.283.4137.063.41
Fujian45.1320.2553.3730.7155.0936.7348.1036.67
Gansu50.4381.5120.3295.2627.58102.4720.3294.25
Guangdong170.8464.28202.4568.87226.3076.51290.6776.33
Guangxi18.652.4113.882.5416.782.5617.322.63
Guizhou36.0817.9935.0422.4067.6823.5541.6624.79
Hainan2.9221.461.7118.965.0823.586.2123.96
Hebei34.0117.8124.3523.2722.8723.9326.5423.79
Henan85.9219.64116.6128.0666.9539.23104.1241.27
Heilongjiang30.80183.8827.37190.4730.29191.2614.56231.35
Hubei26.9624.6929.3029.5243.2832.1647.2632.37
Hunan52.791.9657.193.3575.654.3282.824.93
Jilin61.98516.1453.69519.0842.36526.7216.19180.90
Jiangsu78.872.6288.613.3775.943.2678.266.83
Jiangxi35.7227.0271.4936.3697.2139.2993.9640.30
Liaoning23.5520.6373.4223.9354.4424.5719.6124.18
Inner Mongolia17.05111.6519.81120.6417.23124.6428.03141.42
Ningxia5.234.423.594.429.335.829.617.45
Qinghai3.822.756.682.6310.072.718.012.92
Shandong179.4336.34123.0251.28118.2956.7399.7355.27
Shanxi21.2420.4122.0824.3442.9725.5448.4826.97
Shaanxi31.3920.8239.3923.9827.7027.4426.7428.77
Shanghai14.260.5128.190.5425.090.6318.090.51
Sichuan85.650.6553.170.6563.610.6753.892.06
Tianjin0.680.310.770.130.710.130.830.13
Tibet2.07124.051.92124.642.73126.793.61113.17
Xinjiang25.69182.7316.87270.9645.88348.2915.76380.47
Yunnan8.6116.9720.4917.0922.9117.1517.0620.86
Zhejiang57.939.1661.6411.1255.6812.6959.3813.64
Chongqing28.4910.7789.4211.1897.8512.01103.6811.74
Table 6. Standard deviation ellipse and center of gravity migration results.
YearThe Center of Gravity CoordinateDisplacement of Center of GravityCenter of Gravity
Position
Ellipse Perimeter
(km)
Ellipse Area (km2)RotationOblateness
LongitudeLatitudeDirectionDistance
(km)
2004105°13′38″ E41°31′42″ N--Wulanchabu12,624.208,244,50077.80°0.75
2005104°50′34″ E41°32′17″ NNorthwest85.79Wulanchabu12,812.808,323,21079.05°0.76
2006109°50′24″ E41°56′57″ NNorthwest100.12Wulanchabu12,870.908,026,70079.71°0.77
2007110°19′23″ E41°54′40″ NNortheast16.50Wulanchabu12,807.707,966,74079.70°0.77
2008110°05′52″ E41°48′39″ NSouthwest72.51Wulanchabu12,785.407,871,85079.76°0.78
2009110°11′57″ E41°43′24″ NSouthwest33.22Baotou12,816.707,923,75079.86°0.78
2010110°02′22″ E41°45′57″ NSoutheast5.08Baotou12,851.308,092,16079.89°0.77
2011109°54′50″ E41°46′09″ NNorthwest25.98Baotou12,688.907,259,64080.05°0.80
2012110°53′10″ E41°51′37″ NSouthwest109.08Baotou12 806.407,377,10080.62°0.80
2013111°00′17″ E41°42′35″ NSoutheast13.96Baotou12,851.607,615,09080.66°0.79
2014110°59′01″ E41°44′24″ NSoutheast18.90Baotou12,947.008,044,76080.50°0.78
2015111°16′46″ E41°46′11″ NNorthwest17.22Baotou12,936.908,017,88080.91°0.78
2016111°54′16″ E41°54′26″ NNortheast29.19Baotou12,977.208.091.78080.80°0.78
2017111°46′06″ E41°51′47″ NNorthwest54.08Baotou13,105.108,254,17081.04°0.78
2018112°39′55″E41°48′50″ NSouthwest559.62Bayan Nur13,201.208,512,81079.96°0.77
2019113°25′36″ E41°43′30″ NSoutheast42.82Alxa League13,316.309,022,38080.00°0.76
Table 7. Comparison of predicted and actual touristic ecological footprints of forest parks in China.
YearEFef
Observed ValueFitted ValueDeviation%Observed ValueFitted ValueDeviation%
20052133.91862176.9888−43.0702−2.01840.12240.11880.00362.9533
20062212.74172213.2536−0.5119−0.02310.10380.1045−0.0007−0.6953
20072252.43312250.12252.31060.10260.0910.0919−0.0009−0.9642
20082298.06542287.605510.45990.45520.08390.08080.00313.7074
20092330.02642325.7134.31350.18510.070.0711−0.0011−1.5363
20102365.5482364.45521.09280.04620.05970.0625−0.0028−4.6569
20112405.89232403.84282.04950.08520.05140.055−0.0036−6.9312
20122450.87842443.88666.99180.28530.04470.0483−0.0036−8.063
20132478.78082484.5974−5.8166−0.23470.04210.0425−0.0005−1.0959
20142510.56532525.9864−15.421−0.61420.03540.0374−0.002−5.6949
20152540.40722568.0648−27.6577−1.08870.03190.0329−0.0009−2.8971
20162660.21272610.844249.36851.85580.0290.02890.00010.3485
20172859.74792654.3363205.41167.18290.02970.02540.004314.4236
20182628.36522698.5528−70.1876−2.67040.02660.02240.004316.0194
20192623.64242743.5059−119.8635−4.56860.02480.01970.005120.5511
Table 8. Comparison of predicted and actual values of the touristic ecological carrying capacity of forest parks in China.
YearECec
Observed ValueFitted ValueDeviation%Observed ValueFitted ValueDeviation%
20051835.171872.2104−37.0404−2.01840.10530.10220.00312.9529
20061902.95781903.3981−0.4403−0.02310.08920.0899−0.0006−0.6952
20071937.09241935.10531.98710.10260.07830.079−0.0008−0.964
20081976.33621967.34078.99550.45520.07220.06950.00273.7066
20092003.82272000.11313.70960.18510.06020.0611−0.0009−1.536
20102034.37132033.43150.93980.04620.05140.0538−0.0024−4.6556
20112069.06742067.30481.76250.08520.04420.0473−0.0031−6.929
20122107.75542101.74256.01290.28530.03850.0416−0.0031−8.0601
20132131.75152136.7538−5.0022−0.23470.03620.0366−0.0004−1.0954
20142159.08622172.3483−13.2621−0.61420.03040.0322−0.0017−5.6923
20152184.75022208.5358−23.7856−1.08870.02750.0283−0.0008−2.8956
20162287.7832245.32642.45691.85580.0250.02490.00010.3483
20172459.38322282.7292176.6547.18290.02560.02190.003714.4157
20182260.39412320.7554−60.3613−2.67040.02290.01920.003716.0097
20192256.33252359.4151−103.0826−4.56860.02130.01690.004420.5377
Table 9. Prediction of touristic ecological footprint and ecological carrying capacity of forest parks in China.
EFefECec
20202789.207830.017292398.718740.01487
20212835.671090.015212438.677130.01308
20222882.908330.013382479.301170.0115
20232930.932470.011762520.601920.01012
20242979.75660.010342562.590680.0089
20253029.394050.00912605.278890.00782
20263079.858380.0082648.678210.00688
20273131.163360.007042692.800490.00605
20283183.322980.006192737.657760.00532
20293236.351490.005442783.262280.00468
Disclaimer/Publisher’s Note: The statements, opinions and data contained in all publications are solely those of the individual author(s) and contributor(s) and not of MDPI and/or the editor(s). MDPI and/or the editor(s) disclaim responsibility for any injury to people or property resulting from any ideas, methods, instructions or products referred to in the content.

