Article

Assessment of Climate Change and Land Use/Land Cover Effects on Aralia elata Habitat Suitability in Northeastern China

1
Liaoning Institute of Forest Management, Dandong 118002, China
2
CAS Key Laboratory of Forest Ecology and Management, Institute of Applied Ecology, Chinese Academy of Sciences, Shenyang 110016, China
3
Liaoning Shenyang Urban Ecosystem Research Station, National Forestry and Grassland Administration, Shenyang 110164, China
4
Shenyang Arboretum, Chinese Academy of Sciences, Shenyang 110016, China
*
Authors to whom correspondence should be addressed.
Forests 2024, 15(1), 153; https://doi.org/10.3390/f15010153
Submission received: 15 November 2023 / Revised: 5 January 2024 / Accepted: 9 January 2024 / Published: 11 January 2024
(This article belongs to the Section Forest Ecology and Management)

Abstract

:
Climate change and land use/land cover (LULC) change have received widespread attention as the two main factors contributing to the shrinking of plant habitats. However, the different effects of these factors on understory economic tree species are not clear. This is not conducive to the conservation and exploitation of forest resources. Here, we used species distribution modeling to predict the extent to which climate change and LULC change will affect changes in suitable habitats for A. elata under different scenarios in the future. The results showed the suitable habitat to be located in the Changbai Mountain Range in northeast China. The current area is 110,962 km2. The main variables that affect the suitable habitat are annual precipitation, LULC, slope, and mean diurnal range. The percentage contributions are 31.2%, 16.8%, 12.8%, and 12.3%, respectively. In the 2070s, the area of high-quality (moderately and highly) suitable habitat was reduced by an average of 6.05% when climate alone changed, and by an average of 10.21% when land use alone changed. When both factors changed together, there was an average decrease of 9.69%. When climate change and land use change acted together, the shrinking area of suitable habitat did not suddenly increase. These findings help to identify potentially suitable habitats for A. elata and to carry out conservation and exploitation efforts to ensure sustainability.

1. Introduction

Climate change has become a global issue and is recognized as one of the causes of negative impacts such as the loss of species diversity [1,2]. The increase in extreme weather will continue in the future with global warming. Climate change is driving global species redistribution, which poses a serious challenge to the survival of endangered species [3,4]. It has been shown that nearly two-thirds of all species in the Indonesian region will lose their climatically favorable areas under future climate scenarios [5]. In addition, land use/land cover (LULC) changes caused by human activities have been significant as a result of the accelerated urbanization process since the 20th century. Climate change and land use change are widely recognized as key influences on biodiversity decline and range shifts [6]. The localized extinction of species that this causes is already widespread, and most of the plants that are not extinct will continue to shrink their habitats due to the combined effects of the two factors [7,8].
Species distribution modeling (SDM) is an effective tool for studying the extent of the suitable habitat for a species and for systematic conservation efforts [9,10]. The generalized additive model (GARP) [11,12], the domain model (DOMAIN) [13], the bioclimatic model (BIOCLIM) [14], the niche factor analysis model (ENFA) [15], and the maximum entropy model (MaxEnt) [16] are commonly used for ecological responses and the distribution areas of a species. Compared with other models, MaxEnt is widely used because of its accurate prediction effect, wide application, and simple operation [16,17].
As an understory economic tree, Aralia elata is a small member of the family Araliaceae, which is widely distributed in northeast China. Its roots, bark, stems, and leaves can be used medicinally to treat rheumatoid arthritis, insomnia, and other inflammation-related diseases [18,19]. In addition, the buds of A. elata can be eaten in spring, and are rich in vitamins and taste delicious. In view of this, A. elata is known as a medicine food homology plant. It has been widely planted in the northeast region, with planting areas of 102 km2, 87 km2, and 63 km2 in Hengren County, Qingyuan County, and Kuandian County, respectively [20]. It has become a pillar industry of the local economy with remarkable economic benefits, and its selling price is usually 50–80 RMB/kg. However, with climate change and LULC change, the outlook for the habitat of wild A. elata is not optimistic.
Climate change and LULC change have led to the migration or shrinkage of suitable habitats for some endangered species. Previous similar studies have not explored the separate effects of climatic and LULC factors on suitable habitats [21,22,23,24]. In addition, few studies have focused on the effects of climate change and LULC change on the suitable habitat changes of understory economic tree species. Therefore, clarifying the main environmental factors affecting the distribution of Aralia species is urgently needed in order to clarify a protection strategy.
In order to fill these knowledge gaps in the northeast and to promote the forest economy, we aim to achieve the following: (1) predict the suitable habitat for aralia in the present and future, (2) determine the impacts of climate change and LULC change on the suitable habitat of aralia, and (3) clarify the future direction of aralia as an understory economic tree species for conservation and sustainable development and utilization.

2. Materials and Methods

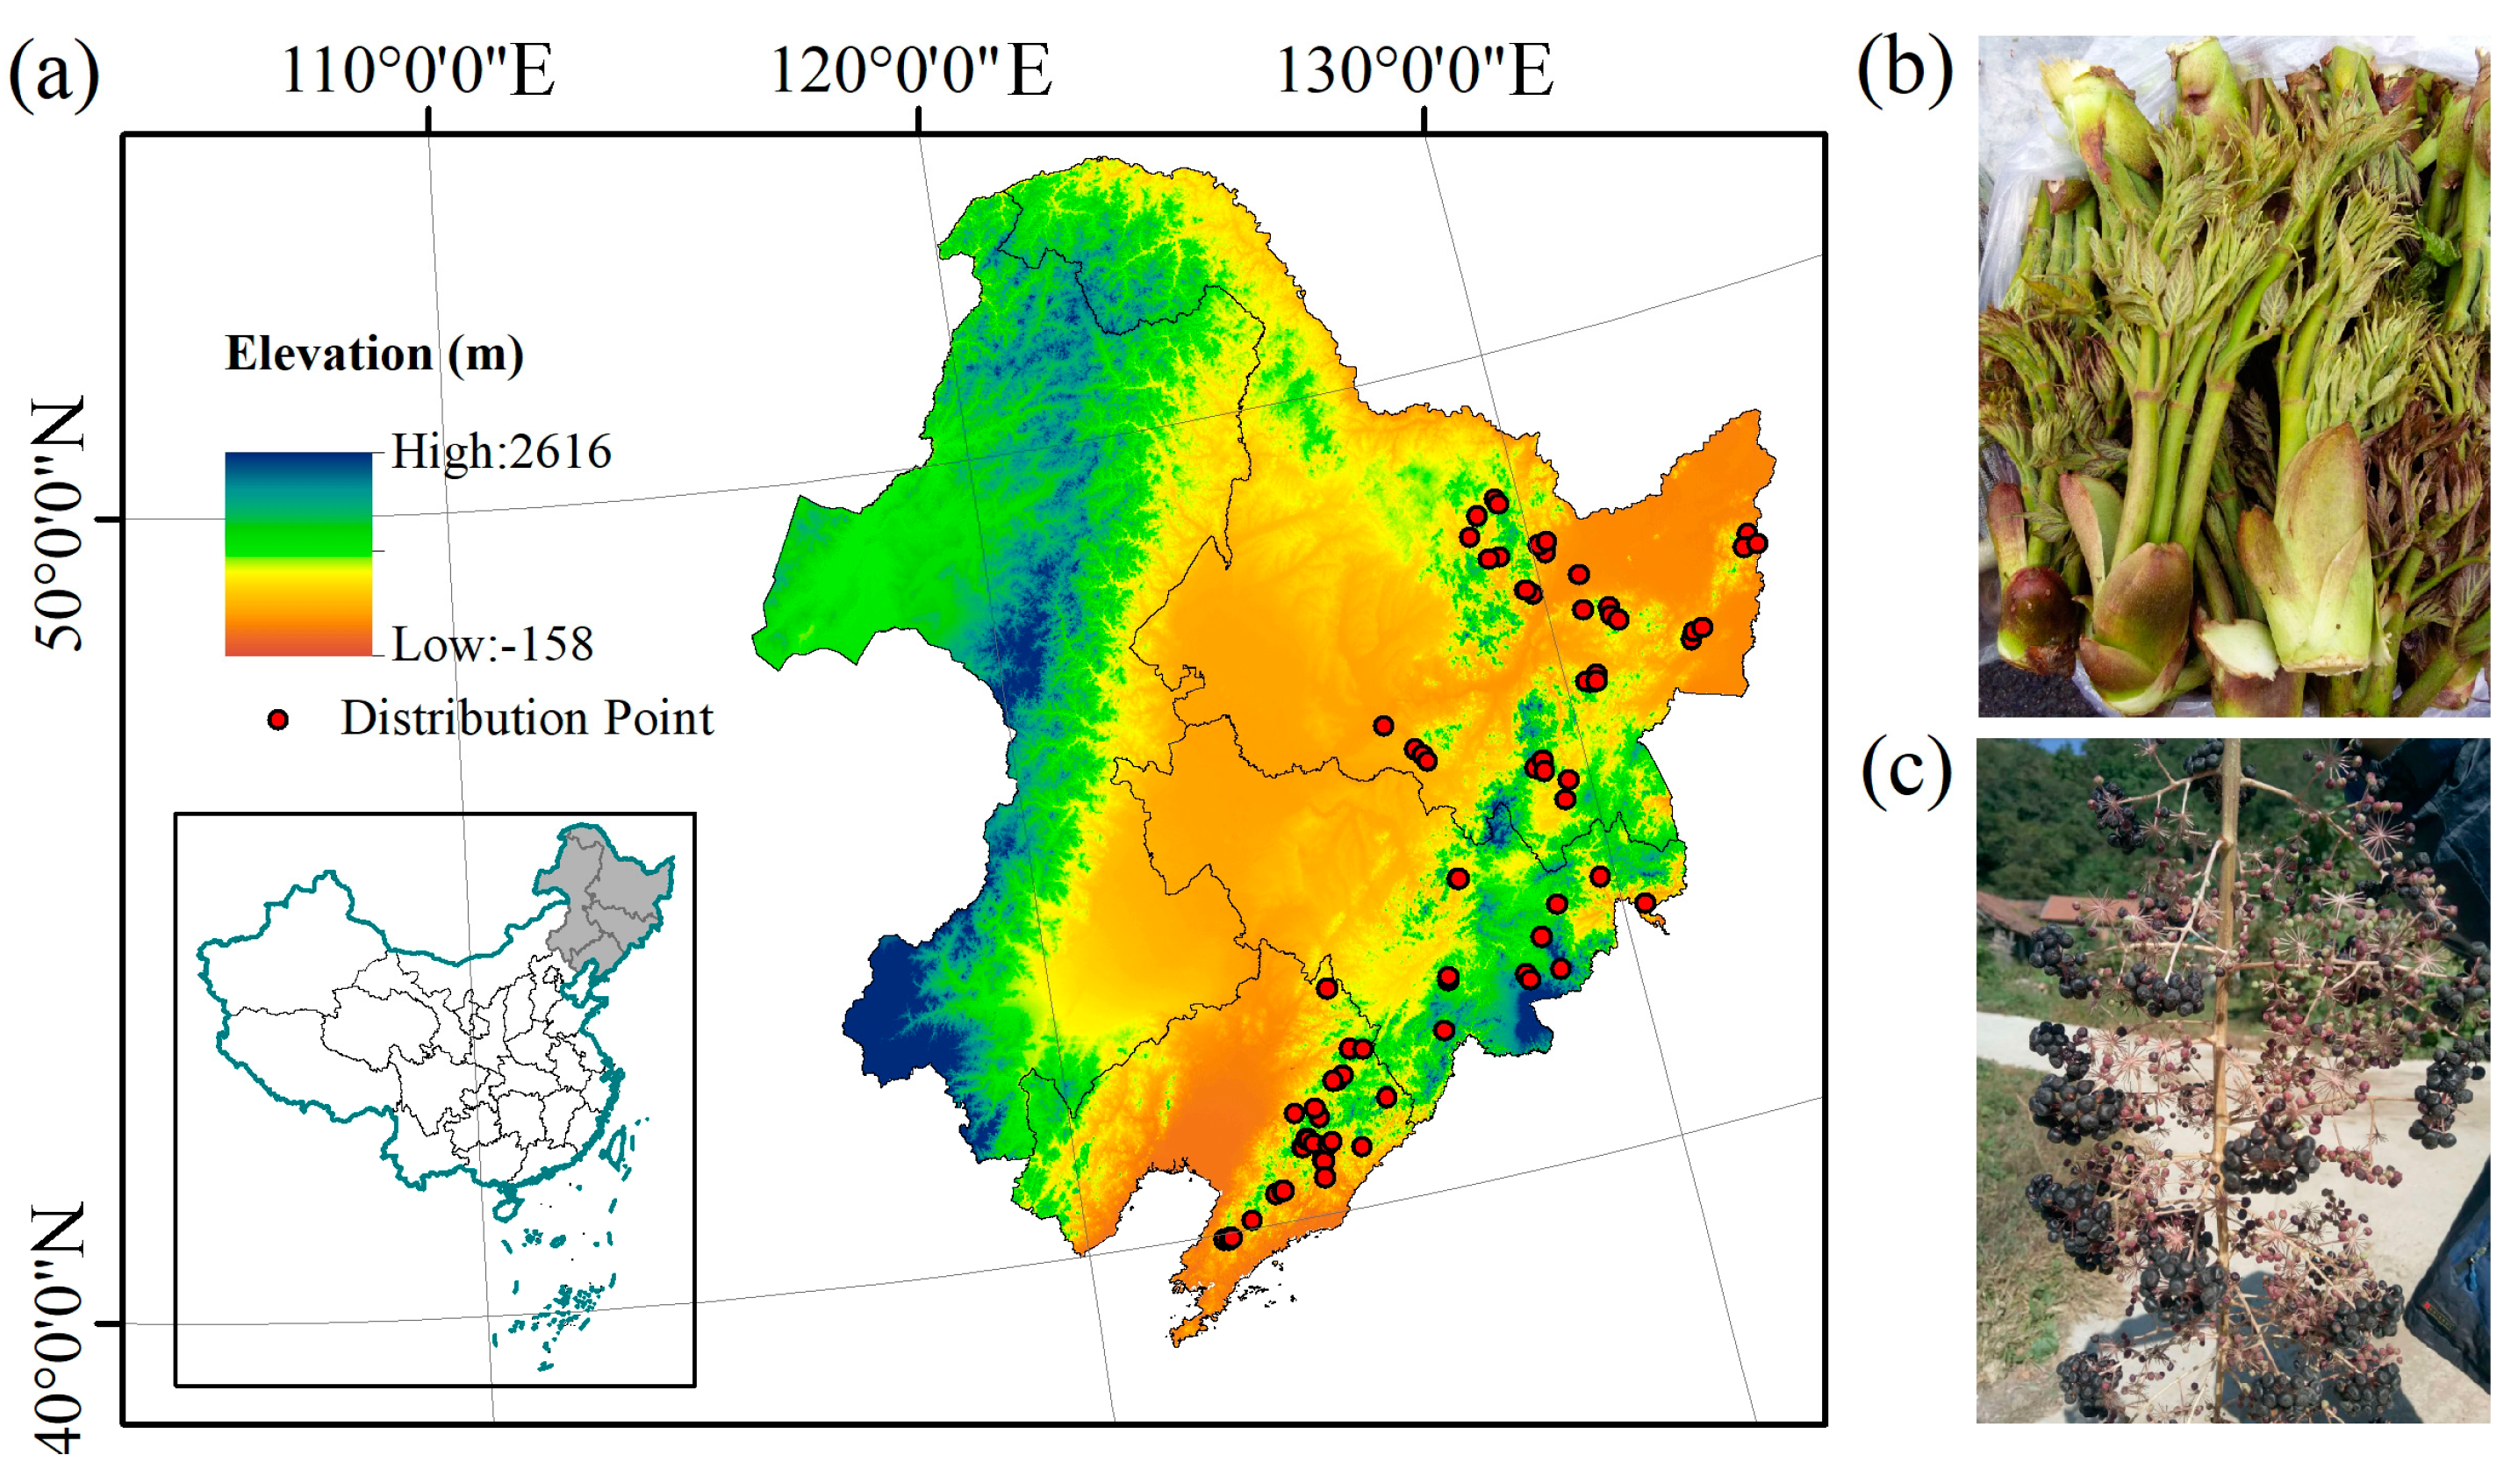
2.1. Study Area and Species Data

The study area is northeast China. The northeastern region of China includes parts of Heilongjiang, Jilin, Liaoning, and the Inner Mongolia Autonomous Regions (Figure 1). The Changbai Mountain region in the east has always been the richest in biodiversity in this area and is important for regional biodiversity conservation.

2.2. Species Data

We conducted an extensive field survey of A. elata distribution in the northeastern region during 2021 and collected a total of 90 data records documenting aralia occurrence. A total of 61 A. elata distribution data points were collected using the Global Biodiversity Information Facility (GBIF: https://www.gbif.org, last accessed 21 September 2023), the Chinese Virtual Herbarium (https://www.cvh.ac.cn, last accessed 21 September 2023), the Teaching Specimen Resource Sharing Platform (THRSP: https://mnh.scu.edu.cn, last accessed 21 September 2023) and published literature [25,26], for a total of 151 records. The data tend to be highly similar due to their collection from multiple data sources. At the same time, in order to reduce the spatial autocorrelation of the data and to ensure that the distance between any two occurrence records is greater than 1 km, we used ArcGIS 10.6 to de-duplicate and eliminate points that were too close [27]. Finally, the model was run using 70 A. elata emergence data records to satisfy the sample size requirement for modeling.

2.3. Climate Data

We selected 19 bioclimatic variables from the World Climate Database (https://www.worldclim.org/, accessed on 8 September 2023) at a resolution of 1 km [28]. Future climate variables are selected from future data projected by the BCC-CSM2-MR model of the World Climate Database. This data is projected through Shared Socio-Economic Pathways, and Typical Concentration Pathways Combined Scenarios (SSP) from the latest Coupled Model Intercomparison Project Phase 6 (CMIP6). e.g., SSP126 (low forcing scenario), SSP245 (medium forcing scenario), SSP370 (medium-to-high forcing scenario), and SSP585 (high forcing scenario). The model was able to reasonably simulate climate change trends in this region of China [29].

2.4. Land Use/Land Cover Data

Future LULC change data in species distribution research has always been the focus of such research [30]. The spatial resolution of the future LULC dataset is 1 × 1 km. This dataset was obtained by Liao et al. [31] based on the Land Use Harmonization (LUH2) datasets using the newly developed Future Land Uses Simulation (FLUS), and it has been verified that the FLUS model performs better for predicting long-term LULC changes. The land use data were divided into six categories: 1: woodland; 2: grassland; 3: unused land; 4: cultivated land; 5: city; 6: water area. The future LULC change corresponds to the Climate simulation data under four SSP scenarios.

2.5. Additional Environmental Variables

Additional data are necessary because species distribution is also affected by factors other than climatic factors and land use factors. Although some of these factors will also change in the future, we assume here that these variables will not change in the future. This is because considering some variables to be static environmental variables can achieve better, or at least no worse, modeling results than ignoring them. The importance of this is especially significant when the dynamic variables interact with these static variables [32]. Topographical factors indirectly influence temperature, light, and moisture [33]. The topographical factors in this study incorporated data from three variables: elevation, slope, and slope direction. Slope and slope direction were produced using ArcGIS 10.6 software based on the digital elevation model. Soil is an important factor for plant survival, and often the use of soil factors can lead to better performance in species distribution models [34,35]. Soil data were used in this study for a total of five variables: soil bulk, soil clay, soil organic carbon, soil silt, and soil pH. Human activity data were obtained from The Socioeconomic Data and Applications Center (http://sedac.ciesin.columbia.edu, accessed on 17 July 2023).

2.6. Data Processing

A total of 29 environmental variables were collected in this study (Table A1). However, environmental variables are often correlated with each other, and we utilized the SDXtoolbox multicollinearity test to screen for variables that are correlated with each other in some way. When the absolute value of the correlation coefficient between any 2 environmental variables was greater than or equal to 0.8, the degree of contribution of the 2 variables in the MaxEnt model was compared, and the environmental variable with the higher contribution was retained [23]. We ultimately selected 15 environmental variables for modeling out of 28 (Table 1).

2.7. Species Distribution Model

We used a MaxEnt model to predict potentially suitable habitats for aralia under current and future climatic conditions. MaxEnt, as a universal machine learning model, performs well and has high predictive ability using only presence data and a small number of samples. It also has advantages such as short computation time and simple operation. Based on the comparison of species emergence and environmental data, it can estimate the relative distribution of species. MaxEnt has been widely used and has excellent performance in modeling the geographic distribution of species [36,37]. In a single model, MaxEnt is able to generate distributions with similar accuracy to the integrated modeling approach [38]. We utilize 25% of aralia distribution data as a test set for validation and 75% of aralia distribution data as a training set to build the model. The number of iterations is 5000, and the model is set to repeat 10 times; Bootstrap is used as the operation type. Default values were used for other parameters. To determine the accuracy of the model, we calculated the area under the curve (AUC) of the receiver operating characteristic (ROC). The accuracy of the model predictions was evaluated using the AUC values. AUC values ranged from 0 to 1. The closer the AUC value converged to 1, the better the model performed. It is generally accepted that with an AUC greater than 0.9, the structure predicted by the model can be adopted [39,40].

2.8. Threshold Delineation and Spatial Analysis of Suitable Habitats

It is important to select appropriate thresholds for transforming the values of the continuous distribution predicted by the model into suitable and unsuitable regions [41]. We categorized suitable habitats into four classes based on distribution site habitat suitability values and normal distribution parameters, μ and δ: unsuitable habitat (0, μ − δ), poorly suitable habitat (μ − δ, μ), moderately suitable habitat (μ, μ + δ), and highly suitable habitat (μ + δ, 1) [42]. Unsuitable habitats are areas that are unfavorable for aralia growth and severely limited by environmental factors; poorly suitable habitats are areas where aralia can grow normally to some extent but that are less suitable; moderately suitable habitats are areas that are more suitable for aralia growth but not as suitable as highly suitable habitats; and highly suitable habitats are areas that are most suitable for aralia growth and where there is no limitation on its growth and development.
The Getis–Ord Gi method identifies regions of statistically significant hot and cold spots with global autocorrelation [43]. We used ArcGIS 10.6 software for hotspot analysis, and the hot spots in the spatial region were located in the priority conservation area of aralia under the current climate conditions. Meanwhile, in order to clarify the trend in the spatial pattern of suitable habitats under current and future climate scenarios, the distribution changes between the binary SDMs tool in SDMtoolbox2.5 was used to calculate the spatial changes of suitable areas, and the centroid changes tool was used to explore the migration of the suitable habitat center of mass.

3. Results

3.1. Model Performance Optimization and Calculation Results

We assessed the accuracy of the MaxEnt model using the AUC values. The mean model AUC values are above 0.95 in different periods under current and future conditions, indicating excellent model accuracy (Figure 2). Therefore, the MaxEnt model is reliable in predicting the suitable habitat of A. elata under different scenarios and can be used to analyze the effects of climate change and LULC change on the suitable habitat of A. elata.

3.2. Main Environmental Variables and Response Curves

The importance of each environmental variable was determined using the jackknife test in the MaxEnt model (Figure 3). In terms of the contribution of environmental variables, bio12, bio15, bio1, Hf, LULC, bio2 are the dominant variables with a cumulative contribution of 87.1. In terms of the importance of environmental variables, bio15, bio2, bio12, hf, bio1, and LULC are the dominant variables, with a cumulative importance value of 84.2. However, the training gain, AUC, and test gain adjusted when using only bio1 in testing were lower than when using only LULC (Figure 3). This suggests that LULC is more important for predicting outcomes. Thus bio12, bio15, bio2, hf, and LULC were the dominant variables affecting aralia distribution. In addition, the species response curve can reflect the relationship between the presence probability of aralia and environmental variables (Figure 4). We take the value of the environmental variable as the appropriate range when the probability of A. elata’s presence is greater than 0.6. Bio12 responded positively to the probability of A. elata presence, indicating that the climatic range in which bio12 > 201.5 mm was more suitable. Woodland was the most suitable of the six LULC types; the slope showed a single-peak effect, and a slope of about 2° was the most suitable slope range. Bio2 responded negatively to the probability of A. elata presence, and the climatic range in which Bio2 < 12.65 °C was more suitable.

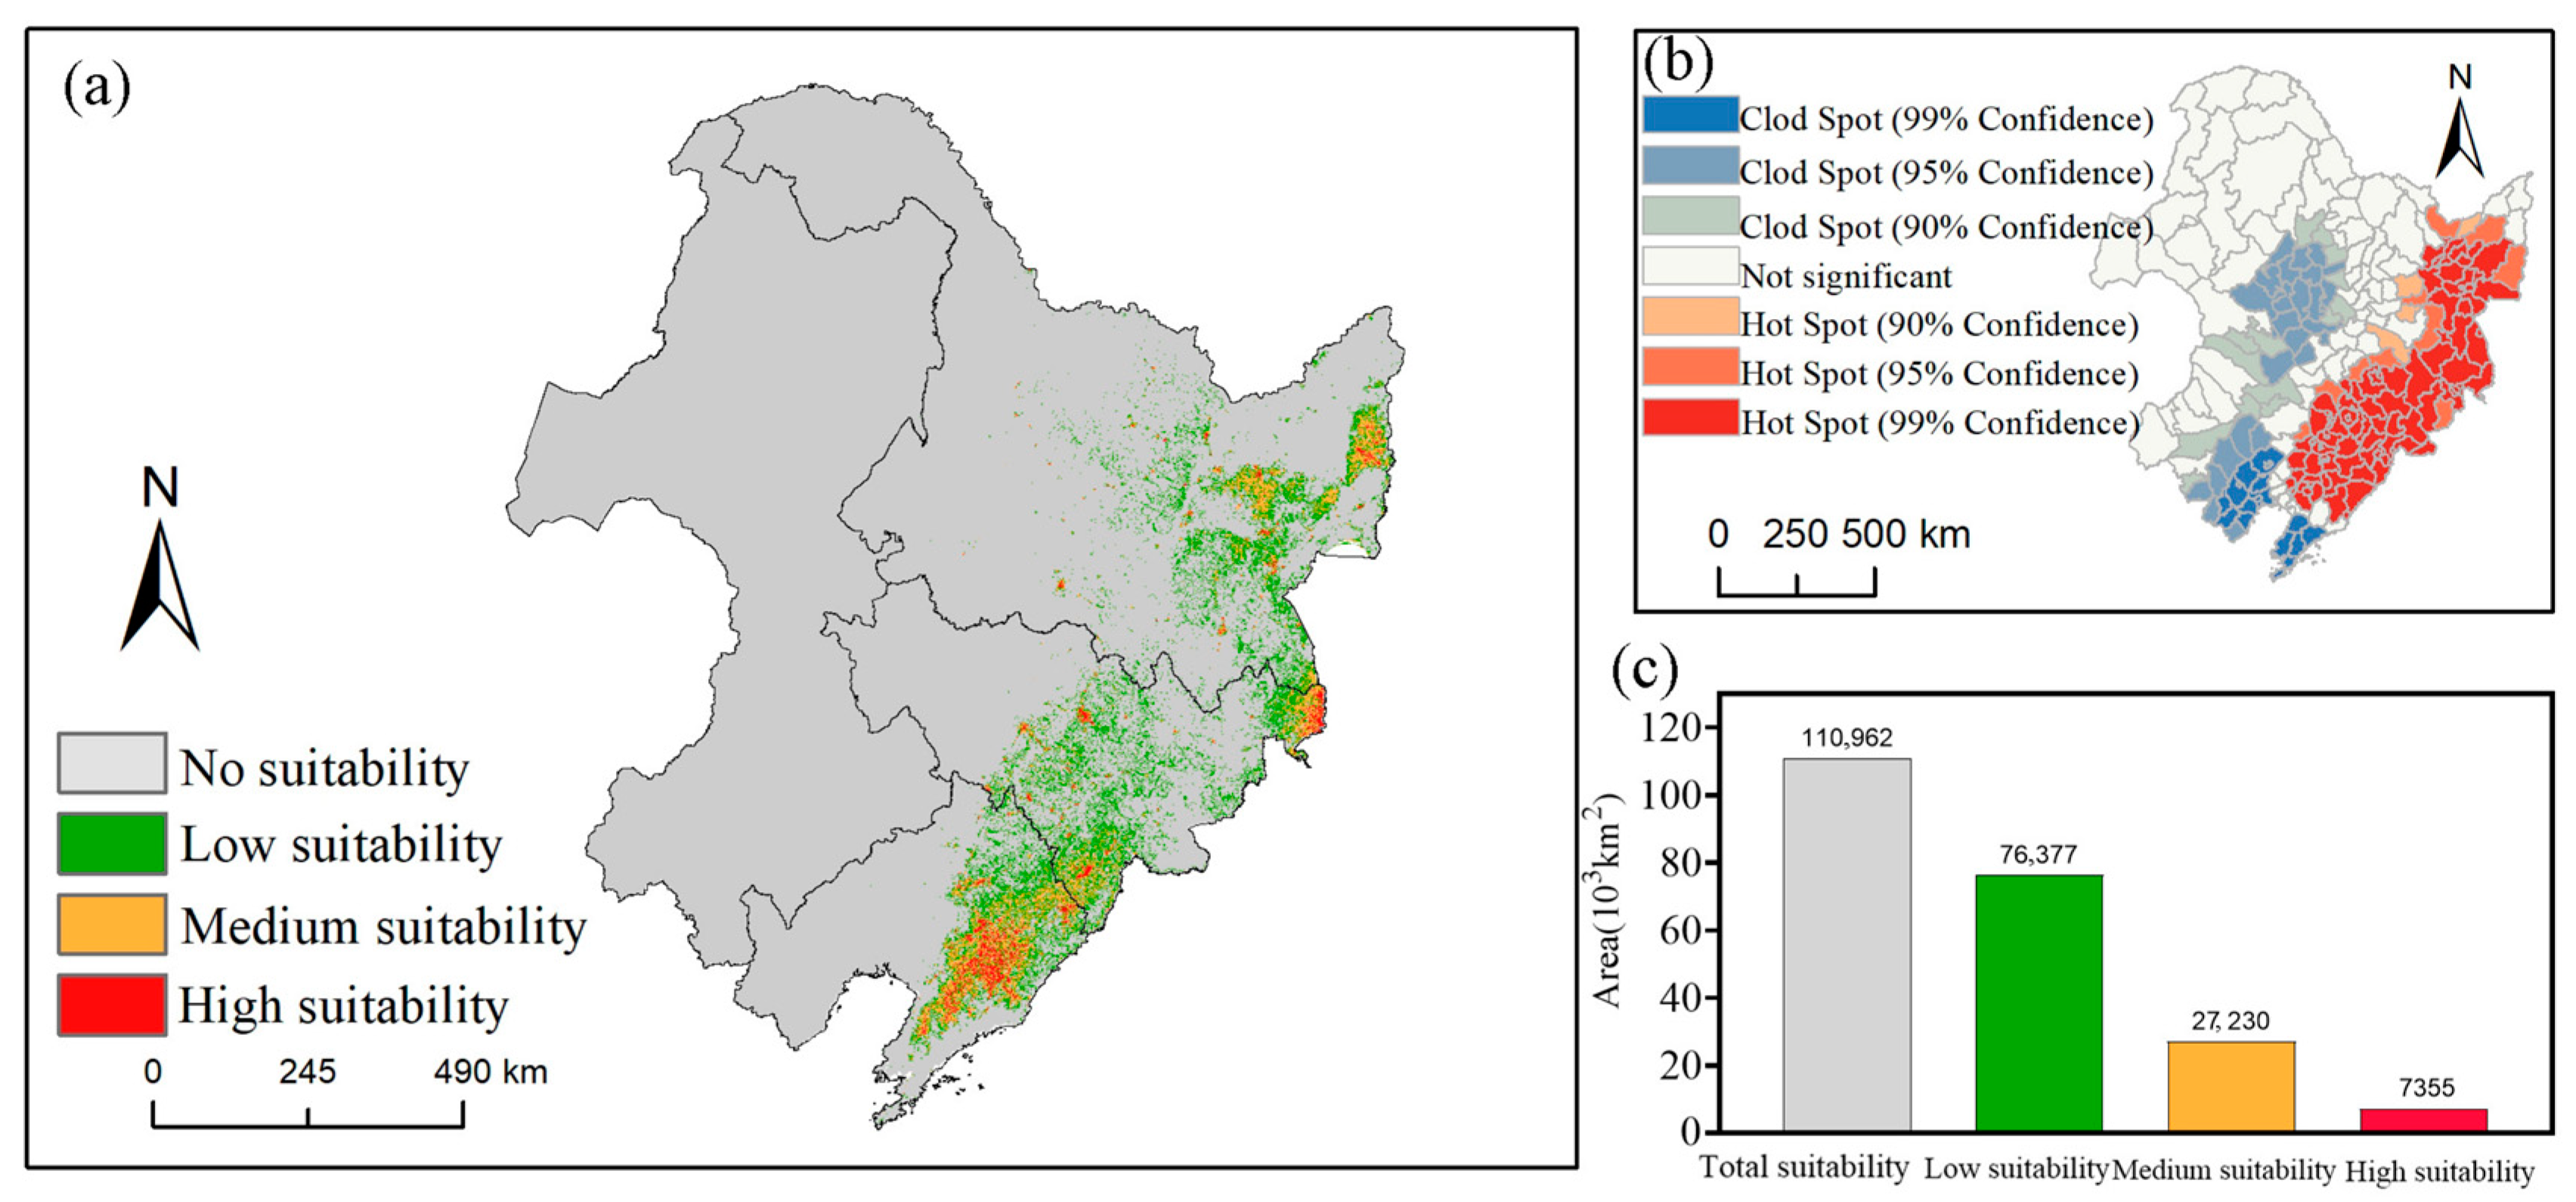
3.3. Current Suitable Habitat

Based on the data of aralia distribution points and various environmental data, we obtained the distribution ranges for poorly, moderately, and highly suitable habitats in the current period (Figure 5). Under the current environmental conditions, the area of the suitable habitat for aralia in northeastern China is 110,962 km2. Of this, 24.54% was in moderately suitable areas; 6.63% was in highly suitable areas; and 68.83% was in the largest areas of poorly suitable habitat but were more dispersed overall. The moderately suitable habitat was located outside of the highly suitable habitat. The cold- and hot-spot analysis showed that the suitable habitats were concentrated in the eastern districts and counties. The counties in the central plains are cold spots.

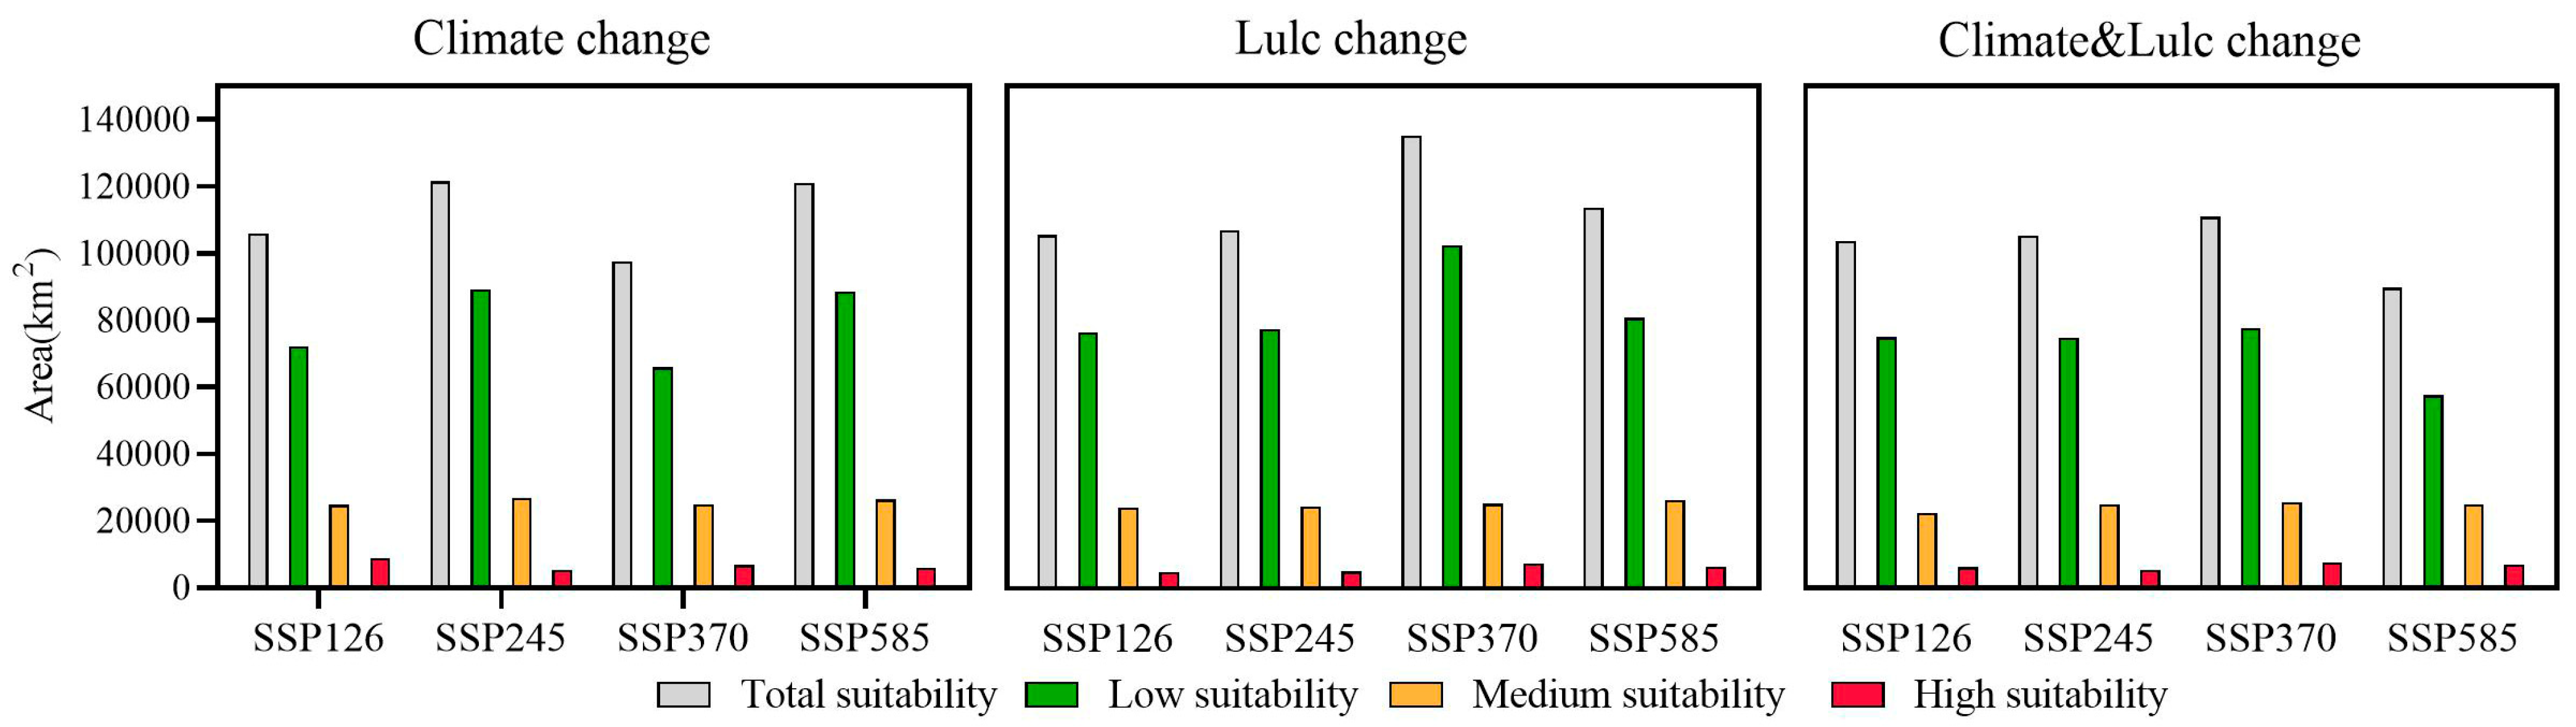
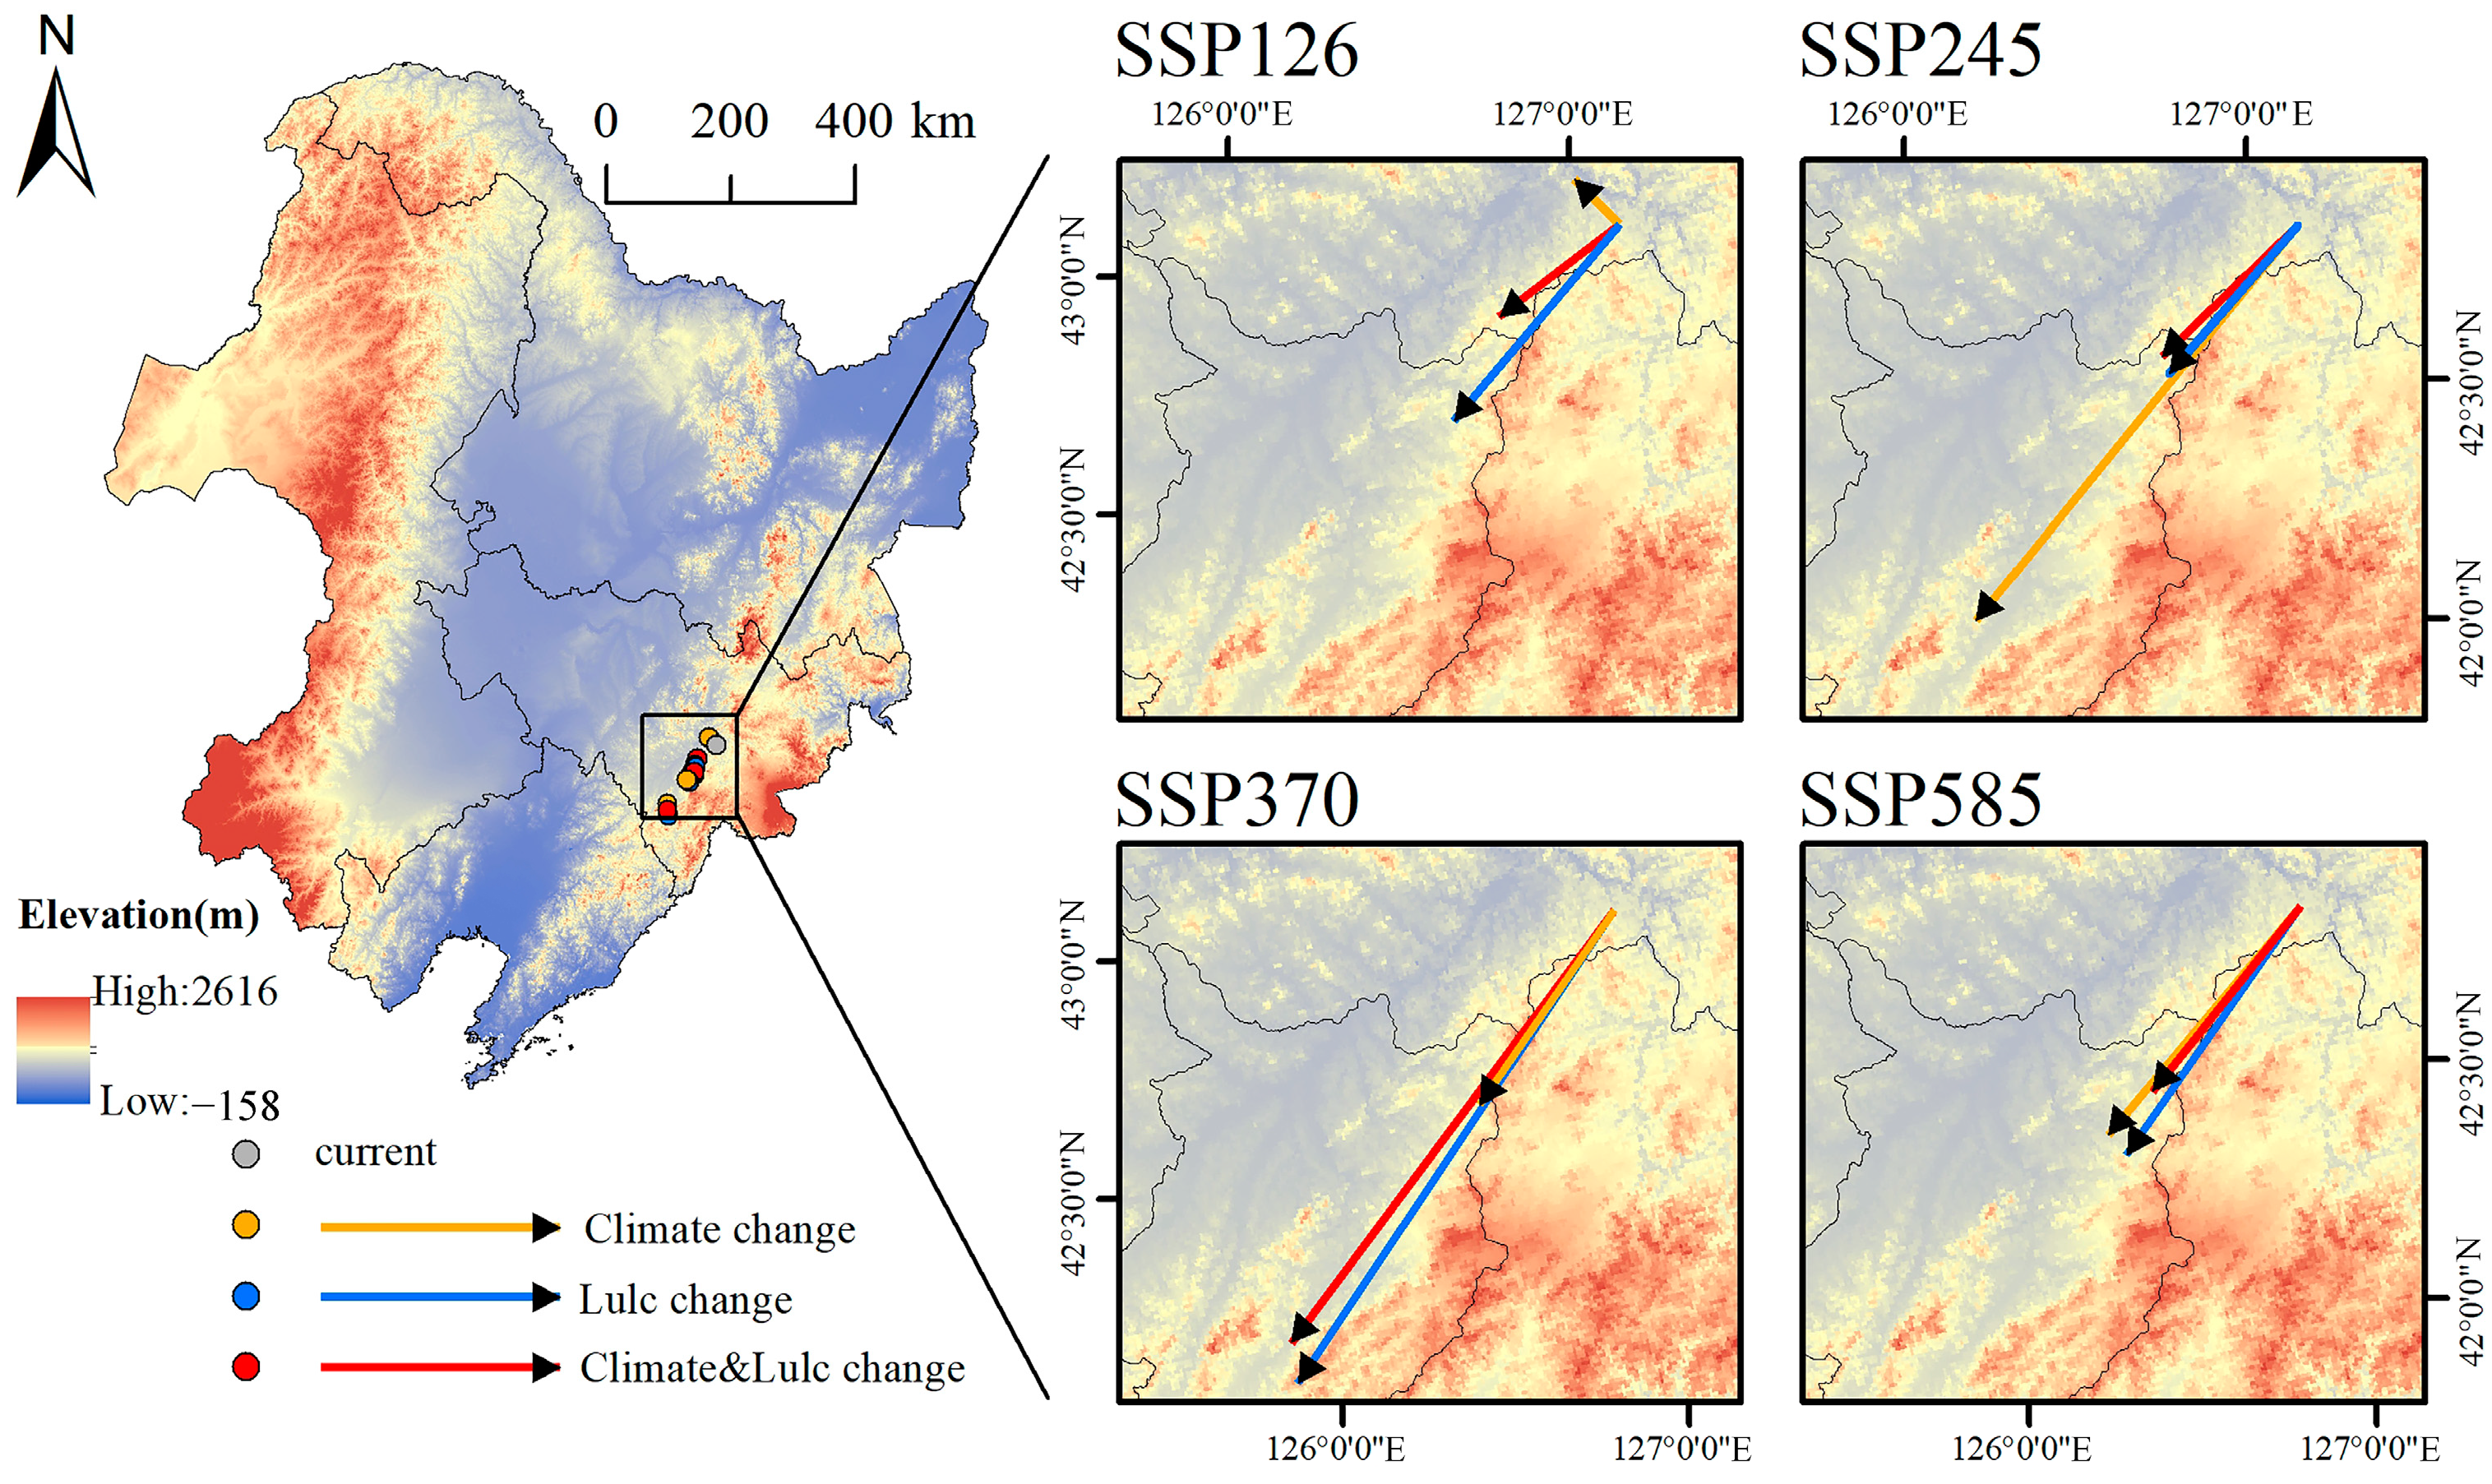
3.4. Future Suitable Habitats

The prediction results of suitable habitats of A. elata in different situations in the future are shown in Figure 6. In the future, its suitable habitat will remain mainly in the eastern part of the northeast region. When focusing on the possibility of future climate change, influenced by climate change and LULC changes, we found that most of the current total suitable habitat for A. elata showed shrinkage, and a few areas showed increases (Figure 7). When focusing on moderately and highly suitable habitats, we found that the suitable habitat for A. elata showed shrinkage in all scenarios. Under the four future climate scenarios, moderately and highly suitable habitats were reduced by 16.95%, 11.61%, 3.30%, and 6.88%, respectively (Table 2). In the low emissions scenario, the area of suitable habitat shrinkage due to climate change is smaller than the area of suitable habitat shrinkage due to LULC changes. The opposite is true under the high emissions scenario. The average reduction in the area of suitable habitat due to climate factors is 6.05% and the average reduction in the area of suitable habitat due to land use factors is 10.21%.
The expansion of moderately and highly suitable habitats was mainly in the eastern part of Liaoning Province, while the eastern part of Heilongjiang Province and some other scattered areas were the main areas of A. elata habitat shrinkage (Figure 8). In addition, some of the suitable habitats distributed in the Heilongjiang region were more stable under the low-emission scenario and shrank under the high-emission scenario in which only climatic factors varied. The opposite is true where only LULC changes. The suitable habitat shrinks in the low-emission scenario and stabilizes in the high-emission scenario. Overall, the extent of suitable habitat shrinkage is mainly located in some low-elevation areas, showing an inward contraction across the existing suitable habitat. The increase in suitable habitat was mainly concentrated in Liaoning Province.
At present, the suitable habitat of A. elata is located south of Jilin City, Jilin Province (Figure 9). The geographical coordinates are 127°6′25″ E and 42°52′55″ N. In the SSP126 scenario, the center of mass migrated in a northwesterly direction under the influence of climate change only, in a southwesterly direction under the influence of LULC change only, and in a southwesterly direction under the combined influence of both factors. In the SSP245, SSP370, and SSP585 scenarios, the center of mass shifted to the southwest. Under conditions influenced only by climate change, the center of mass shifted furthest in the SSP245 scenario. Under conditions influenced only by LULC change, the center of mass shifted furthest in the SSP370 scenario.

4. Discussion

4.1. Effects of Environmental Variables on the Distribution of A. elata

Environmental drivers broadly influence changes in plant distribution [44]. The main factors affecting the survival conditions of aralia as a small tree in the current environment are annual precipitation, seasonality of precipitation, and average diurnal range. These bioclimatic variables also play an important role in the distribution of other plant species in the northeast [42]. This may be due to the large temperature difference and low winter precipitation in the northeast. This also suggests that plants respond differently to climate change, i.e., water availability has a greater impact on plant survival than changes in temperature [45]. This is reflected in many plants, and the suitable habitat of Daphne mucronata is likewise strongly influenced by precipitation [46].
In our study, the suitable habitat of A. elata was mainly distributed in the Changbai Mountain area. Under future climate change scenarios, the suitable habitat will shift southward, mainly due to the loss of suitable habitat in parts of Heilongjiang (Figure 8). However, the influence of climate factors and LULC factors on the suitable habitat changed in different climate scenarios. The area in which suitable habitat will be lost due to LULC factors is greater in the low-emission scenario, and the area in which suitable habitat will be lost due to climatic factors is greater in the high-emission scenario. This is easily explained by the fact that LULC changes in low-emission scenarios lead to permanent changes in LULC types, which fundamentally change the suitable habitat for the species. This is consistent with previous research showing that LULC change is a major threat to biodiversity in the future [47]. However, as emissions in the various climate scenarios increased, climate factors reverted to being the primary influence on the suitable habitat. This may be due to the fact that the influence of climate on species’ suitable habitats is more comprehensive, and as the magnitude of changes in climate factors increases, climate change factors will become the main factors affecting species’ suitable habitats [48]. However, when the two factors are superimposed, LULC change may reduce species’ resilience to climate change by affecting species’ range changes, interspecific relationships, and abundance and thus species’ resilience to climate change. Conversely, climate change may affect the ability of species to cope with LULC change [49]. It has been shown that LULC changes may amplify or buffer the distributional changes expected from climate change impacts, depending largely on the species [50,51]. It is worth noting that in the SSP370 scenario, the area of suitable habitat lost from the combination of the two factors is lower than the area lost from the effects of climate or LULC alone. This also illustrates both the non-cumulative effects of LULC and climate change on biodiversity, with uncertainty in the relationship between the two environmental factors. Exploring the interactions between LULC and climate change will help policymakers to optimize conservation measures [52,53].
Although climate and LULC are the main factors influencing the distribution of species, the detrimental effects of human activities cannot be ignored [54]. The human activity factor ranked sixth among the important factors in the current suitable habitat of A. elata, accounting for 4.7% of the contribution. As a plant with a narrow distribution range in nature, A. elata has considerable medicinal and economic value. Excessive picking once threatened the wild population of A. elata [55]. Moreover, growth in human activities will lead to increased habitat fragmentation, which will indirectly affect the suitable distribution range of species [56]. It has been shown that species with smaller ranges may be more vulnerable than those with wider ranges [57]. Consequently, narrowly distributed species may be replaced by widely distributed species due to the risk of biological homogenization arising from human activities [58]. The formulation of conservation, development, and utilization policies should also take reasonable account of the impact of human activities.

4.2. Conservation Priorities and Optimal Planting Regions

Based on the species distribution model, we predicted the distribution map of the suitable habitat of aralia in northeast China under current and future climatic conditions and analyzed the environmental factors affecting the suitable habitat of aralia, in order to support decision-making surrounding aralia conservation and sustainable development and protection [59]. The results showed that the MaxEnt model performed well and predicted the degree of influence that climate change factors and LULC factors will have on the suitable habitat of A. elata.
We need to weaken the negative impact of different factors on the living environment for effective protection of A. elata [60]. Obviously, in the low-emission scenario, LULC changes pose the greatest threat to the suitable habitat of A. elata. In the SSP126 and SSP245 scenarios, the area is reduced by 16.13% and 14.80%, respectively (Table 2). Therefore, it is necessary to avoid landscape fragmentation of the suitable habitat [61]. The current results show that the suitable habitat is mainly distributed in the eastern part of northeast China under the current climatic conditions. Within this region, the Changbai Mountain area in eastern Liaoning Province has the largest area of highly suitable habitat. In view of the fact that climate change factors are global factors, there are limited ways of addressing climate change in local areas. We can pay more attention to the climate impact factors and potential migration areas of A. elata [51].
A naturally suitable habitat is the basis for the healthy development and renewal of A. elata population. In order to ensure the healthy development of the A. elata population, the current study not only focuses on the protection of A. elata in the wild, but also on the selection of suitable planting areas for artificial cultivation [62]. As a medicine food homology plant, A. elata contains many bioactive products. [63]. In view of the increasing demand for undergrowth products, artificial cultivation of A. elata has become an important development strategy in the non-wood forest products industry. In addition, differences in ecological environment often affect the formation and accumulation of nutrients in A. elata, which in turn affect the quality of A. elata products [19]. It has been demonstrated that suitable environmental factors can improve the quality of medicinal plants, suggesting that high-quality medicinal plants tend to be found in areas of highly suitable habitat [62]. In conclusion, the current habitat map shows that the eastern part of Liaoning Province is the optimal planting area for A. elata.

4.3. Uncertainty and Future Directions of Research

Our study provides a good forecast for predicting the distribution of the suitable habitat for A. elata under future climate and LULC change scenarios. However, we would like to point out that, due to the availability of data and other reasons, the study may be affected by some uncertain factors. For example, the nature reserve network is often able to play a protective role under climate change and is an important means of species protection [64]. However, our study did not pay attention to the improvement of the suitable habitat via the current reserve management, which may cause us to underestimate the suitable habitat range and suitability of A. elata [65]. And there are unsuitable areas, such as construction land and crop land in suitable habitats, which may limit the availability of suitable habitats. In addition, it is counterintuitive that the human footprint responded positively to the probability of A. elata presence in this study. The reason is that some A. elata are distributed in green areas in built-up areas. The resolution of our environmental data was 1 km, which could not reflect detailed characteristics. Despite these limitations, our research is valuable in the sustainable protection and utilization of A. elata. This study can help decision-makers to carry out conservation work for A. elata habitats to offset the negative effects of climate change and LULC factors [66]. Future research can explore more biotic and abiotic factors and synthesize the factors affecting species distribution. The mechanisms of interaction between these factors can be gradually clarified to assist in conservation decision-making.

5. Conclusions

The suitable habitats of A. elata are mainly located in the eastern Changbai Mountain area. Annual precipitation and LULC factors play an important role in the current spatial distribution of A. elata. We projected that LULC factors would have a greater influence on the suitable habitat in the future low-emission scenario, and that climate factors would have a greater influence on the suitable habitat in the future high-emission scenario. In the future, the main suitable habitats in northeast China will decrease, and suitable habitats will migrate southward on the whole. Our results can provide an effective reference for species protection, resource development and the sustainable economic utilization of A. elata.

Author Contributions

X.J.: conceptualization, methodology, formal analysis, data curation, writing—original draft and writing; B.C.: methodology, resources, writing—review and editing, validation; Y.H.: writing—review and editing, funding acquisition. X.L.: investigation, resources, and data curation. All authors have read and agreed to the published version of the manuscript.

Funding

This research was funded by “The National Key Research and Development Program of China, grant number 2022YFF1300500”, “The Applied Basic Research Program of Liaoning Province: Research and Demonstration on the Development and Utilization Technology of Aralia elata Resources in the Eastern Mountainous Areas of Liaoning Province, grant number 2022JH2/101300163”, and “The Forestry Science and Technology Promotion Demonstration Project of Central Finance: Promotion of Larix gmelinii-Aralia elata Composite Management Technology in the Eastern Mountainous Areas of Liaoning Province, grant number Liao (2023) TG08”.

Data Availability Statement

The data presented in this study are available on request from the corresponding author.

Conflicts of Interest

The authors declare no conflicts of interest.

Appendix A

Table A1. Potential environmental variables.
No.CategoryVariablesDescriptionData Sources
1Climate variablesbio1Annual Mean TemperatureWorldClim v2.1
(https//www.Worldclim.org/,
accessed on 8 September 2023)
2bio2Mean Diurnal Range
3bio3Isothermality
4bio4Temperature Seasonality
5bio5Maximum Temperature of Warmest Month
6bio6Minimum Temperature of Coldest Month
7bio7Temperature Annual Range
8bio8Mean Temperature of Wettest Quarter
9Bio9Mean Temperature of Driest Quarter
10Bio10Mean Temperature of Warmest Quarter
11Bio11Mean Temperature of Coldest Quarter
12Bio12Annual Precipitation
13Bio13Precipitation of Wettest Month
14Bio14Precipitation of Driest Month
15Bio15Precipitation seasonality
(coefficient of variation)
16Bio16Precipitation of wettest quarter
17Bio17Precipitation of driest quarter
18Bio18Precipitation of warmest quarter
19Bio19Precipitation of coldest quarter
20Land use/land cover factorLULCLand use/land cover typeThe resource and Environment Science and Data Center (https://www.resdc.cn/, accessed on 8 September 2023) and
(http://www.geosimulation.cn/China_PFT_SSP-RCP.html, accessed on 8 September 2023)
21Top ographic factorsdemElevation above sea level (m)Geospatial data cloud (www.gscloud.cn, accessed on 7 July 2023)
22slopeSlope (°)
23aspectAspect
24Soil factorst_bulkTopsoil bulk (kg/dm3)Soil quality data from the Harmonized World Soil Database (HWSD)
(https://www.fao.org, accessed on 7 July 2023)
25t_clayTopsoil clay (%)
26t_ocTopsoil organic carbon (%)
27t_phTopsoil pH
28t_siltTopsoil silt (%)
29Human ImpactHfHuman footprintThe Socioeconomic Data and Applications Center

References

  1. Garcia, R.A.; Cabeza, M.; Rahbek, C.; Araújo, M.B. Multiple Dimensions of Climate Change and Their Implications for Biodiversity. Science 2014, 344, 486. [Google Scholar] [CrossRef] [PubMed]
  2. Jiang, D.; Zhao, X.; Lopez-Pujol, J.; Wang, Z.; Qu, Y.; Zhang, Y.; Zhang, T.; Li, D.; Jiang, K.; Wang, B.; et al. Effects of climate change and anthropogenic activity on ranges of vertebrate species endemic to the Qinghai-Tibet Plateau over 40 years. Conserv. Biol. 2023, 37, e14069. [Google Scholar] [CrossRef] [PubMed]
  3. Chen, I.C.; Hill, J.K.; Ohlemüller, R.; Roy, D.B.; Thomas, C.D. Rapid Range Shifts of Species Associated with High Levels of Climate Warming. Science 2011, 333, 1024–1026. [Google Scholar] [CrossRef] [PubMed]
  4. Guo, F.; Lenoir, J.; Bonebrake, T.C. Land-use change interacts with climate to determine elevational species redistribution. Nat. Commun. 2018, 9, 1315. [Google Scholar] [CrossRef]
  5. Cahyaningsih, R.; Phillips, J.; Brehm, J.M.; Gaisberger, H.; Maxted, N. Climate change impact on medicinal plants in Indonesia. Glob. Ecol. Conserv. 2021, 30, e01752. [Google Scholar] [CrossRef]
  6. Pereira, H.M.; Leadley, P.W.; Proenca, V.; Alkemade, R.; Scharlemann, J.P.W.; Fernandez-Manjarres, J.F.; Araujo, M.B.; Balvanera, P.; Biggs, R.; Cheung, W.W.L.; et al. Scenarios for Global Biodiversity in the 21st Century. Science 2010, 330, 1496–1501. [Google Scholar] [CrossRef] [PubMed]
  7. Wiens, J.J. Climate-Related Local Extinctions Are Already Widespread among Plant and Animal Species. PLoS Biol. 2016, 14, e2001104. [Google Scholar] [CrossRef]
  8. Nzei, J.M.; Ngarega, B.K.; Mwanzia, V.M.; Kurauka, J.K.; Wang, Q.-F.; Chen, J.-M.; Li, Z.-Z.; Pan, C. Assessment of Climate Change and Land Use Effects on Water Lily (Nymphaea L.) Habitat Suitability in South America. Diversity 2022, 14, 830. [Google Scholar] [CrossRef]
  9. Elith, J.; Leathwick, J.R. Species Distribution Models: Ecological Explanation and Prediction Across Space and Time. Annu. Rev. Ecol. Evol. Syst. 2009, 40, 677–697. [Google Scholar] [CrossRef]
  10. Yue, Y.; Zhang, P.; Shang, Y. The potential global distribution and dynamics of wheat under multiple climate change scenarios. Sci. Total Environ. 2019, 688, 1308–1318. [Google Scholar] [CrossRef]
  11. Yang, J.; Huang, Y.; Jiang, X.; Chen, H.; Liu, M.; Wang, R. Potential geographical distribution of the edangred plant Isoetes under human activities using MaxEnt and GARP. Glob. Ecol. Conserv. 2022, 38, e02186. [Google Scholar] [CrossRef]
  12. Zhang, K.; Liu, H.; Pan, H.; Shi, W.; Zhao, Y.; Li, S.; Liu, J.; Tao, J. Shifts in potential geographical distribution of Pterocarya stenoptera under climate change scenarios in China. Ecol. Evol. 2020, 10, 4828–4837. [Google Scholar] [CrossRef]
  13. Carpenter, G.; Gillison, A.N.; Winter, J. Domain—A flexible modeling procedure for mapping potential distributions of plants and animals. Biodivers. Conserv. 1993, 2, 667–680. [Google Scholar] [CrossRef]
  14. Booth, T.H.; Nix, H.A.; Busby, J.R.; Hutchinson, M.F. BIOCLIM: The first species distribution modelling package, its early applications and relevance to most current MAXENT studies. Divers. Distrib. 2014, 20, 1–9. [Google Scholar] [CrossRef]
  15. Hirzel, A.H.; Hausser, J.; Chessel, D.; Perrin, N. Ecological-niche factor analysis: How to compute habitat-suitability maps without absence data? Ecology 2002, 83, 2027–2036. [Google Scholar] [CrossRef]
  16. Li, Y.; Shao, W.; Huang, S.; Zhang, Y.; Fang, H.; Jiang, J. Prediction of Suitable Habitats for Sapindus delavayi Based on the MaxEnt Model. Forests 2022, 13, 1611. [Google Scholar] [CrossRef]
  17. Xu, C.; Zhang, L.; Zhang, K.; Tao, J. MaxEnt Modeling and the Impact of Climate Change on Pistacia chinensis Bunge Habitat Suitability Variations in China. Forests 2023, 14, 1579. [Google Scholar] [CrossRef]
  18. Xu, Y.; Liu, J.; Zeng, Y.; Jin, S.; Liu, W.; Li, Z.; Qin, X.; Bai, Y. Traditional uses, phytochemistry, pharmacology, toxicity and quality control of medicinal genus Aralia: A review. J. Ethnopharmacol. 2022, 284, 114671. [Google Scholar] [CrossRef]
  19. Qi, M.; Hua, X.; Peng, X.; Yan, X.; Lin, J. Comparison of chemical composition in the buds of Aralia elata from different geographical origins of China. R. Soc. Open Sci. 2018, 5, 180676. [Google Scholar] [CrossRef]
  20. Ni, P. The current situation, existing problems, and countermeasures of the development of understory economy in Huanren County. For. Prod. Spec. China 2020, 105–106+108. [Google Scholar] [CrossRef]
  21. Liu, H.; Jacquemyn, H.; He, X.; Chen, W.; Huang, Y.; Yu, S.; Lu, Y.; Zhang, Y. The Impact of Human Pressure and Climate Change on the Habitat Availability and Protection of Cypripedium (Orchidaceae) in Northeast China. Plants 2021, 10, 84. [Google Scholar] [CrossRef] [PubMed]
  22. Lu, Y.; Liu, H.; Chen, W.; Yao, J.; Huang, Y.; Zhang, Y.; He, X. Conservation planning of the genus Rhododendron in Northeast China based on current and future suitable habitat distributions. Biodivers. Conserv. 2021, 30, 673–697. [Google Scholar] [CrossRef]
  23. Qiu, L.; Jacquemyn, H.; Burgess, K.S.; Zhang, L.-G.; Zhou, Y.-D.; Yang, B.-Y.; Tan, S.-L. Contrasting range changes of terrestrial orchids under future climate change in China. Sci. Total Environ. 2023, 895, 165128. [Google Scholar] [CrossRef]
  24. Akyol, A.; Orucu, O.K.; Arslan, E.S.; Sarikaya, A.G. Predicting of the current and future geographical distribution of Laurus nobilis L. under the effects of climate change. Environ. Monit. Assess. 2023, 195, 459. [Google Scholar] [CrossRef]
  25. Tian, Y.; Zhang, X.; Liu, H.; Gong, D.; Li, X. Comparison of the nutritional and phytochemical composition and antioxidant activities of Aralia elata (Miq.) Seem fruits in Northeast China. Arab. J. Chem. 2021, 14, 103448. [Google Scholar] [CrossRef]
  26. Wei, H.; Chen, X.; Chen, G.; Zhao, H. Foliar nutrient and carbohydrate in Aralia elata can be modified by understory light quality in forests with different structures at Northeast China. Ann. For. Res. 2019, 62, 125–137. [Google Scholar] [CrossRef]
  27. Wisz, M.S.; Hijmans, R.J.; Li, J.; Peterson, A.T.; Graham, C.H.; Guisan, A.; Distribut, N.P.S. Effects of sample size on the performance of species distribution models. Divers. Distrib. 2008, 14, 763–773. [Google Scholar] [CrossRef]
  28. Fick, S.E.; Hijmans, R.J. WorldClim 2: New 1-km spatial resolution climate surfaces for global land areas. Int. J. Climatol. 2017, 37, 4302–4315. [Google Scholar] [CrossRef]
  29. Wu, T.W.; Lu, Y.X.; Fang, Y.J.; Xin, X.G.; Li, L.; Li, W.P.; Jie, W.H.; Zhang, J.; Liu, Y.M.; Zhang, L.; et al. The Beijing Climate Center Climate System Model (BCC-CSM): The main progress from CMIP5 to CMIP6. Geosci. Model Dev. 2019, 12, 1573–1600. [Google Scholar] [CrossRef]
  30. Martin, Y.; Van Dyck, H.; Dendoncker, N.; Titeux, N. Testing instead of assuming the importance of land use change scenarios to model species distributions under climate change. Glob. Ecol. Biogeogr. 2013, 22, 1204–1216. [Google Scholar] [CrossRef]
  31. Liao, W.; Liu, X.; Xu, X.; Chen, G.; Liang, X.; Zhang, H.; Li, X. Projections of land use changes under the plant functional type classification in different SSP-RCP scenarios in China. Sci. Bull. 2020, 65, 1935–1947. [Google Scholar] [CrossRef] [PubMed]
  32. Stanton, J.C.; Pearson, R.G.; Horning, N.; Ersts, P.; Akcakaya, H.R. Combining static and dynamic variables in species distribution models under climate change. Methods Ecol. Evol. 2012, 3, 349–357. [Google Scholar] [CrossRef]
  33. Gao, Z.; Khalid, M.; Jan, F.; Jiang, X.; Yu, X. Effects of light-regulation and intensity on the growth, physiological and biochemical properties of Aralia elata (miq.) seedlings. S. Afr. J. Bot. 2019, 121, 456–462. [Google Scholar] [CrossRef]
  34. Hageer, Y.; Esperon-Rodriguez, M.; Baumgartner, J.B.; Beaumont, L.J. Climate, soil or both? Which variables are better predictors of the distributions of Australian shrub species? PeerJ 2017, 5, e3446. [Google Scholar] [CrossRef] [PubMed]
  35. Oliveira, G.d.C.; Arruda, D.M.; Filho, E.I.F.; Veloso, G.V.; Francelino, M.R.; Schaefer, C.E.G.R. Soil predictors are crucial for modelling vegetation distribution and its responses to climate change. Sci. Total Environ. 2021, 780, 146680. [Google Scholar] [CrossRef] [PubMed]
  36. Phillips, S.J.; Anderson, R.P.; Schapire, R.E. Maximum entropy modeling of species geographic distributions. Ecol. Model. 2006, 190, 231–259. [Google Scholar] [CrossRef]
  37. Tang, S.L.; Song, Y.B.; Zeng, B.; Dong, M. Potential distribution of the extremely endangered species Ostrya rehderiana (Betulaceae) in China under future climate change. Environ. Sci. Pollut. Res. 2022, 29, 7782–7792. [Google Scholar] [CrossRef]
  38. Kaky, E.; Nolan, V.; Alatawi, A.; Gilbert, F. A comparison between Ensemble and MaxEnt species distribution modelling approaches for conservation: A case study with Egyptian medicinal plants. Ecol. Inform. 2020, 60, 101150. [Google Scholar] [CrossRef]
  39. Xie, D.; Du, H.; Xu, W.-H.; Ran, J.-H.; Wang, X.-Q. Effects of climate change on richness distribution patterns of threatened conifers endemic to China. Ecol. Indic. 2022, 136, 108594. [Google Scholar] [CrossRef]
  40. Zu, K.L.; Wang, Z.H.; Zhu, X.Y.; Lenoir, J.; Shrestha, N.; Lyu, T.; Luo, A.; Li, Y.Q.; Ji, C.J.; Peng, S.J.; et al. Upward shift and elevational range contractions of subtropical mountain plants in response to climate change. Sci. Total Environ. 2021, 783, 146896. [Google Scholar] [CrossRef]
  41. Liu, C.R.; White, M.; Newell, G. Selecting thresholds for the prediction of species occurrence with presence-only data. J. Biogeogr. 2013, 40, 778–789. [Google Scholar] [CrossRef]
  42. Wang, Y.; Liu, H.; Yu, S.; Huang, Y.; Zhang, Y.; He, X.; Chen, W. Potential distribution of the spring ephemeral plant Adonis amurensis in Northeast China under future climate change. Ecosphere 2023, 14, e4519. [Google Scholar] [CrossRef]
  43. Chen, B.; Zou, H.; Zhang, B.; Zhang, X.; Jin, X.; Wang, C.; Zhang, X. Distribution pattern and change prediction of Saposhnikovia divaricata suitable area in China under climate change. Ecol. Indic. 2022, 143, 109311. [Google Scholar] [CrossRef]
  44. Tyler, T.; Herbertsson, L.; Olsson, P.A.; Froberg, L.; Olsson, K.-A.; Svensson, A.; Olsson, O. Climate warming and land-use changes drive broad-scale floristic changes in Southern Sweden. Glob. Chang. Biol. 2018, 24, 2607–2621. [Google Scholar] [CrossRef] [PubMed]
  45. Fei, S.L.; Desprez, J.M.; Potter, K.M.; Jo, I.; Knott, J.A.; Oswalt, C.M. Divergence of species responses to climate change. Sci. Adv. 2017, 3, e1603055. [Google Scholar] [CrossRef] [PubMed]
  46. Abolmaali, S.M.R.; Tarkesh, M.; Bashari, H. MaxEnt modeling for predicting suitable habitats and identifying the effects of climate change on a threatened species, Daphne mucronata, in central Iran. Ecol. Inform. 2018, 43, 116–123. [Google Scholar] [CrossRef]
  47. Jewitt, D.; Goodman, P.S.; Erasmus, B.F.N.; O’Connor, T.G.; Witkowski, E.T.F. Systematic land-cover change in KwaZulu-Natal, South Africa: Implications for biodiversity. S. Afr. J. Sci. 2015, 111, 9–10. [Google Scholar] [CrossRef]
  48. Barras, A.G.; Braunisch, V.; Arlettaz, R. Predictive models of distribution and abundance of a threatened mountain species show that impacts of climate change overrule those of land use change. Divers. Distrib. 2021, 27, 989–1004. [Google Scholar] [CrossRef]
  49. He, X.; Liang, J.; Zeng, G.; Yuan, Y.; Li, X. The Effects of Interaction between Climate Change and Land-Use/Cover Change on Biodiversity-Related Ecosystem Services. Glob. Chall. 2019, 3, 1800095. [Google Scholar] [CrossRef]
  50. Tang, J.; Zhao, X. Large variability in response to future climate and land-use changes among Chinese Theaceae species. Ecol. Evol. 2022, 12, e9480. [Google Scholar] [CrossRef]
  51. Groner, V.P.; Nicholas, O.; Mabhaudhi, T.; Slotow, R.; Akcakaya, H.R.; Mace, G.M.; Pearson, R.G. Climate change, land cover change, and overharvesting threaten a widely used medicinal plant in South Africa. Ecol. Appl. 2022, 32, e2545. [Google Scholar] [CrossRef] [PubMed]
  52. Oliver, T.H.; Morecroft, M.D. Interactions between climate change and land use change on biodiversity: Attribution problems, risks, and opportunities. Wiley Interdiscip. Rev. Clim. Chang. 2014, 5, 317–335. [Google Scholar] [CrossRef]
  53. Mair, L.; Jonsson, M.; Raty, M.; Barring, L.; Strandberg, G.; Lamas, T.; Snall, T. Land use changes could modify future negative effects of climate change on old-growth forest indicator species. Divers. Distrib. 2018, 24, 1416–1425. [Google Scholar] [CrossRef]
  54. Zhou, Y.; Zhang, Z.; Zhu, B.; Cheng, X.; Yang, L.; Gao, M.; Kong, R. MaxEnt Modeling Based on CMIP6 Models to Project Potential Suitable Zones for Cunninghamia lanceolata in China. Forests 2021, 12, 752. [Google Scholar] [CrossRef]
  55. Zhang, T.; Yu, L.; Man, Y.; Yan, Q. Effects of harvest intensity on the marketable organ yield, growth and reproduction of non-timber forest products (NTFPs): Implication for conservation and sustainable utilization of NTFPs. For. Ecosyst. 2021, 8, 56. [Google Scholar] [CrossRef]
  56. Preau, C.; Bertrand, R.; Sellier, Y.; Grandjean, F.; Isselin-Nondedeu, F. Climate change would prevail over land use change in shaping the future distribution of Triturus marmoratus in France. Anim. Conserv. 2022, 25, 221–232. [Google Scholar] [CrossRef]
  57. Yu, F.; Wang, T.; Groen, T.A.; Skidmore, A.K.; Yang, X.; Ma, K.; Wu, Z. Climate and land use changes will degrade the distribution of Rhododendrons in China. Sci. Total Environ. 2019, 659, 515–528. [Google Scholar] [CrossRef]
  58. Xu, W.B.; Svenning, J.C.; Chen, G.K.; Zhang, M.G.; Huang, J.H.; Chen, B.; Ordonez, A.; Ma, K.P. Human activities have opposing effects on distributions of narrow-ranged and widespread plant species in China. Proc. Natl. Acad. Sci. USA 2019, 116, 26674–26681. [Google Scholar] [CrossRef]
  59. Guisan, A.; Tingley, R.; Baumgartner, J.B.; Naujokaitis-Lewis, I.; Sutcliffe, P.R.; Tulloch, A.I.T.; Regan, T.J.; Brotons, L.; McDonald-Madden, E.; Mantyka-Pringle, C.; et al. Predicting species distributions for conservation decisions. Ecol. Lett. 2013, 16, 1424–1435. [Google Scholar] [CrossRef] [PubMed]
  60. Zhao, X.; Wei, W.; Zhang, J.; Pan, S.; Che, Q.; Tang, J. Conservation of Chinese Theaceae species under future climate and land use changes. Divers. Distrib. 2023, 29, 1064–1073. [Google Scholar] [CrossRef]
  61. Asgharzadeh, M.; Alesheikh, A.A.; Yousefi, M. Disentangling the impacts of climate and land cover changes on habitat suitability of common pheasant Phasianus colchicus along elevational gradients in Iran. Environ. Sci. Pollut. Res. 2023, 30, 60958–60966. [Google Scholar] [CrossRef] [PubMed]
  62. Tang, X.; Yuan, Y.; Wang, L.; Chen, S.; Liu, X.; Zhang, J. Identifying prioritized planting areas for medicinal plant Thesium chinense Turcz. under climate change in China. Ecol. Inform. 2021, 66, 101459. [Google Scholar] [CrossRef]
  63. Petrochenko, A.A.; Orlova, A.; Frolova, N.; Serebryakov, E.B.; Soboleva, A.; Flisyuk, E.V.; Frolov, A.; Shikov, A.N. Natural Deep Eutectic Solvents for the Extraction of Triterpene Saponins from Aralia elata var. mandshurica (Rupr. & Maxim.) J. Wen. Molecules 2023, 28, 3614. [Google Scholar] [CrossRef] [PubMed]
  64. Peng, S.J.; Zhang, J.; Zhang, X.L.; Li, Y.Q.; Liu, Y.P.; Wang, Z.H. Conservation of woody species in China under future climate and land-cover changes. J. Appl. Ecol. 2022, 59, 141–152. [Google Scholar] [CrossRef]
  65. Kaky, E.; Gilbert, F. Predicting the distributions of Egypt’s medicinal plants and their potential shifts under future climate change. PLoS ONE 2017, 12, e0187714. [Google Scholar] [CrossRef]
  66. Tang, J.; Zhao, X. Forecasting the combined effects of future climate and land use change on the suitable habitat of Davidia involucrata Baill. Ecol. Evol. 2022, 12, e9023. [Google Scholar] [CrossRef]
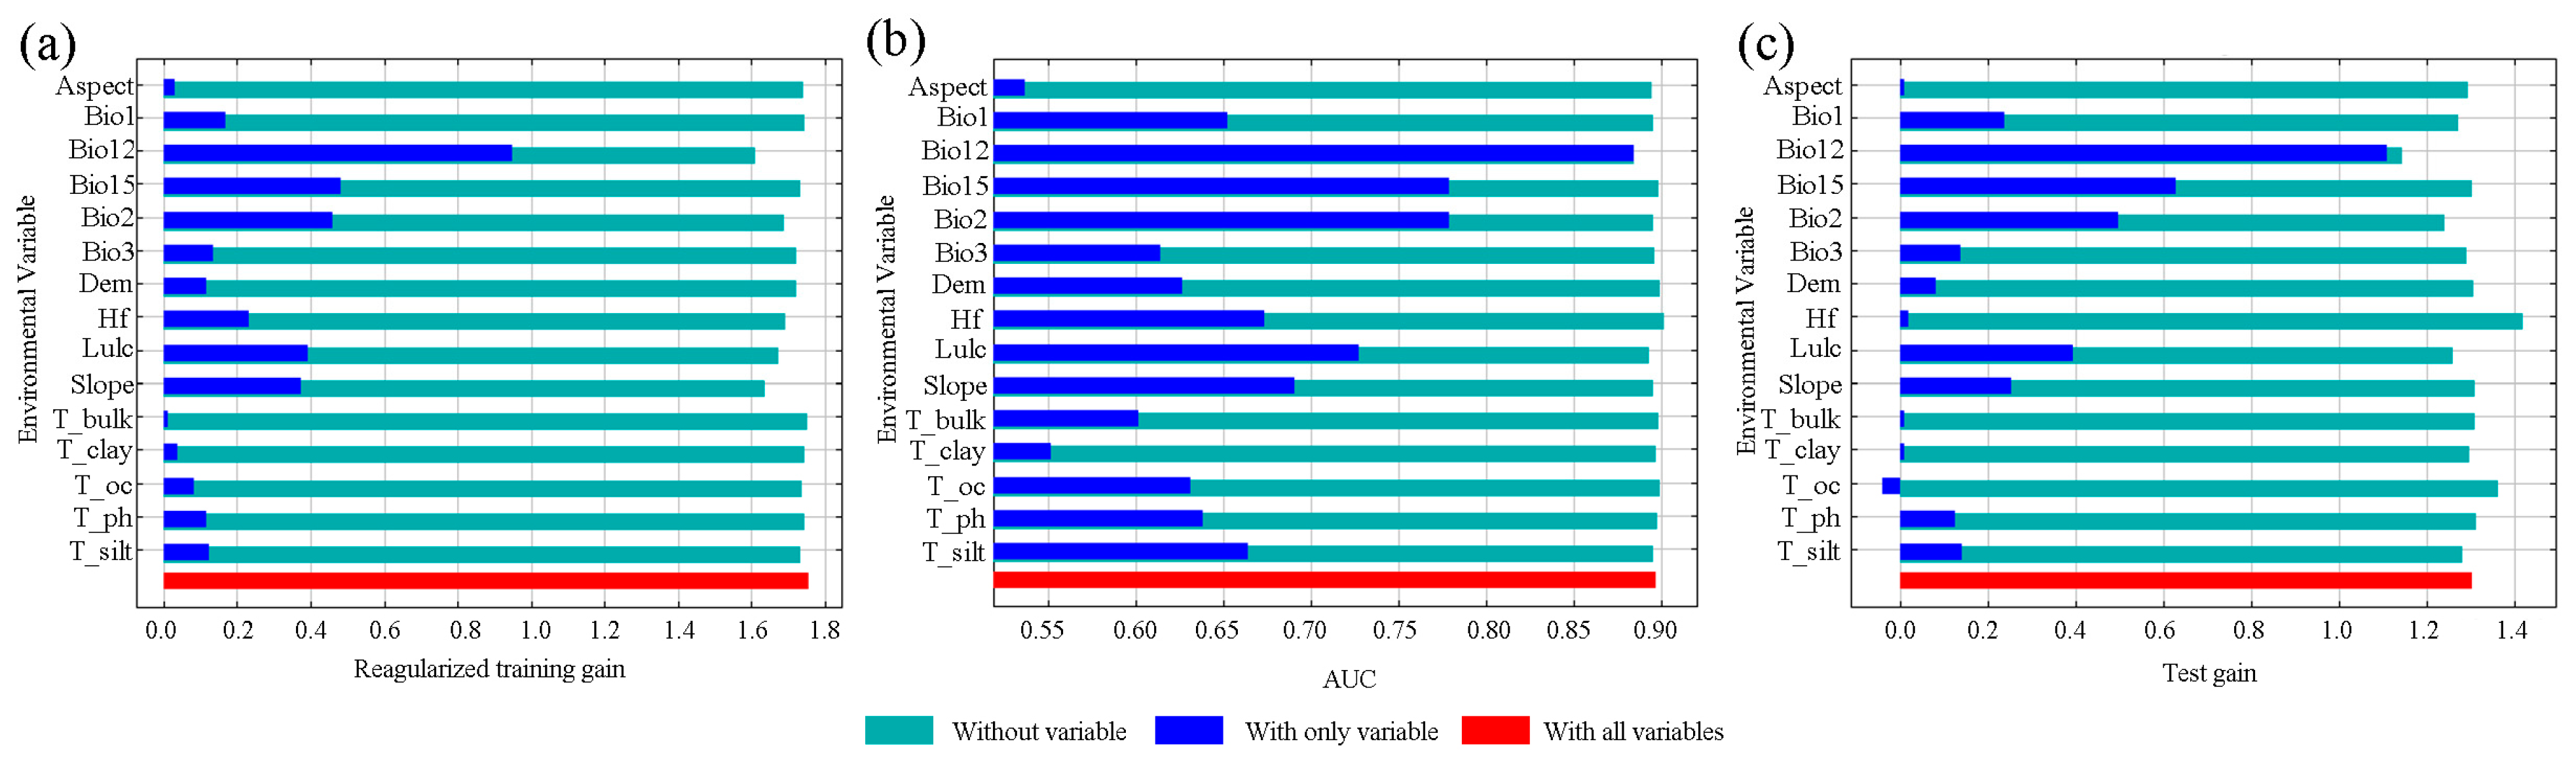
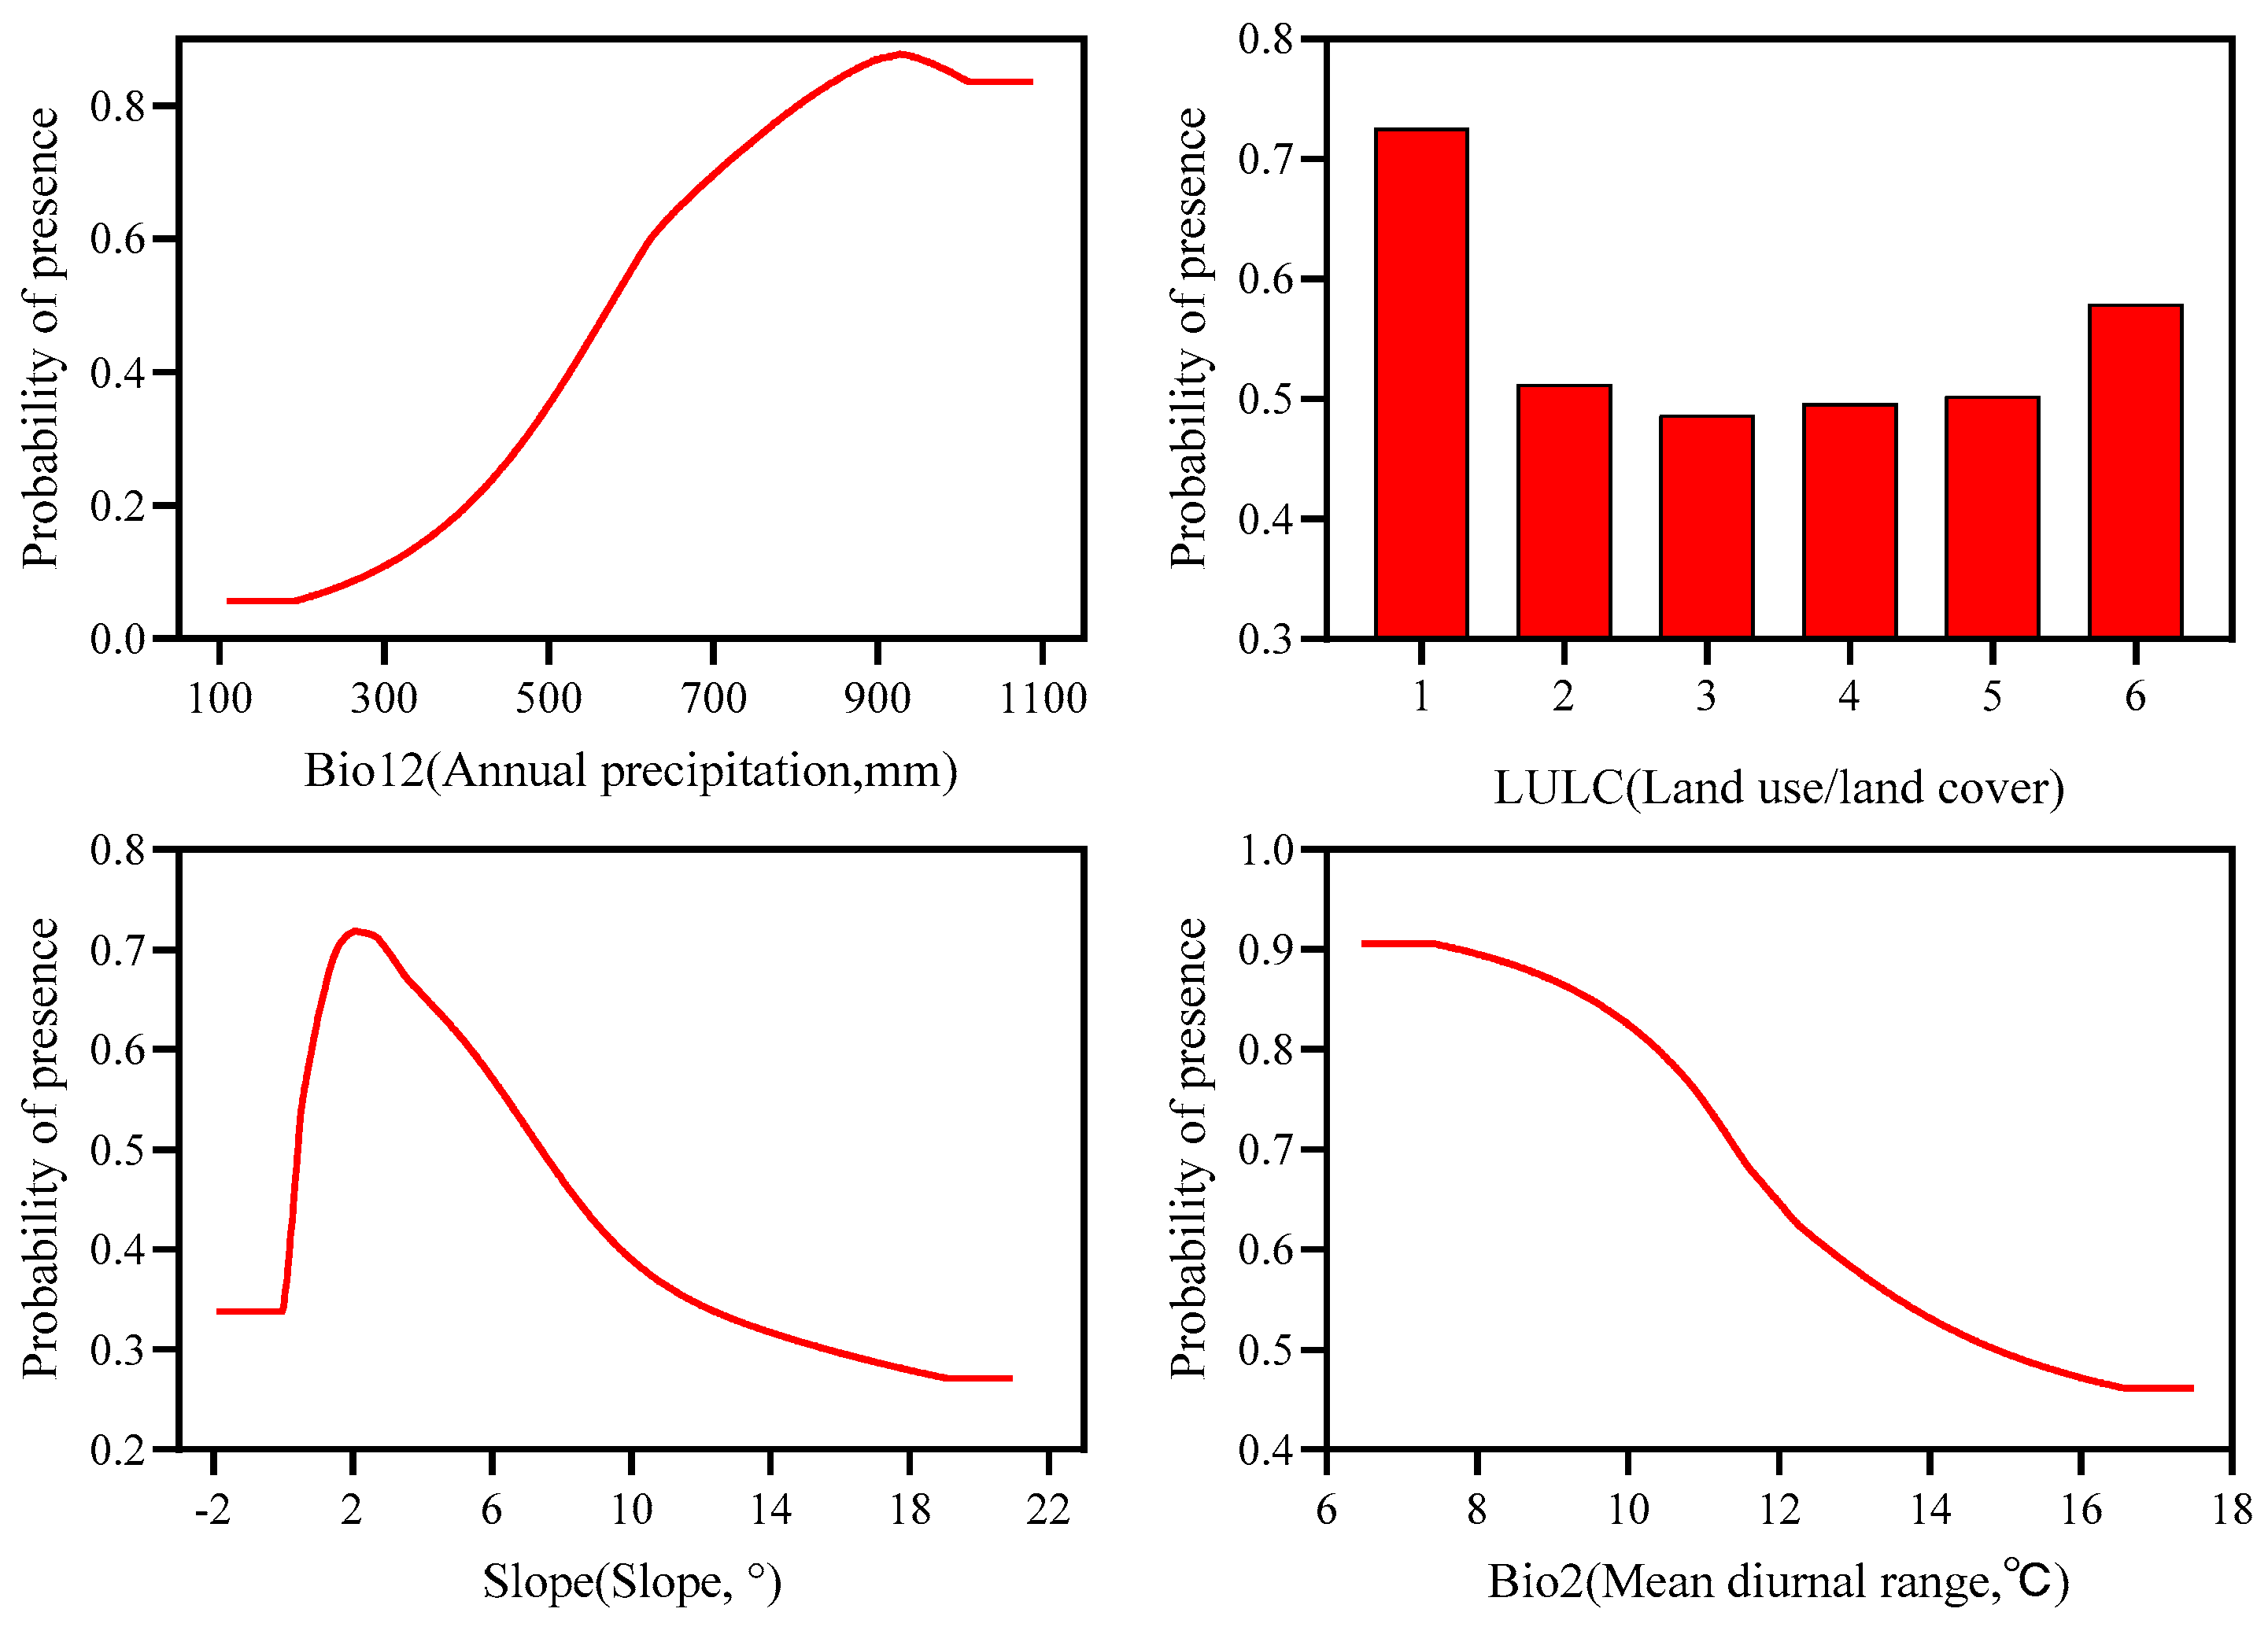
Figure 1. (a) Study area and aralia distribution points. (b) A. elata shoots (edible parts). (c) A. elata fruit.
Forests 15 00153 g001
Figure 2. AUC values of the model under current and different future climate scenarios.
Forests 15 00153 g002
Figure 3. Jackknife test of the environmental variables. (a) Reagularized training gain. (b) AUC value. (c) Test gain.
Forests 15 00153 g003
Figure 4. Response curves for major environmental variables.
Forests 15 00153 g004
Figure 5. Current suitable habitat. (a) Current suitable habitat. (b) Hotspot analysis. (c) Area of suitable habitat.
Forests 15 00153 g005
Figure 6. Future range of A. elata habitat under different climatic scenarios.
Forests 15 00153 g006
Figure 7. Area of suitable habitat for A. elata under different scenarios in the future.
Forests 15 00153 g007
Figure 8. The moderately and highly suitable habitat changes of A. elata under different scenarios in the future.
Forests 15 00153 g008
Figure 9. Migratory changes in the center of mass of the suitable habitat under different scenarios.
Forests 15 00153 g009
Table 1. Environmental factors used in the model and their contributions.
No.CategoryVariablesDescriptionPercent
Contribution
Permutation Importance
1Climate factorsBio1Annual mean temperature (°C)3.64
2Bio2Mean diurnal range (°C)12.38.6
3Bio3Isothermally3.914.5
4Bio12Annual precipitation (mm)31.221.3
5Bio15Precipitation seasonality5.92.3
6LULC factorsLULCThere are 6 types: (1) forest;
(2) grassland; (3) barren; (4) cropland; (5) urban; (6) water
16.86.1
7Topographic factorsDem 3.28.4
8SlopeSlope (°)12.814.2
9Aspect 12
10Soil factorsT_bulkSoil bulk (kg/dm3)0.20.6
11T_claySoil clay (%)0.70.2
12T_ocSoil organic carbon (%)1.32.3
13T_phSoil pH0.92.5
14T_siltSoil silt (%)1.52.6
15Human impact factorsHfHuman footprint4.710.4
Table 2. Percentage change in moderately and highly suitable habitats in different situations in the future.
Different ScenariosFuture Climate ScenariosAverage Percentage
SSP126SSP245SSP370SSP585
Climate change−3.11%−6.50%−8.18%−6.41%−6.05%
LULC change−16.13%−14.80%−5.15%−4.74%−10.21%
Climate and LULC change−16.95%−11.61%−3.30%−6.88%−9.69%
Disclaimer/Publisher’s Note: The statements, opinions and data contained in all publications are solely those of the individual author(s) and contributor(s) and not of MDPI and/or the editor(s). MDPI and/or the editor(s) disclaim responsibility for any injury to people or property resulting from any ideas, methods, instructions or products referred to in the content.

