Abstract
Due to climate change, subtropical forests are increasingly exposed to severe disturbance, which may lead to increased tree mortality. To date, previous research has not sufficiently studied the deadwood biomass within forests over large study plots. To address this research gap, we calculated the deadwood biomass within a 20 hectare (ha) permanent old-growth forest plot in southern China during two censuses and assessed the factors contributing to it. The deadwood biomass was estimated by applying allometric regression equations. There was a total of 11,283 (22.4%) dead individuals in the study plot. Most of these dead trees had very small diameters (1–10 cm). The spatial distribution of the dead individuals differed across subplots and was determined by biotic and abiotic factors. The deadwood biomass storage was 142.5 ton (t) in our study plot. Small (DBH: 0–30 cm) and medium trees (DBH: 30–50 cm) were the largest contributors (54.9% and 30.7%) to deadwood biomass storage. Three dominant tree species contributed 64.8% of the deadwood biomass storage, and the deadwood biomass of 38 tree species was less than 1 t ha−1. Finally, the deadwood biomass was determined by breast diameter and the number of dead individuals, which was influenced by neighboring individuals and environmental factors. This study provides a detailed assessment of the patterns of the deadwood biomass in a subtropical forest and underscores the importance of including community characteristics and abiotic factors (e.g., topography) into research on forest ecosystem carbon. The results of this research provide valuable information that can deepen the understanding of the contribution of subtropical forests to the global carbon cycle and that can be used to improve forest protection and planning strategies.
1. Introduction
Forests are the largest carbon pool in the terrestrial ecosystem and play a central role in regional and global carbon cycles. They absorb carbon in the process of substitution, and they function as carbon sources when human or natural interference causes forest destruction or degradation [1]. It is estimated that about 50% of all organic carbon is stored in forest ecosystems [2]. Although global forest carbon storage levels have remained relatively stable, changes in forest ecosystems can have a profound impact on the global carbon balance [3]. Therefore, an accurate assessment of forest carbon storage in different climatic regions is essential to understand global and regional carbon budgets. In recent decades, researchers have increasingly sought to quantify the carbon storage of forest ecosystems [4,5]. However, most previous studies have examined small areas and generated large sampling errors, and they may not be representative or provide an accurate description of the actual carbon pool investigated. In China, there have been few studies on subtropical forests and changes in the biomass of large dry trees, and most have been based on small study areas. This lack of extensive research hinders our understanding of the carbon cycle [6]. It is, therefore, necessary to conduct assessments in larger sample areas in order to better quantify the biomass and carbon storage of ancient subtropical forests. Further, measurements of the soil can improve our understanding of deadwood biomass changes under natural conditions.
Tree mortality may cause changes in species, the forest structure, the nutrient cycle, or the biomass accumulation rate [7]. Understanding tree mortality is the basis for predicting forest dynamics because tree mortality is the main determining factor in a tree growth system [8,9]. However, few studies have evaluated the population and geographical structure of the dry wood biomass in subtropical forests in southern China or the impact of the biological and abiotic factors affecting it.
External factors, such as climate, biodiversity, terrain, and the extent of human activities and natural disturbances, affect deadwood biomass and its distribution in forest ecosystems [10,11]. The relationship between deadwood biomass and the factors that affect it is important in understanding the impact of the short-term fluctuations of carbon resources in forest ecosystems; therefore, it is of particular interest for forest carbon pool research [12]. However, important issues such as (1) the local variability of deadwood biomass and (2) the proportion of and variation in deadwood species in ancient subtropical forests in southern China have so far been understudied. Previous research indicates that more data are needed to better understand the carbon storage potential of old-growth forests. This is especially because different forest ecosystems vary in terms of internal productivity dynamics, which suggests that there is no common trend among different forest ecosystems [13].
Over the past few decades, the role of dead trees in forest ecosystems has been widely studied, and the monitoring of and research on this resource have also expanded. Dead branches and leaves (DWD) are the main components in the functioning of forest ecosystems [14]. They play an important role in carbon storage, affect nutrient cycles, promote tree regeneration, and have become a habitat for plants and animals [15]. Therefore, the quantification of small- and medium-sized dry wood and fallen wood is crucial for assessing forest carbon dynamics. Field measurements provide a detailed assessment of vertical and horizontal biomass structures and are considered the best method [16]. Field surveys are needed to assess the geographical distribution of DWD in forests, and large-scale sampling is often used to estimate total biomass by measuring the diameter of all dead and fallen wood fragments in the test area [17]. Studies on biomass have been conducted in most of the world’s forests; however, to the best of our knowledge, there are no available data on the deadwood biomass in the subtropical forests in southern China.
In general, the carbon dioxide of old-growth stands can be quantified, and the upper limit of the carbon reserves of similar forests can be reasonably estimated. Traditionally, old-growth stands have been considered to be jumping ecosystems, meaning that forests in similar climatic conditions and interference reach older growth stages at about the same age [18,19]. Carbon accumulation models assume that carbon densities in old-growth forests are relatively high [20]. However, additional studies on old-growth forests in this area provide an opportunity to empirically assess the upper limit of carbon reserves. Global environmental change may have an increasing impact on carbon dioxide resources in the primeval forest. This study utilizes a spatial model to investigate the old-growth tree biomass in a 20 hectare (ha) area in southern China. The aims of the study are (1) to assess the spatial pattern of the deadwood biomass in the area, (2) to assess the distribution of different species and the range of DBH of the tree biomass, and (3) to investigate the relative contribution of abiotic and biotic factors in determining deadwood biomass storage.
2. Materials and Methods
2.1. Study Site
The survey was carried out in the Dinghushan Nature Reserve in southern China. It is the first nature reserve created in China. For the last 60 years, the Dinghushan Nature Reserve has played an important role in protecting the forest ecosystem [21]. The zonal vegetation is a subtropical broad-leaved forest with a long history (more than 400 years) in the area. The annual average temperature and precipitation are 20.9 °C and 1927 mm, respectively, and the average relative humidity is 85%. The 20 ha forest plot was created in the middle of the reserve (23°10′09″–23°10′25″ N, 112°32′21″ E) in 2005. In order to avoid human interference, a population census was carried out, and the topography was assessed (Figure 1). The ground height ranges from 230 to 470 m, and the average height is 340 m. The soil consists mainly of red brick and yellowish brown mountain soil [22,23].
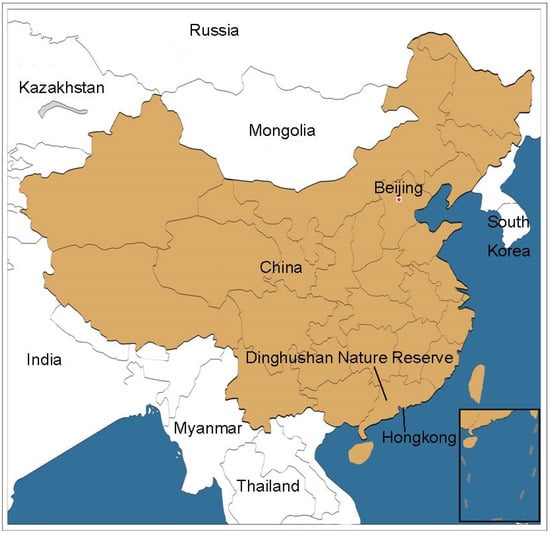
Figure 1.
Location of the study plot.
2.2. Field Methods
At the species level, all trees with a breast diameter of at least 1 cm (DBH, 1.3 m above ground) were measured. Their geographic coordinates were recorded on site [24]. A second census was conducted from September to December 2010. During the census, all trees that were recorded in the first census were measured again. Recruitments were also measured and recorded. Three dominant tree species were identified based on important values (IVs) that have been previously identified in the existing literature [25].
2.3. Biotic and Abiotic Variables
In order to better evaluate the factors affecting tree mortality, the 20 ha study plot was divided into 500 subplots. Each subplot was 20 × 20 m. We determined the value of the subplot habitat variables using soil properties and topography, according to the same standards applied in a previous study in this study plot [26]. All topography variables, including elevation, aspect, convexity, and slope, were measured within each subplot. In order to measure the soil properties, 500 samples at 0–20 cm were collected. Eight soil properties—pH, organic matter, total nitrogen (N), available N, total phosphorus (P), available P, total potassium (K), and available K—were analyzed [27].
2.4. Deadwood Biomass Estimates
Before estimating the biomass of each deadwood individual, the decay grade coefficient of each one was determined via a visual assessment. If a tree had only recently died, the decay grade coefficient was set to 5/5. The decay grade coefficient was set to 0/5 if a tree was completely decomposed (and had disappeared in the second census). Then, the deadwood biomass was calculated by multiplying the decay grade coefficient and the biomass of each tree.
The biomass of each tree was estimated using the allometric equation for mixed forests [28]:
where a and b are statistical parameters (see Appendix A for equations and summary statistics). B is the total dry weight, including trunks and branches, and it was obtained by multiplying the biomass of each tree by the decay grade coefficient. Finally, the deadwood biomass storage (DBd) was estimated by summing the biomass of each tree within each 20 × 20 m subplot within our study site. This model has been successfully applied to estimate live tree biomass in a subtropical forest located in the Dinghushan Nature Reserve [29].
2.5. Statistical Analyses
The statistical significance of our calculations was measured, and the significance value was p < 0.05. Because the data did not follow a normal distribution, a conversion protocol was performed. The Tukey maximum effectiveness difference test (Tukey HSD) was used to detect different levels within factors. In order to reduce multi-collinearity among soil variables, a principal component analysis was carried out for the soil characteristics. The first two components were used as concentration variables and accounted for 86.6% of the total change in soil activity.
A General Linear Mixed Model (GLMM) was used to simulate the change in the deadwood biomass, owing to biological and abiotic factors, in each 20 × 20 m subplot. All variables in the model were statistically independent. The spatial pattern and the influencing factors of the deadwood biomass in the second population census were simulated. The model determined the abundance of tree species and analyzed the biological (strains) and abiotic factors (elevation, aspect, slope, convexity, and soil factors) across different DBH intervals within each 20 × 20 m subplot. All explanatory variables were normalized by subtracting the mean and dividing them by the standard deviation, allowing for a comparison of their relative importance. A positive value indicates a greater effect of the variable on the biomass of the deadwood and vice versa. All analyses were conducted in R (4.2.1) [30].
3. Results
3.1. Species Composition and Community Characteristics of Dead Trees
The total number of standing trees decreased from 80,504 in 2005 to 69,221 in 2010, including 11,283 dead stems (14.0% of the total stems in 2005). The number of dead trees per 20 × 20 m subplot ranged from 6 to 147 stems, and there was an average of 41 ± 1 (standard error) stems per plot. The mortality rates ranged from 1.7% to 12.3% per year between the two censuses (2005–2010). The average exponential mortality coefficient was 8.0% per year, and the coefficient values ranged from 0 to 43.3% per year among species. The total number of tree species decreased from 195 to 178. There were 173 dead tree species in the 20 ha study plot. The species richness of the dead trees ranged from 4 to 35 and averaged 15 ± 0.2. Deadwood stems were distributed among almost all DBH ranges (1–120 cm), including big trees. However, the proportion of individuals with a very small DBH was 89.6% (Table 1 and Figure 2).

Table 1.
Deadwood density, abundance, and biomass (DBd in t) across DBH ranges within the 20 ha subtropical forest plot.
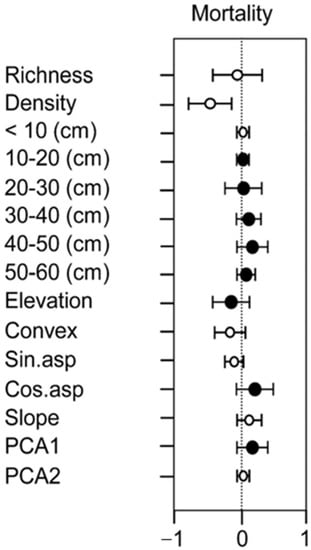
Figure 2.
Drivers of tree survival in the 20 ha study plot.
3.2. Deadwood Biomass Storage Patterns within the Study Plot
The deadwood biomass storage (DBd) ranged from 0.022 t ha−1 to 4.3 t ha−1, with a mean value of 0.3 ± 0.01 t ha−1 among the 500 subplots. Though the deadwood stems with <10 cm DBH dominated all stands, the DBd was significantly greater (p < 0.05) in the small and medium diameter classes (10–30 cm and 30–50 cm) (Table 1). The large stem class had the least DBd (2.5 t ha−1) due to its low abundance.
Based on the analysis of the relationships between species richness and the DBd in all subplots, our results suggest that the DBd is lower in species-poor rather than species-rich subplots (cor = 0.86, p < 0.05). Three tree species (Castanopsis chinensis Hance, Engelhardtia roxburghiana Wall, and Schima superba Gardn. et Champ) were dominant and contributed 64.8% of the total DBd (Table 2). The remaining species (170 tree species) contributed the remaining 35.2% of the total DBd. The deadwood biomass of 38 tree species was less than 1 t ha−1. Moreover, we found a significant decrease in the deadwood biomass with increasing elevation (p < 0.05).
Table 2.
Biomass storage (DBd in t) by dead tree species of the top 10 individuals in a 20 ha sub-tropical forest plot.
3.3. Drivers of Tree Mortality in Subtropical Forest
The effects of abiotic factors (soil properties and topography) and biotic factors (species richness and the number of stems within different DBH ranges) on tree mortality were assessed in the model. The results show that tree size was the most important factor determining tree mortality. In addition, tree mortality was significantly influenced by soil properties during the census years. Aspect had a significant positive effect on tree mortality, while elevation had a negative effect. Richness and density also had negative effects on tree mortality, but not significantly (Figure 3).
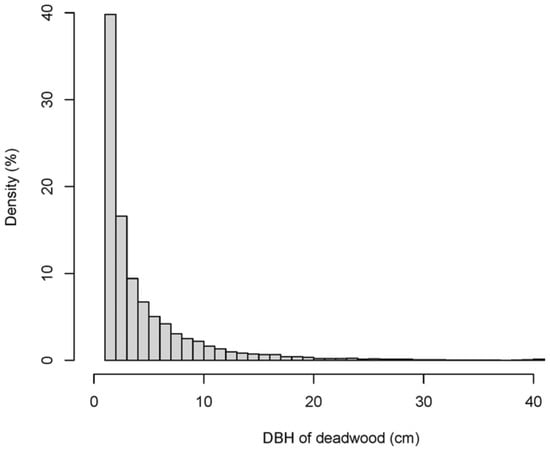
Figure 3.
Distribution of breast diameter of dead trees in the 20 ha study plot.
4. Discussion
Although considerable research has been conducted on the role of deadwood in the carbon cycle and in tree regeneration in various forest ecosystems, there has been little study of the extent of deadwood in southern China. Deadwood biomass is an important part of the forest ecosystem and is affected by the composition of species, community structure, and topographic conditions, amongst other variables [7]. Empirical and theoretical studies have shown that the composition of wood types affects carbon sequestration when compared across similar climate regions [31]. While previous research has explored a range of topics related to deadwood, including carbon deposition, biodiversity, and the wood regeneration matrix, more research is needed to understand how deadwood biomass is affected by climate change, disease and insect pests, and land use changes accelerating global forest ecosystem changes [32].
Tree mortality is a key factor in determining forest structure, composition, and sequencing, and it affects species composition, which, in turn, affects community characteristics and nutrient and biomass accumulation [33]. Therefore, tree mortality is important for understanding forest dynamics, and this study contributes knowledge on deadwood biomass over the past five years.
We categorized all individuals into different DBH ranges in the study. The amount of deadwood had a significant positive impact on the deadwood biomass. We also found that the factors that affect the trunks of large trees had the greatest impact on the deadwood biomass, but these impacts were not statistically significant [34]. Previous studies showed that large individuals only account for 3%–5% of the total, while they contributed more than 65% of the total deadwood biomass storage [35]. The results of this study are consistent with those of previous studies. This study shows that deadwood from large trees is the main contributor to deadwood biomass, and the local changes in the deadwood biomass in the 20 × 20 m plot were due to large trees. In forests with a low wood density, trees tend to be large, and the deadwood biomass is high. In this study, the individuals with the lowest dry density only accounted for 2.6% and 2.5% of all individuals, but they accounted for 45%–49% of those used for timber construction. Furthermore, they accounted for 45% and 49% of the total deadwood biomass. Forest structures, especially the basal area of the largest diameter class and, to a lesser extent, the stand-level wood density, have been proposed to explain the deadwood biomass gradient in our study plot. The biomass varies greatly, and the variation in the dry wood biomass across the land is related to changes in density and site-specific conditions.
The results of the study also show that the main abiotic factors that affect the biology of dead trees are high, open, and ground properties. Forests do not usually experience substantial local changes [36]. However, we observed a considerable reduction in many dead tree properties. The tree line height was between 230 m and 470 m and had multiple trainings [22,23]. The topography of this research area was more complex than that of other areas in Changbiashan, Pasoh, and Barro Colorado Islands, where previous studies have been conducted [37,38]. The biodiversity of dead trees and low altitudes result in significant differences in mortality rates. The low number of mines and the average diameter explain the low level of biodiversity in the dead trees. Variation may also be due to altitude differences. For example, places at higher altitudes tend to be windier and colder. As a result of higher growth, changes in abiotic factors may have an important impact on plants, public structures, and ecosystem processes [39,40]. Additionally, other abiotic changes on the ground may have important effects on dead trees, including on convexity, aspect, and nutrients.
We found that the subtropical forest under study was more dynamic than other tropical and subtropical forests that had been previously investigated. For example, a survey of a 25 ha state-controlled area in northeastern China showed similar results, but the overall mortality and mortality rates were very low [41]. The density of a permanent 5 ha forest in northern China was lower than the terrestrial mortality observed in this study [42]. This may be because the forest was in an earlier growth stage. The pace of forest dynamics is affected by several factors, such as topography, geology, climate, current biological and sequential stages, and human factors. The forest in this study differs from others in that there are many very steep slopes, and the forest ecosystem is more complex and diverse than that in other areas, which contributes to increasing population dynamics.
The decreasing standing tree biomass due to deadwood biomass production over the five-year study period may be considered in the normal range of fluctuations of forest health according to previous studies [43,44]. Further, carbon related to the growth of deadwood biomass can be converted into CO2 [45]. Although some studies have been carried out to estimate the deadwood biomass and the factors affecting it in China, additional research over larger study plots and longer timeframes are needed to clarify whether the forest is in equilibrium in the short term [46]. These studies are also needed to determine which factors promote prosperity in this subtropical forest and others around the world. Overall, in light of expected future global changes and an increasing interest in maintaining the carbon intake of forests, this research shows that management should focus on dead trees as integral aspects of forest dynamics. Future research should evaluate the microbial composition of and the relationship between the dead and living biomass in subtropical forests.
Measurement and theoretical studies show that, although there is no consensus about the relationship between the size of trees and their survival, the mortality of small trees is high [47]. In general, trees that grow on other trees are susceptible to death because of their lack of ability to withstand environmental pressure. Our results are consistent with a forest survey that found that random death is more frequent in larger species categories. This may be because trees with larger crowns are less impacted by their neighbors because of asymmetric competition for ecological resources, such as water, food, and light. The mortality of smaller trees is higher because of competition between tree species [48]. This means that smaller individuals are exposed to more competitive pressures and can be more vulnerable to the impact of changing environments. Since larger trees are usually in their ideal environment due to environmental filtering, the metabolic ecology theory cannot be applied to this subtropical forest as previously done in tropical forests [49,50]. One possible reason is that the metabolic ecology theory assumes that populations of different sizes receive and consume the same amount of energy. This assumption may be true in some forests, but it is not true in such natural mixed forests.
5. Conclusions
In this study, we estimated the spatial distribution of deadwood biomass and its determinants during a five-year period in a subtropical forest. We found that the species composition and community characteristics of the dead individuals were different across the subplots of the study site. From 2005 to 2010, the carbon storage of the deadwood biomass was 142.5 t. The abundance and DBH changes of these trees were the most important factors that determined the biomass of the deadwood in the plot. Due to the differences in vegetation, underground microenvironment, and biological variables, there were significant differences in the distribution of the deadwood biomass between surface layers. Tree mortality was significantly affected by altitude and soil nutrients. The development of forest populations and the gradual emergence of forest health problems led to an increase in biomass contributing to deadwood storage, which is likely to continue to some extent. In contrast, large-scale events and strong disruptions may be important factors affecting the dynamics of deadwood biomass, and the effects of these factors will last for decades or longer. The results of this study help to understand the carbon storage models of subtropical forest ecosystems and can contribute to the development and validation of carbon cycle models.
Author Contributions
Conceptualization, L.M.; methodology, C.S.; software, H.C.; validation, H.S.; formal analysis, H.S. and W.D.; investigation, L.M.; resources, L.M.; data curation, H.C.; writing—original draft preparation, L.M.; writing—review and editing, C.S. All authors have read and agreed to the published version of the manuscript.
Funding
This work was supported by the NSFC-Henan Joint Fund (grant number U1904204), China Postdoctoral Science Foundation (2020M672206), and Background investigation and data integration of forest ecosystem status (2021FY100702).
Acknowledgments
We acknowledge the work of the principal investigators and their field assistants for collecting the field data on the experiment plots. We would like to thank Joseph Elliot at the University of Kansas for her assistance with the English language and grammatical editing of the manuscript.
Conflicts of Interest
The authors declare no conflict of interest.
Appendix A
Table A1.
Allometric regression equations and summary statistics.
Table A1.
Allometric regression equations and summary statistics.
| DBH Class | Equations | Adjusted R2 | Standard Error of the Mean | R. Error (%) |
|---|---|---|---|---|
| DBH ≤ 5 cm | WT = 0.05549 × D2.87776 | 0.91164 | 0.60826 | −0.23 |
| WB = 0.01124 × D3.16237 | 0.81933 | 0.30284 | 0.00 | |
| WL = 0.01551 × D2.32693 | 0.86555 | 0.08602 | 0.42 | |
| WR = 0.02838 × D2.65348 | 0.90495 | 0.22077 | −0.27 | |
| 5 < DBH ≤ 10 cm | WT = 0.11701 × D2.36933 | 0.88428 | 2.05700 | 0.04 |
| WB = 0.01621 × D2.93859 | 0.76490 | 1.79321 | 0.63 | |
| WL = 0.04169 × D1.90082 | 0.68922 | 0.44047 | 0.39 | |
| WR = 0.04977 × D2.19517 | 0.95730 | 0.32819 | −0.16 | |
| 10 < DBH ≤ 20 cm | WT = 0.10769 × D2.34891 | 0.77761 | 4.15734 | 4.55 |
| WB = 0.00385 × D3.15093 | 0.88184 | 3.81171 | 3.69 | |
| WL = 0.00372 × D2.65113 | 0.82848 | 0.96151 | 0.57 | |
| WR = 0.03538 × D2.29567 | 0.81687 | 3.46518 | 0.45 | |
| DBH > 20 cm | WT = 0.03541 × D2.65146 | 0.97844 | 36.71034 | −2.34 |
| WB = 0.00583 × D2.94383 | 0.85965 | 52.85291 | −1.61 | |
| WL = 0.07709 × D1.55399 | 0.71000 | 4.94167 | −0.30 | |
| WR = 0.01128 × D2.67850 | 0.92962 | 24.5010 | −1.11 |
WT = weight of trunk, WB = weight of branch, WL = weight of leaf, WR = weight of root.
References
- Delcourt, C.; Veraverbeke, S. Allometric equations and wood density parameters for estimating aboveground and woody debris biomass in Cajander larch (Larix cajanderi) forests of northeast Siberia. Biogeosciences 2022, 19, 4499–4520. [Google Scholar] [CrossRef]
- Kamara, M.; Said, S. Estimation of aboveground biomass, stand density, and biomass growth per year in the past using stand reconstruction technique in black spruce and Scotch pine in boreal forest. Polar Sci. 2022, 33, 100787. [Google Scholar] [CrossRef]
- Kēnina, L.; Zute, D.; Jaunslaviete, I.; Samariks, V.; Jansons, Ā. Old-Growth Coniferous Stands on Fertile Drained Organic Soil: First Results of Tree Biomass and Deadwood Carbon Stocks in Hemiboreal Latvia. Forests 2022, 13, 279. [Google Scholar] [CrossRef]
- Seedre, M.; Janda, P.; Trotsiuk, V.; Hedwall, P.O.; Morrissey, R.C.; Mikoláš, M.; Bače, R.; Čada, V.; Svoboda, M. Biomass carbon accumulation patterns throughout stand development in primary uneven-aged forest driven by mixed-severity natural disturbances. For. Ecol. Manag. 2020, 455, 117676. [Google Scholar] [CrossRef]
- Shen, C.; Shi, N.; Fu, S.; Ye, W.; Ma, L.; Guan, D. Decline in Aboveground Biomass Due to Fragmentation in Subtropical Forests of China. Forests 2021, 12, 617. [Google Scholar] [CrossRef]
- Privetivy, T.; Samonil, P. Variation in Downed Deadwood Density, Biomass, and Moisture during Decomposition in a Natural Temperate Forest. Forests 2021, 12, 1352. [Google Scholar] [CrossRef]
- Blonska, E.; Lasota, J.; Piaszczyk, W. Carbon and nitrogen stock in deadwood biomass in natural temperate forest along a soil moisture gradient. Plant Biosyst. 2020, 154, 213–221. [Google Scholar] [CrossRef]
- Fonseca, N.; Jacqueline Meunier, I.; Borges Lins-e-Silva, A. Can fallen trees enhance aboveground biomass estimation? A proposal for the Brazilian Atlantic Forest. Rev. Biol. Trop. 2020, 68, 1284–1297. [Google Scholar] [CrossRef]
- Woodall, C.; Fraver, S.; Oswalt, S. Decadal dead wood biomass dynamics of coterminous US forests. Environ. Res. Lett. 2021, 16, 104034. [Google Scholar] [CrossRef]
- Badalamenti, E.; La Mantia, T.; La Mantia, G. Living and Dead Aboveground Biomass in Mediterranean Forests: Evidence of Old-Growth Traits in a Quercus pubescens Willd. s.l. Stand. Forests 2017, 8, 187. [Google Scholar] [CrossRef]
- Elfving, B.; Ulvcrona, K.; Egnell, G. Biomass equations for lodgepole pine in northern Sweden. Can. J. For. Res. 2017, 47, 89–96. [Google Scholar] [CrossRef]
- Kauffman, J.; Ellsworth, L.; Bell, D. Forest structure and biomass reflects the variable effects of fire and land use 15 and 29 years following fire in the western Cascades, Oregon. For. Ecol. Manag. 2019, 453, 117570. [Google Scholar] [CrossRef]
- Ma, L.; Li, W.; Shi, N. Temporal and spatial patterns of aboveground biomass and its driving forces in a subtropical forest: A case study. Pol. J. Ecol. 2019, 67, 95–104. [Google Scholar] [CrossRef]
- Ma, L.; Shen, C.; Lou, D. Patterns of ecosystem carbon density in edge-affected fengshui forests. Ecol. Eng. 2017, 107, 216–223. [Google Scholar] [CrossRef]
- Moreira, A.; Gregoire, T.; do Couto, H. Estimation of the volume, biomass and carbon content of coarse woody debris within two forest types in the State of Sao Paulo, Brazil. Forestry 2019, 92, 278–286. [Google Scholar] [CrossRef]
- Wellbrock, N.; Grüneberg, E.; Riedel, T.; Polley, H. Carbon stocks in tree biomass and soils of German forests. Cent. Euro. For. J. 2017, 63, 105–112. [Google Scholar] [CrossRef]
- Yepes, A.; Sierra, A.; Niño, L.M.; López, M.; Garay, C.; Vargas, D.; Cabrera, E.; Barbosa, A. Biomass and total carbon in oak forests of Southern Colombian Andes: Contributions to the REDD plus project-wide approach. Rev. Biol. Trop. 2016, 64, 399–412. [Google Scholar] [CrossRef] [PubMed]
- Beckman, N.; Wohl, E. Carbon storage in mountainous headwater streams: The role of old-growth forest and logjams. Water Res. Res. 2014, 50, 2376–2393. [Google Scholar] [CrossRef]
- Lutz, J.A.; Larson, A.J.; Furniss, T.J.; Donato, D.C.; Freund, J.A.; Swanson, M.E.; Bible, K.J.; Chen, J.; Franklin, J.F. Spatially nonrandom tree mortality and ingrowth maintain equilibrium pattern in an old-growth Pseudotsuga-Tsuga forest. Ecology 2014, 95, 2047–2054. [Google Scholar] [CrossRef]
- Petritan, I.C.; Marzano, R.; Petritan, A.M.; Lingua, E. Overstory succession in a mixed Quercus petraea-Fagus sylvatica old growth forest revealed through the spatial pattern of competition and mortality. For. Ecol. Manag. 2014, 326, 9–17. [Google Scholar] [CrossRef]
- Shen, Y.; Santiago, L.S.; Shen, H.; Ma, L.; Lian, J.; Cao, H.; Lu, H.; Ye, W. Determinants of change in subtropical tree diameter growth with ontogenetic stage. Oecologia 2014, 175, 1315–1324. [Google Scholar] [CrossRef] [PubMed]
- Wang, Z.; Ye, W.; Cao, H.; Huang, Z.; Lian, J.; Li, L.; Wei, S.; Sun, I.F. Species-topography association in a species-rich subtropical forest of China. Basic App. Ecol. 2009, 10, 648–655. [Google Scholar] [CrossRef]
- Wei, S.G.; Li, L.; Huang, Z.L.; Ye, W.H.; Gong, G.Q.; Zhou, X.Y.; Lian, J.Y. Multifractal analysis of diversity scaling laws in a subtropical forest. Ecol. Complex. 2013, 13, 1–7. [Google Scholar] [CrossRef]
- Wang, Z.F.; Lian, J.Y.; Huang, G.M.; Ye, W.H.; Cao, H.L.; Wang, Z.M. Genetic groups in the common plant species Castanopsis chinensis and their associations with topographic habitats. Oikos 2012, 121, 2044–2051. [Google Scholar] [CrossRef]
- Ma, L.; Chen, C.; Shen, Y.; Wu, L.F.; Huang, Z.L.; Cao, H.L. Determinants of tree survival at local scale in a sub-tropical forest. Ecol. Res. 2014, 29, 69–80. [Google Scholar] [CrossRef]
- Shen, Y.; Santiago, L.S.; Ma, L.; Lin, G.J.; Lian, J.Y.; Cao, H.L.; Ye, W.H. Forest dynamics of a subtropical monsoon forest in Dinghushan, China: Recruitment, mortality and the pace of community change. J. Trop. Ecol. 2013, 29, 131–145. [Google Scholar] [CrossRef]
- Ma, L.; Shen, C.; Lou, D.; Fu, S.; Guan, D. Ecosystem carbon storage in forest fragments of differing patch size. Sci. Rep. 2017, 7, 1–8. [Google Scholar] [CrossRef]
- Wen, D.; Wei, P.; Kong, G. Biomass study of the community of Castanopsis chinensis + Cryptocarya concinna + Schima supera in a Southern China reserve. Acta Ecol. Sin. 1997, 17, 497–504. [Google Scholar]
- Liu, S.; Luo, Y.; Huang, Y. Studies on the community biomass and its allocations of five forest types in Dinghushan Nature Reserve. Ecol. Sci. 2007, 26, 387–393. [Google Scholar]
- R Core Team. R: A Language and Environment for Statistical Computing; R Foundation for Statistical Computing: Vienna, Austria, 2020; Available online: https://www.R-project.org/ (accessed on 1 January 2020).
- Liu, S.Q.; Bian, Z.; An, T.Y.; Xia, C.Z.; Zhang, M.; Chen, J.; Hou, R.P.; Zhang, K.B.; Zhao, H.Q. Carbon pools of biomass and dead organic matter in typical forest ecosystems of Tibet: A new estimation based on the first forestry carbon sequestration monitoring undertaken in China. Land Degrad. Dev. 2021, 32, 2877–2891. [Google Scholar] [CrossRef]
- Lutz, J.A.; Struckman, S.; Germain, S.J.; Furniss, T.J. The importance of large-diameter trees to the creation of snag and deadwood biomass. Ecol. Process. 2021, 10, 1–4. [Google Scholar] [CrossRef]
- Pfeifer, M.; Lefebvre, V.; Turner, E.; Cusack, J.; Khoo, M.; Chey, V.K.; Peni, M.; Ewers, R.M. Deadwood biomass: An underestimated carbon stock in degraded tropical forests? Environ. Res. Lett. 2015, 10, 044019. [Google Scholar] [CrossRef]
- Barlow, J.; Peres, C.A.; Lagan, B.O.; Haugaasen, T. Large tree mortality and the decline of forest biomass following Amazonian wildfires. Ecol. Lett. 2003, 6, 6–8. [Google Scholar] [CrossRef]
- Slik, J.F.; Paoli, G.; McGuire, K.; Amaral, I.; Barroso, J.; Bastian, M.; Blanc, L.; Bongers, F.; Boundja, P.; Clark, C.; et al. Large trees drive forest aboveground biomass variation in moist lowland forests across the tropics. Glob. Ecol. Biogeogr. 2013, 22, 1261–1271. [Google Scholar] [CrossRef]
- Chisholm, R.A.; Muller-Landau, H.C.; Abdul Rahman, K.; Bebber, D.P.; Bin, Y.; Bohlman, S.A.; Bourg, N.A.; Brinks, J.; Bunyavejchewin, S.; Butt, N.; et al. Scale-dependent relationships between tree species richness and ecosystem function in forests. J. Ecol. 2013, 101, 1214–1224. [Google Scholar] [CrossRef]
- Liu, Y.; Yu, G.; Wang, Q. How temperature, precipitation and stand age control the biomass carbon density of global mature forests. Glob. Ecol. Biogeogr. 2014, 23, 323–333. [Google Scholar] [CrossRef]
- Zhang, H.; Chen, H.Y.; Lian, J.; John, R.; Ronghua, L.I.; Liu, H.; Ye, W.; Berninger, F.; Ye, Q. Using functional trait diversity patterns to disentangle the scale-dependent ecological processes in a subtropical forest. Funct. Ecol. 2018, 32, 1379–1389. [Google Scholar] [CrossRef]
- Horak, J.; Vodka, S.; Kout, J.; Halda, J.P.; Bogusch, P.; Pech, P. Biodiversity of most dead wood-dependent organisms in thermophilic temperate oak woodlands thrives on diversity of open landscape structures. For. Ecol. Manag. 2014, 315, 80–85. [Google Scholar] [CrossRef]
- Mataji, A.; Sagheb-Talebi, K.; Eshaghi-Rad, J. Deadwood assessment in different developmental stages of beech (Fagus orientalis Lipsky) stands in Caspian forest ecosystems. Int. J. Environ. Sci. Technol. 2014, 11, 1215–1222. [Google Scholar] [CrossRef]
- Mi, X.; Feng, G.; Hu, Y.; Zhang, J.; Chen, L.; Corlett, R.T.; Hughes, A.C.; Pimm, S.; Schmid, B.; Shi, S.; et al. The global significance of biodiversity science in China: An overview. Natl. Sci. Rev. 2021, 8, nwab032. [Google Scholar] [CrossRef]
- Yuan, Z.; Gazol, A.; Lin, F. Soil organic carbon in an old-growth temperate forest: Spatial pattern, determinants and bias in its quantification. Geoderma 2013, 195, 48–55. [Google Scholar] [CrossRef]
- Karlin, M.; Zapata, R.; Coirini, R. Soil organic carbon and dead biomass pools in woodlands from Monte region (Argentina). Bosque 2021, 42, 67–79. [Google Scholar] [CrossRef]
- Li, L.; Wei, S.G.; Huang, Z.L.; Ye, W.H.; Cao, H.L. Spatial patterns and interspecific associations of three canopy species at different life stages in a subtropical forest, China. J. Integra. Plant Biol. 2008, 50, 1140–1150. [Google Scholar] [CrossRef]
- Smallman, T.L.; Exbrayat, J.F.; Mencuccini, M.; Bloom, A.A.; Williams, M. Assimilation of repeated woody biomass observations constrains decadal ecosystem carbon cycle uncertainty in aggrading forests. J. Geophys. Res-Biogeo. 2017, 122, 528–545. [Google Scholar] [CrossRef]
- Thompson, P.L.; Rayfield, B.; Gonzalez, A. Loss of habitat and connectivity erodes species diversity, ecosystem functioning, and stability in metacommunity networks. Ecography 2017, 40, 98–108. [Google Scholar] [CrossRef]
- Martin, A.R.; Caspersen, J.P.; Fuller, M.M.; Jones, T.A.; Thomas, S.C. Temporal dynamics and causes of postharvest mortality in a selection-managed tolerant hardwood forest. For. Ecol. Manag. 2014, 314, 183–192. [Google Scholar] [CrossRef]
- Philipson, C.D.; Dent, D.H.; O’Brien, M.J.; Chamagne, J.; Dzulkifli, D.; Nilus, R.; Philips, S.; Reynolds, G.; Saner, P.; Hector, A. A trait-based trade-off between growth and mortality: Evidence from 15 tropical tree species using size-specific relative growth rates. Ecol. Evol. 2014, 4, 3675–3688. [Google Scholar] [CrossRef] [PubMed]
- Tanner, E.V.; Rodriguez-Sanchez, F.; Healey, J.R.; Holdaway, R.J.; Bellingham, P.J. Long-term hurricane damage effects on tropical forest tree growth and mortality. Ecology 2014, 95, 2974–2983. [Google Scholar] [CrossRef]
- Zhang, X.; Lei, Y.; Pang, Y.; Liu, X.; Wang, J. Tree mortality in response to climate change induced drought across Beijing, China. Clim. Chang. 2014, 124, 179–190. [Google Scholar] [CrossRef]
Disclaimer/Publisher’s Note: The statements, opinions and data contained in all publications are solely those of the individual author(s) and contributor(s) and not of MDPI and/or the editor(s). MDPI and/or the editor(s) disclaim responsibility for any injury to people or property resulting from any ideas, methods, instructions or products referred to in the content. |
© 2023 by the authors. Licensee MDPI, Basel, Switzerland. This article is an open access article distributed under the terms and conditions of the Creative Commons Attribution (CC BY) license (https://creativecommons.org/licenses/by/4.0/).