Article

Investigating Factors Influencing Rolling Shear Performance of Australian CLT Feedstock

1
Queensland Department of Agriculture and Fisheries, Horticulture and Forestry Science, Salisbury Research Facility, 50 Evans Road, Salisbury, QLD 4107, Australia
2
School of Engineering, University of Southern Queensland, Springfield, QLD 4300, Australia
3
TimberED Services, P.O. Box 8096, Hilton, WA 6163, Australia
4
School of Civil Engineering, The University of Queensland, Brisbane, QLD 4072, Australia
5
School of Engineering, Deakin University, Geelong Waurn Ponds, Geelong, VIC 3216, Australia
*
Author to whom correspondence should be addressed.
Forests 2023, 14(4), 711; https://doi.org/10.3390/f14040711
Submission received: 19 December 2022 / Revised: 22 March 2023 / Accepted: 25 March 2023 / Published: 30 March 2023
(This article belongs to the Special Issue Wood Conversion, Engineered Wood Products and Performance Testing)

Abstract

:
This paper presents an investigation on the influence of various factors on rolling shear (RS) properties of timber feedstock for cross laminated timber (CLT) available from Australian plantation forest resources. Comparison of RS properties between three softwood species namely southern pine, radiata pine and hoop pine are presented. Furthermore, the effect of modulus of elasticity (MOE), equilibrium moisture content (EMC), aspect ratio, knots and projection length on rolling shear behaviour were investigated. Mean RS modulus for radiata pine, southern pine and hoop pine samples were 74.7 MPa, 87.1 MPa and 99.7 MPa, whilst the RS strength of those species were 2.6 MPa, 3.1 MPa and 3.7 MPa, respectively. Radiata pine samples exhibited the lowest values for RS modulus and strength, almost 30% less than those of hoop pine samples. The study confirmed that the density and MOE had a very weak correlation with RS properties for all pine species. There was an obvious decrease in RS modulus (by 18%) when the woods’ conditioned EMC changed from 8% to 12%. A further 33% decrease was observed when the woods’ conditioned EMC increased from 12% to 16%. However, the percentage increase in RS strength was found to be 23% higher in wood with 12% conditioned EMC while compared against wood conditioned to 16% EMC. RS strength improved with increased aspect ratio; however, RS modulus remained almost unaffected. Moreover, the projection length that resulted in the load passing through the centroid of the specimen resulted in lower RS modulus values, but the presence of knots improved both RS strength and modulus for all three tested species.

1. Introduction

Cross laminated timber (CLT) is a relatively new engineered timber product, which has gained global interest as an alternative to traditional construction materials for the building industry. CLT typically consists of an odd number of timber layers with subsequent layers placed orthogonally to each other, and therefore, exhibits better dimensional stability as well as stiffness homogeneity than the feedstock timber lamella used for production [1].
CLT is generally considered as a panel product, which can support considerable loads in both in-plane and out-of-plane directions [2,3]. However, one performance criteria that can limit the product design potential is the rolling shear (RS) properties. RS is defined as the shear stresses in planes perpendicular to the grain when subject to out-of-plane bending due to orthogonal orientation of adjacent layers within CLT. Several research activities reported in the literature have identified factors that may affect RS properties. Wood species and its density, growth (or annual) ring orientation, aspect ratio of lamellas and presence of knots were reported as the key factors that may influence RS properties [4].
Previous research has shown that the RS properties can vary between species. Aicher et al. [5] and Ehrhart et al. [6] reported that hardwoods have significantly higher RS properties when compared to softwoods. Research on various wood species such as Norway spruce [7,8,9,10,11,12,13], Irish Sitka spruce [14], European beech [5], North American softwoods [15], Canadian black spruce [16], Japanese cedar [17], New Zealand Douglas fir and Radiata pine [18,19] were reported with considerable differences in RS properties. Density is one of the most common parameters investigated as an indicator of timber strength and elastic properties. A positive relationship between density and RS modulus was reported in [6,15,20], whilst a somewhat weak correlation was reported in [5].
The effect of sawing pattern (or growth ring orientation within the sawn boards) on RS were investigated by various researchers [5,9,17,21,22,23] concluding that sawing patterns have a remarkable influence on RS modulus, but the effect on RS strength was not statistically significant. Semi-quarter sawn boards (45° growth ring orientation) exhibited the highest RS properties since the truss-like reinforcement system seemed to offer better shear transfer when compared to quarter sawn or flat sawn boards.
The aspect ratio of timber boards was also investigated and confirmed as having a major influence on RS properties [9,21,22,24,25,26]. RS properties were reported to increase as the aspect ratio increased and it is commonly acknowledged that the aspect ratio should be no less than four [18,27,28]. Although knots are known to negatively impact the bending stiffness of timber boards, outcomes from previous research showed that knots in cross layers of CLT panels can have a positive influence on RS properties [29,30,31].
It is worth noting that most of the aforementioned research focused on the RS properties of CLT panels produced from European and North American timber species. Some recent studies reported RS properties of CLT panels produced from Australian radiata pine and New Zealand Douglas fir [18,19,32] and Australian Plantation Eucalyptus nitens [33]. However, no previous study has investigated the RS properties of CLT feedstock boards from commercially available Australian softwoods such as southern, hoop and radiata pine and examine the impact of various factors on RS properties. Currently, in the absence of detailed and reliable experimental evidence, a prominent Australian CLT manufacturer uses what is hypothesised to be a conservative RS modulus value of 30–40 MPa and RS strength value of 1.2 MPa [34]. A more comprehensive understanding of the RS properties of the sawn timber feedstock available from Australian forest resources is likely to facilitate more efficient and optimised CLT manufacture.
The current research aims to quantify the RS performance of important Australian commercial timber species being used or considered for use in CLT manufacturing, providing guidance on species and feedstock grade suitability. More specifically, this study aims to investigate:
  • The effect of the equilibrium moisture content (EMC) on RS properties;
  • The effect of MOE on RS properties;
  • The effect of aspect ratio on RS properties;
  • The RS properties of three major Australian softwoods (southern pine, radiata pine and hoop pine) examining the effect of species and density;
  • The effect of knots on the of RS properties;
  • The effect of test specimen projection length.

2. Materials and Methods

2.1. Sample Preparation

Feedstock boards used in the current study were supplied from commercial processors in an ungraded but seasoned condition. Boards with minimum defect and back sawn orientation were selected for sample preparation. All boards were first assessed for dynamic MOE using the BING (Beam Identification by Non-destructive Grading) system [35]. Resonance methods (like BING) have demonstrated exceptional robustness and accuracy due to their fundamental principles and straightforward metrological approach [36]. Selected boards were then used to prepare 100 mm long sub-pieces for RS specimen manufacture [35]. The load transfer plates were glued to the specimen using a one-component moisture-curing polyurethane (1C-PUR) adhesive (Jowat PUR 686.70) at a spread rate of 200–250 gsm. Higher MGP (machine graded pine) grade southern pine boards (approximately 15,000 MPa) were used as load transfer plates. The samples were pressed at 0.8 MPa for approximately 2 h and stored in a conditioning chamber at 20 °C and 60% relative humidity (RH) until mass reached a point of equilibrium. RS tests were conducted using EN 408 [37] alike test as recommendations in Kumar et al. [4]. The projection length for the aspect ratio tests was adjusted in such a way that the load remained vertical and passed through the centroid of the specimens with varying thickness, while keeping the test angle (14°) consistent following the technique presented in [4]. The key variables of interest, as listed in Table 1, included moisture content (MC), MOE (parallel to grain), specimen aspect ratio, species, knottiness and projection lengths. Details will be elaborated in the following section.

2.2. Measurement and Analysis Techniques

Sample displacements were measured at various points using a Digital Image Correlation (DIC) system (Figure 1), which used USB cameras (Basler Ace USB 3.0 Camera) at a pre-defined distance from the target sample. The cameras were configured with 17 mm lenses and a frame rate of 0.5 s and set at a distance of approximately 0.5 m from the samples. This allowed for an appropriate test area to be established between the sample and the cameras while achieving accurate image data from the tests. The samples were first painted with a speckle pattern to give a random display of black and white contrast in the images captured by the DIC system. The system then applied an appropriately sized grid over the sample surface and tracked each individual grid square and the corresponding pixel displacement during the test. Using a pair of virtual deflection gauges positioned on either face of the test board, a virtual extensometer was created as presented in [4]. Based on the virtual extensometer information extracted from the test, displacement in millimetres resolved into the relevant movement axes can be accurately obtained using DIC techniques for RS calculations. Mechanical testing of the RS specimens was conducted using a Shimadzu universal testing machine (AG-100X, Shimadzu Corporation, Kyoto, Japan) with a 100 kN load cell fitted. The loading speed was 1.5 mm/min to ensure sufficient image data were collected prior to failure.
The RS properties were calculated based on considering the displacement at the midpoint of the plates. The RS strength (fr) and the apparent RS modulus (Gr) were calculated using Equations (1) and (2), respectively, as proposed by Wang et al. [1].
f r = F m a x · c o s α L · w
G r = Δ τ R Δ γ R   = t c   L · w   ·   Δ F Δ x · c o s   α
where, F m a x is the peak load. L and w are the length and width of the specimen, respectively; t c is the thickness of the cross-layer; Δ F / Δ x is the slope of the load-deformation curve between 10% and 40% linear range from the first loading step, and α is the angle between the shear plane and the force direction. The distribution of the data has been presented in the majority of cases as the mean, coefficient of variation (CoV), and 5th percentile for the shear modulus and strength. The 5th percentile values have been determined through considering the data set to fit that of a lognormal distribution.

2.3. Details of the Key Factors Considered in the Current Study

2.3.1. Equilibrium Moisture Content (EMC)

Plantation grown hybrid southern pine (a hybrid between Pinus elliottii and Pinus Caribaea) was used to manufacture 45 specimens in total with a cross section of 135 × 30 mm and a 56.6 mm projection length; three groups of specimens with 15 for each target EMC were considered for investigation. The tested specimens had an average MOE of 9790 MPa and were conditioned to 3 different environmental conditions to achieve approximate EMC, i.e., 8%, 12% and 16%. These conditions were 23 °C and 45% RH (for target EMC of 8%), 20 °C and 60% RH (for target EMC of 12%), and 25 °C and 80% RH (for target EMC of 16%). Samples were manufactured and conditioned for a period of 2 weeks and their mass monitored until a constant mass was achieved and the samples assumed to be conditioned to the respective EMC.

2.3.2. MOE (Parallel to Grain)

The effect of MOE on RS performance was tested for both southern pine and radiata pine (Pinus radiata). Southern pine boards were segregated based on their target MOE ranging between 6000 MPa to 12,000 with a scatter of ±500 MPa where possible using the BING system. Fifteen test specimens were chosen for each of the six MOE groups. For radiata pine, 37 samples were obtained from 6 boards having an average MOE of 10,089 MPa with variability of MOE ranging from 7914–15,194 MPa.

2.3.3. Aspect Ratio (AR)

Sixty samples in total were manufactured with a target MOE of 10,000 MPa to evaluate the effect of aspect ratio. Three aspect ratios of boards were tested with dimensions of 90 mm × 30 mm, 135 mm × 30 mm and 135 mm × 20 mm, resulting in aspect ratio of 3, 4.5 and 6.75, respectively. To achieve considered aspect ratios, adjustments on the projection length of the plates were made to ensure that the load could pass through the centre of the sample with a vertical load path whilst maintaining a constant specimen angle. Sample configurations for the selected aspect ratios are shown in Figure 2.

2.3.4. Species

Three species, i.e., southern pine, radiata pine and hoop pine (araucaria cunninghamii) were considered in the current study to investigate the variation in RS properties due to change in species as well as density. The average air-dry density values were 456, 537 and 491 kg/m3 for radiata pine, southern pine and hoop pine, respectively. To minimise the effect of external factors, test boards were selected with an MOE targeting 10,000 ± 1000 MPa and free of defects such as knots, splits and resin shakes.

2.3.5. Knots

Following the investigations on species, same sized samples (cross section of 135 × 30 mm and a 56.6 mm projection length, target MOE of 10,000 MPa) but with sound centered knots (Figure 3) were carefully selected for 3 species to investigate the effects of knottiness. A total number of 45 knot samples including 15 for each species were tested.

2.3.6. Projection Length

Tests were conducted on 29 samples to verify the influence of the projection length (protrusion) and consequential loading path passing through the centroid. For 0 and 20 mm, a total of seven samples were tested which were sourced from the same board. For 57 mm samples, a total of 15 samples were tested which were manufactured from a range of boards. The sample cross section of 135 × 30 mm was kept consistent for all samples with a target MOE of 10,000 MPa. The projection length of plate from the end of specimens were 0, 20 and 57 mm. The 57 mm projection makes the load pass through the centroid vertically whereas the other two projections cause some eccentricity. Test specimen angle was constant at 14°. Figure 4 shows the samples with different projection lengths.

2.3.7. Statistical Analysis

Analysis of variance (ANOVA) and pairwise comparisons using Fisher’s least significant difference (LSD) test were used for pairwise comparisons of groups using the open-source statistical package RStudio (version 1.3.1058, RStudio, Boston, MA, USA). Analysis of variance was conducted to determine standard error, R2 value, effect of the board from which the samples were sourced from and p-value (at 5% level of significance). When there were more than two entities (e.g., more than two species) which affects the outcome (rolling shear modulus and strength), pairwise t-test was conducted to determine how different the outcome values are from one entity to the other.
Variations among the boards from which samples were made is common for timber, since it is a natural material. Therefore, effect of board is taken into account and the effect of the variation among the boards are blocked in the statistical analysis. Blocking is common in manufacturing when the desired property of a product is tested from different batches [38].

3. Results and Discussion

3.1. Effect of EMC

The effect of EMC was investigated using Southern pine samples. Reference EMC was considered to be 12% and was then compared against 8% and 16% EMCs. The failure modes, load vs displacement curves and rolling shear properties were investigated. Obtained results are summarised in Table 2.
The mean RS strength of 8, 12 and 16% EMC samples were found to be 2.93, 3.20 and 2.61 MPa, respectively. It shows that 12% EMC yielded the optimum RS strength. The CoV of RS modulus is within the range similar to the RS strength, as shown in Table 2. The mean shears moduli were found to be 80.60, 95.01 and 60.66 MPa for 8, 12 and 16% moisture content, respectively. Unlike RS strength, which attained the maximum value at 12% MC, a decreasing trend can be observed for RS modulus with the increase in moisture within the samples.
Figure 5 demonstrates the effect of moisture content on the rolling shear strength and modulus. Fishers LSL test showed that the rolling shear modulus and strength were significantly different to each other for the various moisture content. It can also be noticed that RS modulus decreases with the increase in MC value, while the maximum RS strength is observed for 12% MC. As the moisture increases, timber become softer. As such, less load is needed to cause same amount of deformation. Therefore, RS modulus decreases with the increase in moisture content.
In contrast, RS strength is found to be increasing up to 12% MC followed by decreasing strength. Therefore, there is an optimum amount of moisture which help increase the RS strength initially. Beyond the optimum amount, the fibres are weakened by the higher amount moisture that leads to lower RS strength.

3.1.1. Failure Modes and Load vs. Displacement Curve

The load vs displacement curves for EMC associated with 8, 12 and 16% are illustrated in Figure 6 where the curves presented display the individual test specimen loading curves for each EMC group. As evident in the plot, higher moisture content alters the behaviour of failure by making the sample behave in a more ductile manner. The non-linear part of the curve for an EMC of 16% is longer than their 12 and 8% counterparts. As a result, more displacement can be observed as moisture content increases from 8 to 16%.
The change in failure behaviour can also be observed from the failure planes of the samples when subjected to different moisture content. In general, the failure modes produced multiple fracture paths for 8 and 12% EMC, whereas a single plane of failure was observed for 16% EMC which could be responsible for lower standard deviation for 16% samples.
Potential reason for higher ductility for increased moisture content can be attributed to the application of compressive force for the rolling shear test. This compression causes bearing/densification under the load cell which is also increases by the increase in moisture content. This bearing/local densification effect can be seen as the non-linearity in the load vs deformation curve. With the increase in moisture content, timber becomes softer, resulting in more bearing/local densification and hence, the non-linearity. This non-linearity increases the ductility as MC increases.

3.1.2. Statistical Analysis

Further discussions, based on aforementioned experimental results, through statistical analysis (ANOVA) were carried out to investigate the effect of EMC on the RS properties, as shown in Table 3. A general linear model was implemented as RS strength vs moisture content, and the model summary is shown in Table 3 (fr—shear strength, Gr—shear moduli).
At the 5% level of significance (α = 0.05), the p-value is found to be 0.032, strengthening the fact that moisture has a significant effect on the mean value of RS strength at different moisture content. However, the aforementioned general linear model does not consider the effect of the various boards from which the 15 samples were made. Accordingly, an R2 value of only 10.53% was obtained. This is also evident from the high sum of square (SS) value of the error term (6.1 out of a total of 6.81). When the effect of board is considered, the R2 value increased to 64.37% and hence, the error in the model is reduced significantly (SE = 0.29 and SSerror = 2.43). Nevertheless, the p-value remains less than 0.05, confirming the significant effect of moisture content on the RS strength. The p-value of the board is also less than 0.05 and hence, affects the RS strength.
Similar to the RS strength, both moisture content and the boards (from which the samples were made) have a significant effect on the RS modulus, as p-value is less than 0.05 (5% level of significance). However, this effect is less pronounced for RS modulus compared to RS strength, as R2 value is 66.88% for RS modulus (using general linear model) without considering the effect of boards (Table 3 (Gr)). Fisher’s least significant difference (LSD) showed that both RS strength and modulus were significantly different between 8, 12 and 16% MC. By comparing Table 3 (fr) and (Gr), it can be observed that the sum of squares (SS) of the error term is more than the effect of moisture content for RS strength, whereas the opposite behaviour is observed for RS modulus. Nevertheless, considering the effect of boards reduces the error in the model and an improved R2 value of 89.89% is achieved. Figure 5 display how the boards affect the mean RS modulus with the increase in MC from 8 to 16%.

3.2. Effect of MOE

The effect of MOE on the RS properties of southern pine was explored by dividing the samples into 5 groups, i.e., 6, 7, 8, 10 and 12 GPa, respectively. Obtained results are shown in Table 4 for fr and Gr, respectively.
The box and whisker plot for RS strength is depicted in Figure 7. The mean RS strength of the five MOE groups were found to be within the range of 3.05–3.36 MPa. Relevant characteristic values are 2.55, 2.03, 2.23, 2.33 and 2.65 for 6, 7, 8, 10 and 12 GPa MOE, respectively, showing an average RS strength of 2.36 MPa. The mean RS moduli of the five MOE groups were within the range of 85.65–98.87 MPa. One outlier data point associated with the 8 GPa group was discarded for the calculation of the mean value. The 5th percentile/characteristic RS modulus are 66.39, 75.57, 72.46, 68.97 and 83.75 MPa for 6, 7, 8, 10 and 12 GPa MOE, respectively, with an average modulus value of 73.43 MPa.

3.2.1. Failure Modes

The failure modes of each of the MOE grouping for the southern pine samples were visually assessed and found there were some variations in the mode types between MOE groups. The lower grade 6 and 7 GPa samples produced several fracture lines. Furthermore, MOE groups of 8, 9 and 10 GPa produced consistent failures likened to a typical RS failure mode with minimal or single fracture lines. The 12 GPa MOE group produced the one fracture line after testing, the point of failure would initiate as RS but then propagate through to an interface separation. Post-inspection of the samples indicated this was not a glue line failure but a failure in tension perpendicular to the face grain of the projection boards. Figure 8 presents an example of the observed failure modes across the 6 tested MOE groupings.

3.2.2. Statistical Analysis

Similar statistical tools are used to analyse the effects of MOE on RS properties using southern pine samples, as shown in Table 5 for fr and Gr, respectively.
Based on the obtained results, there was no specific trend/relationship observed in the data between MOE and RS strength while linear regression was performed. This can be emphasized by the p-value of 0.711 which is far from the 5% level of significance (α = 0.05), ensuring the fact that there is not enough evidence to reject the null hypothesis (all the means are equal). Even though the MOE is not significantly affecting the RS Strength value, the board has significant impact on the results. As shown in Table 5 (fr), the p-value associated with boards, from which the samples were made, is very close to zero. Thus, the boards have a significant effect on the RS strength. The possible reasons for this could be the variation in annual ring orientation of the boards and the location of the boards within the tree.
The conclusion drawn above for southern pine is also applicable for radiata pine. Figure 9a shows the RS strength of radiata pine as a function of MOE, and it can be seen that the RS strength is scattered around the mean value of 2.7 MPa.
Similar to RS strength, there was no significant relationship between MOE and RS modulus (p-value = 0.52). Again, the boards were found to be influential on the variation in RS modulus between groups (p-value = 0.025), rather than the MOE (Table 5 (Gr)). The radiata pine samples yielded the same conclusions, as observed in Figure 9b since the RS moduli were scattered around the mean value across the whole MOE range.

3.3. Aspect Ratio

The effect of aspect ratio (AR 3.0, 4.5 and 6.75) was investigated for both the southern pine and radiata pine samples. The target MOE for all the samples were 10,000 MPa. Obtained results are summarised in Table 6 for fr and Gr, respectively.
The mean RS strength of southern pine samples regarding the three considered AR groups were found to be within the range of 2.70–3.25 MPa, and characteristic values were 2.18, 2.33, 2.82 for AR 3.0, 4.5 and 6.75, respectively. For radiata pine samples, relevant characteristic RS strength were obtained as 1.96, 1.79 and 2.08. Similarly, characteristic RS modulus in regard to AR 3.0, 4.5 and 6.75 for southern pine samples were 72.28, 68.97 and 57.83 MPa, whilst that for radiata pine samples were 67.45, 68.43 and 66.61, respectively.
Figure 10 shows the box and whisker plots of the RS strength and modulus. As discussed above, an increase in mean RS strength is observed with an increased AR. The same trend, i.e., increase in mean RS modulus with increased AR can be seen in Figure 10a. It is noted that there was an outlier value obtained for AR 6.75 and the mean value is calculated by discarding the outlier. Nevertheless, the increase in slope for RS modulus is significantly less than RS strength. The 5th percentile values for RS strength related to AR of 3, 4.5 and 6.75 were 2.18, 2.33 and 2.82 MPa, respectively, whereas the same for RS modulus were found to be 72.28, 68.97 and 57.83 MPa, respectively. Therefore, the characteristic (5th percentile) RS strength is still showing an increasing trend with respect to AR. In contrast, the characteristic value for RS modulus exhibits an inverse relationship. Considering the p-value (Table 7), slope of the fitted line (Figure 10) and 5th percentile, it can be concluded that the effect of AR on RS modulus is negligible. The same conclusion can be made for radiata pine samples (Figure 10).

3.3.1. Failure Modes and Load vs. Displacement Curve

The load vs displacement relationship for both the southern pine and radiata pine samples are depicted in Figure 11. No significant difference in terms of load-displacement behaviour can be observed between species. The behaviour also remains similar as AR increases.
The failure modes (presented in Figure 12) of each of the aspect ratio (AR) boards for the two species groups were visually assessed and found there were some variations in the mode types between ARs. ARs 4.5 and 6.75 produced consistent failures likened to a typical RS failure whereas AR 3.0 produced varying results with samples occasionally producing failures in the bonded interface. This is a result of the central axial being more centralized through AR 4.5 and 6.75 whereas 3.0 provides more opportunities for stress development in the bonded interfaces.
Careful inspection of the failure modes suggests two clear modes of failure across the two species. The AR 6.75 samples present multiple fracture lines and failure points in the test specimen for both species, respectively. This is shown in the loading curves of Figure 8 where, in some instances, there is an initial point of failure, followed by consecutive other failure points where load increases, reaches a point and decreases, and repeats. The AR 4.5 samples present less fracture lines than the AR 6.75 samples although the AR 3.0 samples resulted in single fracture lines or at times failures along the grown rings (a form of shelling).

3.3.2. Rolling Shear Properties (Strength and Modulus)

Both the aspect ratio and the boards from which the samples were made had a significant effect on the rolling shear strength. Interestingly, this behaviour was not observed for rolling shear modulus though. As tabulated in Table 7, the p-value related to RS modulus is 0.56 and 0.817 associated with aspect ratio and the boards, illustrating the fact that neither AR nor the boards had any significant effect on the RS modulus. However, the R2 value for this case is only 17.19% and hence, the p-value alone cannot explain the true effect of AR is this regard.
Table 7 shows the details of analysis regarding RS properties due to the effects of AR for fr and Gr, respectively.
For southern pine samples, rolling shear strength/ultimate load increases with increased aspect ratio. This is also evident from the p-value in Table 7, where it is reported to be less than 0.05.

3.4. Species and Knots

Three species (southern, radiata and hoop pine) were taken into account to examine the effect of species (no knots) on the rolling shear properties. Meanwhile, the effects of knottiness (knots) are also considered separately. Table 8 shows the results for fr and Gr, respectively.

3.4.1. Species

Figure 13 shows the boxplots of rolling shear properties obtained from three considered softwood species such as Radiata pine, Southern pine and Hoop pine. As shown in Table 8 (no knots), the mean RS strengths were 2.64 MPa, 3.05 MPa and 3.68 MPa for radiata, southern and hoop pine, respectively, while the average RS modulus were 74.74 MPa, 87.12 MPa and 99.67 MPa, respectively. It is obvious that each wood species showed clear differences in both RS modulus and RS strength. Radiata pine samples exhibited the lowest values for RS modulus and RS strength; almost 35% lower than hoop pine. Fishers LSD test showed that the RS modulus were significantly different between all species. For RS strength, Fishers LSD test showed the RS strength for radiata pine and southern pine were not significantly different to each other but both are different to hoop pine. The variation in results observed may have been caused due to differences in annual ring structures. Fishers LSD test also showed that that RS modulus are significantly different between any two species considered in this study as indicated by the letter in Figure 13.
The majority of failure in southern pine and radiata pine samples occurred along the growth rings. Unlike radiata pine and southern pine, hoop pine has indistinct (unclear earlywood–latewood interface) growth rings, which may have also contributed to higher RS properties for hoop pine.
Figure 14 depicts the correlation between RS properties (strength and modulus) and density. A very weak positive correlation (R2 = 10.5%) between density and RS modulus was found for southern pine. However, almost no relationship was observed between density and RS modulus (R2 = 2.2%) for radiata pine. On the contrary, a very weak positive correlation was found between RS strength and density for both southern pine and radiata pine with an R2 value of 18.5%. These results indicate that the density does not influence the RS properties, which confirm that the use of lower density and MOE timber in the cross-layers of cross laminated timer (CLT) panels will not significantly reduce the performance of the panel under loading due to the contribution of RS. A positive relationship between density and RS modulus was reported in some research [6,15,20], whilst a somewhat weak correlation was reported in other [5].
The RS strength properties measured on CLT sections of New Zealand radiata pine were slightly lower (2.33 MPa) for 20 mm thick laminates compared to this study (2.64 MPa) [19,32]. The 5th percentile value for RS strength were 1.79, 2.33 and 2.34 MPa for radiata, southern and hoop pine, respectively, while the 5th percentile values for RS modulus were 61.71, 68.97 and 84.93 MPa.

3.4.2. Knots

It is important to note that samples with sound centred knots did not affect the shear properties in a negative way but showed some improvements in both strength and modulus regardless of species, as shown in Table 8 (knots). Characteristic RS strength (modulus) for radiata, southern and hoop pine were 2.18 (79.42), 2.70 (109.06) and 2.60 (147.32) MPa, respectively. Figure 15 shows the box-and-whisker plots of obtained RS strength and RS modulus (Figure 15) for samples with and without knots.
It is clear that the presence of knots improved the RS properties (both strength and modulus) for all three tested species. However, their effects on RS modulus seemed to be strongly dependent on species considered herein showing a modest increase of 17% for radiata pine samples, a considerable increase of 36% for southern pine samples and a significant increase of 55% for hoop pine samples when compared with relevant clear samples without knots. In contrast, knots effects on RS strength were somewhat comparable regardless of species type, i.e., 21% for radiata pine samples, 26% for southern pine samples and 23% for hoop pine samples. Current outcomes confirmed previous research [24,31] reported that, in some cases, the present of knots in timber boards contributed to improved shear modulus to some extent and would not negatively affect RS strength.

3.5. Projection Length

A subset of southern pine samples were tested to investigate the effect of projection length regarding 0 mm, 20 mm and 57 mm. Table 9 shows all obtained results for fr and Gr, respectively.
Details of analysis on the effects of projection length on RS properties are summarised in Table 10.
The average RS strength for samples with considered projection length of 0 mm, 20 mm and 57 mm were 3.02, 3.50 and 3.05 MPa, while the mean RS modulus values were 94.84, 104.82 and 87.12 MPa, respectively. The 5th percentile value for RS strength (modulus) were 2.27 (73.22), 2.77 (73.10) and 2.33 (68.97) MPa, respectively.

3.5.1. Failure Modes and Load–Displacement Curves

The failure modes and load vs displacement curves for the different projection lengths are shown in Figure 16. While the failure modes for 20- and 57-mm projection length exhibited were similar, the failure along the annual ring was not very prominent for the samples with 0 mm projection length. As the projection length increased, the non-linear part of the load-displacement curve also increased. Accordingly, higher ultimate displacements were achieved with a 57 mm projection length. Lower projection length samples were susceptible to brittle failure, possibly due to the delamination between the sample and the load transfer plates. Therefore, a higher projection length is recommended to ensure pure rolling shear failure.

3.5.2. Statistical Analysis

Analysing the post hoc pairwise comparison, the same conclusion can be made, i.e., there is no significant difference in mean RS strength and modulus between any two projection lengths. However, the R2 value suggests that only 13.7 and 16.61% of the behaviour can be explained while comparing projection length vs RS properties, resulting in large sums of square for the error term. As discussed previously, differences in boards from which the samples were made had a significant effect on the results, potentially due to variation in growth ring orientation and the age of the tree used for the sawn boards. Accordingly, in Table 10, the effect of the boards is considered in the general linear regression which improve the R2 value to 93.78 and 84.60% for RS strength and modulus, respectively. By comparing the p-values, while considering the effect of boards, it is evident that projection length does affect the RS strength significantly (p-value close to zero). However, this effect is much less pronounced on the RS modulus (p-value = 0.084).
Statistically, there is not sufficient evidence to confirm that projection length has a significant impact on the RS properties since p-values associated with RS strength and RS modulus were 0.15 and 0.094, respectively, which are higher than the level of significance (0.05).

4. Conclusions

The investigation of factors affecting RS on Australian plantation grown pine species have been presented in this article. The summarised achievements and highlights of this study are as follows:
  • Results showed that timber species and moisture content (MC) significantly affect the shear strength (fr) and moduli (Gr). Hoop pine has the highest RS strength and moduli followed by southern pine and radiata pine. Mean RS modulus for radiata pine, southern pine and hoop pine samples were 74.7 MPa, 87.1 MPa and 99.7 MPa, respectively, whilst mean RS strength values were 2.6 MPa, 3.1 MPa and 3.7 MPa, respectively. When the moisture content (MC) value is increased from 8% to 16%, there is a reduction in the RS modulus. However, the maximum RS strength is detected when the MC level is at 12%.
  • Presence of knots improved the RS properties (both strength and modulus) for all three tested species.
  • Aspect ratio affects rolling shear strength significantly; however, its effect on rolling shear modulus is not significant.
  • Specimen density and MOE showed very weak correlation with both RS modulus and strength, indicating that RS properties are independent of MOE and density for the species tested, within the density and MOE ranges tested. However, it can be noted that the parent boards from which the test specimens originated have a significant impact on the results, even for the same species. This may be associated with the variation in growth ring orientation and age of the tree from which the board were sourced.
  • While our study focused on flat sawn boards, the growth ring orientation may differ across specimens. Therefore, further investigation could be conducted to investigate the effect of growth ring orientation on the rolling shear properties.

Author Contributions

Conceptualization, C.K.; methodology, C.K., J.S. and R.L.M.; experimental test, A.F. and C.K.; data analysis, C.K., M.S., A.F. and X.L.; writing—original draft preparation, C.K.; writing—review and editing, M.A., M.S. and X.L.; project administration, R.L.M. All authors have read and agreed to the published version of the manuscript.
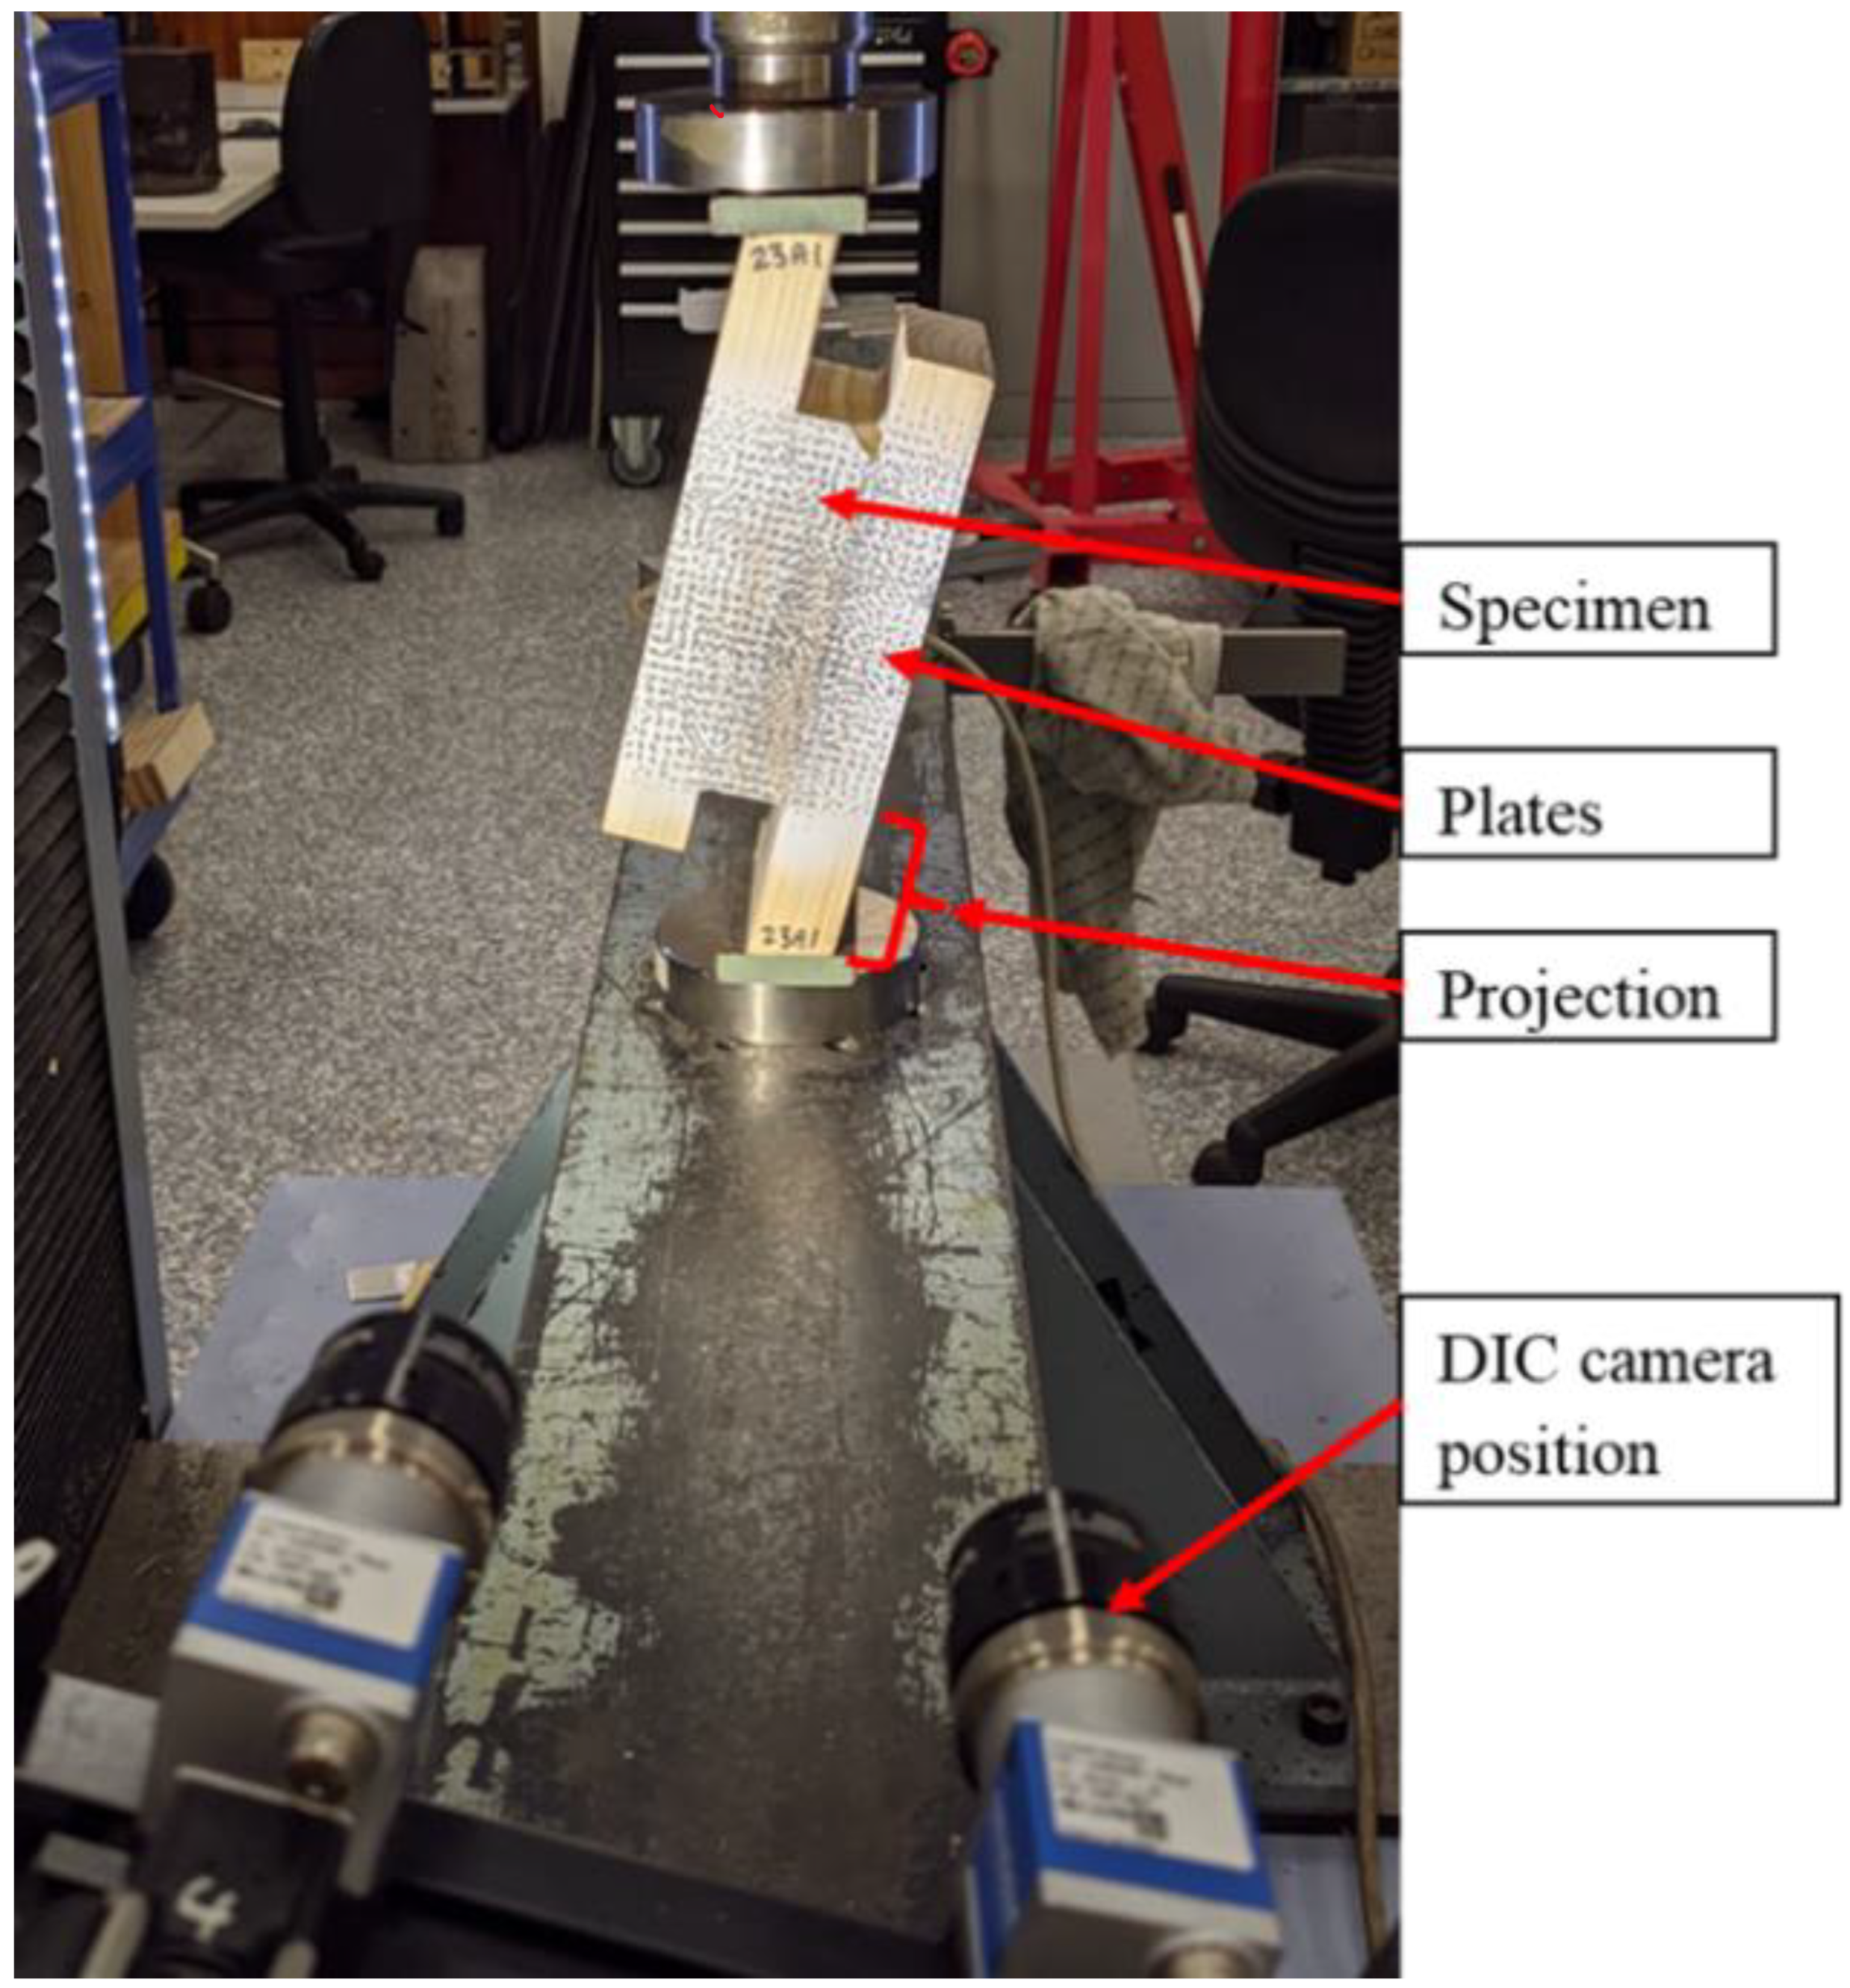
Funding

The authors acknowledge the Australian Research Council and the Centre for Future Timber Structures (IH150100030) for the funding support provided for this research. The support provided by the Queensland Government, Department of Agriculture and Fisheries (DAF), through the provision of the unique facilities located at the Salisbury Research Facility is acknowledged as critical to facilitate studies of this nature.

Data Availability Statement

All results have been summarised through this article. Full information will be made available on readers request.

Acknowledgments

Daniel Field is acknowledged for his contribution to sample preparation, while Rica Minnet is acknowledged for measurement of the dynamic MOE. The authors are also grateful to Hyne Timber and XLam for supplying the timber for this project and technical support.

Conflicts of Interest

The authors declare no conflict of interest.

References

  1. Wang, Z.; Zhou, J.; Dong, W.; Yao, Y.; Gong, M. Influence of technical characteristics on the rolling shear properties of cross laminated timber by modified planar shear tests. Maderas Cienc. Tecnol. 2018, 20, 469–478. [Google Scholar] [CrossRef] [Green Version]
  2. Li, X.; Ashraf, M.; Subhani, M.; Kafle, B.; Kremer, P. Resistance of Cross Laminated Timber Members Under Axial Loading—A Review of Current Design Rules. In CIGOS 2019, Innovation for Sustainable Infrastructure: Proceedings of the 5th International Conference on Geotechnics, Civil Engineering Works and Structures; Springer: Singapore, 2020; pp. 179–184. [Google Scholar]
  3. Li, X.; Ashraf, M.; Subhani, M.; Kremer, P.; Kafle, B.; Ghabraie, K. Experimental and numerical study on bending properties of heterogeneous lamella layups in cross laminated timber using Australian Radiata Pine. Constr. Build. Mater. 2020, 247, 118525. [Google Scholar] [CrossRef]
  4. Kumar, C.; Li, X.; Subhani, M.; Shanks, J.; Dakin, T.; McGavin, R.; Ashraf, M.A. A review of factors influencing rolling shear in CLT and test methodology. J. Test. Eval. 2021, 50. [Google Scholar] [CrossRef]
  5. Aicher, S.; Christian, Z.; Hirsch, M. Rolling shear modulus and strength of beech wood laminations. Holzforschung 2016, 70, 773–781. [Google Scholar] [CrossRef]
  6. Ehrhart, T.; Brandner, R. Rolling shear: Test configurations and properties of some European soft- and hardwood species. Eng. Struct. 2018, 172, 554–572. [Google Scholar] [CrossRef]
  7. Dahl, K.B.; Malo, K.A. Linear shear properties of spruce softwood. Wood Sci. Technol. 2009, 43, 499–525. [Google Scholar] [CrossRef]
  8. Neuhaus, F. Elastizitätszahlen von Fichtenholz in Abhängigkeit von der Holzfeuchtigkeit. Ruhr-Universität Bochum, Institut für konstruktiven Ingenieurbau, Mitteilung Nr. 81-8, 1981. RQ: 1981.
  9. Görlacher, R. Ein Verfahren zur Ermittlung des Rollschubmoduls von Holz. Eur. J. Wood Wood Prod. 2002, 60, 317–322. [Google Scholar] [CrossRef]
  10. Hassel, B.I.; Berard, P.; Modén, C.S.; Berglund, L.A. The single cube apparatus for shear testing—Full-field strain data and finite element analysis of wood in transverse shear. Compos. Sci. Technol. 2009, 69, 877–882. [Google Scholar] [CrossRef]
  11. Mestek, P. Punktgestützte Flächentragwerke aus Brettsperrholz (BSP)–Schubbemessung unter Berücksichtigung von Schubverstärkungen. Ph.D. Thesis, Technische Universität München, Munich, Germany, 2011. [Google Scholar]
  12. Flaig, M. Biegeträger aus Brettsperrholz bei Beanspruchung in Plattenebene; KIT Scientific Publishing: Karlsruhe, Germany, 2013; Volume 26. [Google Scholar]
  13. Franzoni, L.; Lebée, A.; Lyon, F.; Foret, G. Bending behavior of regularly spaced CLT panels. In Proceedings of the WCTE 2016—World Conference on Timber Engineering, Vienna, Austria, 22–25 August 2016. [Google Scholar]
  14. Sikora, K.S.; McPolin, D.O.; Harte, A.M. Effects of the thickness of cross-laminated timber (CLT) panels made from Irish Sitka spruce on mechanical performance in bending and shear. Constr. Build. Mater. 2016, 116, 141–150. [Google Scholar] [CrossRef] [Green Version]
  15. Bendtsen, B. Rolling shear characteristics of nine structural softwoods. For. Prod. J. 1976, 26, 51–56. [Google Scholar]
  16. Zhou, Q.; Gong, M.; Chui, Y.H.; Mohammad, M. Measurement of rolling shear modulus and strength of cross laminated timber fabricated with black spruce. Constr. Build. Mater. 2014, 64, 379–386. [Google Scholar] [CrossRef]
  17. Ukyo, S.; Shindo, K.; Miyatake, A. Evaluation of rolling shear modulus and strength of Japanese cedar cross-laminated timber (CLT) laminae. J. Wood Sci. 2019, 65, 31. [Google Scholar] [CrossRef] [Green Version]
  18. Li, M. Evaluating rolling shear strength properties of cross-laminated timber by short-span bending tests and modified planar shear tests. J. Wood Sci. 2017, 63, 331–337. [Google Scholar] [CrossRef]
  19. Li, M.; Dong, W.; Lim, H. Influence of Lamination Aspect Ratios and Test Methods on Rolling Shear Strength Evaluation of Cross-Laminated Timber. J. Mater. Civ. Eng. 2019, 31, 04019310. [Google Scholar] [CrossRef] [Green Version]
  20. Fellmoser, P.; Blaß, H.J. Influence of rolling shear modulus on strength and stiffness of structural bonded timber elements. In Proceedings of the CIB-W18 Meeting, Edinburgh, UK, 31 August–3 September 2004. [Google Scholar]
  21. Aicher, S.; Dill-Langer, G. Basic considerations to rolling shear modulus in wooden boards. Otto-Graf-J. 2000, 11, 157–165. [Google Scholar]
  22. Zhou, Q. Develoment of Evaluation Methodology for Rolling Shear Properties in Cross Laminated Timber (CLT). Master’s Thesis, University of New Brunswick, Fredericton, NB, Canada, 2013. [Google Scholar]
  23. Ehrhart, T.; Brandner, R. Test configurations for determining rolling shear properties with focus on cross laminated timber: A critical review. In Properties, Testing and Design of Cross Laminated Timber; Shaker-Verlag GmbH: Herzogenrath, Germany, 2018. [Google Scholar]
  24. Chui, Y. Simultaneous evaluation of bending and shear moduli of wood and the influence of knots on these parameters. Wood Sci. Technol. 1991, 25, 125–134. [Google Scholar] [CrossRef]
  25. Jakobs, A. Zur Berechnung von Brettlagenholz mit starrem und nachgiebigem Verbund unter plattenartiger Belastung mit besonderer Berücksichtigung des Rollschubes und der Drillweichheit. Ph.D. Thesis, Universität der Bundeswehr München, Neubiberg, Germany, 2005. [Google Scholar]
  26. Feichter, I. Spannungs-und Traglastberechnungen an Ausgewählten Problemen der Holz-Massivbauweise in Brettsperrholz. Master’s Thesis, Graz Universtiy of Technology, Strya, Austria, 2013. [Google Scholar]
  27. BS EN 16351:2015; Timber Structures. Cross Laminated Timber. Requirements. British Standards Institution: Milton Keynes, UK, 2015.
  28. Ehrhart, T.; Brandner, R.; Schickhofer, G.; Frangi, A. Rolling Shear Properties of some European Timber Species with Focus on Cross Laminated Timber (CLT): Test Configuration and Parameter Study. In Proceedings of the 2nd Meeting of the International Network on Timber Engineering Research, Šibenik, Croatia, 24–27 August 2015; Görlacher, R., Ed.; Timber Scientific Publishing, KIT Holzbau und Baukonstruktionen: Karlsruhe, Germany, 2015. [Google Scholar]
  29. Denzler, J.K.; Glos, P. Determination of shear strength values according to EN 408. Mater. Struct. 2007, 40, 79–86. [Google Scholar] [CrossRef]
  30. Cao, Y.; Street, J.; Mitchell, B.; To, F.; Dubien, J.; Seale, R.; Shmulsky, R. Effect of Knots on Horizontal Shear Strength in Southern Yellow Pine. BioResources 2018, 13, 4509–4520. [Google Scholar] [CrossRef] [Green Version]
  31. Cao, Y.; Street, J.; Li, M.; Lim, H. Evaluation of the effect of knots on rolling shear strength of cross laminated timber (CLT). Constr. Build. Mater. 2019, 222, 579–587. [Google Scholar] [CrossRef]
  32. Li, M.; Lam, F.; Li, Y. Evaluating rolling shear strength properties of CLT by torsional shear tests and bending tests. In Proceedings of the World Conference in Timber Engineering 2014, Quebec City, QC, Canada, 10–14 August 2014. [Google Scholar]
  33. Ettelaei, A.; Taoum, A.; Shanks, J.; Nolan, G. Rolling Shear Properties of Cross-Laminated Timber Made from Australian Plantation Eucalyptus nitens under Planar Shear Test. Forests 2022, 13, 84. [Google Scholar] [CrossRef]
  34. XLam Australia Pty Ltd. XLam Australia Pty Ltd. XLam Australian cross laminated timber Panel structural guide. In XLam Australia Design Guide V1; XLam Australia Pty Ltd.: Melbourne, VIC, Australia, 2019. [Google Scholar]
  35. Paradis, S.; Brancheriau, L.; Baillères, H. Bing: Beam Identification by Non destructive Grading. 2017. Available online: https://www.researchgate.net/publication/314192422_Bing_Beam_Identification_by_Non_destructive_Grading (accessed on 18 December 2022).
  36. Baillères, H.; Hopewell, G.P.; Boughton, G. MOE and MOR Assessment Technologies for Improving Graded Recovery Of exotic Pines in Australia; Project no: PNB040-0708; Forest & Wood Products Australia: Melbourne, Australia, 2009. [Google Scholar]
  37. EN 408:2003; Timber Structures. Structural Timber and Glued Laminated Timber. Determination of Some Physical and Mechanical Properties. British Standard Institution: London, UK, 2003; pp. 1–33.
  38. Montgomery, D.C. Design and Analysis of experiments; John Wiley & Sons: Hoboken, NJ, USA, 2017. [Google Scholar]
Figure 1. Experimental test setup of RS sample, and DIC positioning.
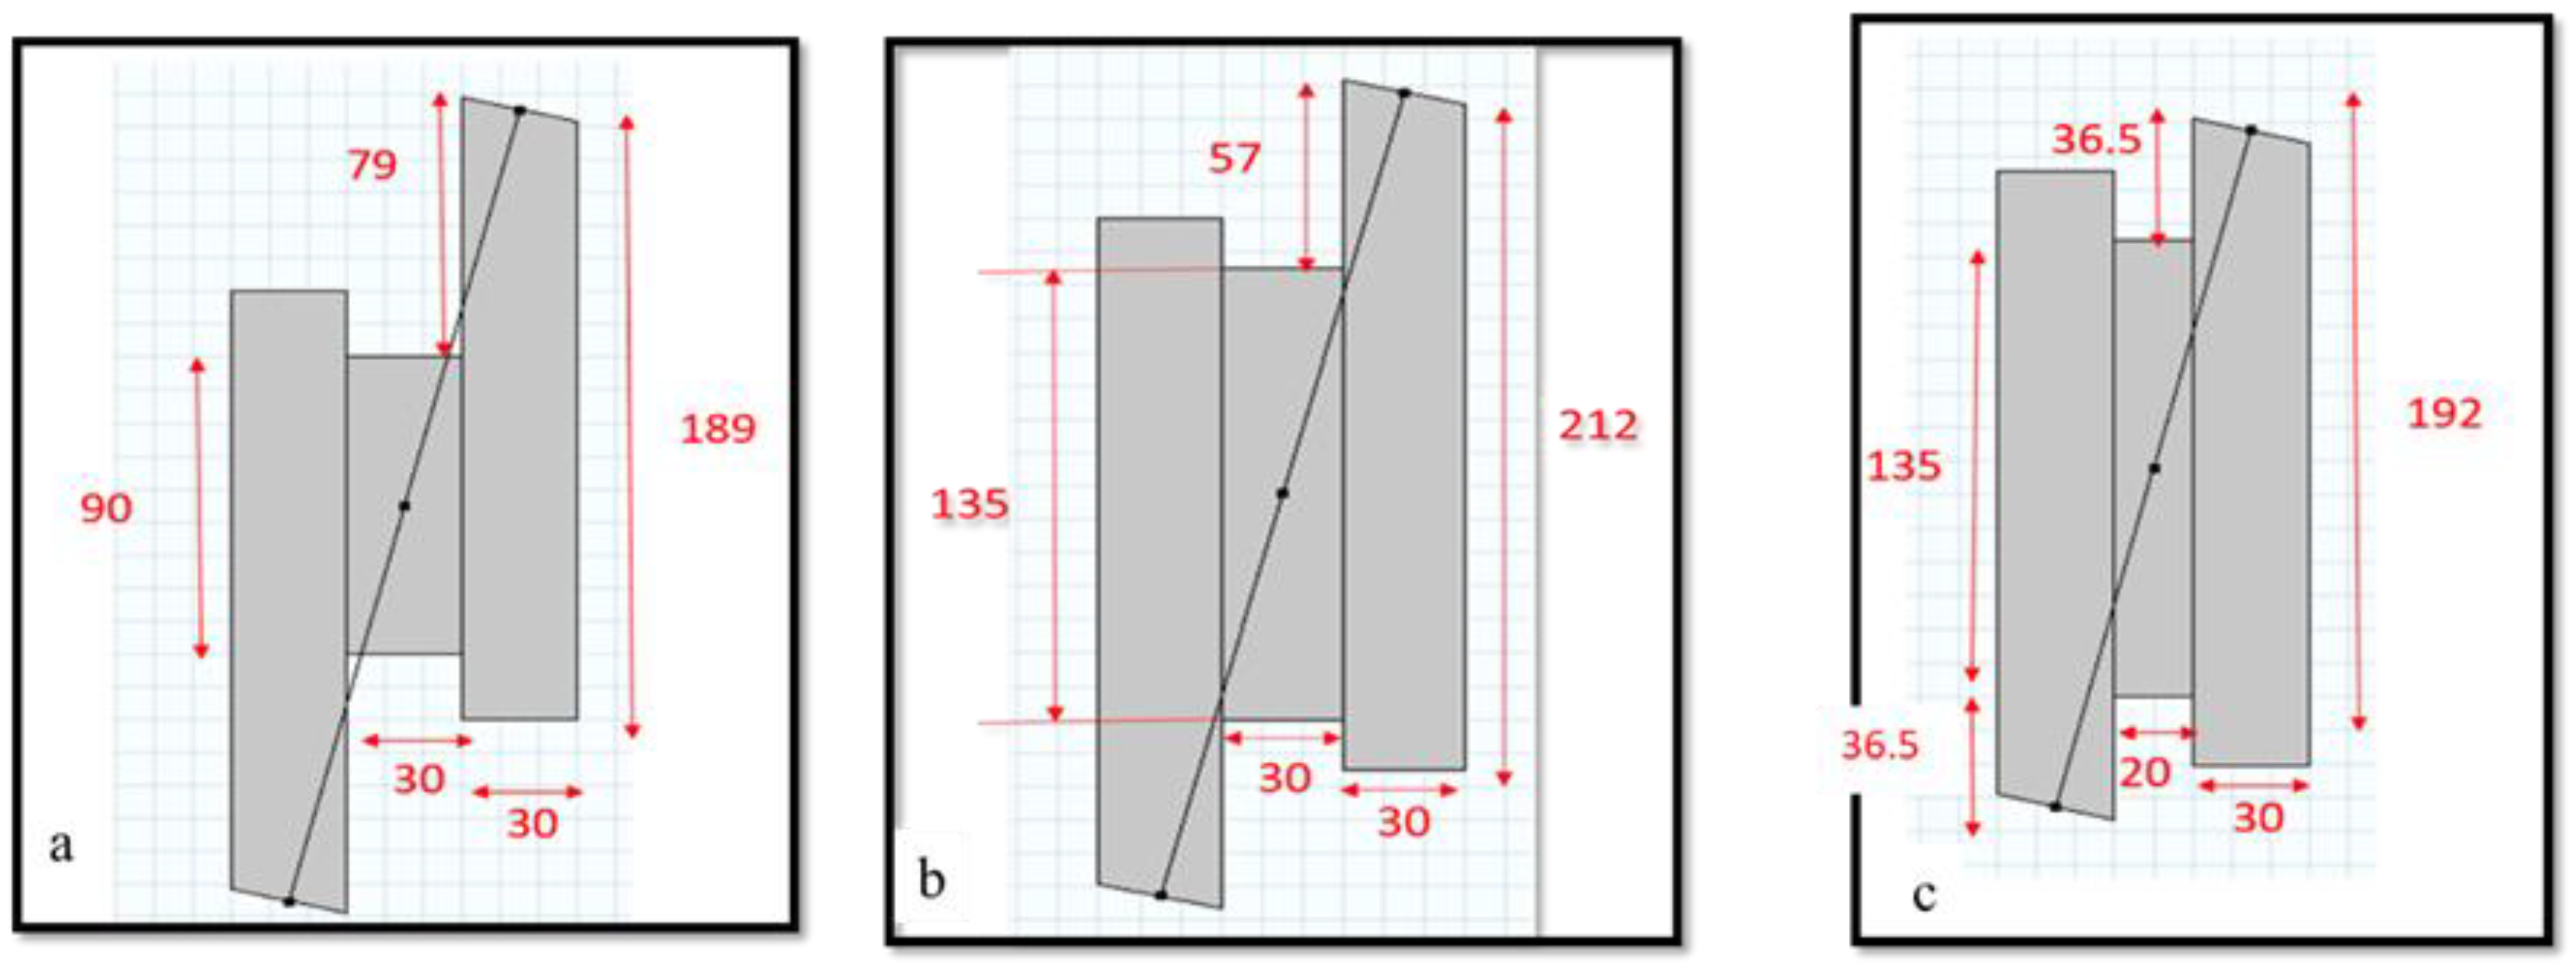
Forests 14 00711 g001
Figure 2. Sample preparation for aspect ratio (a) 3.0, (b) 4.5 and (c) 6.75 for Southern and Radiata pine.
Forests 14 00711 g002
Figure 3. Examples of sound centred knots in samples.
Forests 14 00711 g003
Figure 4. Samples for 0 mm, 20 mm and 57 mm projection.
Forests 14 00711 g004
Figure 5. Boxplot showing effect of moisture content on RS strength (left) and modulus (right) of southern pine. The square in the boxplots shows the mean and different letter are from LSD test in the boxplots indicating the means between groups are significantly different (p-value equals 0.05).
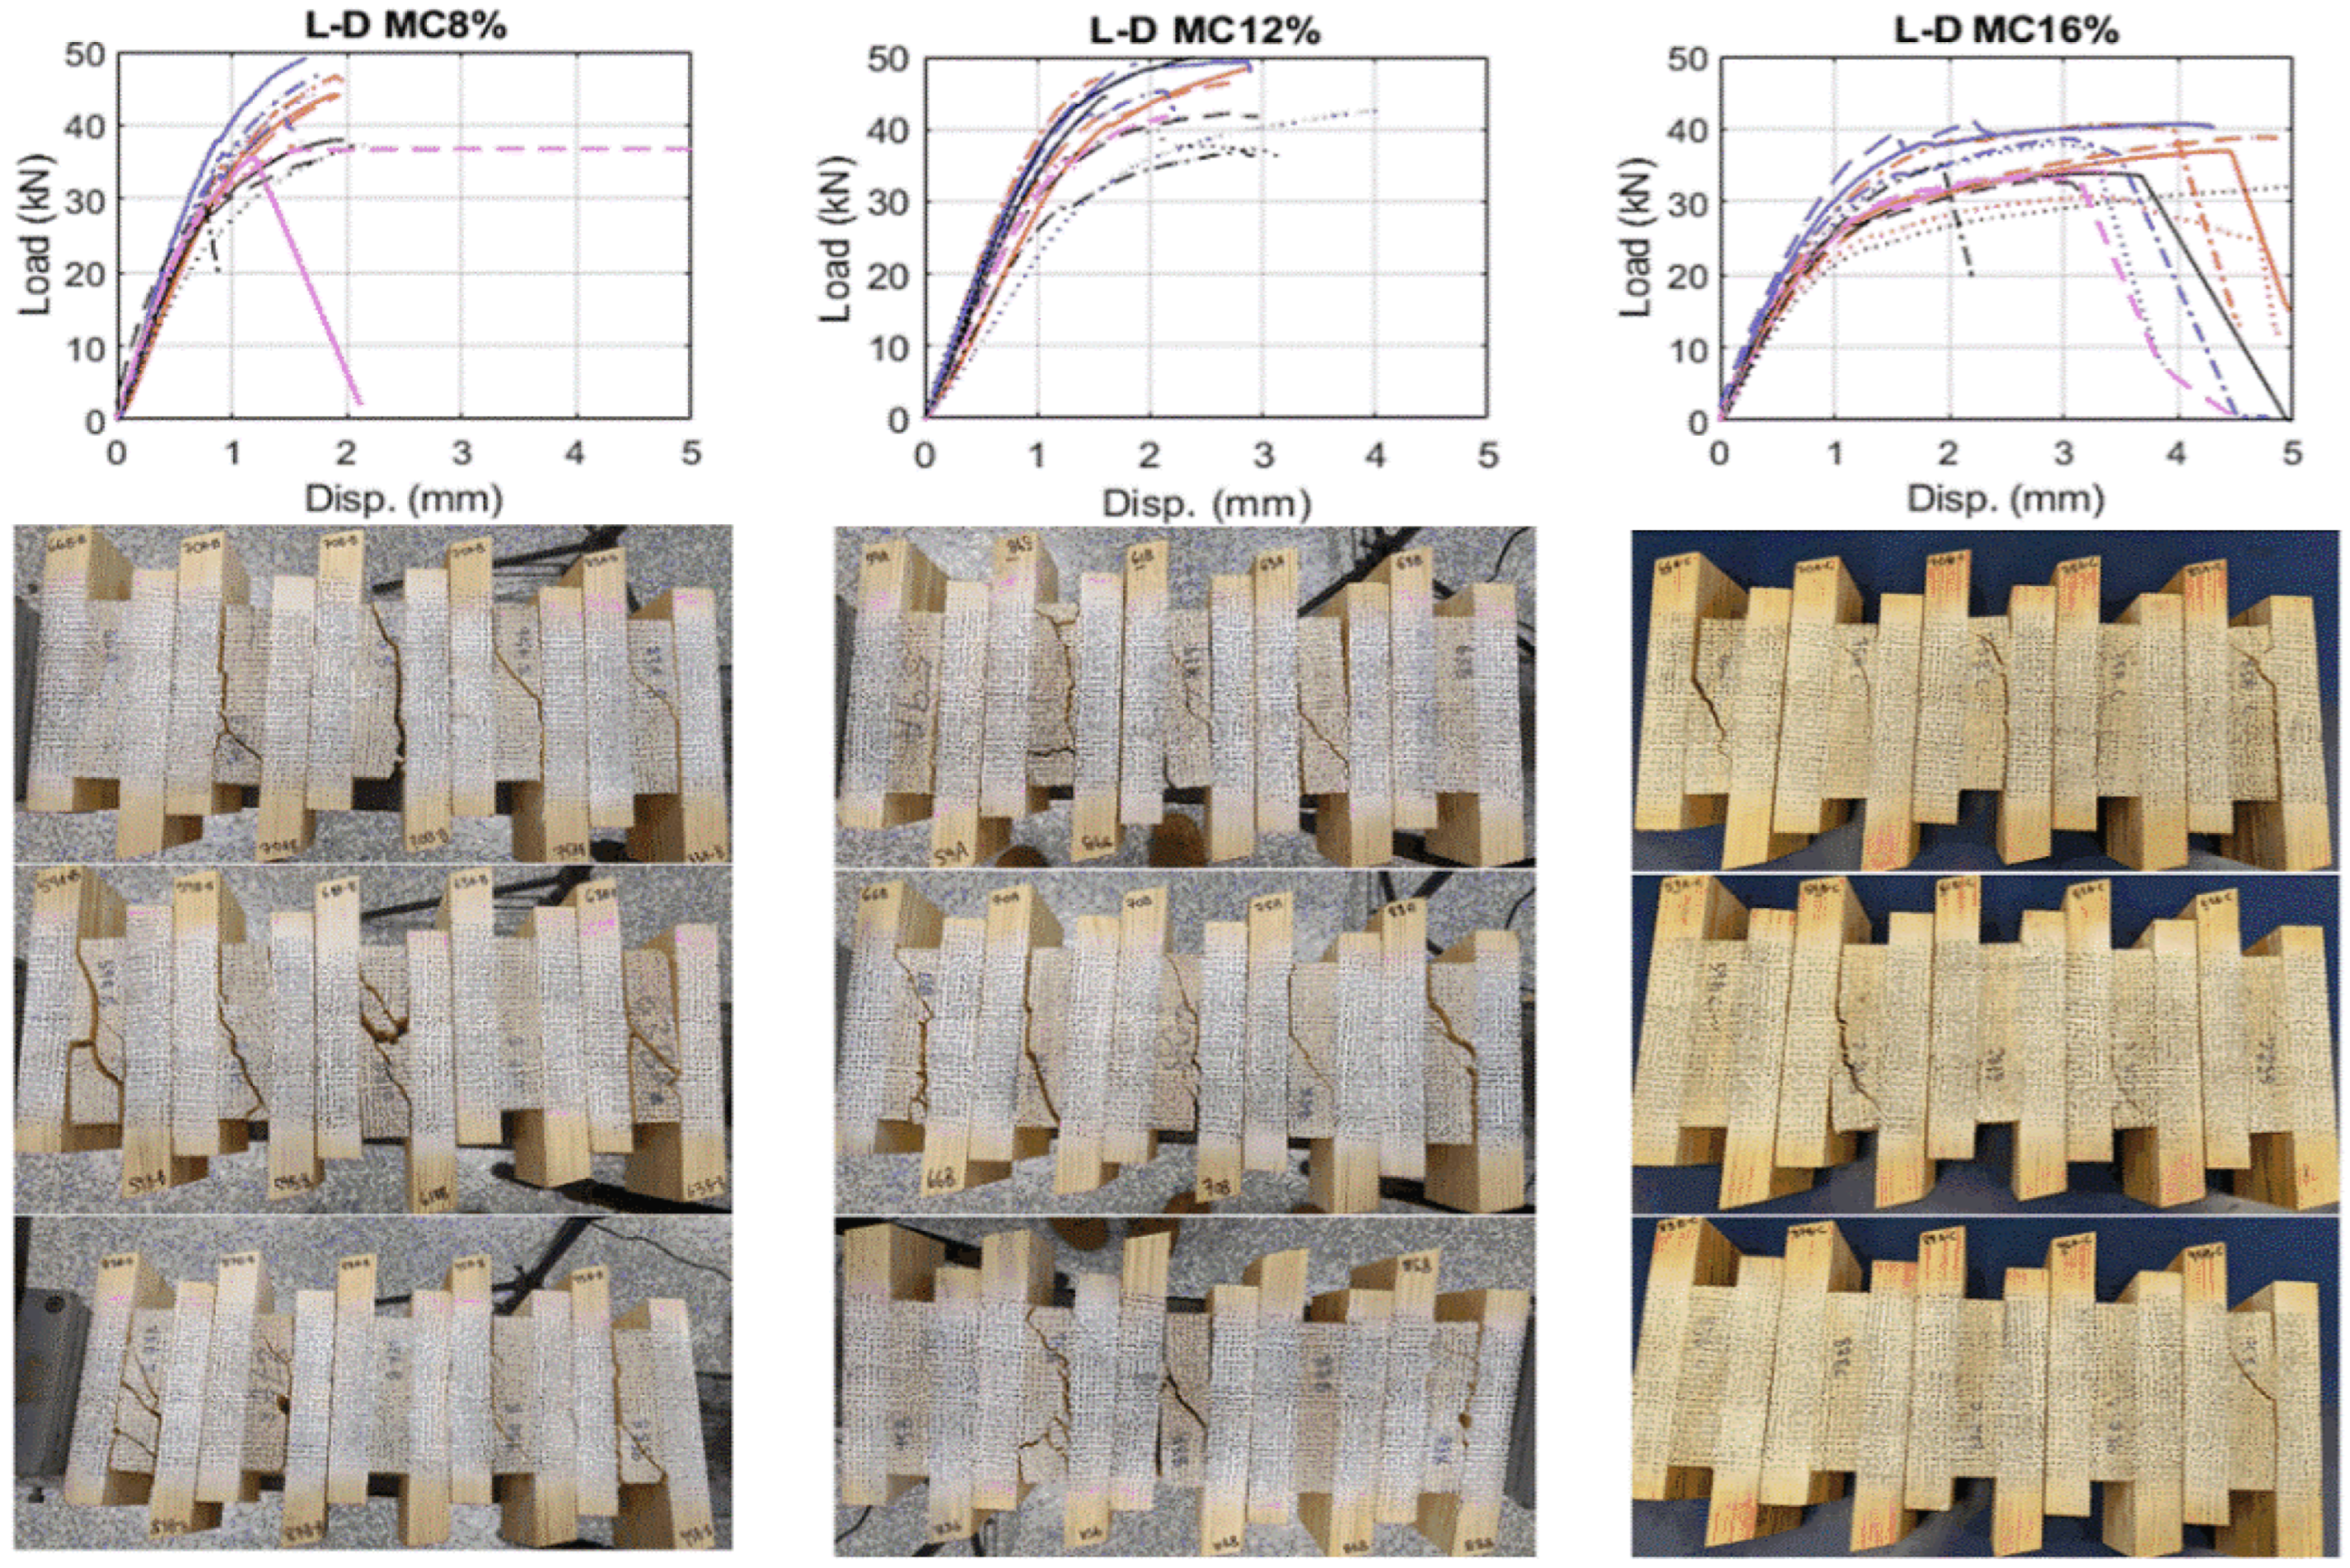
Forests 14 00711 g005
Figure 6. Load vs. displacement curves for all tested samples, and relevant failure modes of the samples subjected to various moisture contents.
Forests 14 00711 g006
Figure 7. Rolling shear properties for various MOE groups, (a) rolling shear strength, (b) rolling shear modulus (southern pine).
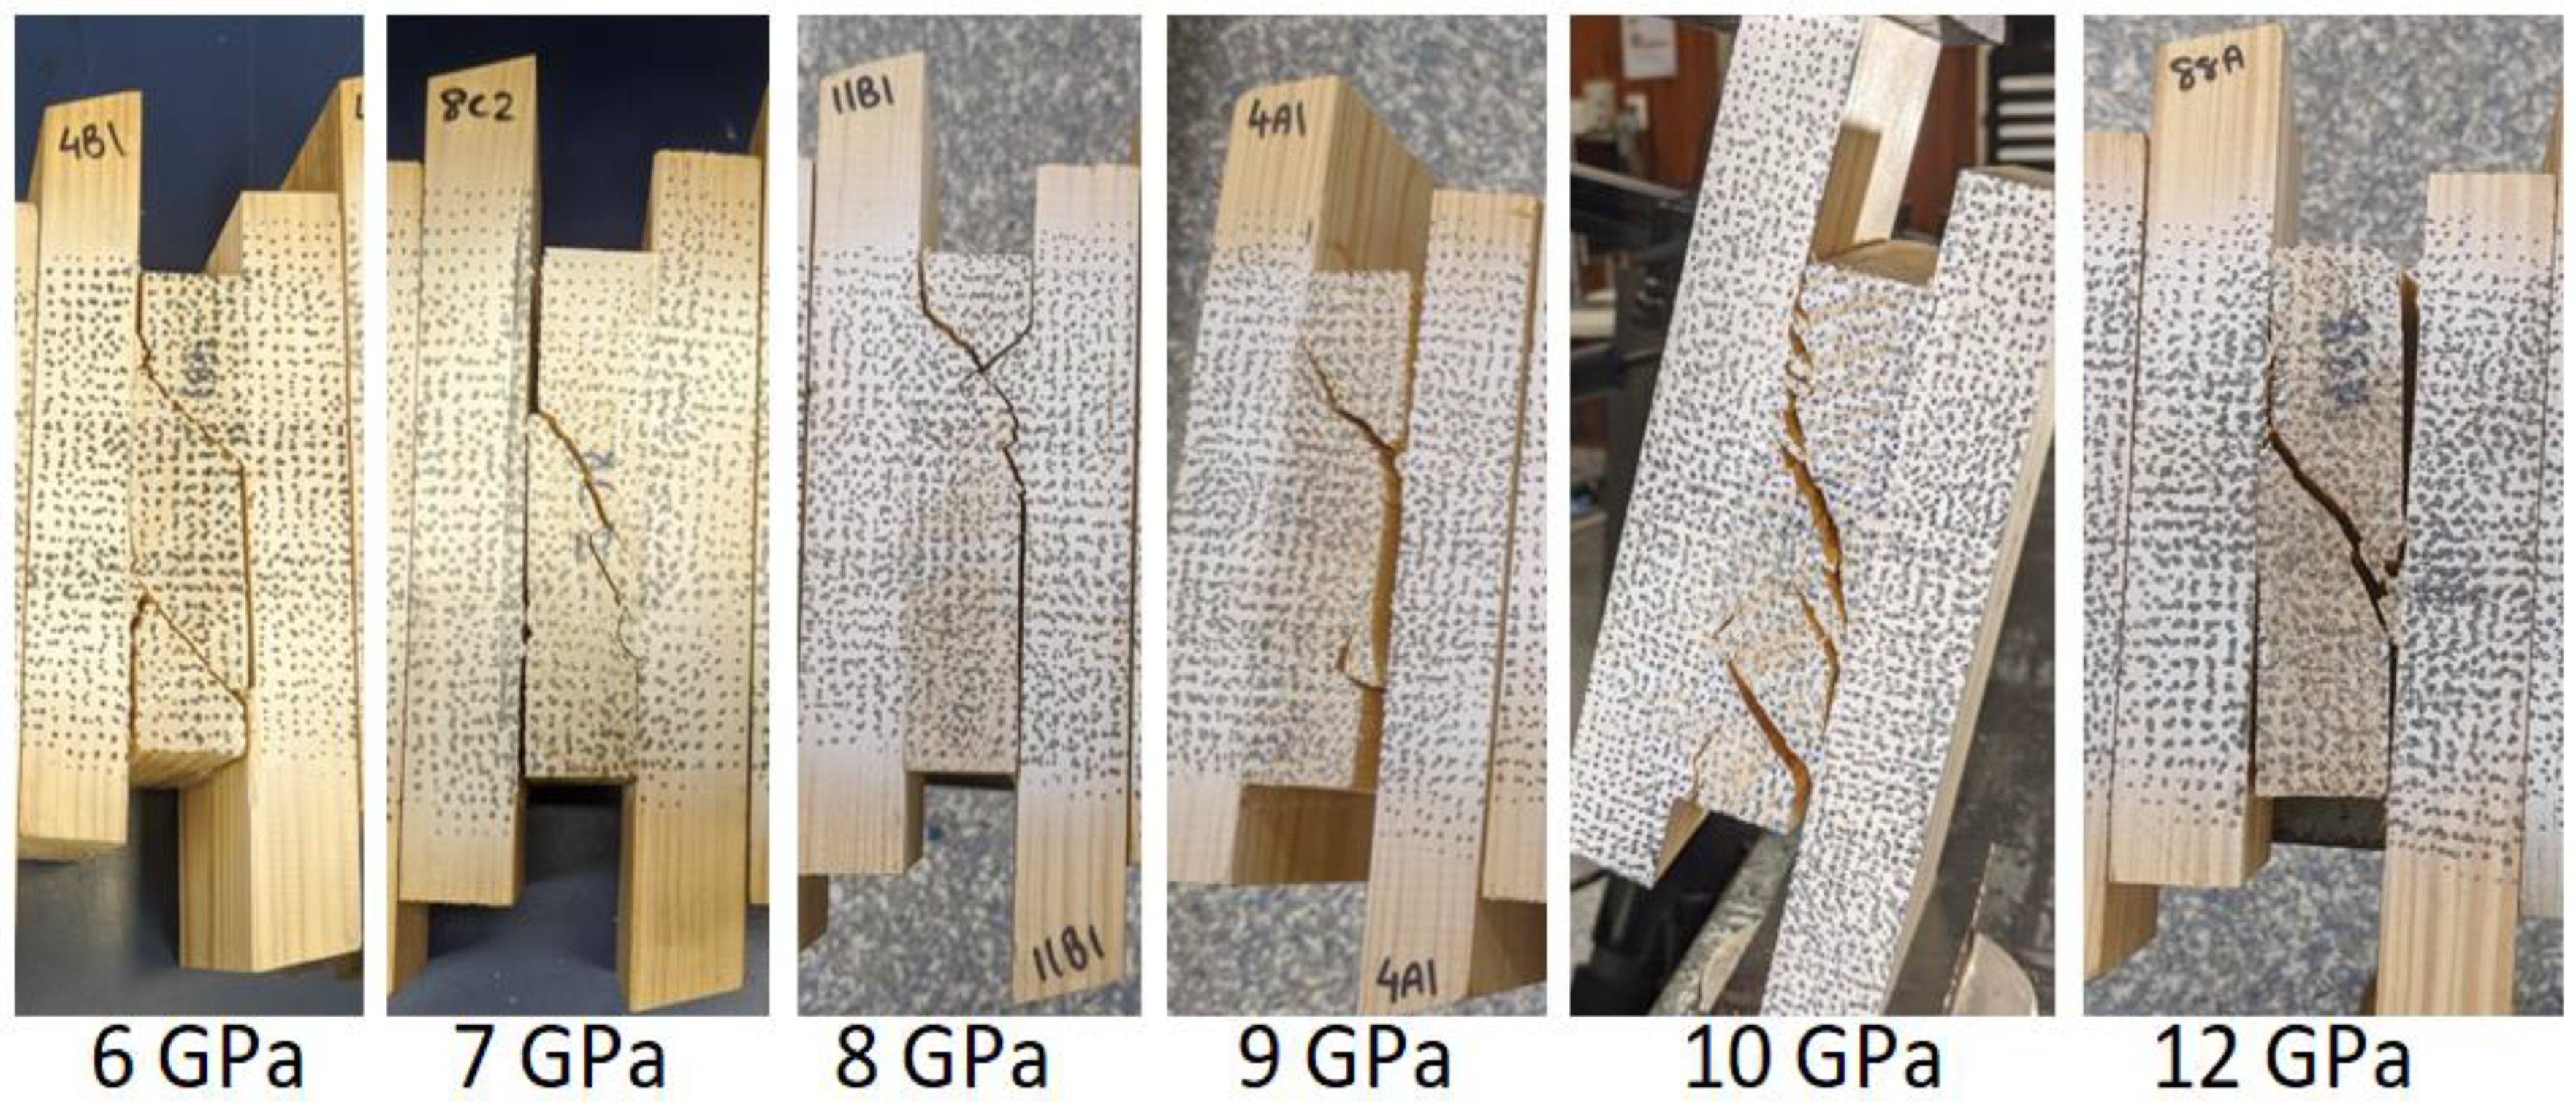
Forests 14 00711 g007
Figure 8. Example of the 6 MOE groupings and their typical failure mode type.
Forests 14 00711 g008
Figure 9. Rolling shear properties for various MOE (radiata pine).
Forests 14 00711 g009
Figure 10. Effect of aspect ratio on the mean values of RS modulus (top) and strength (bottom).
Forests 14 00711 g010
Figure 11. Load vs displacement plot of (a) Radiata pine and (b) Southern pine samples.
Forests 14 00711 g011
Figure 12. Example of (a) 3.0, (b) 6.75 and (c) 4.5 aspect ratio failure modes.
Forests 14 00711 g012
Figure 13. Boxplot showing rolling shear modulus (left) and strength (right) for various species.
Forests 14 00711 g013
Figure 14. Linear regression between density and rolling shear properties.
Forests 14 00711 g014
Figure 15. Boxplot showing effect of RS modulus (left) and strength (right) for various species.
Forests 14 00711 g015
Figure 16. Load vs displacement curves, and relevant failure modes of the samples due to various projection length.
Forests 14 00711 g016
Table 1. Test program with sample dimensions, timber species and number of test specimens.
Key VariableSpeciesCross-Section
(mm × mm)
Projection Length
(mm)
Target MGP MOE (MPa)Nos. Samples
Moisture content
(8%, 12% and 16%)
Southern pine135 × 3056.610,00015
MOE (parallel to grain)Radiata pine (Pinus radiata)135 × 3056.67000–15,00022
10,00015
Southern pine (Pinus caribaea/Pinus elliotti)135 × 3056.6600015
700015
800015
900015
10,00015
12,00015
Aspect ratioRadiata pine90 × 3079.110,00015
135 × 2036.510,00015
Southern pine90 × 3079.110,00015
135 × 2036.510,00015
SpeciesRadiata pine135 × 3056.610,00015
Southern pine10,00015
Hoop pine (Araucaria cunninghamii)10,00015
KnottinessRadiata pine135 × 3056.610,00015
Southern pine10,00015
Hoop pine10,00015
Projection length Southern pine135 × 30010,0007
2010,0007
56.610,00015
Table 2. Rolling shear modulus (Gr) and strength (fr) of southern pine with varying moisture content.
Mechanical Property8% fr8% Gr12% fr12% Gr16% fr16% Gr
Mean (MPa)2.9395.013.2080.602.6160.66
CoV (%)13101016911
5th percentile (MPa)2.4284.222.6461.382.3150.44
Table 3. Effect of moisture content on the RS properties.
BlockStandard Error (SE)R2Sum of Squares (SS)F-Valuep-Value
frWithout considering the effect of board0.380.10MC (0.72), Error (6.1)MC (4.94)0.032
Considering effect of board0.290.64MC (0.55), Board (3.67), Error (2.43)MC (6.34), Board (3.02)MC (0.018), Board (0.006)
GrWithout considering the effect of board10.050.67MC (8513), Error (4215)MC (84.82)0.000
Considering effect of board6.930.89MC (8095), Board (2867), Error (1348)MC (168.11), Board (4.25)MC (0.000), Board (0.001)
Table 4. Rolling shear properties of southern pine with varying MOE.
MOE Group6 GPa7 GPa8 GPa10 GPa12 GPa
frGrfrGrfrGrfrGrfrGr
Mean (Mpa)3.3197.903.0698.873.2285.653.0587.123.3698.52
CoV (%)15242215191415151310
5th percentile (Mpa)2.5566.392.0375.572.2372.462.3368.972.6583.75
Table 5. Effect of MOE on the RS properties (southern pine).
BlockStandard Error (SE)R2Sum of Squares (SS)F-Valuep-Value
frWithout considering the effect of board 0.550.002MOE (0.0425), Error (22.45)MOE (0.14)0.711
Considering effect of board 0.260.87MOE (0.029), Board (19.61), Error (2.84)MOE (0.42), Board (8.85)MOE (0.523), Board (0.000)
GrConsidering effect of board 13.70.61MOE (78.9), Board (11841), Error (7687)MOE (0.42), Board (1.91)MOE (0.520), Board (0.025)
Table 6. Rolling shear properties with varying AR.
AR GroupAR 3.0AR 4.5 AR 6.75
frGrfrGrfrGr
Southern pineMean (MPa)2.7085.543.0587.123.2588.72
CoV (%)151015151326
5th percentile (MPa)2.1872.28 2.3368.972.8257.83
Radiata pineMean (MPa)2.3973.382.6474.742.8773.97
CoV (%)101617141630
5th percentile (MPa)1.9667.451.7968.432.0866.61
Table 7. Effect of AR on the RS properties (southern pine).
BlockStandard Error (SE)R2Sum of Squares (SS)F-Valuep-Value
frConsidering effect of board0.320.68AR (1.53), Board (4.92), Error (3.28)AR (15.37), Board (4.49)AR (0.000), Board (0.000)
GrConsidering effect of board16.890.17AR (98.8), Board (1875), Error (9408)AR (0.35), Board (0.60)AR (0.560), Board (0.817)
Table 8. Rolling shear properties with varying species.
Species GroupRadiata PineSouthern PineHoop Pine
frGrfrGrfrGr
No knotsMean (MPa)2.6474.743.0587.123.6899.67
CoV (%)17140.150.150.210.11
5th percentile (MPa)1.7961.712.3368.972.3484.93
KnotsMean (MPa)3.1987.573.83118.694.53154.73
CoV (%)0.180.200.190.100.220.16
5th percentile (MPa)2.1879.422.70109.062.60147.32
Table 9. Rolling shear properties with varying species.
Projection Group0 mm20 mm57 mm
frGrfrGrfrGr
Mean (MPa)3.0294.843.50104.823.0587.12
CoV (%)182117211515
5th percentile (MPa)2.2772.222.7773.102.3368.97
Table 10. Effect of projection length on the RS properties (southern pine) for fr and Gr, respectively.
BlockStandard Error (SE)R2Sum of Squares (SS)F-Valuep-Value
frWithout considering effect of board0.520.14PR (1.11), Error (7.0)PR (2.06)PR (0.15)
Considering effect of board0.190.94PR (0.80), Board (7.53), Error (0.51)PR (22.0), Board (16.05)PR (0.000), Board (0.000)
GrWithout considering effect of board17.130.17PR (1518), Error (7625)PR (2.59)PR (0.094)
Considering effect of board10.030.85PR (349), Board (6979), Error (1408)PR (3.47), Board (5.34)PR (0.084), Board (0.002)
Disclaimer/Publisher’s Note: The statements, opinions and data contained in all publications are solely those of the individual author(s) and contributor(s) and not of MDPI and/or the editor(s). MDPI and/or the editor(s) disclaim responsibility for any injury to people or property resulting from any ideas, methods, instructions or products referred to in the content.

