
Size Effect on Hygroscopicity of Waterlogged Archaeological Wood by Simultaneous Dynamic Vapour Sorption

Abstract
1. Introduction
2. Materials and Methods
2.1. Materials
2.2. Methods
2.2.1. Wood Identification
2.2.2. Maximum Water Content (MWC) and Basic Density (BD)
2.2.3. Simultaneous DVS
2.2.4. Sorption Models
The GAB Model
The H–H Model
3. Results and Discussions
3.1. Wood Identification of Waterlogged Archaeological Wood (WAW)
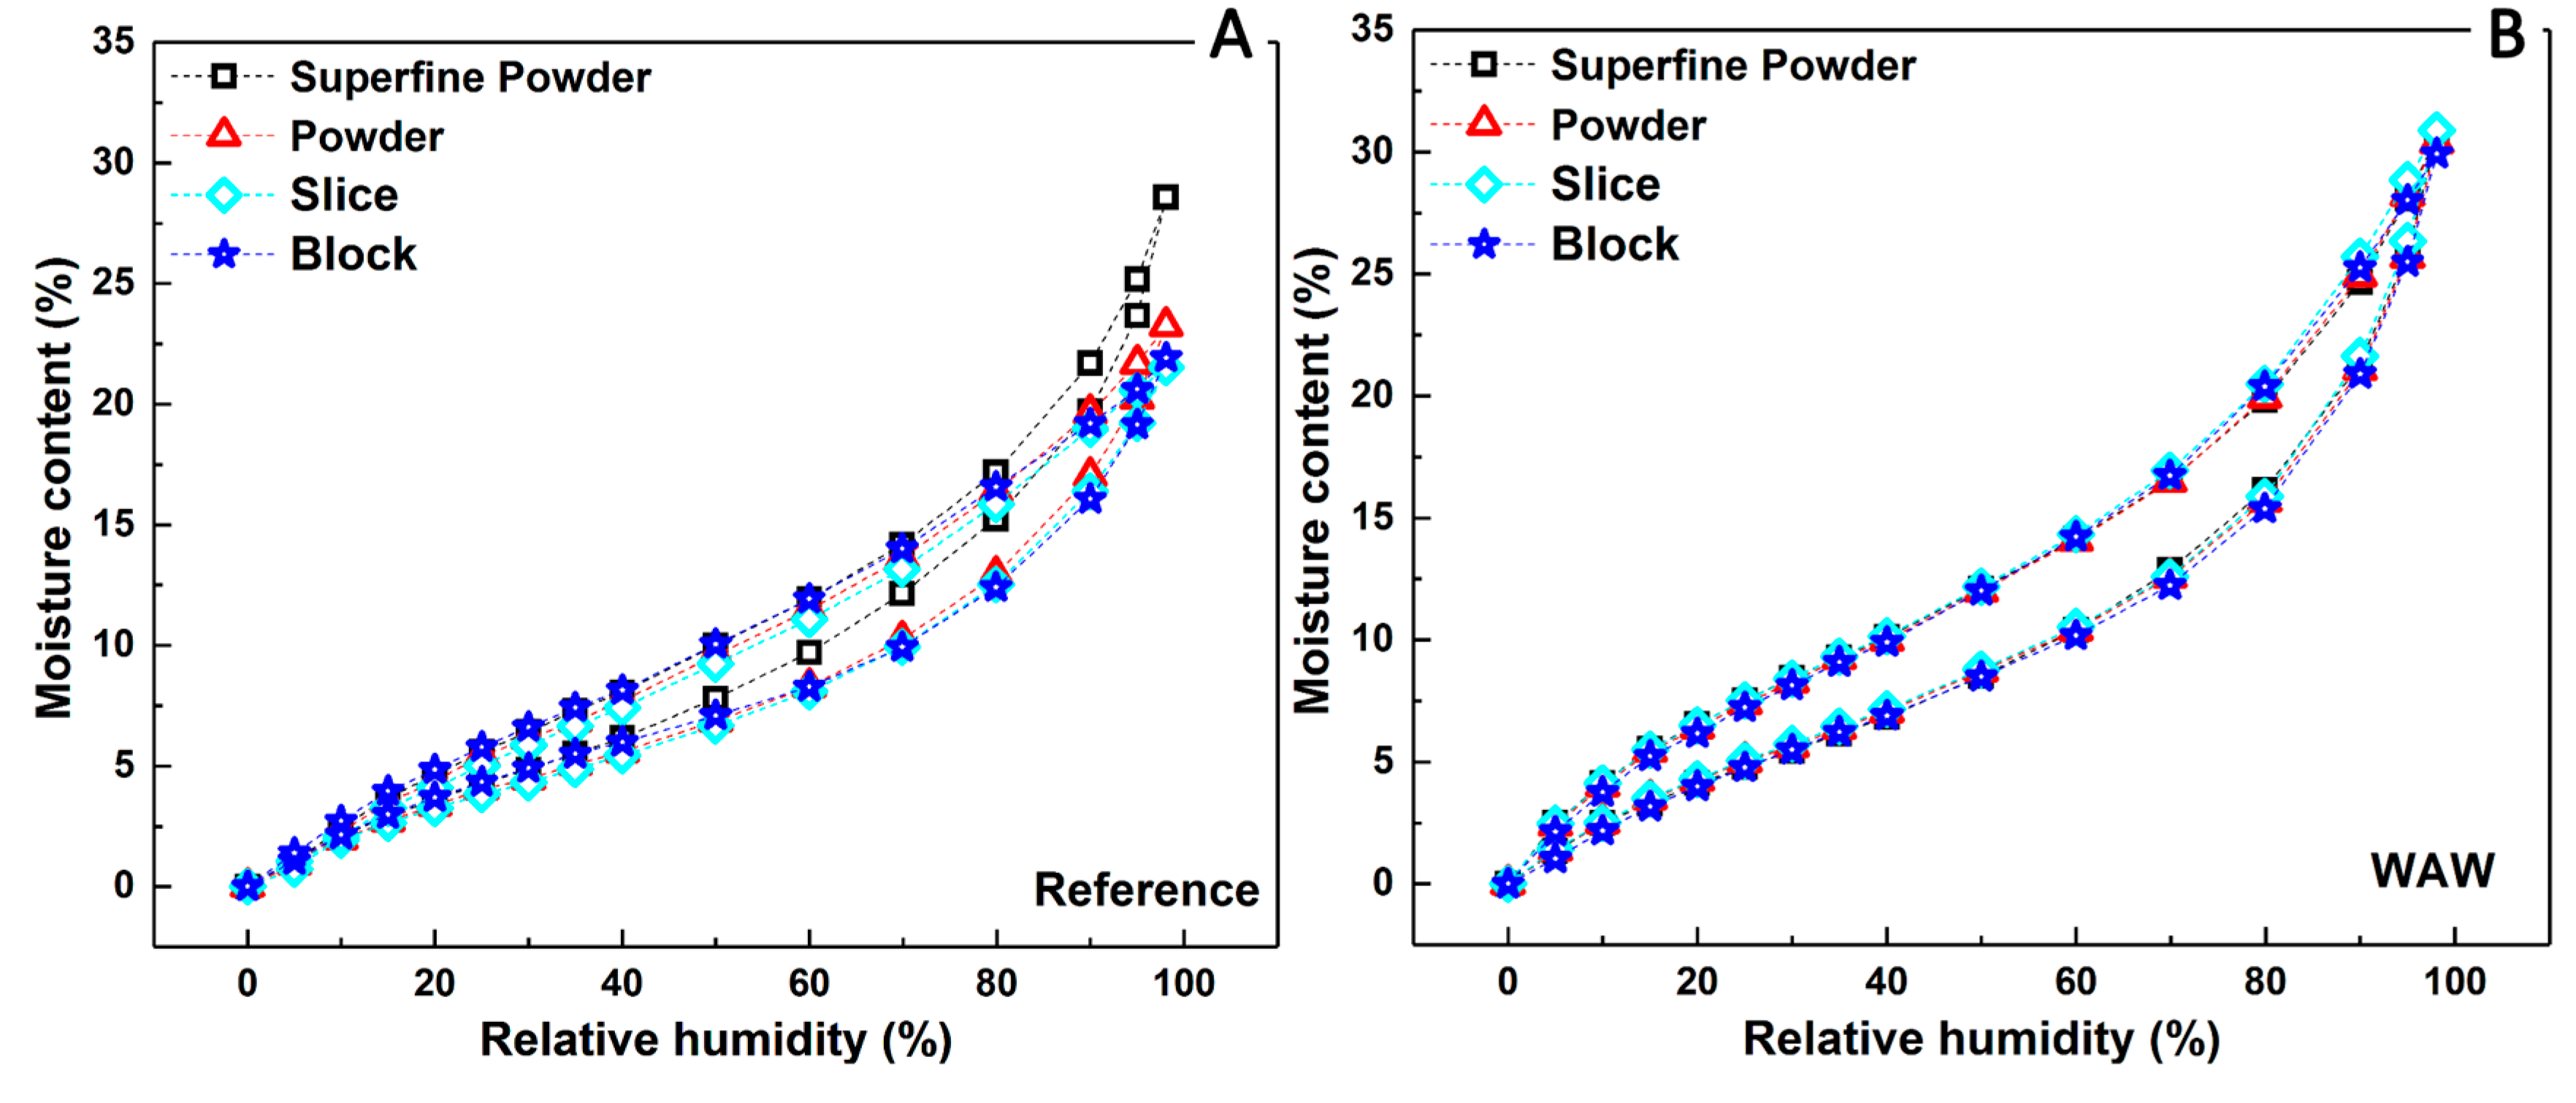
3.2. Sorption Isotherms
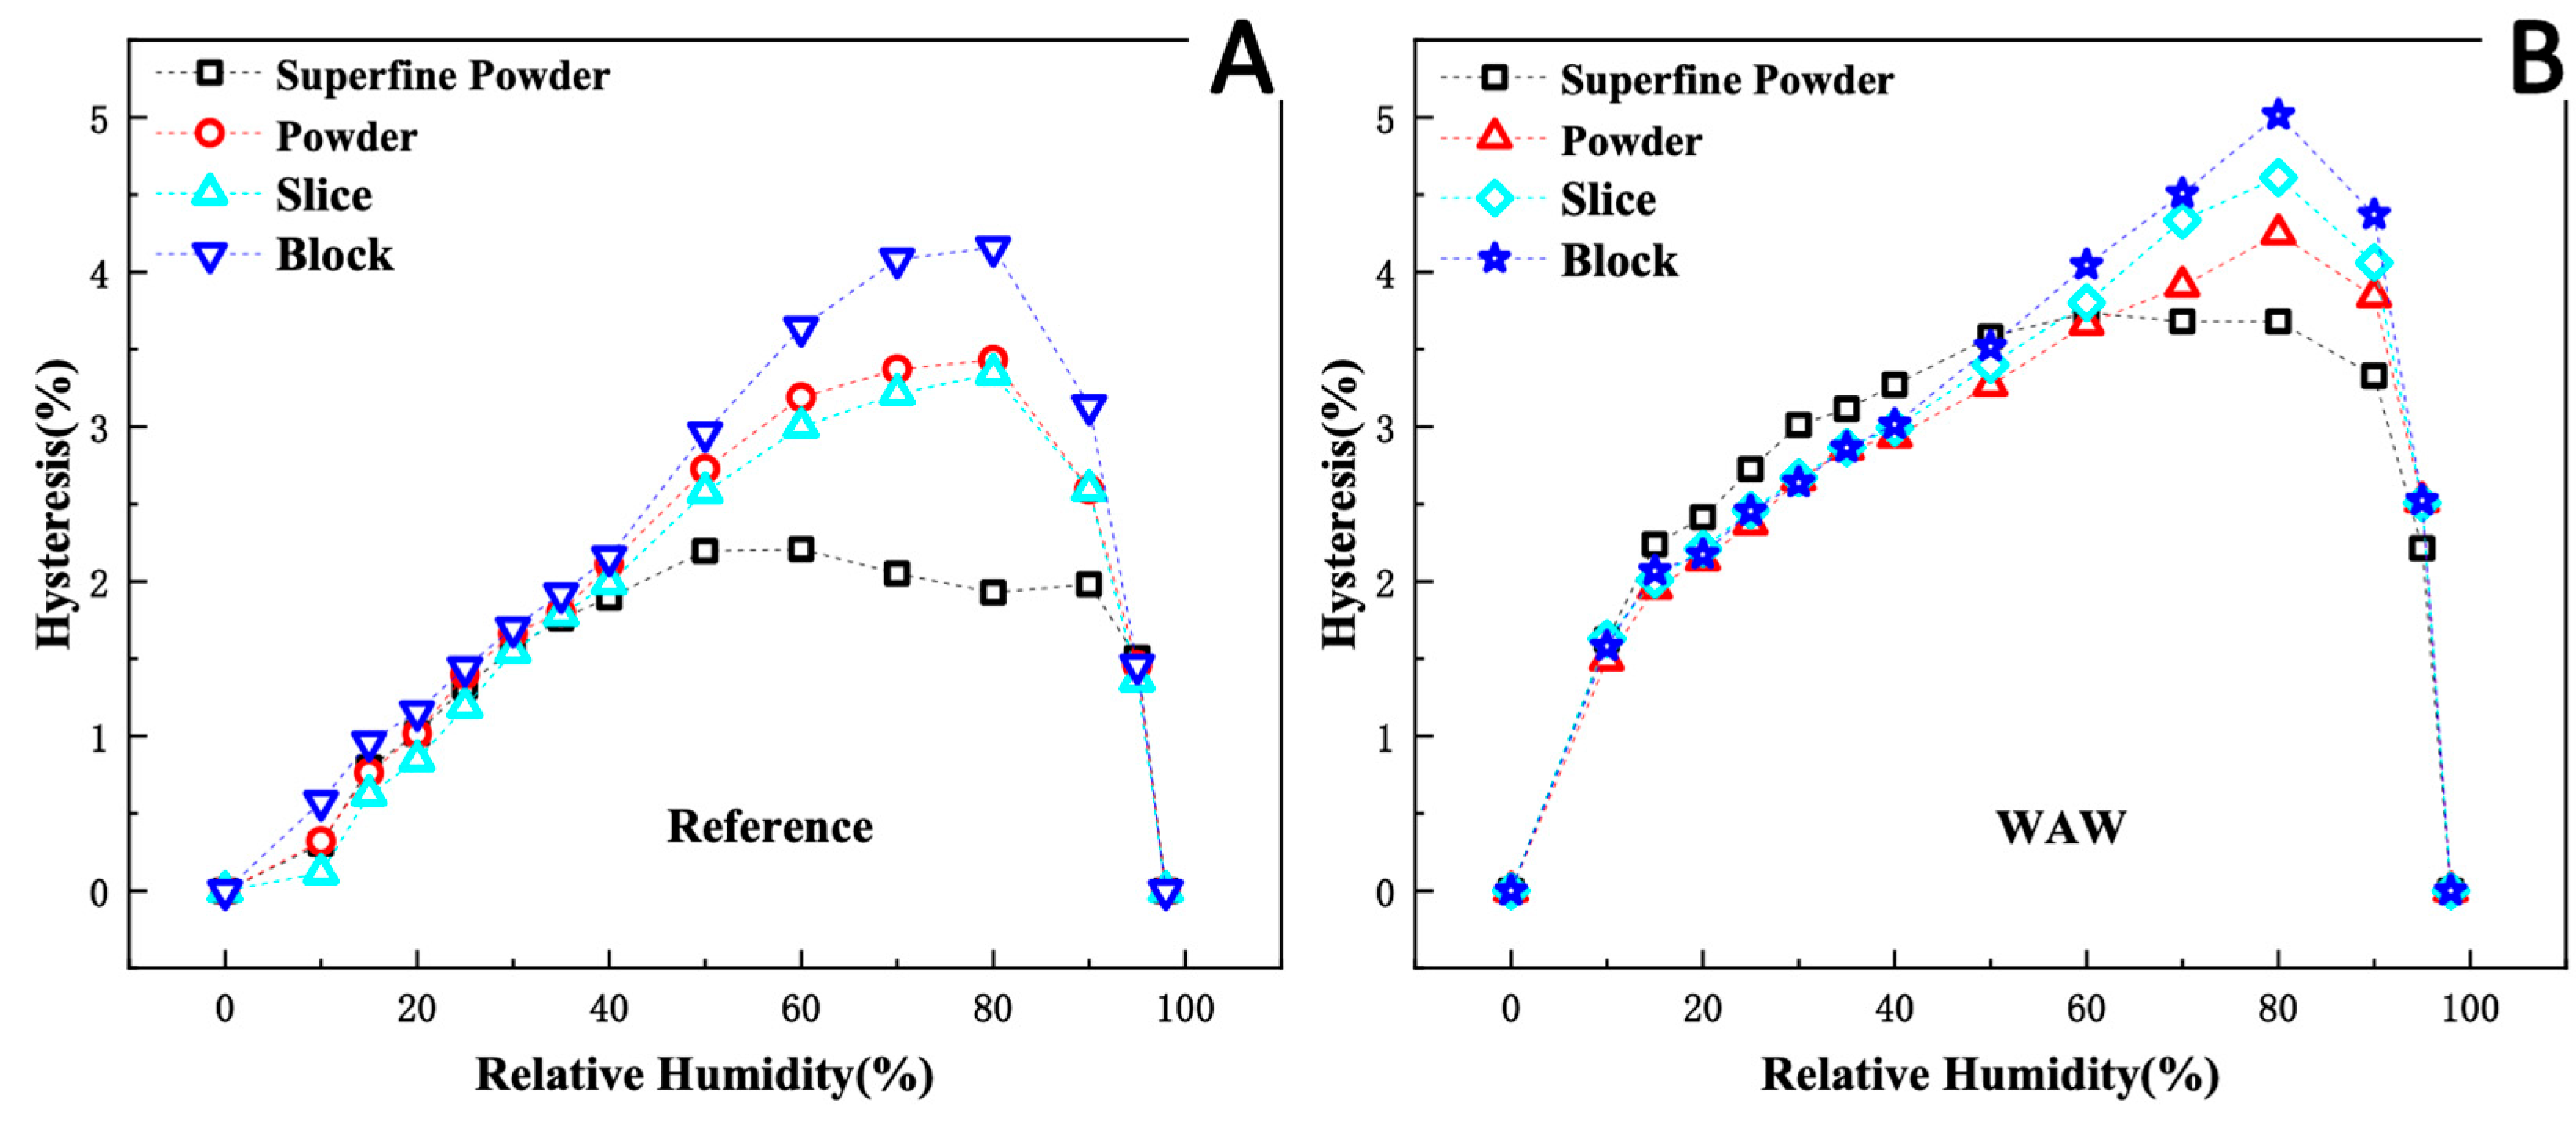
3.3. Hysteresis
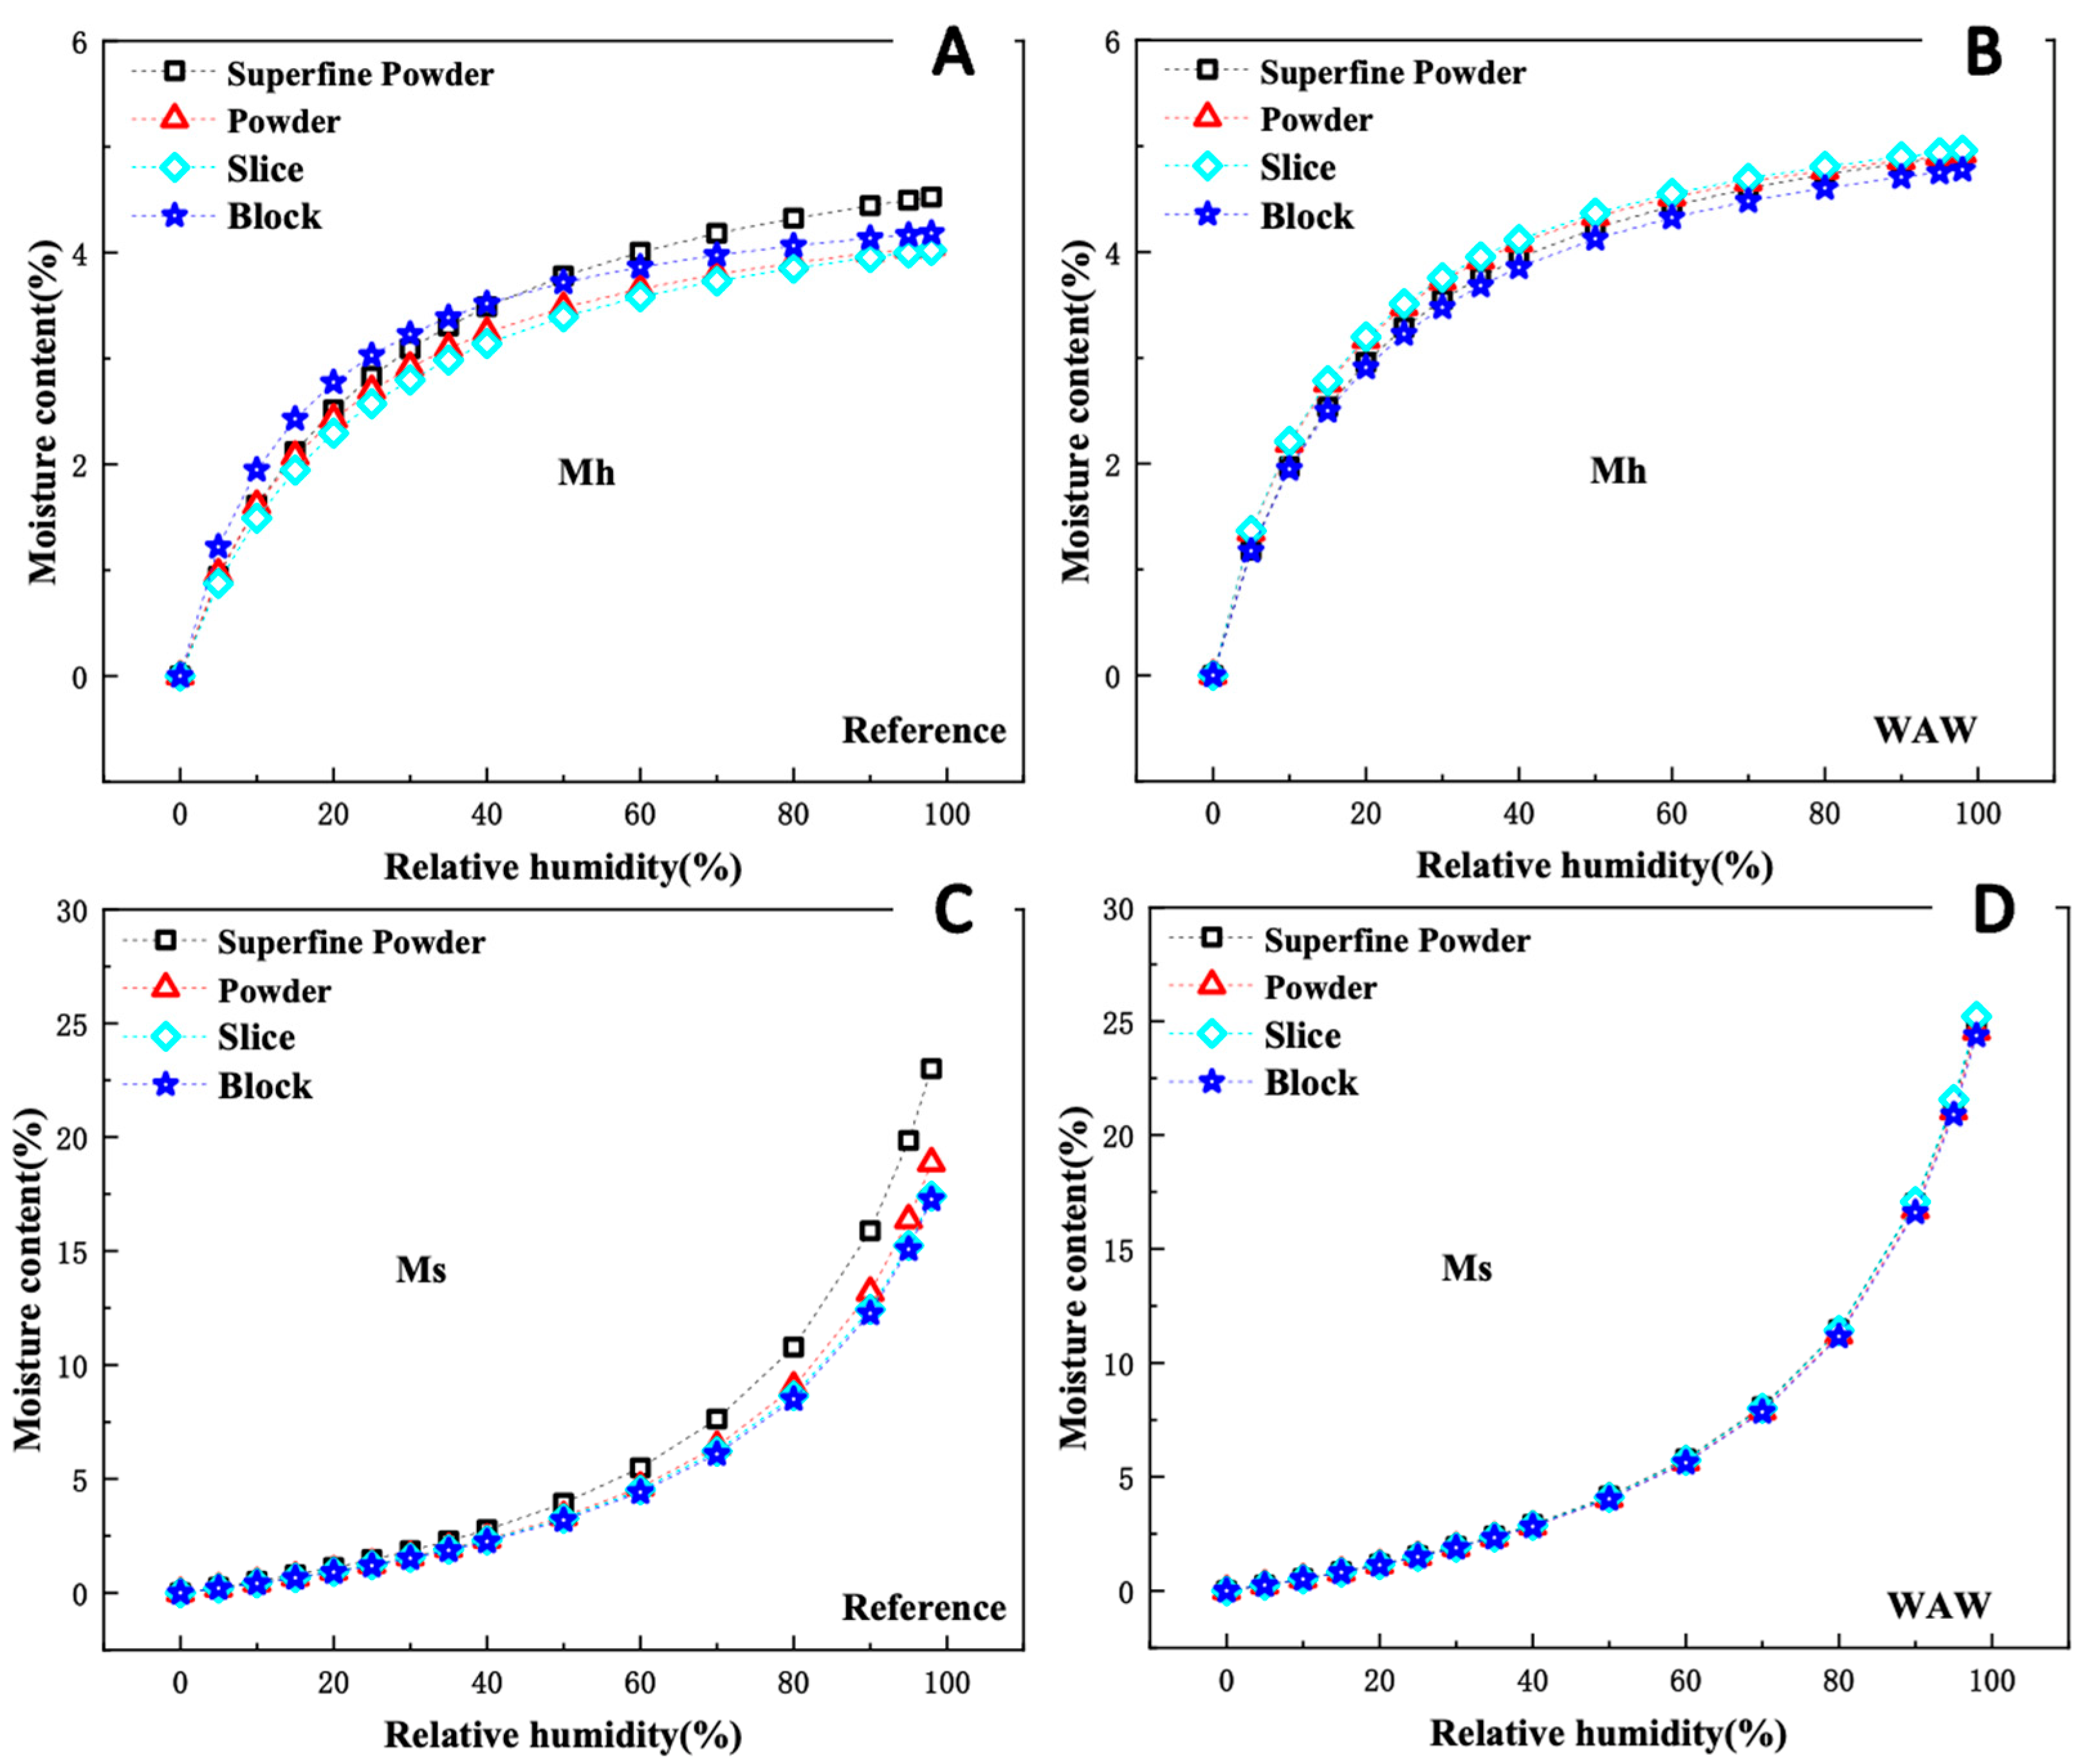
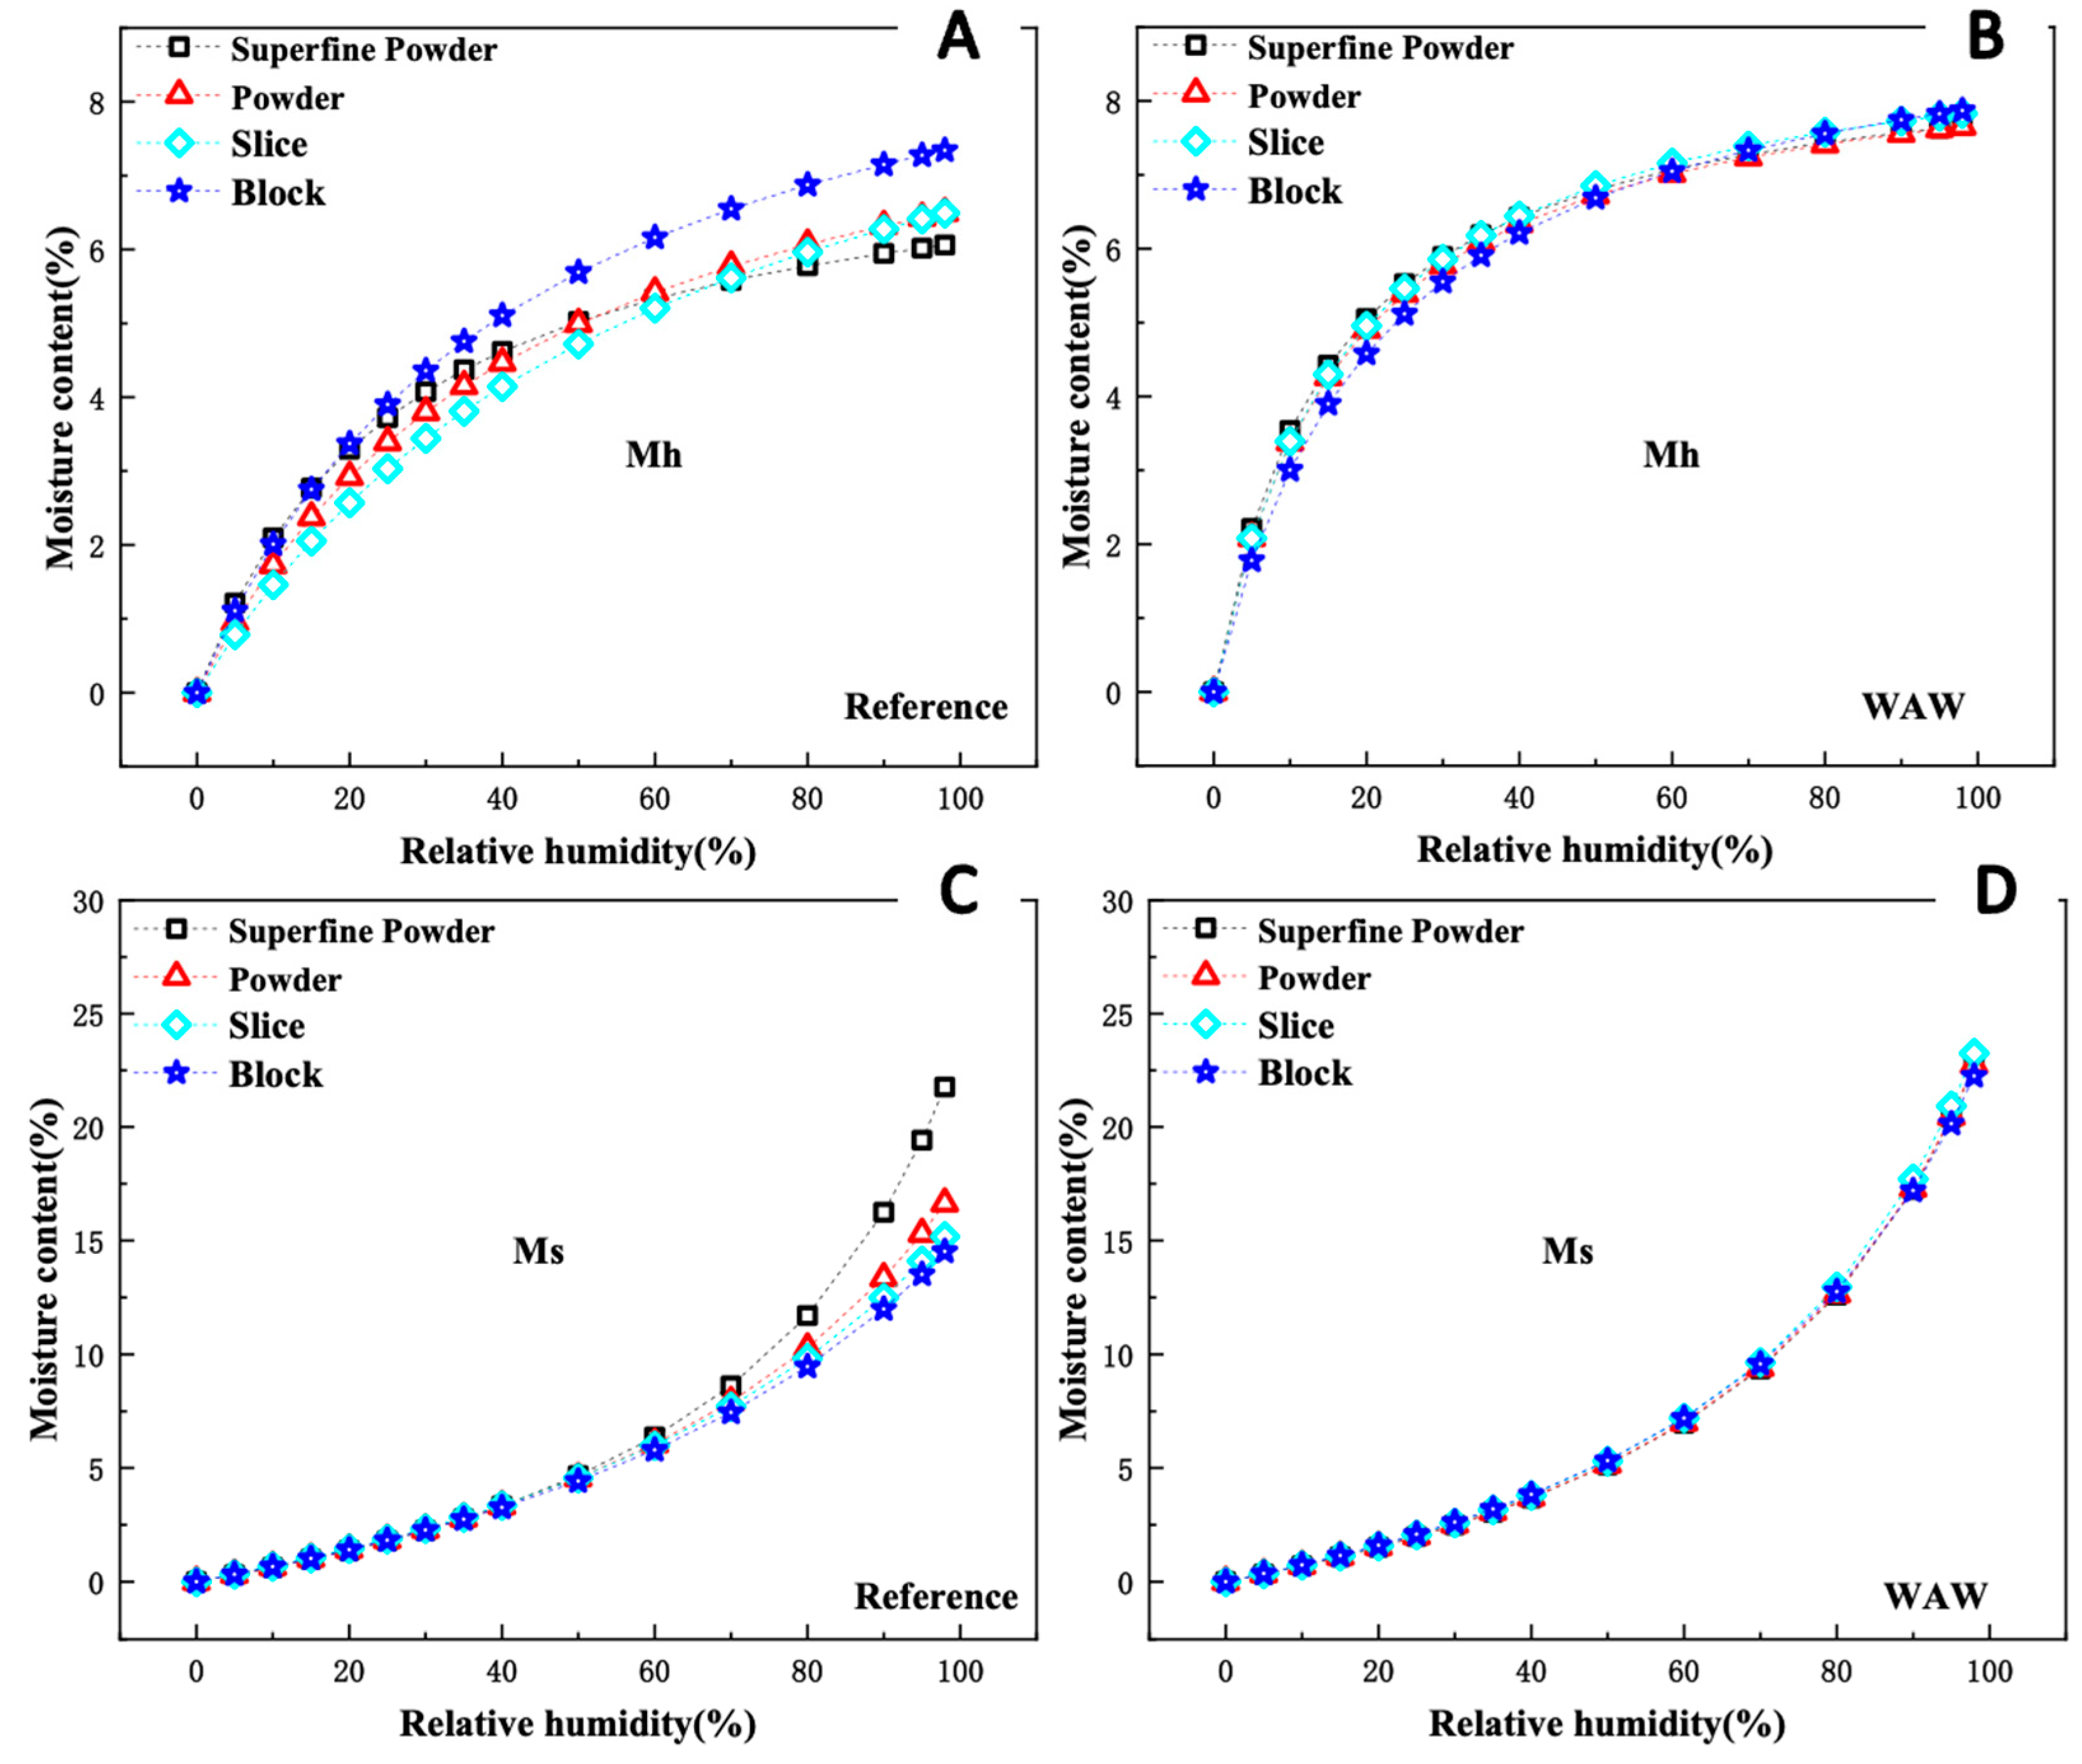
3.4. Sorption Model
3.4.1. GAB Model
3.4.2. H–H Model
4. Conclusions
Supplementary Materials
Author Contributions
Funding
Data Availability Statement
Acknowledgments
Conflicts of Interest
References
- Han, L.; Tian, X.; Keplinger, T.; Zhou, H.; Li, R.; Svedstrom, K.; Burgert, I.; Yin, Y.; Guo, J. Even Visually Intact Cell Walls in Waterlogged Archaeological Wood Are Chemically Deteriorated and Mechanically Fragile: A Case of a 170 Year-Old Shipwreck. Molecules 2020, 25, 1113. [Google Scholar] [CrossRef] [PubMed]
- Sha, B.; Xie, L.; Yong, X.; Li, A. An experimental study of the combined hysteretic behavior of dougong and upper frame in Yingxian Wood Pagoda. Constr. Build. Mater. 2021, 305, 124723. [Google Scholar] [CrossRef]
- Sandstrom, M.; Jalilehvand, F.; Persson, I.; Gelius, U.; Frank, P.; Hall-Roth, I. Deterioration of the seventeenth-century warship Vasa by internal formation of sulphuric acid. Nature 2002, 415, 893–897. [Google Scholar] [CrossRef] [PubMed]
- Monaco, A.L.; Balletti, F.; Pelosi, C. Wood in cultural heritage. Properties and conservation of historical wooden artefacts. Eur. J. Sci. Theol. 2018, 14, 161–171. [Google Scholar]
- Edwards, H.; Sibley, M.; Derham, B.; Heron, C. Raman spectroscopy of archaeological samples from the Barber-Surgeon’s medicine chest on the Mary Rose. J. Raman Spectrosc. 2004, 35, 746–753. [Google Scholar] [CrossRef]
- Brown, D.M. The Corolla Wreck Exposed: Historical Archaeological Analysis of North Carolina’s Oldest Shipwreck; East Carolina University: Greenville, NC, USA, 2014. [Google Scholar]
- Wu, M.; Han, X.; Qin, Z.; Zhang, Z.; Xi, G.; Han, L. A Quasi-Nondestructive Evaluation Method for Physical-Mechanical Properties of Fragile Archaeological Wood with TMA: A Case Study of an 800-Year-Old Shipwreck. Forests 2022, 13, 38. [Google Scholar] [CrossRef]
- Broda, M.; Majka, J.; Olek, W.; Mazela, B. Dimensional stability and hygroscopic properties of waterlogged archaeological wood treated with alkoxysilanes. Int. Biodeterior. Biodegrad. 2018, 133, 34–41. [Google Scholar] [CrossRef]
- Fejfer, M.; Majka, J.; Zborowska, M. Dimensional Stability of Waterlogged Scots Pine Wood Treated with PEG and Dried Using an Alternative Approach. Forests 2020, 11, 1254. [Google Scholar] [CrossRef]
- Majka, J.; Zborowska, M.; Fejfer, M.; Waliszewska, B.; Olek, W. Dimensional stability and hygroscopic properties of PEG treated irregularly degraded waterlogged Scots pine wood. J. Cult. Herit. 2018, 31, 133–140. [Google Scholar] [CrossRef]
- Radojkovi, B.; Risti, S.; Poli, S.; Janiheinemann, R.; Rdovnovi, D. Study on dimensional stabilization of 12,500-year-old waterlogged subfossil Scots pine wood from the Koźmin Las site, Poland. J. Cult. Herit. 2017, 23, 119–127. [Google Scholar]
- Broda, M.; Mazela, B.; Dąbek, I.; Dutkiewicz, A.; Maciejewski, H.; Markiewicz, R.; Grzeszkowiak, M.; Jurga, S. Influence of organosilicon compounds and nanocellulose treatment on the dimensional stability of waterlogged elm wood. In Proceedings of the Irg Meeting, Ghent, Belgium, 4–8 June 2017. [Google Scholar]
- Han, L.; Han, X.; Liang, G.; Tian, X.; Ma, F.; Sun, S.; Yin, Y.; Xi, G.; Guo, H. Even Samples from the Same Waterlogged Wood Are Hygroscopically and Chemically Different by Simultaneous DVS and 2D COS-IR Spectroscopy. Forests 2023, 14, 15. [Google Scholar] [CrossRef]
- Ilic, J. Shrinkage-related degrade and its association with some physical properties in Eucalyptus regnans F. Muell. Wood Sci. Technol. 1999, 33, 425–437. [Google Scholar] [CrossRef]
- McMillen, J.M. Stresses in Wood During Drying; USDA Forest Service, Forest Products Laboratory: Madison, WI, USA, 1958. [Google Scholar]
- Han, L.Y.; Guo, J.; Wang, K.; Gronquist, P.; Li, R.; Tian, X.L.; Yin, Y.F. Hygroscopicity of Waterlogged Archaeological Wood from Xiaobaijiao No.1 Shipwreck Related to Its Deterioration State. Polymers 2020, 12, 834. [Google Scholar] [CrossRef]
- Garbalińska, H.; Bochenek, M.; Malorny, W.; von Werder, J. Comparative analysis of the dynamic vapor sorption (DVS) technique and the traditional method for sorption isotherms determination—Exemplified at autoclaved aerated concrete samples of four density classes. Cem. Concr. Res. 2017, 91, 97–105. [Google Scholar] [CrossRef]
- Simón, C.; Fernández, F.G.; Esteban, L.G.; de Palacios, P.; Hosseinpourpia, R.; Mai, C. Comparison of the saturated salt and dynamic vapor sorption methods in obtaining the sorption properties of Pinus pinea L. Eur. J. Wood Wood Prod. 2017, 75, 919–926. [Google Scholar] [CrossRef]
- Glass, S.V.; Zelinka, S.L.; Johnson, J.A. Investigation of Historic Equilibrium Moisture Content Data from the Forest Products Laboratory; General Technical Report, FPL-GTR-229; USDA Forest Service, Forest Products Laboratory: Madison, WI, USA, 2014; Volume 229, 37p. [Google Scholar]
- Glass, S.V.; Boardman, C.R.; Zelinka, S.L. Short hold times in dynamic vapor sorption measurements mischaracterize the equilibrium moisture content of wood. Wood Sci. Technol. 2017, 51, 243–260. [Google Scholar] [CrossRef]
- Nopens, M.; Riegler, M.; Hansmann, C.; Krause, A. Simultaneous change of wood mass and dimension caused by moisture dynamics. Sci. Rep. 2019, 9, 10309. [Google Scholar] [CrossRef]
- Yuan, J.; Chen, Q.; Fei, B. Investigation of the water vapor sorption behavior of bamboo fibers with different sizes. Eur. J. Wood Wood Prod. 2021, 79, 1131–1139. [Google Scholar] [CrossRef]
- Broda, M.; Curling, S.F.; Spear, M.J.; Hill, C.A.S. Effect of methyltrimethoxysilane impregnation on the cell wall porosity and water vapour sorption of archaeological waterlogged oak. Wood Sci. Technol. 2019, 53, 703–726. [Google Scholar] [CrossRef]
- Broda, M.; Curling, S.F.; Frankowski, M. The effect of the drying method on the cell wall structure and sorption properties of waterlogged archaeological wood. Wood Sci. Technol. 2021, 55, 971–989. [Google Scholar] [CrossRef]
- Irbe, I.; Andersons, B.; Chirkova, J.; Kallavus, U.; Andersone, I.; Faix, O. On the changes of pinewood (Pinus sylvestris L.) chemical composition and ultrastructure during the attack by brown-rot fungi Postia placenta and Coniophora puteana. Int. Biodeterior. Biodegrad. 2006, 57, 99–106. [Google Scholar] [CrossRef]
- Cao, H.; Gao, X.; Chen, J.; Xi, G.; Yin, Y.; Guo, J. Changes in Moisture Characteristics of Waterlogged Archaeological Wood Owing to Microbial Degradation. Forests 2023, 14, 9. [Google Scholar] [CrossRef]
- Majka, J.; Babiński, L.; Olek, W. Sorption isotherms of waterlogged subfossil Scots pine wood impregnated with a lactitol and trehalose mixture. Holzforschung 2017, 71, 813–819. [Google Scholar] [CrossRef]
- Ouertani, S.; Azzouz, S.; Hassini, L.; Koubaa, A.; Belghith, A. Moisture sorption isotherms and thermodynamic properties of Jack pine and palm wood: Comparative study. Ind. Crops Prod. 2014, 56, 200–210. [Google Scholar] [CrossRef]
- Pizzo, B.; Macchioni, N.; Capretti, C.; Pecoraro, E.; Sozzi, L.; Fiorentino, L. Assessing the wood compressive strength in pile foundations in relation to diagnostic analysis: The example of the Church of Santa Maria Maggiore, Venice. Constr. Build. Mater. 2016, 114, 470–480. [Google Scholar] [CrossRef]
- Macchioni, N.; Pizzo, B.; Capretti, C.; Giachi, G. How an integrated diagnostic approach can help in a correct evaluation of the state of preservation of waterlogged archaeological wooden artefacts. J. Archaeol. Sci. 2012, 39, 3255–3263. [Google Scholar] [CrossRef]
- Macchioni, N. Physical characteristics of the wood from the excavations of the ancient port of Pisa. J. Cult. Herit. 2003, 4, 85–89. [Google Scholar] [CrossRef]
- Han, L.; Xi, G.; Dai, W.; Zhou, Q.; Sun, S.; Han, X.; Guo, H. Influence of Natural Aging on the Moisture Sorption Behaviour of Wooden Structural Components. Molecules 2023, 28, 1946. [Google Scholar] [CrossRef]
- Yuan, J.; Chen, Q.; Fei, B. Different characteristics in the hygroscopicity of the graded hierarchical bamboo structure. Ind. Crops Prod. 2022, 176, 114333. [Google Scholar] [CrossRef]
- Thommes, M.; Kaneko, K.; Neimark, A.V.; Olivier, J.P.; Rodriguez-Reinoso, F.; Rouquerol, J.; Sing, K.S. Physisorption of gases, with special reference to the evaluation of surface area and pore size distribution (IUPAC Technical Report). Pure Appl. Chem. 2015, 87, 1051–1069. [Google Scholar] [CrossRef]
- Brunauer, S.; Emmett, P.H.; Teller, E. Adsorption of gases in multimolecular layers. J. Am. Chem. Soc. 1938, 60, 309–319. [Google Scholar] [CrossRef]
- Popescu, C.-M.; Hill, C.A.; Kennedy, C. Variation in the sorption properties of historic parchment evaluated by dynamic water vapour sorption. J. Cult. Herit. 2016, 17, 87–94. [Google Scholar] [CrossRef]
- Esteban, L.G.; Simón, C.; Fernández, F.G.; de Palacios, P.; Martín-Sampedro, R.; Eugenio, M.E.; Hosseinpourpia, R. Juvenile and mature wood of Abies pinsapo Boissier: Sorption and thermodynamic properties. Wood Sci. Technol. 2015, 49, 725–738. [Google Scholar] [CrossRef]
- Hill, C.A.; Norton, A.; Newman, G. The water vapor sorption behavior of natural fibers. J. Appl. Polym. Sci. 2009, 112, 1524–1537. [Google Scholar] [CrossRef]
- Fernández, F.G.; Esteban, L.G.; de Palacios, P.; Simón, C.; García-Iruela, A.; de la Fuente, J. Sorption and thermodynamic properties of Terminalia superba Engl. & Diels and Triplochiton scleroxylon K. Schum. through the 15, 35 and 50 °C sorption isotherms. Eur. J. Wood Wood Prod. 2014, 72, 99–106. [Google Scholar]
- Sa, Y.; Guo, Y.; Feng, X.; Wang, M.; Li, P.; Gao, Y.; Yang, X.; Jiang, T. Are different crystallinity-index-calculating methods of hydroxyapatite efficient and consistent? New J. Chem. 2017, 41, 5723–5731. [Google Scholar] [CrossRef]
- Chen, Q.; Wang, G.; Ma, X.-X.; Chen, M.-L.; Fang, C.-H.; Fei, B.-H. The effect of graded fibrous structure of bamboo (Phyllostachys edulis) on its water vapor sorption isotherms. Ind. Crops Prod. 2020, 151, 112467. [Google Scholar] [CrossRef]
- Muzaffar, K.; Kumar, P. Moisture sorption isotherms and storage study of spray dried tamarind pulp powder. Powder Technol. 2016, 291, 322–327. [Google Scholar] [CrossRef]
- Bedane, A.H.; Xiao, H.; Eić, M. Water vapor adsorption equilibria and mass transport in unmodified and modified cellulose fiber-based materials. Adsorption 2014, 20, 863–874. [Google Scholar] [CrossRef]


| Process | Sample | GAB Model | H–H Model | ||||||||
|---|---|---|---|---|---|---|---|---|---|---|---|
| R2 | Mm | CGAB | KGAB | SGAB | w | k1 | k2 | R2 | p | ||
| adsorption | Fa | 0.998 | 5.57 | 6.12 | 0.82 | 212.44 | 316.38 | 4.84 | 0.82 | 0.999 | 3.16 |
| Fb | 1 | 4.91 | 6.98 | 0.81 | 187.27 | 367.24 | 6.04 | 0.81 | 1 | 2.72 | |
| Fc | 1 | 5.01 | 6.28 | 0.79 | 191.16 | 361.34 | 5.38 | 0.79 | 1 | 2.77 | |
| Fd | 0.999 | 4.80 | 9.44 | 0.80 | 183.30 | 374.08 | 8.52 | 0.80 | 0.999 | 2.67 | |
| Wa | 0.999 | 5.86 | 7.20 | 0.82 | 223.69 | 304.34 | 6.07 | 0.82 | 0.999 | 3.29 | |
| Wb | 0.999 | 5.69 | 8.57 | 0.83 | 217.13 | 313.69 | 7.47 | 0.83 | 0.999 | 3.19 | |
| Wc | 0.999 | 5.77 | 8.44 | 0.83 | 220.15 | 311.61 | 7.47 | 0.83 | 0.999 | 3.21 | |
| Wd | 0.999 | 5.72 | 7.23 | 0.83 | 218.16 | 314.91 | 6.26 | 0.83 | 0.999 | 3.18 | |
| desorption | Fa | 0.999 | 7.59 | 6.14 | 0.76 | / | 233.21 | 4.95 | 0.75 | 0.999 | / |
| Fb | 1 | 9.45 | 4.45 | 0.65 | / | 190.30 | 3.44 | 0.65 | 0.999 | / | |
| Fc | 0.999 | 10.72 | 3.63 | 0.60 | / | 168.84 | 2.65 | 0.60 | 0.999 | / | |
| Fd | 1 | 10.56 | 4.97 | 0.59 | / | 171.07 | 3.98 | 0.59 | 0.999 | / | |
| Wa | 1 | 8.84 | 10.06 | 0.73 | / | 203.76 | 9.09 | 0.73 | 0.999 | / | |
| Wb | 1 | 8.98 | 9.21 | 0.73 | / | 201.42 | 8.31 | 0.73 | 1 | / | |
| Wc | 1 | 9.30 | 8.89 | 0.73 | / | 195.70 | 7.99 | 0.73 | 0.999 | / | |
| Wd | 1 | 9.80 | 7.14 | 0.71 | / | 186.61 | 6.35 | 0.71 | 0.999 | / | |
Disclaimer/Publisher’s Note: The statements, opinions and data contained in all publications are solely those of the individual author(s) and contributor(s) and not of MDPI and/or the editor(s). MDPI and/or the editor(s) disclaim responsibility for any injury to people or property resulting from any ideas, methods, instructions or products referred to in the content. |
© 2023 by the authors. Licensee MDPI, Basel, Switzerland. This article is an open access article distributed under the terms and conditions of the Creative Commons Attribution (CC BY) license (https://creativecommons.org/licenses/by/4.0/).
Share and Cite
Han, L.; Yu, D.; Liu, T.; Han, X.; Xi, G.; Guo, H. Size Effect on Hygroscopicity of Waterlogged Archaeological Wood by Simultaneous Dynamic Vapour Sorption. Forests 2023, 14, 519. https://doi.org/10.3390/f14030519
Han L, Yu D, Liu T, Han X, Xi G, Guo H. Size Effect on Hygroscopicity of Waterlogged Archaeological Wood by Simultaneous Dynamic Vapour Sorption. Forests. 2023; 14(3):519. https://doi.org/10.3390/f14030519
Chicago/Turabian StyleHan, Liuyang, Dehao Yu, Tiantian Liu, Xiangna Han, Guanglan Xi, and Hong Guo. 2023. "Size Effect on Hygroscopicity of Waterlogged Archaeological Wood by Simultaneous Dynamic Vapour Sorption" Forests 14, no. 3: 519. https://doi.org/10.3390/f14030519
APA StyleHan, L., Yu, D., Liu, T., Han, X., Xi, G., & Guo, H. (2023). Size Effect on Hygroscopicity of Waterlogged Archaeological Wood by Simultaneous Dynamic Vapour Sorption. Forests, 14(3), 519. https://doi.org/10.3390/f14030519