Abstract
Urban trees are often more sun- and wind-exposed than their forest-grown counterparts. These environmental differences can impact how many species grow–impacting trunk taper, crown spread, branch architecture, and other aspects of tree form. Given these differences, windthrow models derived from traditional forest production data sources may not be appropriate for urban forest management. Additionally, visual abnormalities historically labeled as “defects” in timber production, may not have a significant impact on tree failure potential. In this study, we look at urban tree failures associated with Hurricane Irma in Tampa, Florida, USA. We used spatial analysis to determine if patterns of failure existed among our inventoried trees. We also looked at risk assessment data to determine which visual defects were the most common and the most likely to be associated with branch or whole-tree failure. Results indicate that there was no spatial pattern associated with the observed tree failures–trees failed or withstood the storm as individuals. While some defects like decay and dead wood were associated with increased tree failure, other defects such as weak branch unions and poor branch architecture were less problematic.
Keywords:
cyclone; defect; hurricane; likelihood of failure; storm damage; typhoon; urban ecology; urban forestry 1. Introduction
Throughout the world, urban developments are concentrated in coastal areas, many of which are exposed to intense wind events (e.g., hurricanes, cyclones, and typhoons) [1] that can induce failure of whole trees, branches, trunks, or roots. Previous work has investigated wind-induced tree failures in natural areas and on plantations [2,3,4,5,6,7,8] as well as in urban areas [9,10,11,12,13,14,15]. In a recent systematic review, van Haaften et al. [16] conducted a meta-analysis of 161 studies that revealed 142 factors associated with tree failure. Measures of tree size (height, weight, volume, diameter at 1.4 m above ground (DBH)) were positively correlated with stem and root failures [16], but Klein et al. [17] found a negative correlation between tree size and likelihood of failure. Part of the inconsistency may have been due to the inclusion of studies that considered both forest- and open-grown trees in the meta-analysis. Natural forests lack many of the species commonly planted in urban and suburban areas [17] and open-grown trees are morphologically different from congeners growing in forest stands [18]. Branch failures are rarely reported in forest stands—and the meta-analysis found no positive relationships with independent variables [16]—but often make up a sizable proportion of failed trees in urban and suburban areas [9,10,14,17,19,20]. Trees growing in urban and suburban landscapes also frequently have structural defects that can increase the likelihood of failure, although few studies [19,21] have assessed the effect of defects.
In addition to intrinsic factors such as species, size, and the presence and severity of defects, wind is an important determinant of the likelihood of failure [10,14]. Summarizing the findings of survivability of sixteen species across eight different hurricanes, Klein et al. [17] reported a general decrease in survivorship as wind speed increased. In addition to mean wind speed recorded at a weather station, local wind speed can be influenced by topography, engineered structures, and surface cover [21], making it difficult to detect patterns that manifest in the likelihood of tree failure. For example, although Duryea et al. [14] noted that trees growing in groups were less likely to fail—presumably because of the sheltering effect of neighbors—Landry et al. [20] found no correlation between likelihood of failure and the count of trees in a sample plot.
Structures and planted trees can alter wind flow in developed landscapes, increasing its speed (compared to the mean reported at a nearby weather station) in one location, while decreasing it in another. A classic example of sheltering crops and structures from the wind is the use of windbreaks [22]. Their effectiveness depends on their height, length, width, density, and orientation with respect to airflow. The particular combination of these factors influences the amount of leeward area that is sheltered and the proportional reduction in wind speed. The reduction in wind speed in the leeward direction generally decreases beyond twenty times the height of the trees that make up the windbreak.
Likelihood of tree failure may also depend on neighborhood-level factors, which can influence canopy cover. Previous studies have demonstrated the effect of lot size, the proportion of single-family residential homes [23], and building age [24,25] on canopy cover. These factors might also influence the volume of soil available for rooting, which influences the likelihood of uprooting [14,15]. Neighborhood-level effects also influence tree maintenance [26,27], which has been shown to influence the likelihood of failure [14,15,17,28].
The variety and complexity of factors that influence the likelihood of tree failure make assessment a challenge. Practitioners have developed best practices to reduce uncertainty [29,30,31], but their reliability and accuracy are questionable [32]. Recent work has shown that if the likelihood of failure rating (using the International Society of Arboriculture Tree Risk BMP) was “imminent”, the likelihood of failure was positively related to the rating; but for lesser ratings such as “possible” and “probable”, the relationship was less clear [19].
Understanding wind-induced tree failures in urban areas is important because recent climate change reports have predicted that natural disasters (i.e., extreme wind events, drought, fires, and pest outbreaks) will increase in intensity and frequency [33,34] and that such disasters are a threat to canopy cover across the urban forests of the world [34].
Our objectives for this study were as follows:
- Assess the accuracy of visual assessments of likelihood of failure using the United State Department of Agriculture Forest Service tree risk assessment method [29].
- Determine which defects significantly contribute to whole and partial tree failure.
- Assess whether the presence of a windbreak effect exists within the urban forest context.
2. Materials and Methods
2.1. Data Sources
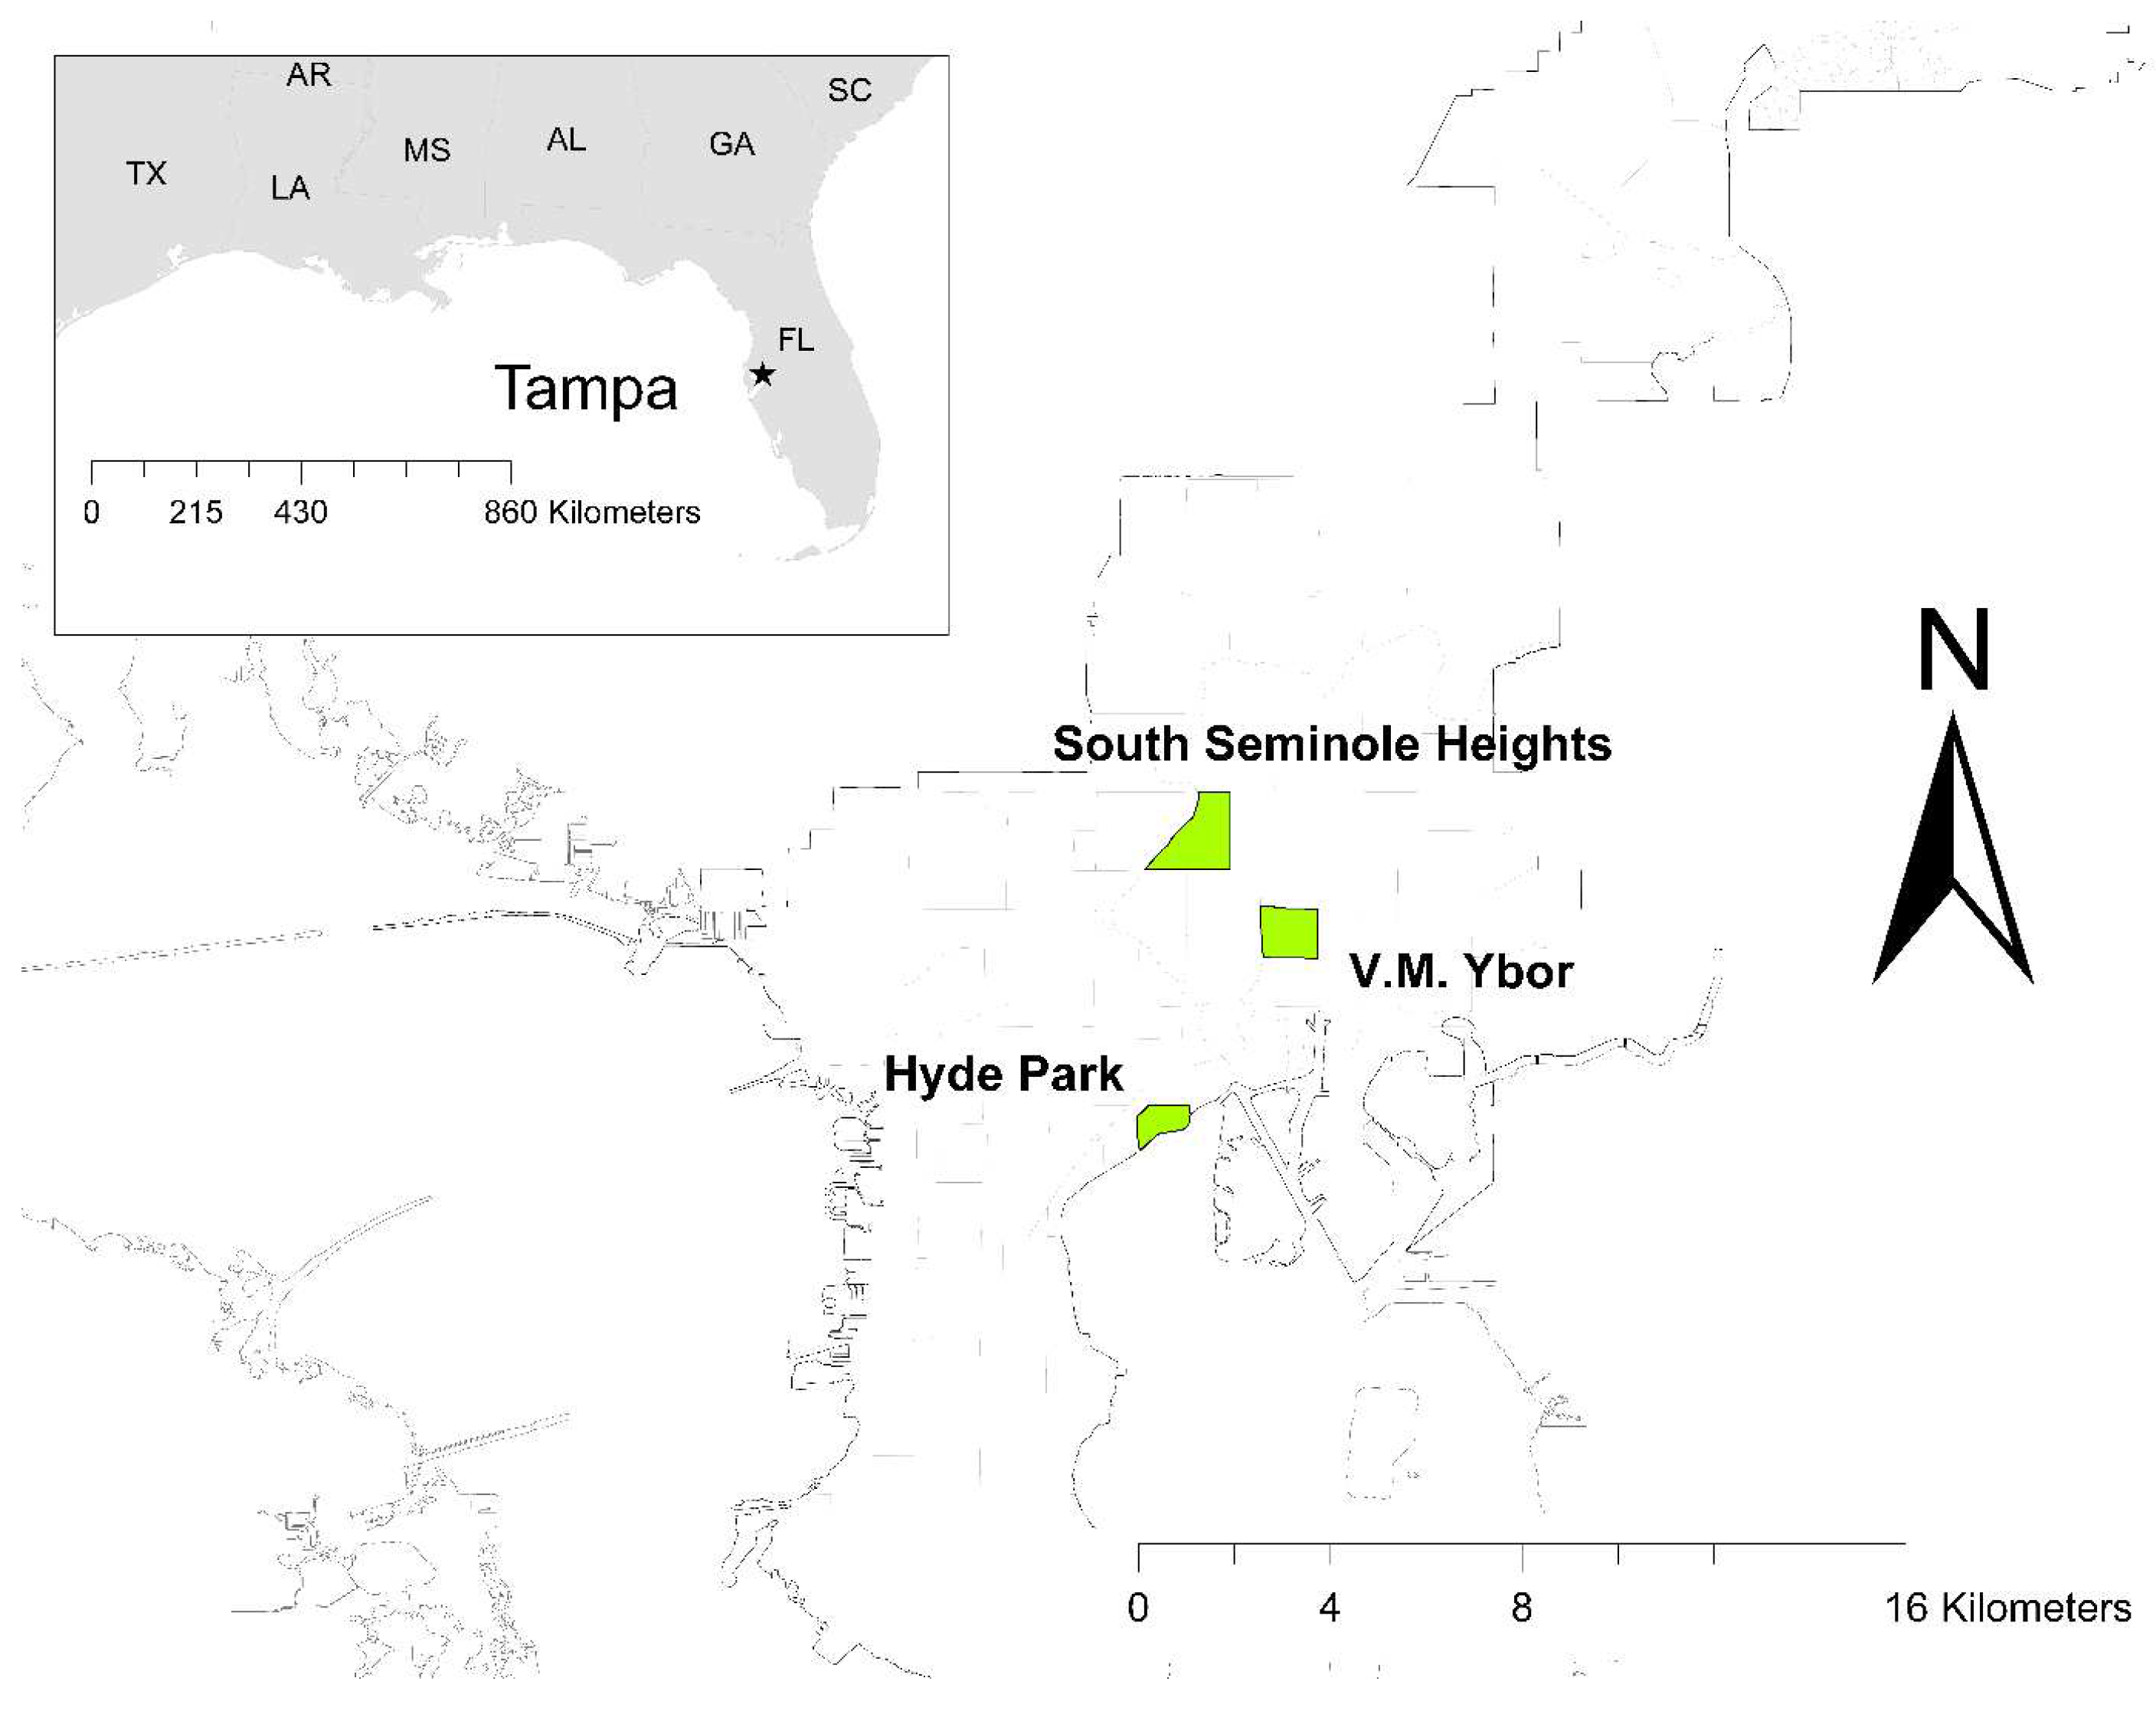
In 2015, we conducted a complete inventory of street and park trees (n = 2394) in three neighborhoods in Tampa, FL, USA (Figure 1): Hyde Park (27.9417° N, 82.4639° W), South Seminole Heights (27.9888° N, 82.4621° W), and V.M. Ybor (27.9705° N, 82.4442° W). Estimated canopy cover in Hyde Park, South Seminole Heights, and V.M. Ybor is 42%, 47%, and 33%, respectively [35].

Figure 1.
Study locations within the City of Tampa, Florida, USA. A complete tree inventory (see Table 1) was conducted within each of the three neighborhoods in 2015. In 2017, Hurricane Irma impacted the city as a category 1 storm on the Saffir–Simpson Hurricane Wind Scale.
A pair of International Society of Arboriculture (ISA) Certified Arborists holding the ISA Tree Risk Assessment Qualification (TRAQ) conducted the inventory. Table 1 includes data they collected, grouped by the following tree attributes: location, size, defects, and likelihood of failure rating. The likelihood of failure rating and assessment of defects were made in accordance with Pokorny [29]. If more than one defect were present, assessors recorded them and judged which was the most likely to cause failure.

Table 1.
Tree attributes recorded during the inventory of public trees in Tampa, Florida three years prior to Hurricane Irma. Variables used in our initial model to predict tree failure are bolded.
In September 2017, Hurricane Irma made landfall in Southwest Florida as a category 3 hurricane. As the storm moved northward, it diminished in strength. By the time it reached the study sites in Tampa, Irma was downgraded to a category 1 storm [20] on the Saffir–Simpson Hurricane Wind Scale [36], which categorizes hurricanes, in part, based on the damage they can inflict on structures and trees. Category 1 hurricanes will cause “large branches of trees [to] snap and shallowly rooted trees may be toppled” [36].
In the winter and early spring of 2018, we revisited the neighborhoods to assess storm damage. Two assessors, one of whom participated in the pre-hurricane inventory, searched for missing trees (determined by recently cut or ground stumps) and trees with broken branches or recent pruning cuts (determined visually from wood color and absence of woundwood formation). Since it was not possible to assess storm damage immediately following the storm for safety and to avoid impeding emergency cleanup operations, the assessors classified trees as standing, branch failure, or whole tree failure. It was not possible to determine whether whole tree failures were the result of root failure, stem failure, or sufficient crown damage that warranted removal. The 2018 data represent changes in the trees originally surveyed in 2015 that were attributed to the hurricane.
2.2. Defect Analysis
We used chi-square tests to assess the significance of associations between tree defects (Table 1) and branch or whole-tree failures. The defects “canker” and “crack” were excluded from the analysis due to small sample sizes (n = 1 and 8, respectively).
2.3. Analysis of Sheltering
We used previously-generated land cover raster data of the City of Tampa [35] to assess the potential wind protection offered by neighboring trees and structures. The land cover used six classes derived from the National Land Cover Database (NLCD) classification system: bare earth, buildings, grass/shrub, impervious, water, and tree canopy. The raster data was at a 6-inch cell resolution and covered the entire Tampa city limits. For computational tractability, we buffered the three target neighborhood polygons by 500 m and cropped the raster to these borders.
To assess the possible sheltering effect of nearby aboveground structures, we classified land cover types of “buildings” and “tree canopy” as “windbreak”. The percentages of windbreak cover in buffers surrounding individual trees were calculated within buffers from 10–100 m, in 10-m intervals. To choose an appropriate buffer size, we selected the buffer size that maximized the variance in windbreak percent [37]. The variance was maximized at 10 m; the percentage of windbreak within a 10-m radius of individual trees was included as a covariate in the regression models.
2.4. Variable Selection and Modeling
Prior to creating models, we selected a set of candidate predictor variables from the data set: DBH, crown length (tree height–height to lowest branch), height ratio, canopy width, zoning (residential/commercial), likelihood of failure rating (1–4), neighborhood, and proportion of windbreak in surrounding buffer. A logistic regression model was fit using the glm() function in R [38] using tree failure as a binary response. A tree was considered to have experienced a failure if it was rated as either ‘branch’ or ‘whole tree’ failure in the survey. We eliminated crown length, and canopy width given either (i) high multicollinearity, as measured by variance inflation factor (VIF) > 4, or (ii) large numbers of missing data. In a further round of model selection, insignificant terms (apart from the windbreak) were removed leaving likelihood of failure and DBH as significant predictors. The windbreak term, although insignificant, was retained in the model because it was part of our third hypothesis.
We used the Moran’s I statistic to test for spatial autocorrelation in the model residuals. Moran’s I is used to characterize whether nearby quantities are more similar than expected by chance, thereby violating the key model assumption of independence of observations. For point data, Moran’s I may consider nearby points based on a fixed distance, or a list of the k-nearest points. To detect spatial autocorrelation, we created neighborhoods based on both distance-based and K-nearest-neighbor (KNN) methods using the knearneigh() and dnearneigh() functions in package spdep [39]. KNN neighborhoods were defined as the 5 nearest neighbors, while distance neighborhoods consisted of all trees within 150 m of a central tree. We used the R function moran.test in package spdep [39] to perform the Moran’s I tests.
Due to significant spatial autocorrelation in the logistic model residuals, a spatial autoregressive logistic model, hereafter referred to as the spatial GLS, with a Matérn correlation structure was fit using the fitme() function in packages spaMM [40]. A Matérn process models clustering of like values in a point pattern; inclusion of an explicit Matérn process model in a regression can remove spatial autocorrelation in the residuals. Significant residual autocorrelation violates the independence of observations model assumption and can result in unreliable estimates of the significance in model terms [41]. There was no significant spatial autcorrelation detected in the residuals of the spatial GLS. Conservative estimates of p-values were made by computing the p-values associated with the model terms’ t-values. The p-values were calculated using 100 degrees of freedom (the final spatial GLS was built from 1979 observations.). p-values were then adjusted for multiple testing using the Hochberg method.
3. Results and Discussion
3.1. Tree Failures
Of the trees surveyed in 2015 in Hyde Park, South Seminole Heights, and V.M. Ybor, 25% failed: 18% branch failures and 7% whole tree failures. The overall failure rate was similar to that in Naples, FL, USA, where Hurricane Irma (with winds from Category 1 to Category 2) caused 26% of surveyed trees to fail [17]. Following Irma’s northward passage (as a tropical storm) through Tampa, Orange County, and Gainesville, Florida, Landry et al. [20] reported 20 whole tree failures and 376 branch failures among 693 trees. Their results are not directly comparable, however, because (i) they observed multiple branch failures in some trees and (ii) their sample included trees on private property and homeowners are willing to maintain trees in poorer conditions than managers on public, institutional, or commercial sites [35]. Only 7% of trees surveyed on institutional or commercial sites in Charleston, SC, USA and Savannah, GA, USA failed during Tropical Storm Matthew in 2016 [19].
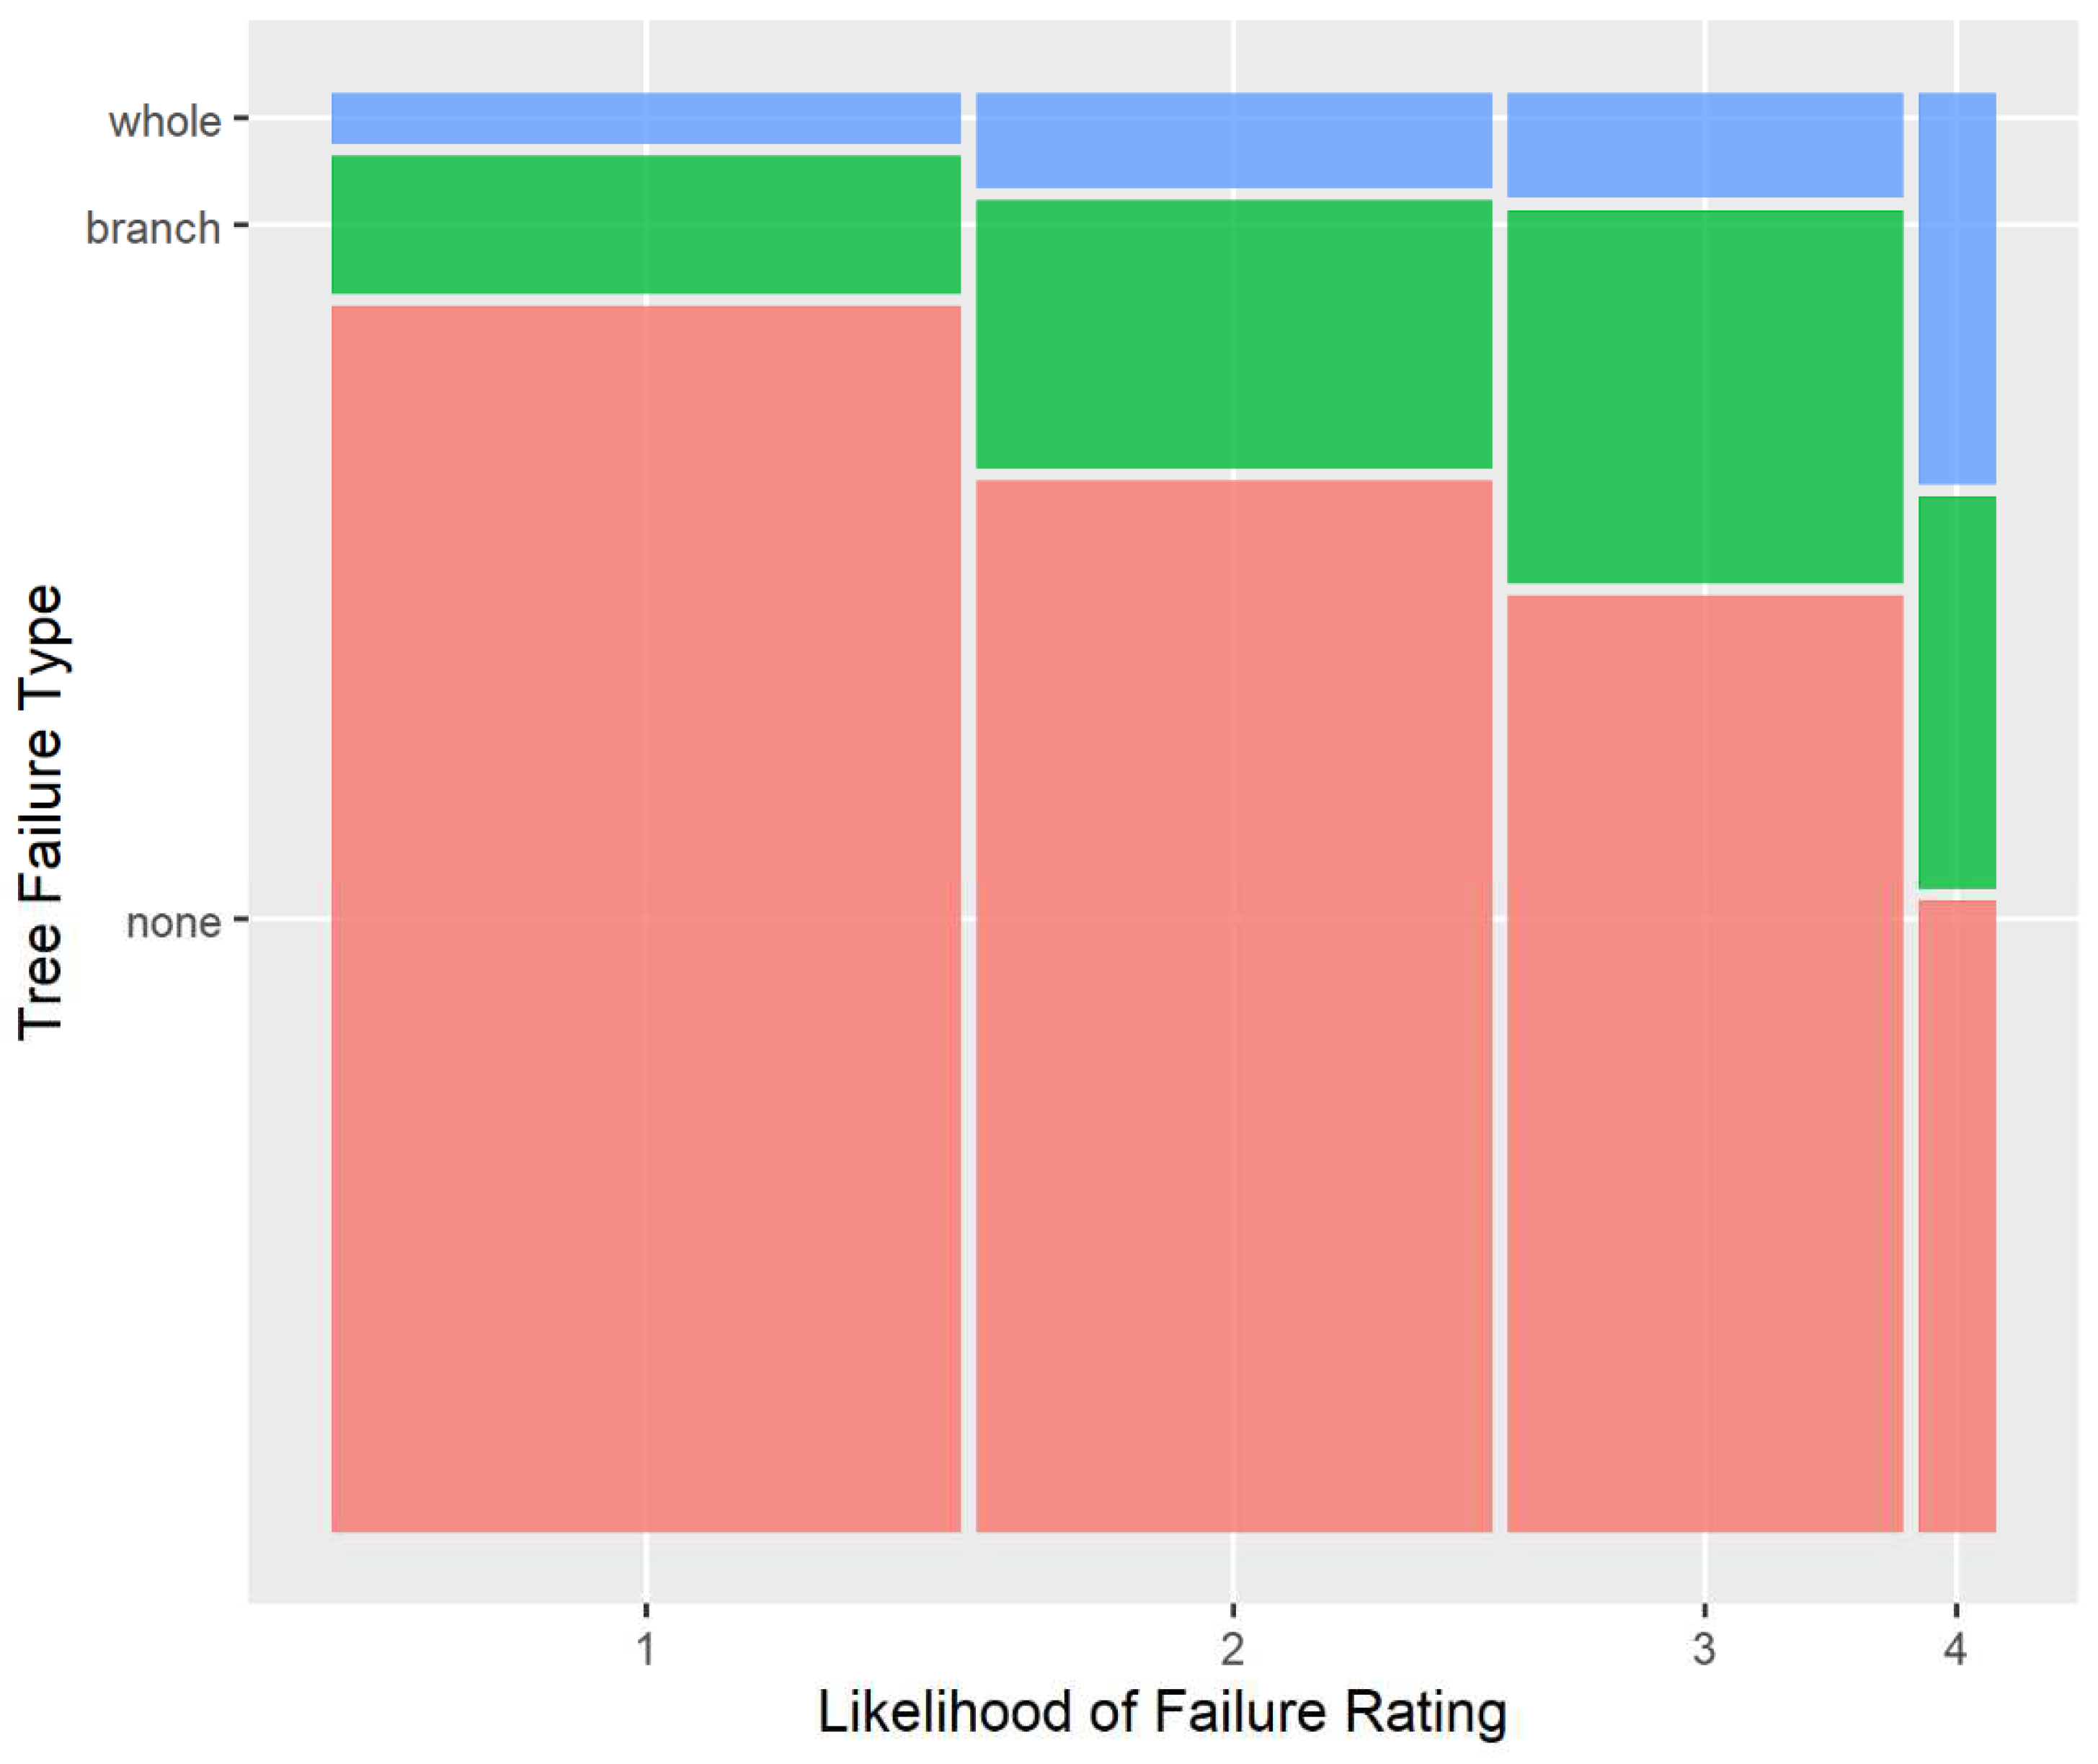
Likelihood of failure ratings are qualitative categorizations intended to cover all possible failure scenarios ranging from the highly unlikely to the nearly guaranteed. In the USDA Forest Service method [29] that we used for this project, ratings of 1, 2, 3, and 4 refer to “low”, “moderate”, “high”, and “extremely high” likelihood of failure, respectively. Figure 2 shows the proportional distribution of sampled trees by likelihood of failure rating and failure type. Consistent with Koeser et al. [19] findings with a different 4-point rating system, most trees had a “low” (39%) or “moderate” (32%) likelihood of failure; only a small proportion of trees had an “extremely high” (5%) likelihood of failure (Figure 2). Approximately 24% had a “high” likelihood of failure. There is also a general increase in failures as likelihood of failure rating increases (Figure 2). The branch failures were similar for trees rated as having low, moderate, and high likelihood of failure, but much greater for trees rated as having an extremely high likelihood of failure. The proportion of branch failures was similar among the trees assessed as having “moderate” (19%), “high” (26%), and “extremely high” (28%) likelihoods of failure, but much smaller for trees with a “low” likelihood of failure (10%) (Figure 2). The proportion of whole tree failures was similar for trees with “low” (3%), “moderate” (7%), and “high” (7%) likelihoods of failure. However, 28% of trees rated as having an “extremely high” likelihood of failure were removed following the storm.
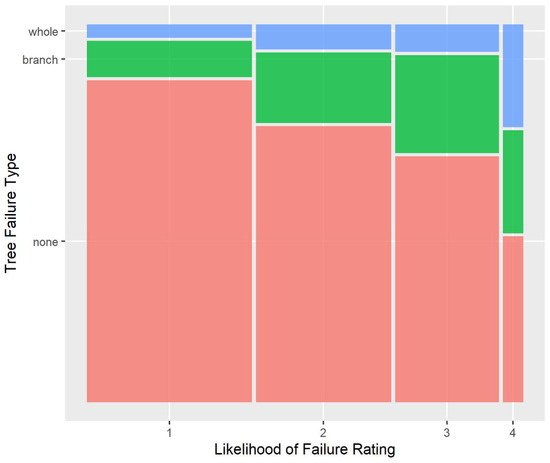
Figure 2.
Mosaic plot showing the proportional distribution of failure types and likelihood of failure ratings of trees surveyed in 3 neighborhoods in Tampa during the 2018 post-hurricane inventory. Ratings of 1, 2, 3, and 4 indicate “low”, “moderate”, “high”, and “extremely high” likelihood of failure, respectively [29]. Chi-square test on the corresponding contingency table was highly significant (p-value < 0.001).
Figure 2 also reveals the nearly identical proportions of trees (i) assessed as having “moderate” and “high” likelihood of failure and (ii) in each failure type. Interestingly, both the number of trees rated as having “moderate” likelihood of failure (n = 762) and “high” likelihood of failure (n = 584) and the proportion of “whole”, “branch”, or “none” failures within each of these ratings were very similar (Figure 2). This may be an indication of spurious resolution–or a rating system that has too many levels that are not distinct enough to warrant the existence of all of them [42]. In contrast, Koeser et al. [19] documented significant differences in rates of tree failure for all four levels of likelihood of failure using the approach described by Smiley et al. [31]. Beyond slightly differing terminology, the two risk assessment methods used are noticeably different in how they qualify likelihood of failure. The method used in this study [29] has a somewhat formulaic rating system based on the presence or absence of key defects and their severity (based, in some instances, on the proportion of the tree part affected). In contrast, the method assessed by Smiley et al. [31] gives the assessor more flexibility to draw on professional judgement–with most defects having a range of potential likelihood of failure ratings associated with them in the methods manual [30].
3.2. Defect Analysis
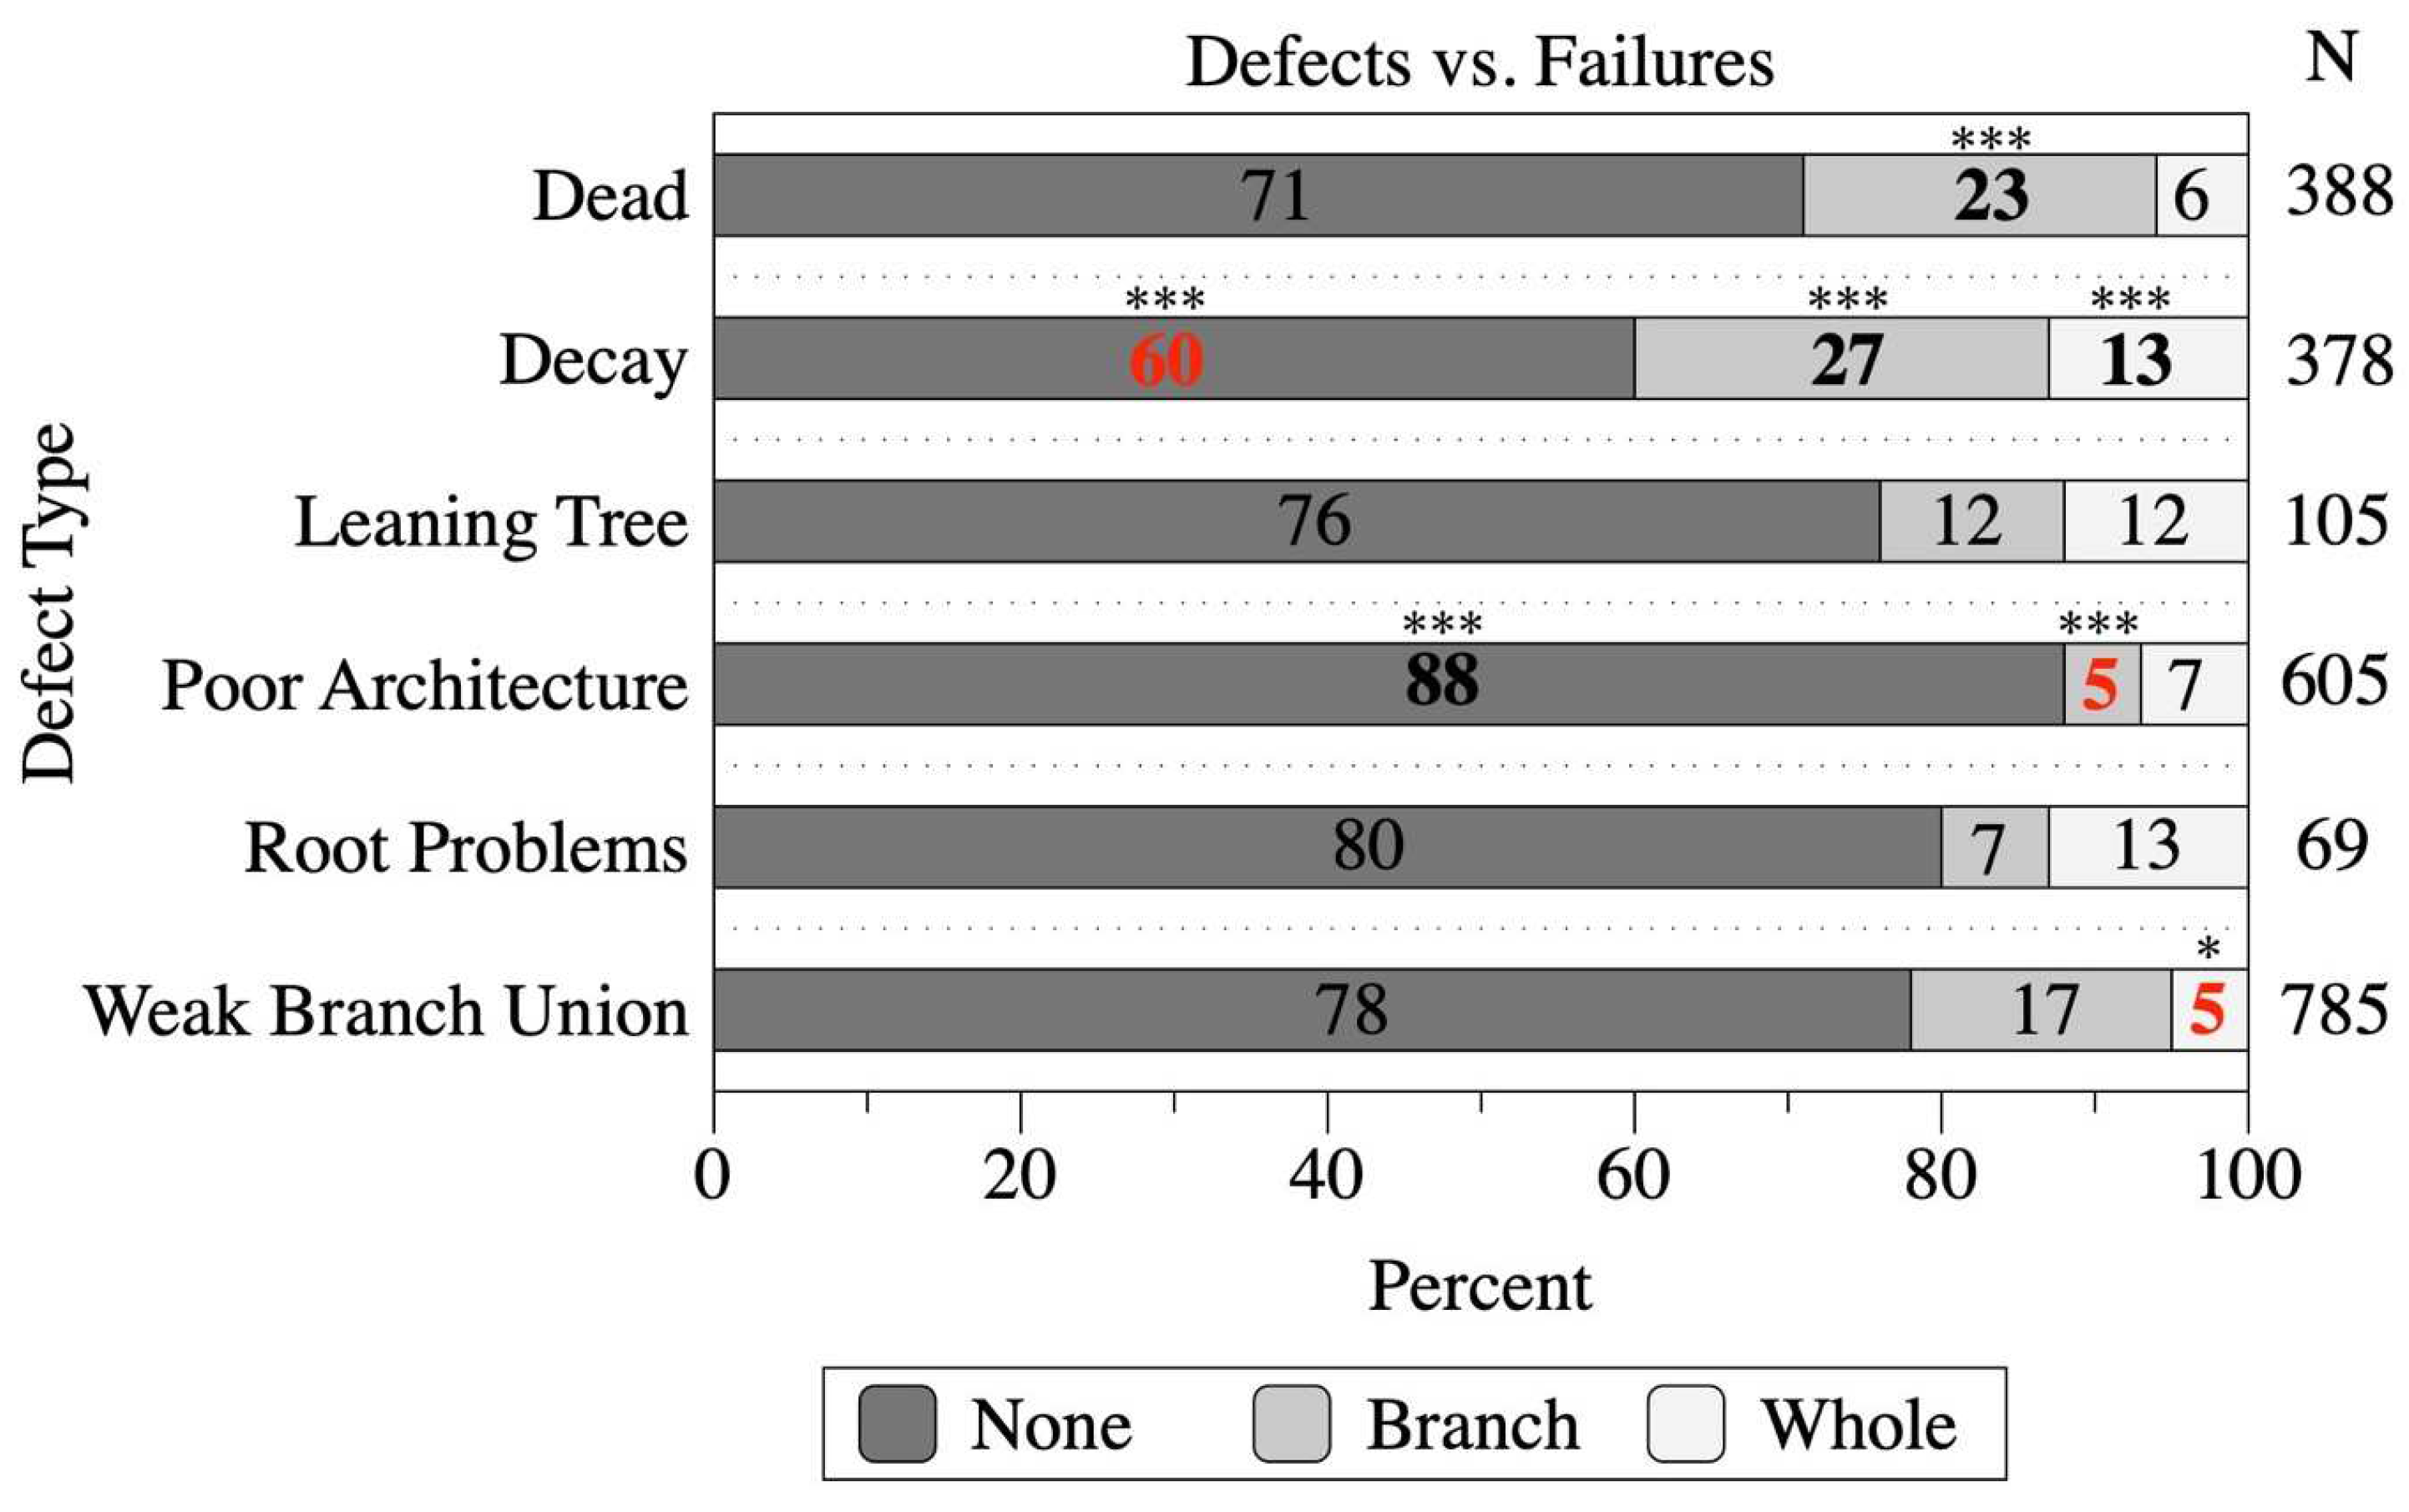
Assessing defects is integral to tree risk assessment as most systems attribute their presence with an increased likelihood of failure [30,31]. This noted, some defects have received more empirical scrutiny than others. Many studies have investigated how well practitioners can assess the presence, extent, and location of decay [43,44,45,46]; fewer have explored the degree to which decay increases the likelihood of failure [19,47]. In this study, the presence of decay was associated with a greater proportion of branch and whole tree failures (Figure 3), but the data from Koeser et al. [19] did not align with this, which is a reminder that the presence of even a severe defect does not always induce failure.
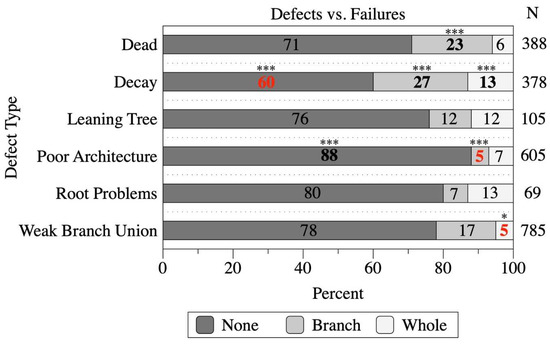
Figure 3.
Percentage of trees that did not fail (“None”) and those that experienced branch or whole-tree failure categorized by defects present before the passage of Hurricane Irma. Values in black, boldface type are higher than expected given the null hypothesis that defects do not influence the likelihood of failure. Values in red, boldface type are lower than would be expected given the null hypothesis that defects do not influence the likelihood of failure. A single asterisk (*) indicates p-value ≤ 0.05; three asterisks (***) indicate p-value ≤ 0.001.
Another commonly assessed defect is weak branch attachment, the most commonly reported defect in our data (Figure 3). As might be expected given their location in the tree, weak branch attachments were associated with a smaller proportion of whole tree failures (Figure 3). Although many studies have quantified the reduced load-bearing capacity of weak branch attachments [48,49,50,51], they did not fail in 78% of trees in which they were the defect of primary concern. The comparatively low failure rate of weak branch attachment aligned with previous studies of tree failures following a hurricane [19] and a snowstorm [47], suggest that it may not be as serious a defect as considered.
Other commonly reported defects in our study were dead branches and poor architecture (Figure 3). When dead branches were present, the proportion of branch failures was greater (p-value < 0.001, Figure 3), which we expected and aligned with previous work [19]. However, it was unexpected that there were fewer branch failures—and a smaller proportion of failures overall—associated with trees that had poor architecture (p-value < 0.001, Figure 3). The findings do not align well with the results obtained by Koeser et al. [19], illustrating the challenge of assessing defects and the overall uncertainty of assessing likelihood of failure.
The uncertainty surrounding which defects truly limit a tree’s ability to weather a storm is highlighted in Table 2. This table summarizes the effects of defects on likelihood of failure from our work and two previous [19,52] studies. The three studies used different assessment methods so direct comparison is not possible, but it is notable that only two defects (decay and dead branch or tree) were positively associated with likelihood of failure in more than one of the four studies. One defect (weak branch attachment) was negatively associated with likelihood of failure in two of the studies. Other defects were positively (decline, lean, wound) or negatively (poor architecture) associated with likelihood of failure in a single study. Future studies should continue to assess the effect of defects on likelihood of failure; using the current industry best practices guide [31] would help record defects consistently, facilitating future analyses.
Table 2.
Defects assessed and associated with wind-induced tree failures from previous studies; red highlighting indicates that a defect was associated with increased tree failure (+) in two studies; orange highlighting indicates that a defect was associated with increased tree failure in one study; blue highlighting indicates that a defect was associated with decreased tree failure (-) in two studies; light gray highlighting indicates that a defect was associated with decreased tree failure (-) in one study; yellow highlighting indicates that a defect has not been associated with tree failure (NS); “•” indicates that a defect was not assessed in the study.
3.3. Analysis of the Spatial GLS
The Moran’s I test found significant spatial autocorrelation in the aspatial regression residuals (p-value < 0.001). However, this autocorrelation disappeared in the spatial GLS model (p-value > 0.05). In the spatial GLS, the coefficients for “medium”, “high”, and “extremely high” failure likelihood were all highly significant (p-value < 0.01). Higher likelihood of failure ratings was associated with increased tree failure rates; the coefficients for “medium” and “high” were similar (0.61 and 0.66, respectively), while the coefficient for “extremely high” was much higher (1.06). Larger DBH was associated with increases in likelihood of failure (p-value < 0.001).
The model coefficient for percentage of windbreak within 10 m of individual trees was not significant (Table 3). Given the protective effect on tree survival during hurricanes observed previously [14], the lack of a significant windbreak effect is surprising, but consistent with a previous work on hurricane Irma [20]. Although windbreaks often provide protection from damage from winds, modeling and observational studies suggest the situation is complex and the protective effects are not always observed [53].
Table 3.
Model coefficients for spatial GLS logistic regressions. Significance codes: *** p-value < 0.001, ** p-value < 0.01, n.s. not significant.
4. Conclusions
This work offers further evidence that visual tree risk assessment by trained assessors can be used to predict tree failure associated with wind events. Increased branch and whole tree failures were associated with the more severe ratings of failure potential. This noted, there could be issues of spurious resolution (to many levels) in the system used as the middle two ratings had similar failure profiles. While visual defect assessment is core to most assessment methods, our results support past findings which indicate that only a portion of the issues arborists and urban foresters include in their assessments are associated with increased rates of failure during storms. More research is needed to determine which defects are categorized as such, given their impact on tree structural integrity. Moreover, research is needed to determine when strength reduction becomes problematic with regard to trees and expected wind loads. While windbreaks may provide protection against tree failure in some situations, our failure to detect a significant protective effect of nearby buildings and tree canopy suggests that windbreak effects are complex and additional, spatially-explicit analyses may be needed to understand them.
Author Contributions
Conceptualization, A.K.K.; Methodology, A.K.K.; Formal analysis, M.F.N.; Data curation, A.K.K. and M.F.N.; Writing—Original draft, A.K.K., R.W.K., B.K. and M.F.N.; Writing—Review and editing, A.K.K., M.F.N., R.W.K., B.K. and S.M.L.; Visualization, A.K.K. and M.F.N.; Supervision, A.K.K.; Project administration, A.K.K.; Funding acquisition, A.K.K., B.K. and S.M.L. All authors have read and agreed to the published version of the manuscript.
Funding
Funding for the original, pre-storm data collection was provided by the Florida Forest Service Urban and Community Forestry grant program (Grant number 00116832). Funding for the post-storm evaluation was provided by the UF/IFAS Early Career Scientist Seed Grant (Internal funding—no grant number).
Data Availability Statement
Data is available upon request from the corresponding authors. Given the nature of the data (tree risk assessments in populated areas), address and location information will be stripped from the dataset prior to sharing.
Acknowledgments
We thank Drew McLean, Gitta Hasing, and Julie Schelb for their efforts in inventorying and risk assessing the trees in this study.
Conflicts of Interest
The authors declare no conflict of interest. The funders had no role in the design of the study; in the collection, analyses, or interpretation of data; in the writing of the manuscript, or in the decision to publish the results.
References
- Salisbury, A.B.; Koeser, A.K.; Hauer, R.J.; Hilbert, D.R.; Abd-Elrahman, A.H.; Andreu, M.G.; Britt, K.; Landry, S.M.; Lusk, M.G.; Miesbauer, J.W.; et al. The legacy of hurricanes, historic land cover, and municipal ordinances on urban tree canopy in Florida (United States). Front. For. Glob. Chang. 2022, 5, 742157. [Google Scholar] [CrossRef]
- Frangi, J.L.; Lugo, A.E. Hurricane damage to a flood plain forest in the Luquillo Mountains of Puerto Rico. Biotropica 1991, 24, 324–335. [Google Scholar] [CrossRef]
- Gresham, C.A.; William, T.M.; Lipscombe, D.J. Hurricane Hugo wind damage to Southeastern U.S. coastal forest tree species. Biotropica 1991, 23, 420–426. [Google Scholar] [CrossRef]
- Putz, F.E.; Sharitz, R.R. Hurricane damage to old-growth forest in Congaree Swamp National Monument, South Carolina, U.S.A. Can. J. For. Res. 1991, 21, 1765–1770. [Google Scholar] [CrossRef]
- Walker, L.R. Tree damage and recovery from Hurricane Hugo in Luquillo Experimental Forest, Puerto Rico. Biotropica 1991, 23, 379–385. [Google Scholar] [CrossRef]
- Everham, E.M.; Brokaw, N.V.L. Forest damage and recovery from catastrophic wind. Bot. Rev. 1996, 62, 113–185. [Google Scholar] [CrossRef]
- Asner, G.P.; Goldstein, G. Correlating stem biomechanical properties of Hawaiian canopy trees with hurricane wind damage. Biotropica 1997, 29, 145–150. [Google Scholar] [CrossRef]
- Mitchell, S.J. Wind as a natural disturbance agent in forests: A synthesis. Forestry 2013, 86, 147–157. [Google Scholar] [CrossRef] [Green Version]
- Gibbs, J.N.; Greig, B.J.W. Survey of parkland trees after the great storm of October 16, 1987. Arboric. J. 1990, 14, 321–347. [Google Scholar] [CrossRef]
- Francis, J.K.; Gillespie, A.J.R. Relating gust speed to tree damage in Hurricane Hugo, 1989. J. Arboric. 1993, 19, 368–373. [Google Scholar] [CrossRef]
- Duryea, M.L. Wind and Trees: Surveys of Tree Damage in the Florida Panhandle after Hurricanes Erin and Opal; EDIS CIR1183; University of Florida; Florida Cooperative Extension Service; Institute of Food and Agricultural Sciences: Gainesville, FL, USA, 1997; p. 5. [Google Scholar]
- Jim, C.Y.; Liu, H.T. Storm damage on urban trees in Guangzhou, China. Landsc. Urban Plan. 1997, 38, 45–59. [Google Scholar] [CrossRef]
- Francis, J.K. Comparison of hurricane damage to several species of urban trees in San Juan, Puerto Rico. J. Arboric. 2000, 26, 189–197. [Google Scholar] [CrossRef]
- Duryea, M.L.; Kampf, E.; Littell, R.C. Hurricanes and the urban forest: I. Effects on Southeastern United States coastal plain tree species. Arboric. Urban For. 2007, 33, 83–97. [Google Scholar] [CrossRef]
- Duryea, M.L.; Kampf, E.; Littell, R.C.; Rodriguez-Pedraza, C.D. Hurricanes and the urban forest: II. Effects on tropical and subtropical tree species. Arboric. Urban For. 2007, 33, 98–112. [Google Scholar] [CrossRef]
- van Haaften, M.; Liu, Y.; Wang, Y.; Zhang, Y.; Gardebroek, C.; Heijman, W.; Meuwissen, M. Understanding tree failure–A systematic review and meta-analysis. PLoS ONE 2021, 16, e0246805. [Google Scholar] [CrossRef]
- Klein, R.W.; Koeser, A.K.; Kane, B.; Landry, S.M.; Shields, H.; Lloyd, S.; Hansen, G. Evaluating the likelihood of tree failure in Naples, Florida (United States) following Hurricane Irma. Forests 2020, 11, 485. [Google Scholar] [CrossRef]
- MacFarlane, D.W.; Kane, B. Neighbour effects on tree architecture: Functional trade-offs balancing crown competitiveness with wind resistance. Funct. Ecol. 2017, 31, 1624–1636. [Google Scholar] [CrossRef] [Green Version]
- Koeser, A.K.; Smiley, E.T.; Hauer, R.J.; Kane, B.; Klein, R.W.; Landry, S.M.; Sherwood, M. Can professionals gauge likelihood of failure?-Insights from Tropical Storm Matthew. Urban For. Urban Green. 2020, 52, 126701. [Google Scholar] [CrossRef]
- Landry, S.M.; Koeser, A.K.; Kane, B.; Hilbert, D.R.; McLean, D.C.; Andreu, M.; Staudhammer, C.L. Urban forest response to Hurricane Irma: The role of landscape characteristics and sociodemographic context. Urban For. Urban Green. 2021, 61, 127093. [Google Scholar] [CrossRef]
- Staudhammer, C.L.; Escobedo, F.; Luley, C.; Bond, J. Patterns of urban forest debris from the 2004 and 2005 hurricane seasons in Florida. South J. Appl. For. 2009, 33, 193–196. [Google Scholar] [CrossRef] [Green Version]
- Takle, E.S. Windbreaks and shelterbelts. In Encyclopedia of Soils in the Environment; Hillel, D., Hatfield, J.L., Eds.; Elsevier: Amsterdam, The Netherlands, 2005; pp. 340–345. [Google Scholar]
- Conway, T. Local environmental impacts of alternative forms of residential development. Environ. Plan. B 2009, 36, 927–943. [Google Scholar] [CrossRef]
- Troy, A.R.; Grove, J.M.; O’Neil-Dunne, J.P.M.; Pickett, S.T.A.; Cadenasso, M.L. Predicting opportunities for greening and patterns of vegetation on private urban lands. J. Environ. Manag. 2007, 40, 394–412. [Google Scholar] [CrossRef] [PubMed]
- Landry, S.M.; Chakraborty, J. Street trees and equity: Evaluating the spatial distribution of an urban amenity. Environ. Plan. A 2009, 41, 2651–2670. [Google Scholar] [CrossRef]
- Escobedo, F.J.; Nowak, D.J.; Wagner, J.E.; Luz De la Maza, C.; Rodriguez, M.; Crane, D.E.; Hernandez, J. The socioeconomics and management of Santiago de Chile’s public urban forests. Urban For. Urban Green. 2006, 4, 105–114. [Google Scholar] [CrossRef]
- Landry, S.M. Connecting Pixels to People: Management Agents and Social-Ecological Determinants of Changes to Street Tree Distributions. Ph.D. Thesis, University of South Florida, Tampa, FL, USA, 2013. Available online: http://scholarcommons.usf.edu/etd/4715 (accessed on 25 April 2022).
- Duryea, M.L.; Blakeslee, G.M.; Hubbard, W.G.; Vasquez, R.A. Wind and trees: A survey of homeowners after Hurricane Andrew. J. Arboric. 1996, 22, 44–50. [Google Scholar] [CrossRef]
- Pokorny, J.D. Urban Tree Risk Management, a Community Guide to Program Design and Implementation; USDA Forest Service Northeastern Area State and Private Forestry: St. Paul, MN, USA, 2003; p. 194. [Google Scholar]
- Dunster, J.A.; Smiley, E.T.; Matheny, N.; Lilly, S. Tree Risk Assessment Manual, 2nd ed.; International Society of Arboriculture: Champaign, IL, USA, 2017. [Google Scholar]
- Smiley, E.T.; Matheny, N.; Lilly, S. Best Management Practices: Tree Risk Assessment, 2nd ed.; International Society of Arboriculture: Champaign, IL, USA, 2017; p. 86. [Google Scholar]
- Norris, M.B.; Moore, G.M. How tree risk assessment methods work: Sensitivity analyses of sixteen methods reveal the value of quantification and the impact of inputs on risk ratings. Arboric. Urban For. 2020, 46, 402–431. [Google Scholar] [CrossRef]
- Intergovernmental Panel on Climate Change (IPCC). Climate Change 2021: The Physical Science Basis. Sixth Assessment Report. 2021. Available online: https://www.ipcc.ch/report/ar6/wg1/downloads/report/IPCC_AR6_WGI_Full_Report.pdf (accessed on 10 August 2021).
- U.S. Global Change Research Program (USGCRP). Impacts, Risks, and Adaptation in the United States: Fourth National Climate Assessment; Reidmiller, D.R., Avery, C.W., Easterling, D.R., Kunkel, K.E., Lewis, K.L.M., Maycock, T.K., Stewart, B.C., Eds.; U.S. Global Change Research Program: Washington, DC, USA, 2018; Volume II, p. 1515. [CrossRef]
- Landry, S.; Koeser, A.; Northrop, R.; McLean, D.; Donovan, G.; Andreu, M.; Hilbert, D. City of Tampa Tree Canopy and Urban Forest Analysis 2016; University of Florida: Tampa, FL, USA, 2018. [Google Scholar]
- National Hurricane Center. Saffir-Simpson Hurricane Wind Scale. Available online: https://www.nhc.noaa.gov/aboutsshws.php (accessed on 25 April 2022).
- Joly, M.; Bertrand, P.; Gbangou, R.Y.; White, M.C.; Dubé, J.; Lavoie, C. Paving the way for invasive species: Road type and the spread of common ragweed (Ambrosia artemisiifolia). Environ. Manag. 2011, 48, 514–522. [Google Scholar] [CrossRef]
- R Core Team. R: A Language and Environment for Statistical Computing; R Foundation for Statistical Computing: Vienna, Austria, 2021; Available online: https://www.R-project.org/ (accessed on 31 October 2021).
- Bivand, R.S.; Pebesma, E.; Gomez-Rubio, V. Applied Spatial Data Analysis with R, 2nd ed.; Springer: New York, NY, USA, 2013; p. 405. [Google Scholar]
- Rousset, F.; Ferdy, J.-B. Testing environmental and genetic effects in the presence of spatial autocorrelation. Ecography 2014, 37, 781–790. [Google Scholar] [CrossRef]
- Fletcher, R.; Fortin, M.-J. Spatial Ecology and Conservation Modeling: Applications with R; Springer International Publishing: Cham, Switzerland, 2018; p. 523. [Google Scholar]
- Cox, L.A. What’s wrong with risk matrixes? Risk Anal. 2008, 28, 497–512. [Google Scholar]
- Brazee, N.J.; Marra, R.E.; Göcke, L.; Van Wassenaer, P. Non-destructive assessment of internal decay in three hardwood species of northeastern North America using sonic and electrical impedance tomography. Forestry 2011, 84, 33–39. [Google Scholar] [CrossRef] [Green Version]
- Elliott, M.L.; Broschat, T.K.; Göcke, L. Preliminary evaluation of electrical resistance tomography for imaging palm trunks. Arboric. Urban For. 2016, 42, 111–119. [Google Scholar] [CrossRef]
- Burcham, D.C.; Brazee, N.J.; Marra, R.E.; Kane, B. Can sonic tomography predict loss in load-bearing capacity for trees with internal defects? A comparison of sonic tomograms with destructive measurements. Trees 2019, 33, 681–695. [Google Scholar] [CrossRef]
- Soge, A.O.; Popoola, O.I.; Adetoyinbo, A.A. Detection of wood decay and cavities in living trees: A review. Can. J. For. Res. 2021, 51, 937–947. [Google Scholar] [CrossRef]
- Kane, B.; Finn, J.T. Factors affecting branch failures in open-grown trees during a snowstorm in Massachusetts, USA. SpringerPlus 2014, 3, 720. [Google Scholar] [CrossRef] [Green Version]
- Gilman, E.F. Branch-to-stem diameter ratio affects strength of attachment. J. Arboric. 2003, 29, 291–294. [Google Scholar] [CrossRef]
- Kane, B. Branch strength of Bradford pear (Pyrus calleryana var. ‘Bradford’). Arboric. Urban For. 2007, 33, 283. [Google Scholar] [CrossRef]
- Kane, B.; Clouston, P. Tree pulling tests of large shade trees in the genus Acer. Arboric. Urban For. 2008, 34, 101–109. [Google Scholar] [CrossRef]
- Kane, B.; Farrell, R.; Zedaker, S.M.; Loferski, J.R.; Smith, D.W. Failure mode and prediction of the strength of branch attachments. Arboric. Urban For. 2008, 34, 308–316. [Google Scholar] [CrossRef]
- Hickman, G.W.; Perry, E.; Evans, R. Validation of a tree failure evaluation system. J. Arboric. 1995, 21, 233–234. [Google Scholar] [CrossRef]
- Li, W.; Wang, F.; Bell, S. Simulating the sheltering effects of windbreaks in urban outdoor open space. J. Wind. Eng. Ind. Aerodyn. 2007, 95, 533–549. [Google Scholar] [CrossRef]
Publisher’s Note: MDPI stays neutral with regard to jurisdictional claims in published maps and institutional affiliations. |
© 2022 by the authors. Licensee MDPI, Basel, Switzerland. This article is an open access article distributed under the terms and conditions of the Creative Commons Attribution (CC BY) license (https://creativecommons.org/licenses/by/4.0/).