Abstract
The remaining historical forests are crucial for maintaining biodiversity in urban areas. However, the integrity and stability of historical forests are affected by land-use/cover change. A better understanding of these impacts can help prioritize protection and restoration. In this study, we estimated the loss of area and levels of threats and analyzed the importance of critical areas for historical forests in the built-up area of a rapidly urbanizing city—Guiyang, China. We used the threat indicator, morphological spatial pattern analysis, and probability of connectivity based on InVEST, GuidosToolbox, and Conefor software. The results based on remote sensing image classification showed that 1988.46 ha of historical forestlands was transformed into other land-use/cover types. The mean value of the threat index of all the historical forest patches increased by 33% compared to the baseline year. The area of cores and bridges, considered as key nodes and links for the connectivity of forest networks, decreased by 193.32 and 353.61 ha, respectively. Most of the critical areas with high importance values for connectivity were located in the central part of the city and were severely threatened by the surrounding areas. We recommend that effective measures be implemented to control the further loss of historical forests and to increase the connectivity and buffering capacity of the remaining forests by creating tree belts and corridors in key locations.
1. Introduction
Rapid urbanization causes the extensive transformation of land use in a city, which leads to a massive loss and fragmentation of original intact forests [1,2,3]. Historical forests are urban forests that have remained during the urbanization process and have never been transformed into other land-use/cover types [3]. They are naturally originated and different from recently established urban forests. They mainly consist of native species and are biodiversity hotspot regions in a city. Although the historical forests currently retained in urban areas are fragmented and degraded, they can still provide valuable ecosystem services to urban residents and can support high biodiversity [4,5,6]. These forests have a more complex stand structure and support more resilient and stable biological communities than newly planted forests [7]. Despite their benefits and importance, the dispersal, reproduction, and survival of plants in the remaining historical forests are impeded by the surrounding unsuitable environments due to the poor connectivity of urban forest ecosystems [8,9,10].
The remaining historical forests in a city are severely affected by urban expansion. Several studies have reported that the area of historical forests greatly decreases due to land-use change during urbanization. For example, the historical forest area remaining within the greater Chicago region in 2010 was reduced by 40% relative to that in 1939, and the core areas in 2010 were only one-third of those in 1939 [7]. There was a 15% decrease in the remnant forest cover from 1990 to 2015 in urban areas in Eastern Ghats, India [11]. Human activity (e.g., trampling, cutting, and tree injuring) reduces plant diversity and canopy density and has even led to the local extinction of some plant species in historical forests [12]. Ranta et al. [13] indicated that the edge effect of urban forest remnants facilitated new species, while some original forest species gradually disappeared, according to a survey conducted in 1980 and 2000 in Tampere, Finland. Yang et al. [14] found an increase in small stems in remnant forest from the outskirts to the inner city in Chongqing, China.
Current studies on the impacts of urbanization on historical forests have mainly focused on landscape metrics of the remnant patch itself or the surrounding matrix, which can be evaluated by patch-based computation software (e.g., Fragstats software) at the patch, class, and landscape levels. Many studies have found that the size of remnant patches has a significant impact on the plant diversity of historical forests [1,2,15]. Patch size can influence the size of habitats that remnants can provide for the survival of individuals and the buffering capacity of remnants when affected by surrounding environments [16,17,18]. The shape of the patch is also an important predictor of the biodiversity of the remaining patches because complex geometric shapes may facilitate the communication of organisms between the patch and the surrounding matrix [19,20]. Moreover, the percentage of surrounding impervious surfaces was negatively correlated with the plant diversity of the remnant due to their resistance to the flow of organisms between remnants [21,22,23]. In addition, compositional and configurational metrics of the surrounding matrix calculated by Fragstats software were associated with the productivity of urban natural remnants, and the productivity was mediated by buffer size and time [24].
While existing studies have provided useful knowledge about the effect of urbanization on historical forests, some issues are worth addressing to improve our understanding. First, existing studies have mainly concentrated on the impact of landscape patterns based on the current situation of urban land use [9,15,25]. Although there have been some studies investigating the temporal dynamics of landscape connectivity at regional scale [26], few studies have considered the association between temporal changes in urban land use and the formation process of historical forest patches in a city [27]. Understanding the historical information of remaining forests during the process of urbanization in a city is beneficial for the development of more effective conservation activities based on historical trends and patterns [28]. Second, most studies have quantified the direct effect of urban land-use change (area loss, habitat fragmentation) but have not estimated the potential risks to historical forests threatened by these changes [11,29]. The remaining forests surrounded by urban matrices also have different levels of degradation risk, even without the further loss of area [30]. Threat levels can be used to quantify the levels of degradation risk, which are measurements of potential risk posed by surrounding areas, such as pollution, heat island, and biological invasion [31]. Furthermore, most previous studies used landscape metrics, which measure only the structural connectivity of habitats but seldom consider both structural and functional connectivity [32,33]. The degrees of importance for individual forest patches to the overall connectivity of the historical forest ecosystem in a city were also unclear in these studies. This lack of information is unfavorable for determining priority protection targets and developing effective conservation measures.
In this study, we aimed to explore the impact of temporal changes in land use during urbanization on historical forests. We used the built-up area of a rapidly urbanizing mountainous city in the subtropical climate zone—Guiyang, China—as our study site. The historical forests in Guiyang city are degraded natural forests, caused by human interference, including direct (i.e., cutting, trampling) and indirect (i.e., pollution, heat island) impact. However, they still have some characteristics of subtropical vegetation. The specific objectives of this study were as follows: (1) to evaluate how the variation in loss and threat levels of historical forests is mediated by temporal changes in urban land use/cover; (2) to determine the importance of critical areas of historical forests combined with the measurement of both structural and functional connectivity; (3) to discuss the implications of the findings for managing historical forests in rapidly urbanized areas in the case of Guiyang.
2. Materials and Methods
2.1. Study Area
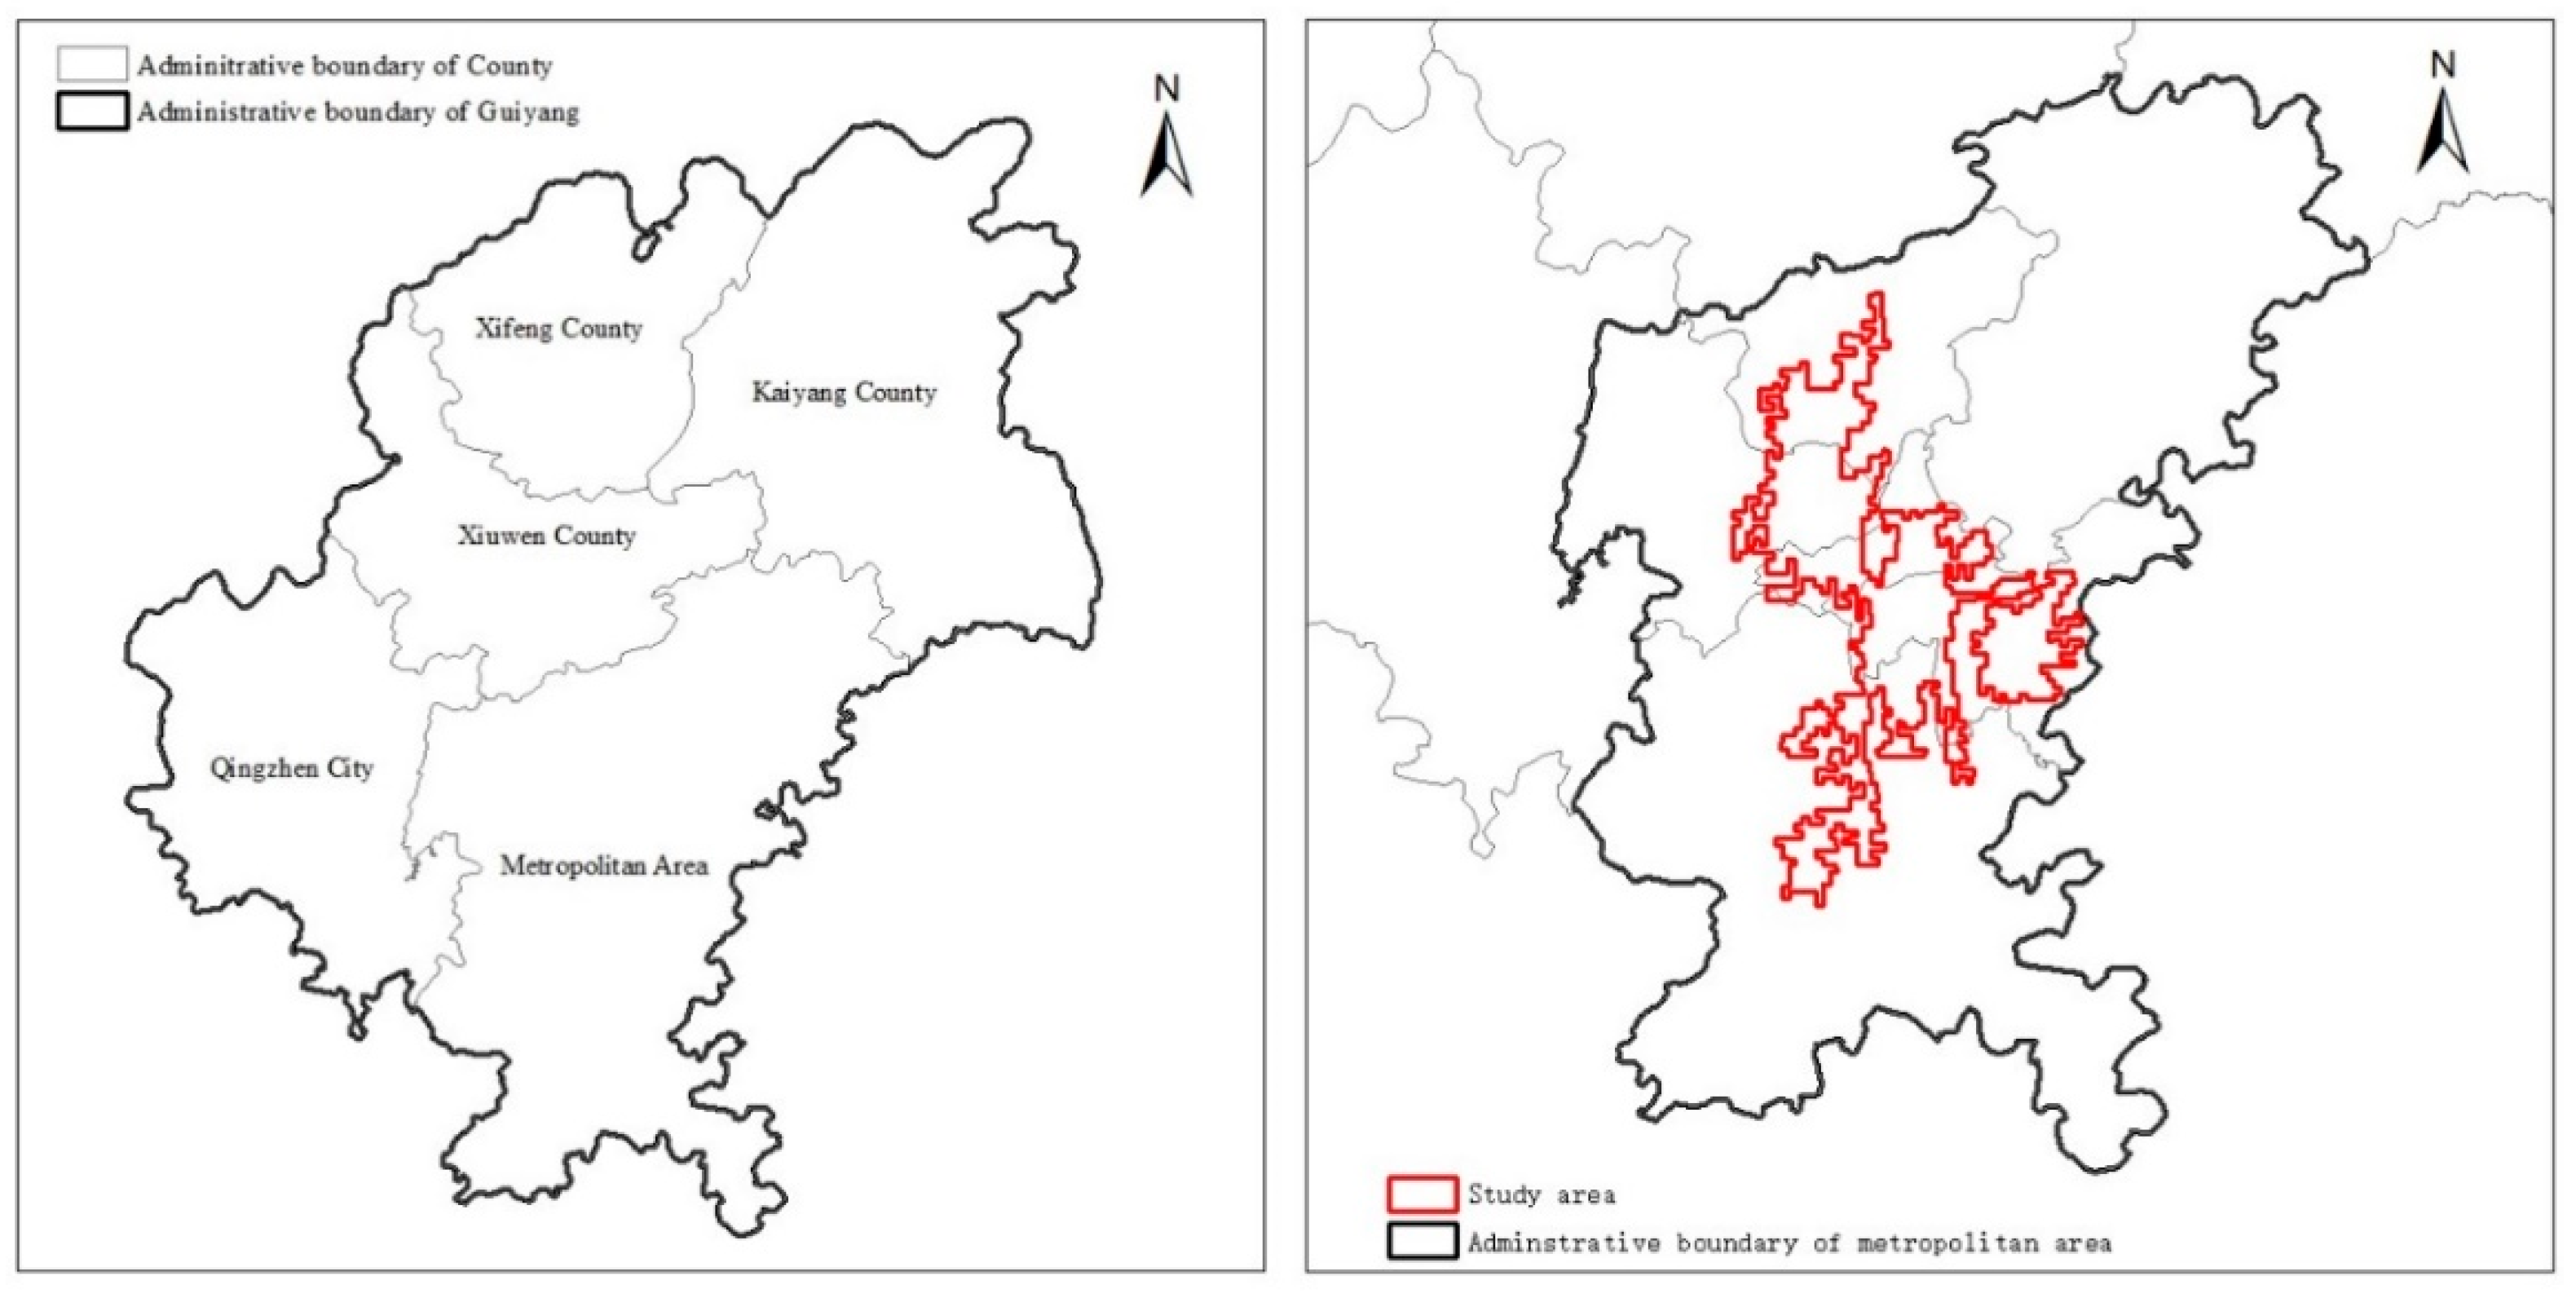
The city of Guiyang is famous in China for its karst landform and mountainous landscape. As the capital city of Guizhou Province, Guiyang is located in the central part of Guizhou, 106°30′ to 106°59′ E and 26°10′ to 26°49′ N. The forested mountain landscapes of Guiyang have been damaged by rapid urban expansion since 1996. The population has increased from 1.35 million in 1996 to 3.59 million in 2018. However, due to the city’s steep topography, many remaining and fragmented historical forest patches are scattered throughout the metropolitan area. This study was conducted in the built-up area of Guiyang, covering approximately 360 km2, including six districts (Figure 1).
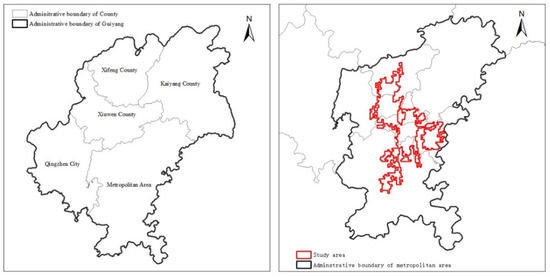
Figure 1.
Study area.
2.2. Methods
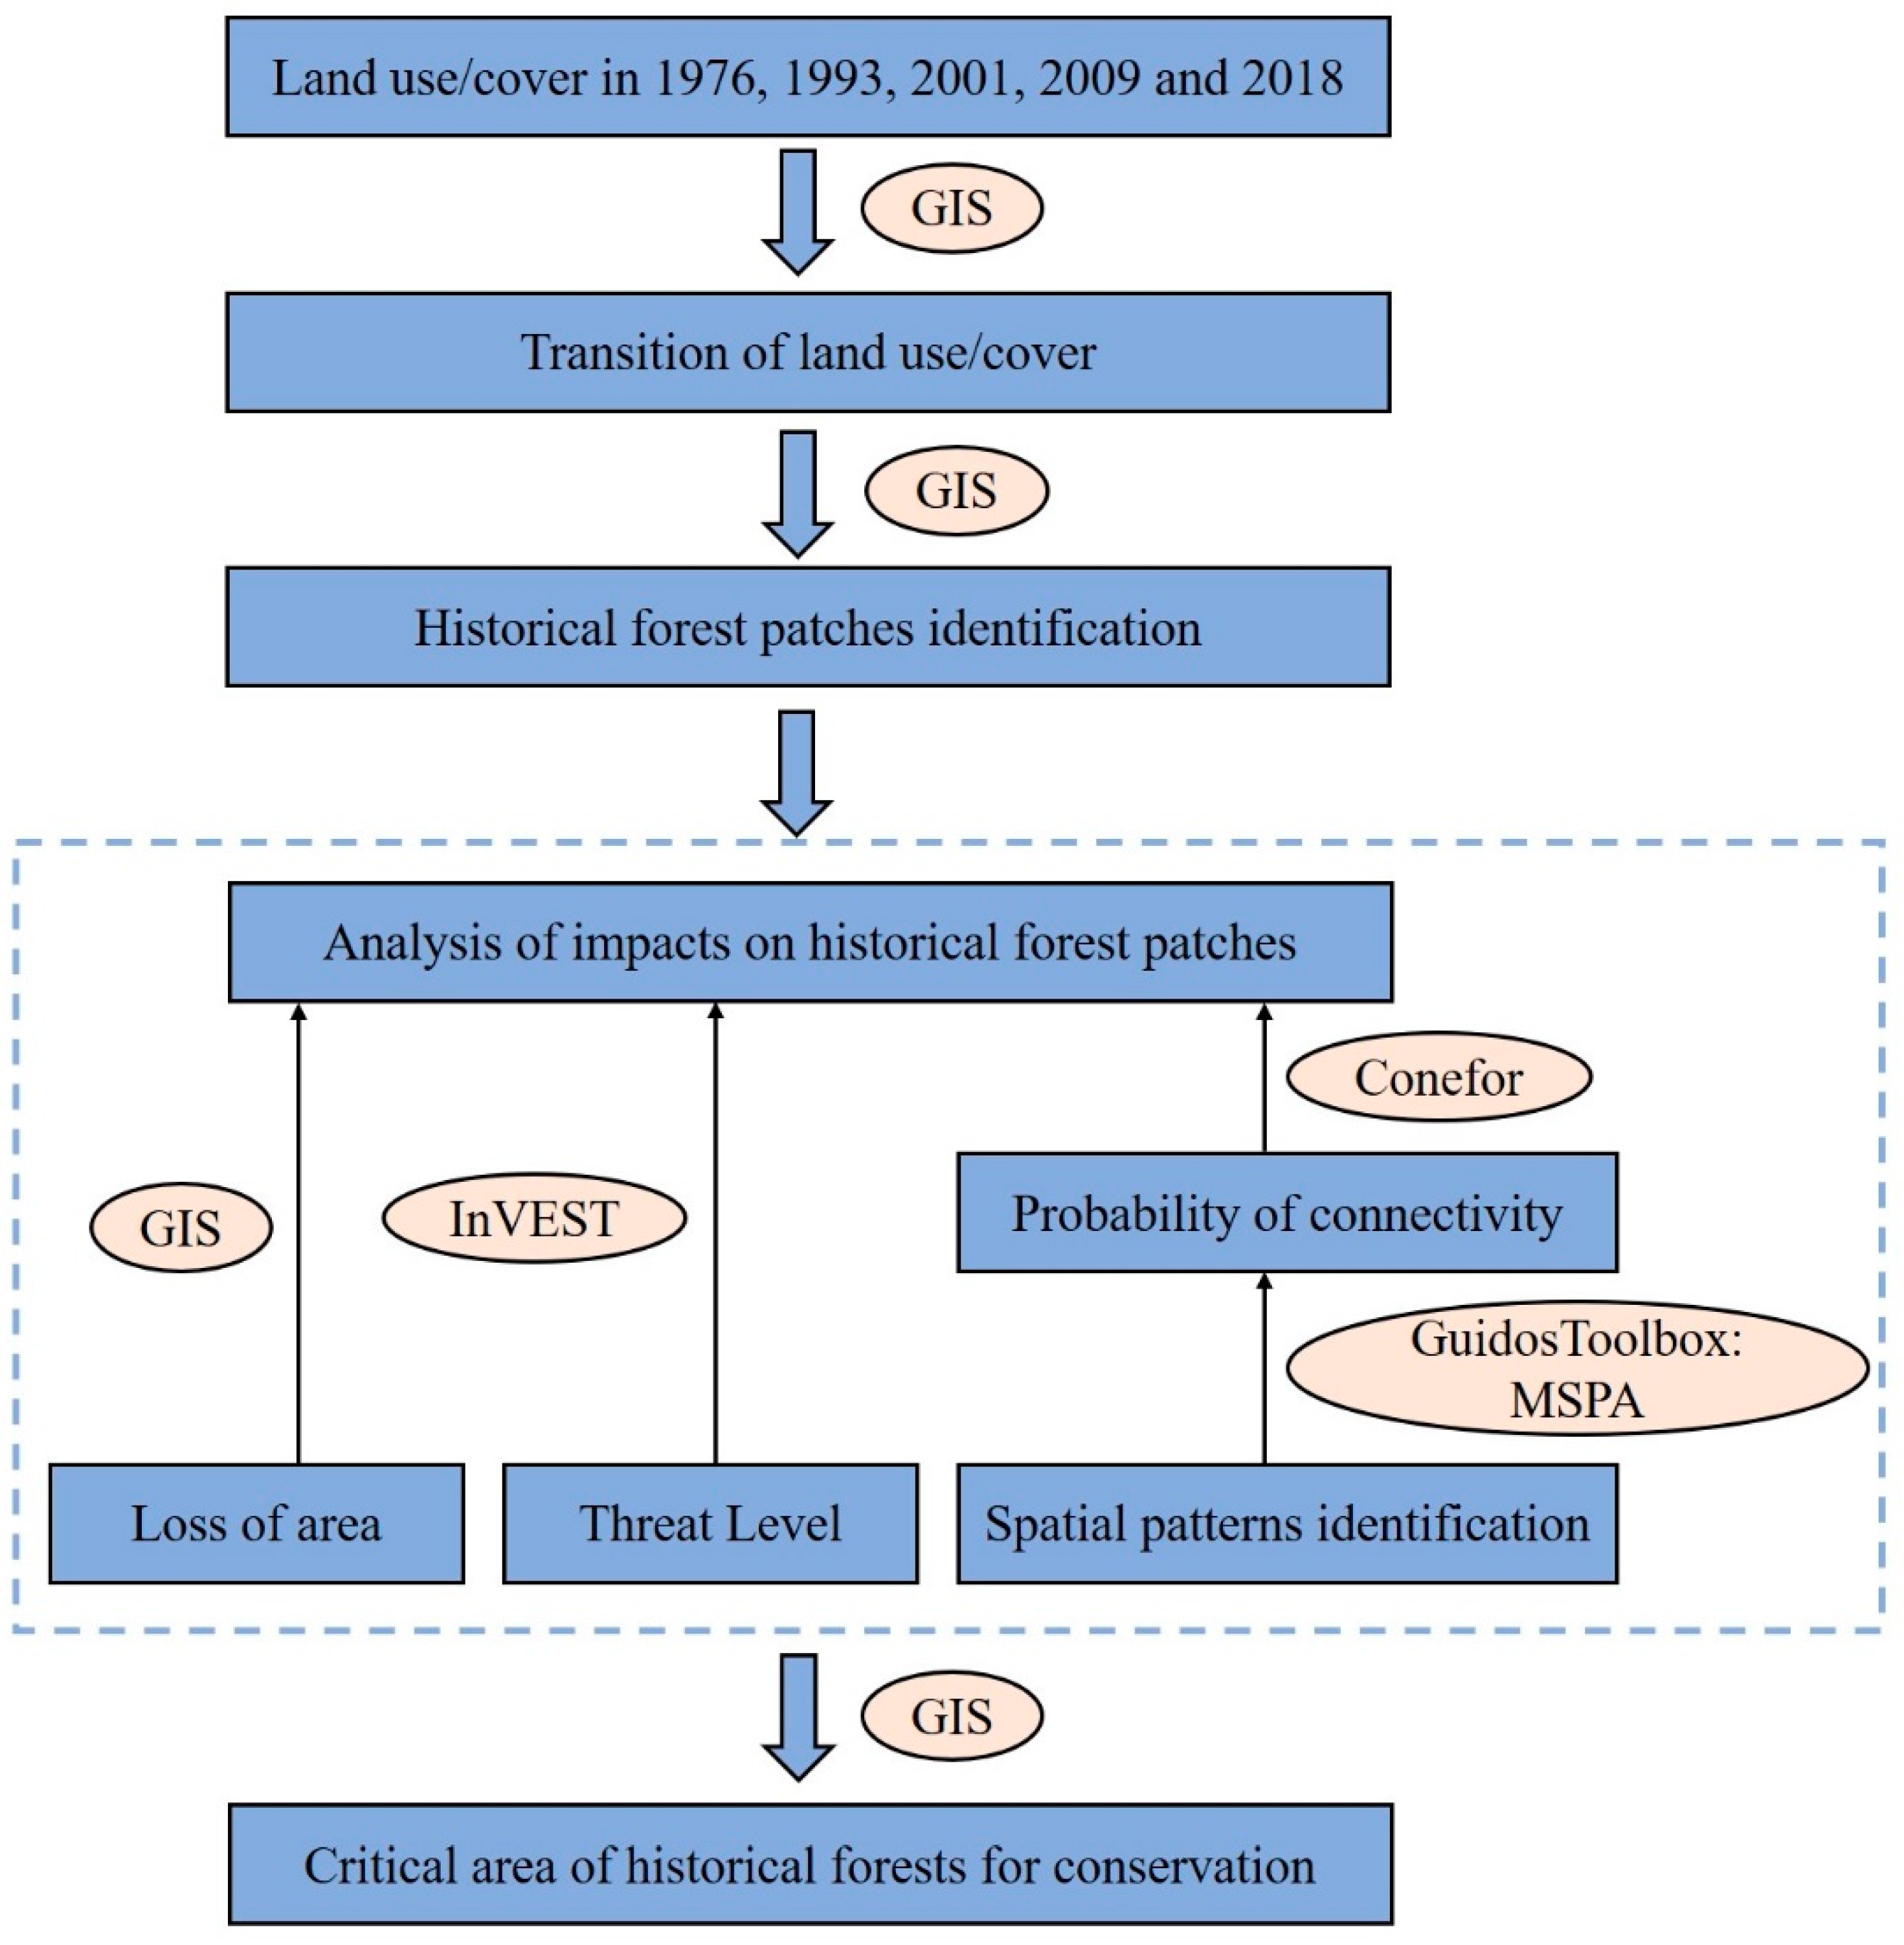
The methods this study used can be summarized as follows: (1) analysis of the transition of land use/cover; (2) identification of historical forest patches; (3) analysis of impact of land-use/cover change on historical forests; (4) determination of the critical areas for conservation (Figure 2).

Figure 2.
Workflow of the methods.
2.2.1. Identification of Historical Forest Patches
We used the land-use/cover maps for 1976, 1993, 2001, 2009, and 2018, which were obtained from the Data Center for Resource and Environmental Science, Chinese Academy of Sciences (http://www.resdc.cn, accessed on 21 January 2021). The land-cover data contain forestlands, grasslands, water bodies, urban lands (infrastructure and residential land, industrial land), and farmlands (irrigated cropland and rainfed cropland) [34]. The classification accuracy of each land-use/cover type was above 80%, and the kappa coefficient was above 0.8 [34]. The gridded land-cover data have a resolution of 30 m and an Albers Conic Equal Area projection. We referred the forest resources inventory data collected by Guiyang Ecological Environment Bureau, which classified the origin of forest stands into “natural”, “planted”, and “aerial seeding”. We identified the original forestlands in 1976 with natural origin and those remaining in 1993, 2001, 2009, and 2018 that were not transformed into other land-use/cover types; these sites were defined as historical forests. The forestlands in 2018 that were not present in 1976 were regarded as new forests, including newly planted forests and forests that spontaneously grew in abandoned areas.
There are three types of forests in the study area—coniferous, broadleaf, and mixed forests. The main canopy species in the coniferous forest stands is Pinus massoniana. The dominant trees in the broadleaf forests mainly consist of species from the Fagaceae and Lauraceae families. P. massoniana and species from the Quercus and Carpinus genera are the main dominant overstory tree species in the mixed forests. The average canopy density of these forests is nearly 55% and the age of most forest stands is above 40 years. More details about these forests can be found in the Supplementary Materials.
To evaluate the loss of original forestlands, we extracted the original forestlands that existed in 1976 and did not remain in 2018 using ArcGIS (version 10.2.2). Then, we estimated the area of these forestlands that was transformed into other land-use/cover types during four periods: 1976–1993, 1993–2001, 2001–2009, and 2009–2018. We also calculated the number and area of the original forest patches that were completely transformed during the four periods.
2.2.2. Assessment of Threat Levels
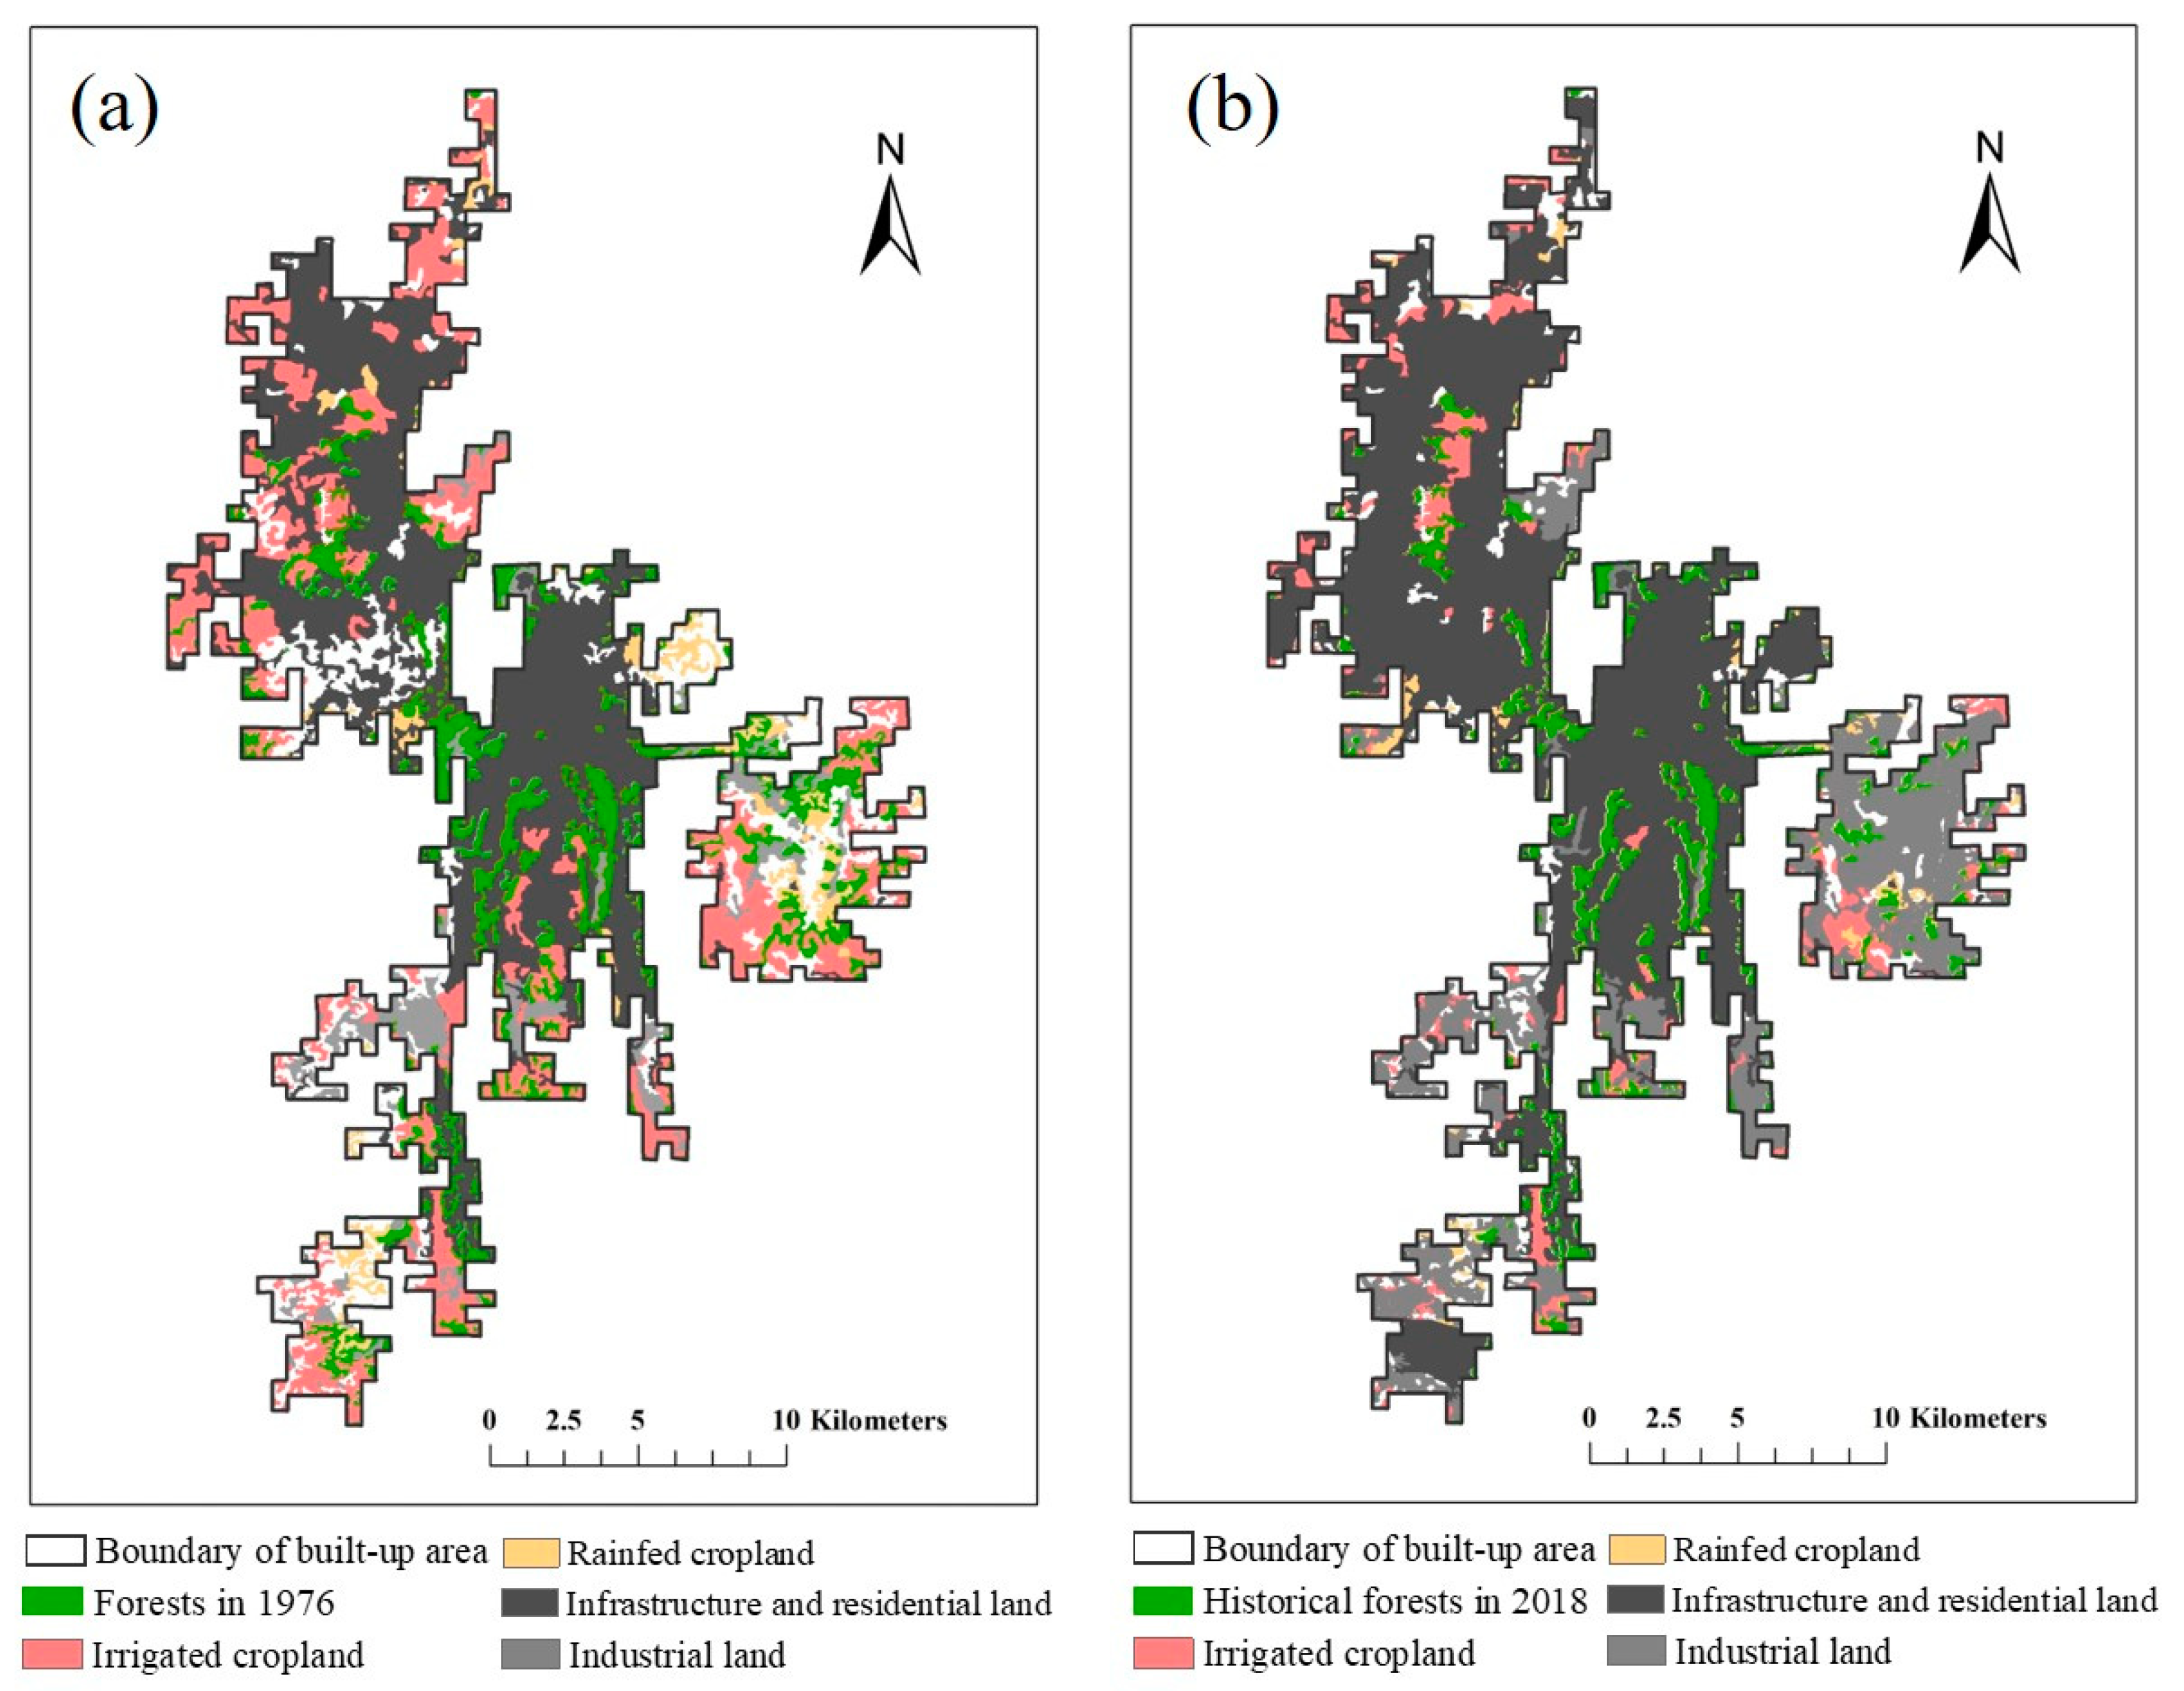
We estimated the levels of threat posed by the surrounding matrix to historical forestlands using the Habitat Quality Model of InVEST (version 3.3.3). Infrastructure and residential land, industrial land, irrigated cropland, and rainfed cropland were regarded as threat sources (Figure 3).
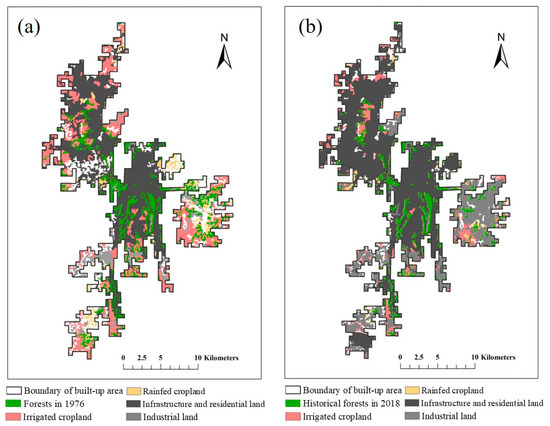
Figure 3.
Location of threat sources in (a) 1976 and (b) 2018.
The threat indicator () was calculated using the approach developed by Sharp et al. [35], which is expressed in Equation (1).
where r is the threat source—infrastructure and residential land, industrial land, irrigated cropland and rainfed cropland, R is the total number of all threat sources, y is a grid in the raster map of threat source r, is the total number of grids in the raster map of threat source r, and is the weight of the threat level of threat source r to the historical forest, which is the relative destructiveness of different anthropogenic threats to historical forests. The values of range from 0 to 1, where 1 indicates a high risk of impairing the habitat quality of historical forests. Moreover, is used to identify whether grid y is from threat source r, is the relative sensitivity of historical forests to threat source r, x is a grid of historical forest, and is the impact of grid y from threat source r on a grid of historical forest x, which is expressed inas Equation (2).
where is the distance between threat grid y and historical forest grid x. is the maximum effective distance of threat source r’s reach across space. The values used in Equations (1) and (2) refer to previous studies [36,37,38,39,40,41,42], and the medians of values are reported in Table 1.

Table 1.
Parameters of different threat sources.
2.2.3. Morphological Spatial Pattern Analysis
According to the land-use/cover data for 2018, we identified different spatial elements of historical forests using morphological spatial pattern analysis (MSPA) [43]. The MSPA was implemented by the GuidosToolbox available at http://forest.jrc.ec.europa.eu/ (accessed on 19 February 2021). The foundation of GuidosToolbox is mathematical morphology, and MSPA detects the morphometric feature classes of image objects as a function of their shape, connectivity, and spatial configuration [44]. The spatial patterns of historical forests were divided into seven classes at the pixel level by MSPA (Figure 4): core, bridge, edge, branch, islet, loop, and perforation [45]. Core is the interior area excluding internal and external perimeters. Bridge is the link connected at more than one end to different cores. Loop is the link connected at more than one end to the same core. Perforation and edge are the internal and external perimeter, respectively. Branch is the link connected at one end to bridge, edge, perforation, or loop. Islet is the disjointed and small patches, not connected with cores. The edge width was set to a value of 120 m (four pixels) because many studies recommended 100–200 m as the edge width to support edge-intolerant species [46,47,48].
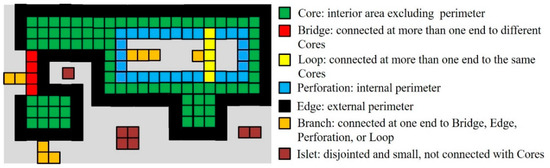
Figure 4.
Seven classes of morphological spatial patterns.
2.2.4. Measurement of Probability of Connectivity
To measure the connectivity of historical forests and identify the important core areas and bridges in the landscape, the probability of connectivity (PC) index and the importance values of the patches (dPC) were calculated with Conefor software [49]. PC measures individual patch importance while dPC evaluates the contribution of each patch to the overall landscape connectivity based on habitat availability and interpatch dispersal probability [50]. These connectivity indices can reflect habitat loss and landscape fragmentation well and are widely used in connectivity analysis [51,52,53]. They are beneficial for planning decision making [50]. In this study, the dPC values of cores and bridges were evaluated for the connectivity of historical forests in the built-up area, because they are important for maintaining connectivity as nodes and links, respectively, in landscape graph theory [54]. The analysis also included some relatively large islets because of their role as steppingstones in improving connectivity. The threshold of islets was set as 3 ha according to Gao et al. (2019) [55]. The PC and dPC values were calculated using the following equations:
where and are the areas of patch i and patch j, respectively, and is the maximum product probability of all paths between patches i and j. The threshold of distance for the connection between patches was set to 500 m, because many previous studies concluded that a 500 m distance can ensure the migration of urban animals between patches, including birds, small mammals, and insect pollinators [55,56,57]. If the distance between patch i and j is smaller than the distance threshold, is simply equal to the distance between patches i and j. If patch i and j are more distant, the maximum probability path comprises several steps through intermediate steppingstone nodes [49]. is the PC value after removing the patch.
3. Results
3.1. Transformation into Other Land-Use/Cover Types
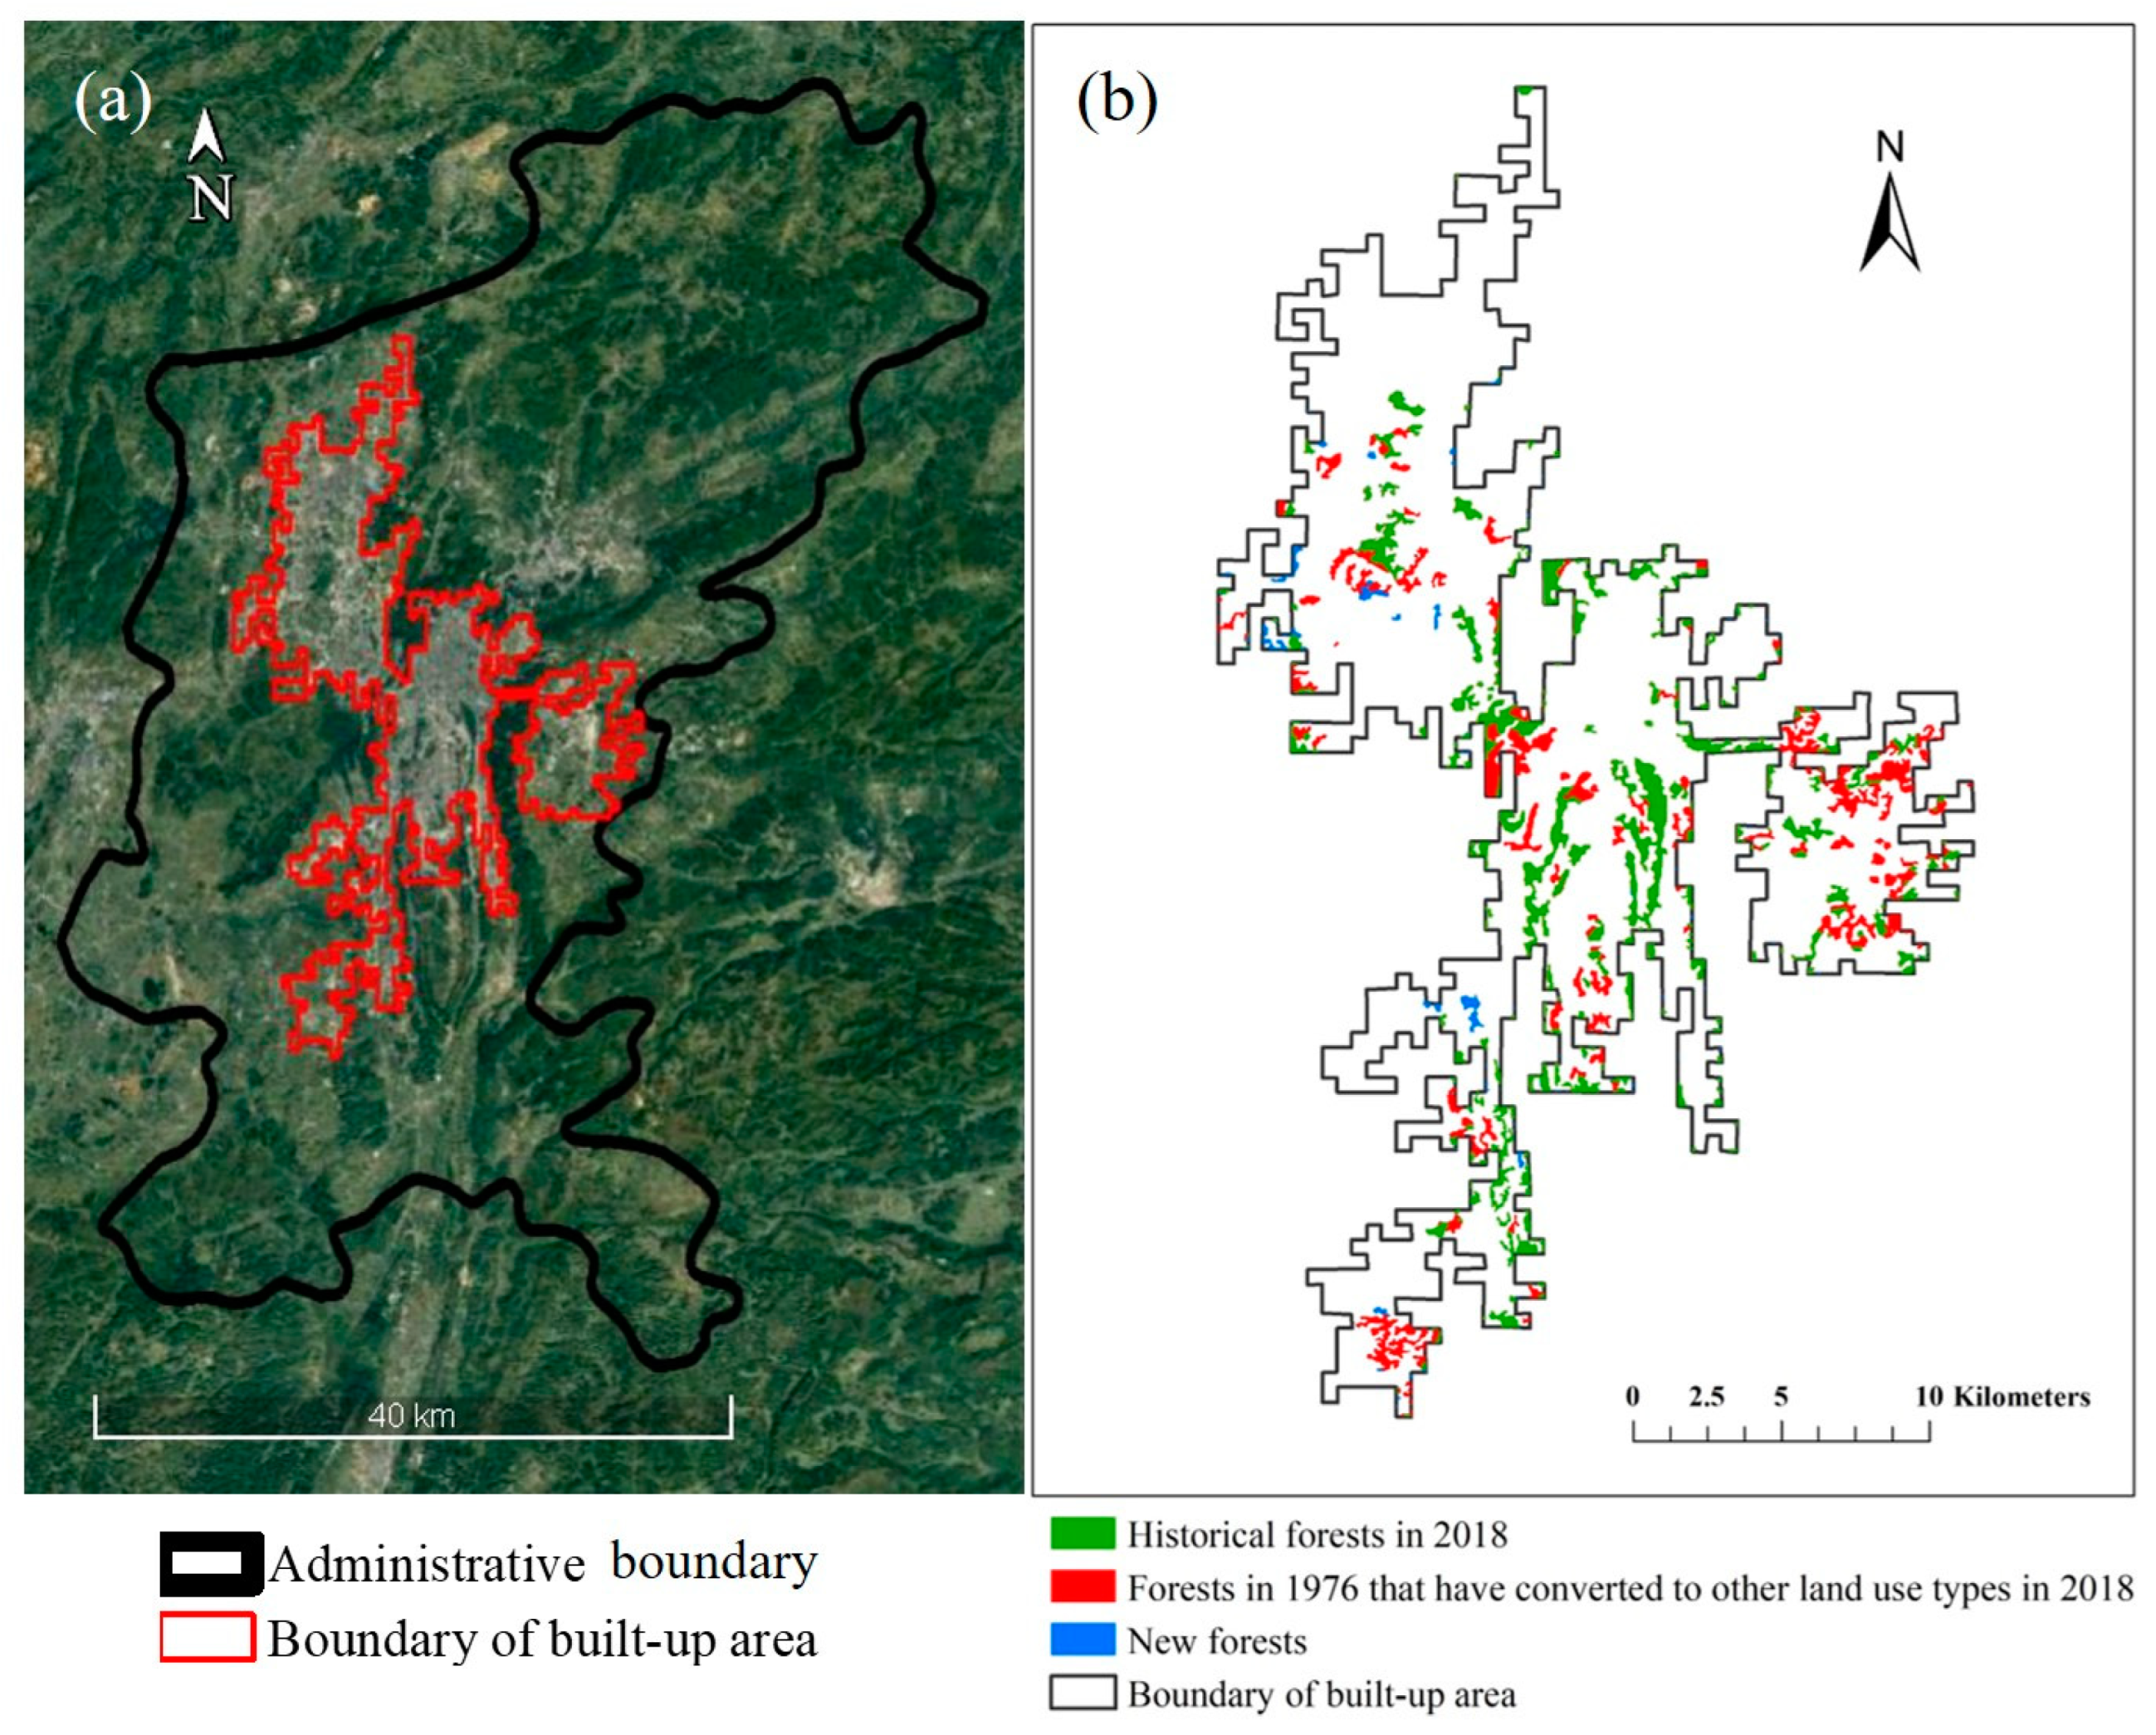
The transition matrix of the area between each land-use/cover type in the built-up area of Guiyang from 1978 to 2018 is shown in Table 2. Other transition matrices of four investigated periods can be found in the Supplementary Materials. The area of historical forests decreased from 4920.21 ha in 1976 to 2958.66 ha in 2018. The most severe loss of forests occurred in the eastern and southwestern regions of the built-up area (Figure 5). The forest patches located in the middle region were preserved and are still relatively intact.
Table 2.
Transition matrix of land use/cover from 1978 to 2018 in the built-up area of Guiyang (ha).
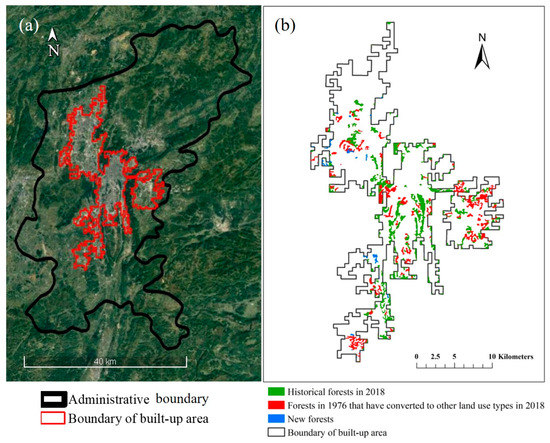
Figure 5.
The locations of historical forests. (a) The administrative boundary (black line) and boundary of the built-up area (red line); (b) locations of historical forests that were retained, those that were transformed, and new forests.
The number of historical forest patches increased to 256 from 222 during the 1976–2018 period. In particular, the increase in small patches (<10 ha) was approximately 51%, while the decreases in middle patches (10–50 ha) and large patches (>50 ha) were 21% and 53%, respectively, from 1976 to 2018 (Figure 6).
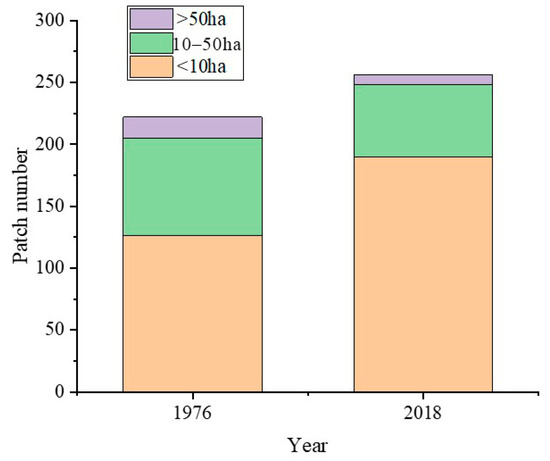
Figure 6.
The number of historical forest patches.
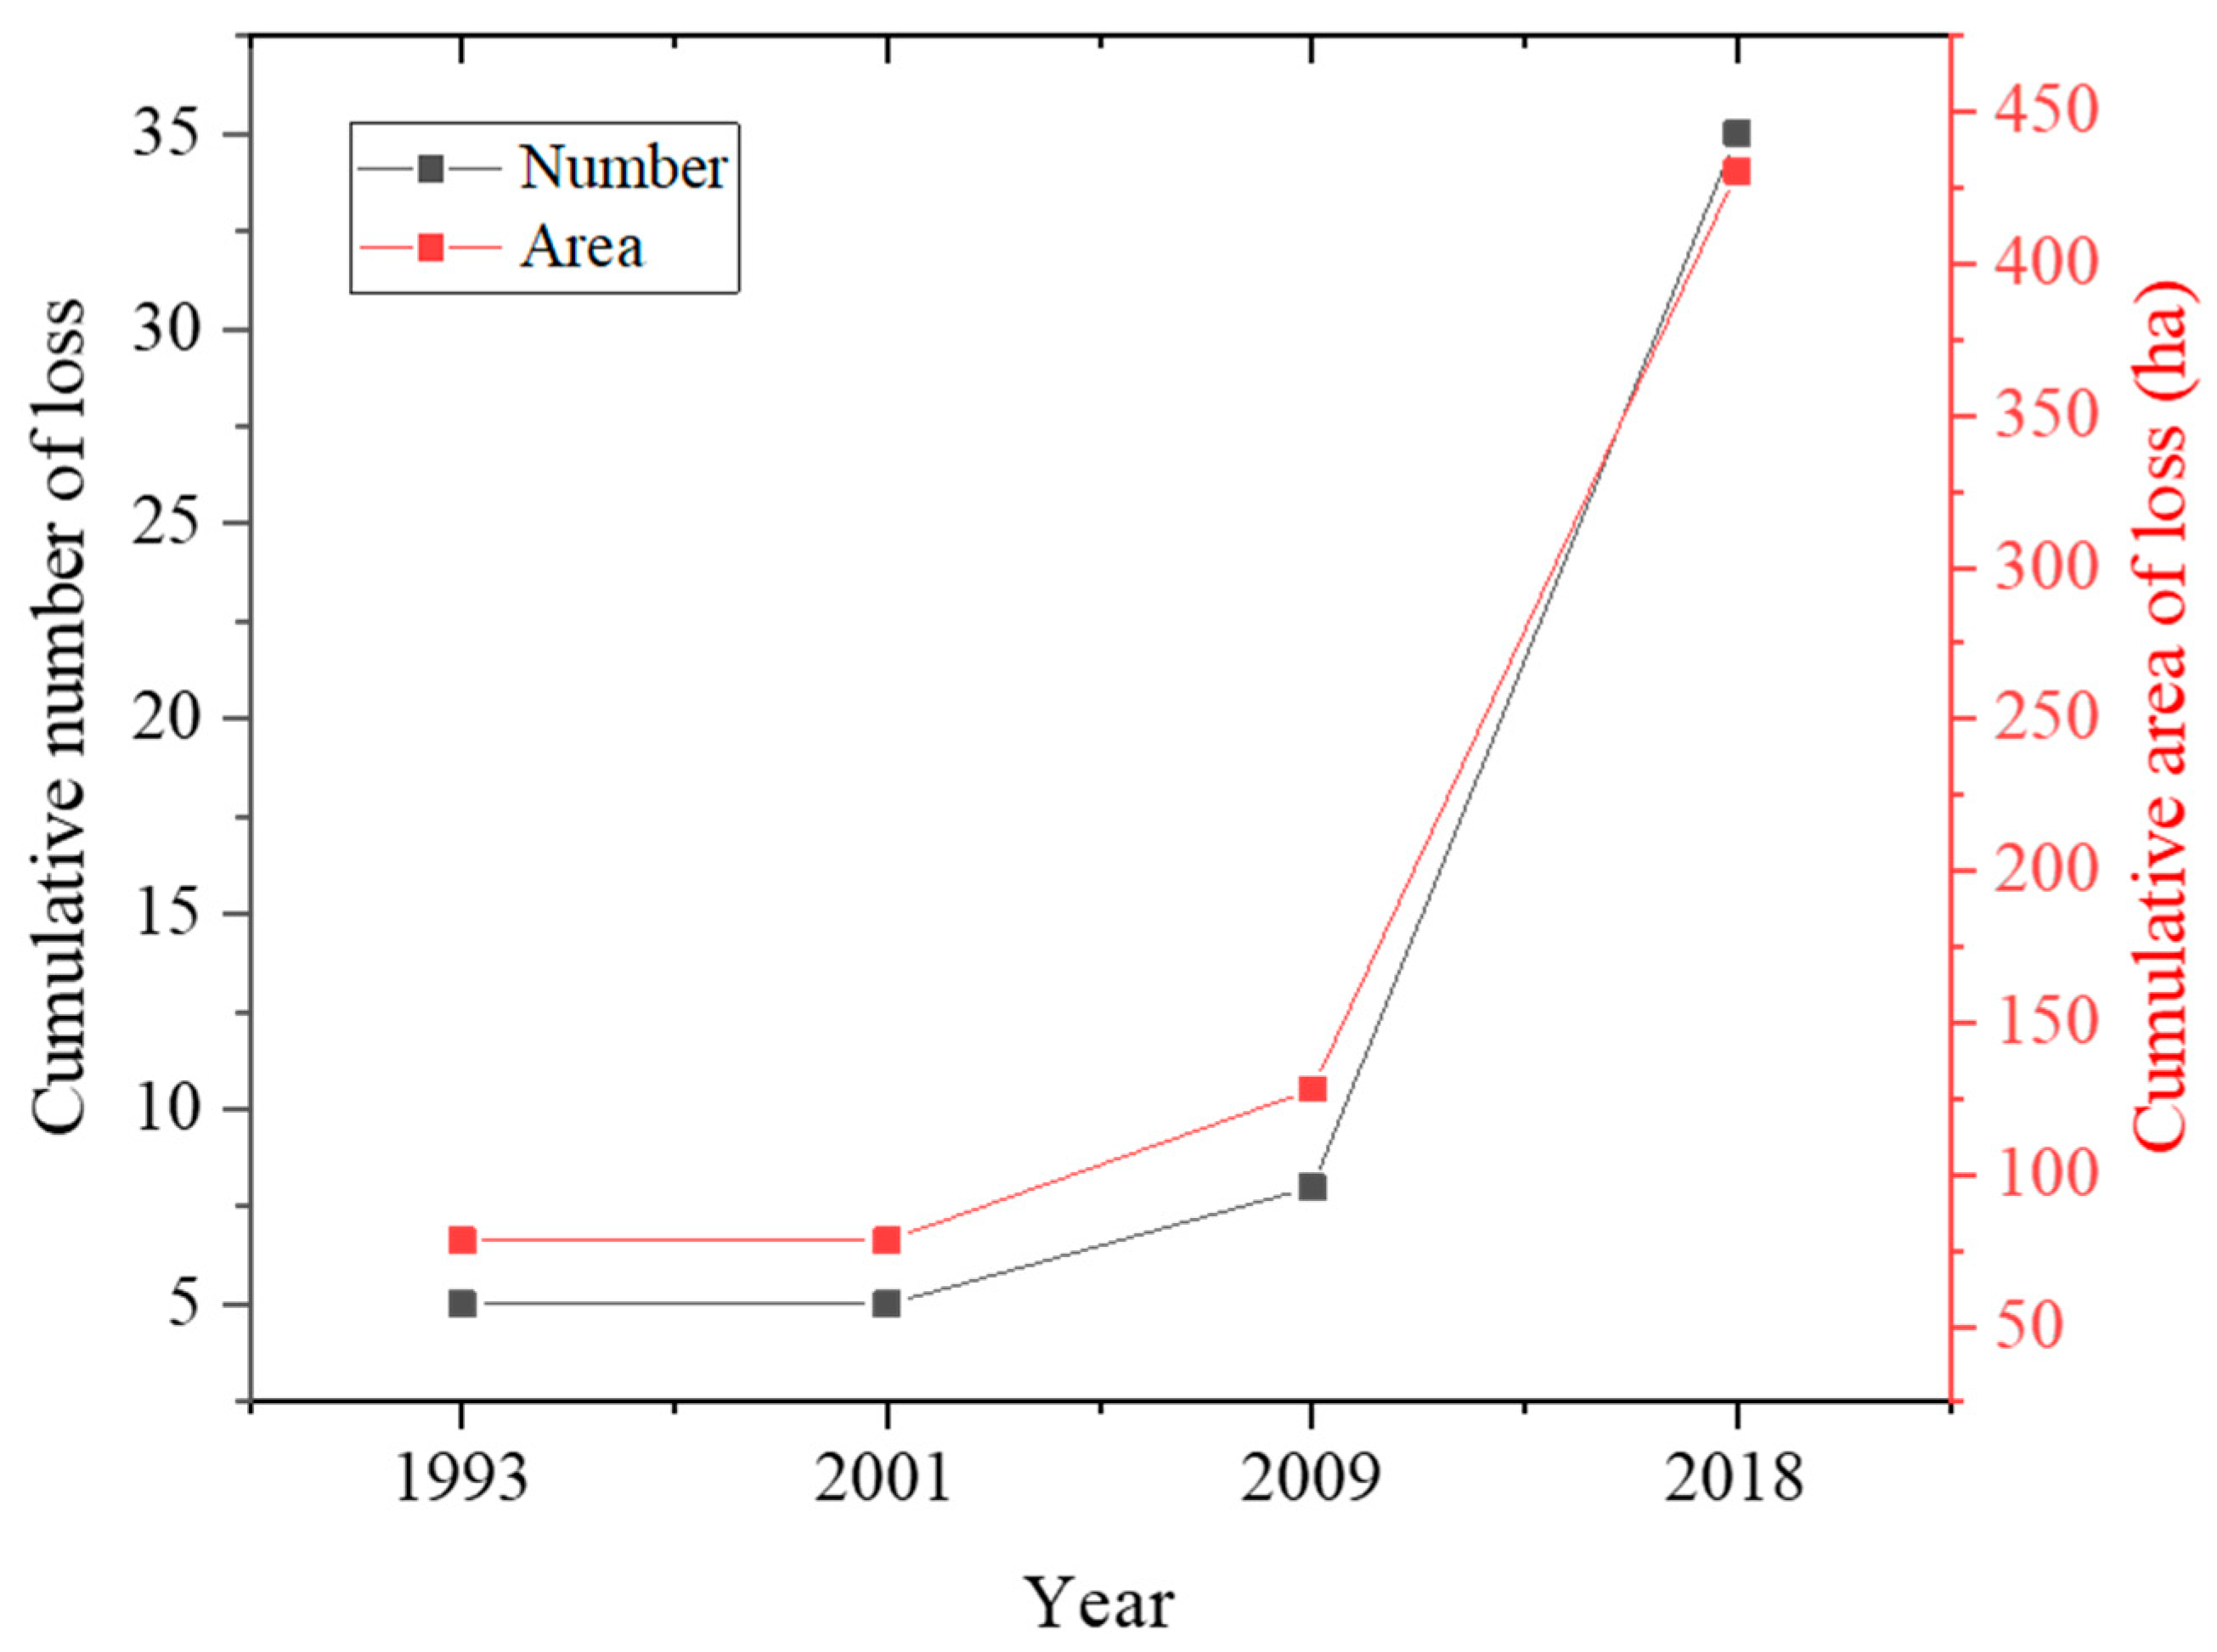
By 2018, a total of 1988.46 ha of forestlands in 91 patches were transformed into other land-use/cover types, mainly into urban lands (Table 3). During the four periods, the transformation that occurred in the first two periods was relatively minor. Notably, a large area of forest loss occurred during the period of 2009–2018. Thirty-five of the original forest patches from 1976 were fully transformed into other land-use/cover types by 2018. However, only eight forest patches suffered a full loss by 2009, while 27 forest patches were completely transformed from 2009 to 2018 (Figure 7).
Table 3.
The temporal changes in transformed area (ha).

Figure 7.
The cumulative numbers and areas of loss for forest patches that were fully transformed into other land-use/cover types.
3.2. Threats to Historical Forests
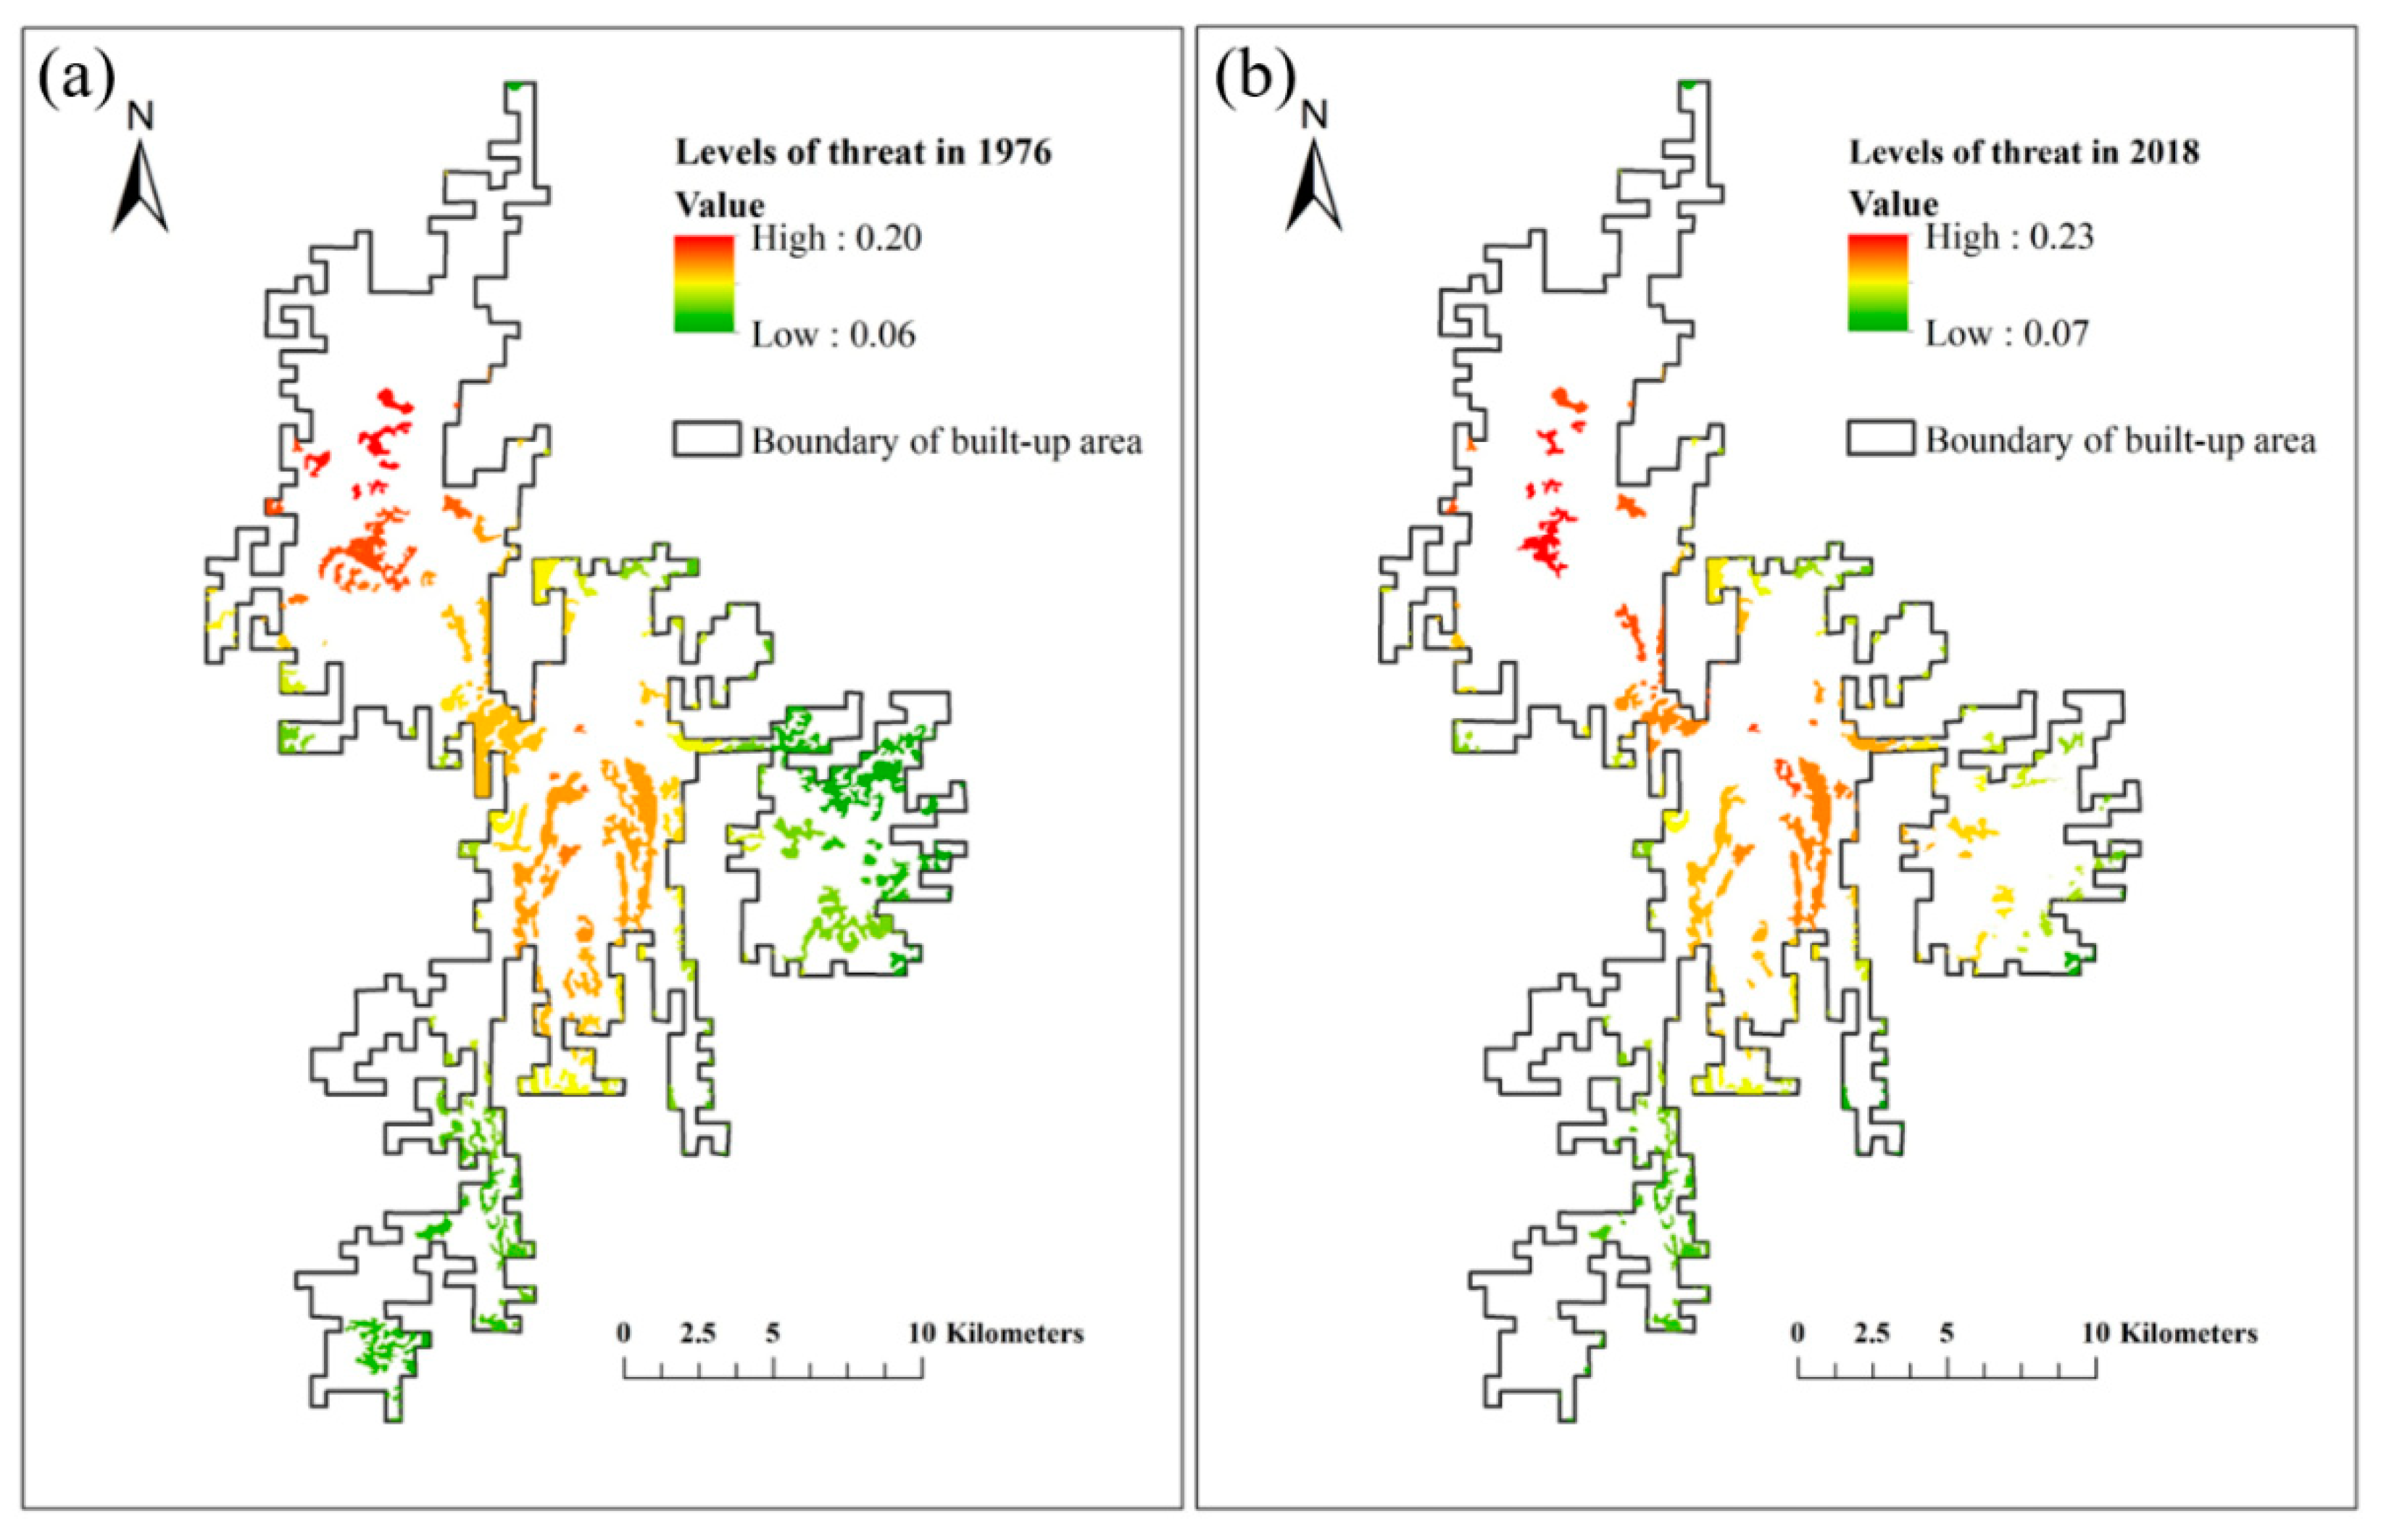
Most historical forest patches (unchanged forest areas in 2018) were threatened by surrounding environments to a much greater extent than the forest patches were in 1976, as shown by the location of threat levels in Figure 8. The mean TI value of historical forest patches increased by 33% from 1976 to 2018. In 1979, 67 forest patches (30%) had a TI value lower than 0.1; however, this number decreased to only three historical forest patches (1%) in 2018. In 2018, 18 historical forest patches (7%) were seriously threatened (TI value > 0.2). The TI values of forest patches showed a declining trend from downtown to the urban fringe regions.

Figure 8.
Levels of threat to historical forest patches in (a) 1976 and (b) 2018.
3.3. Morphological Spatial Patterns
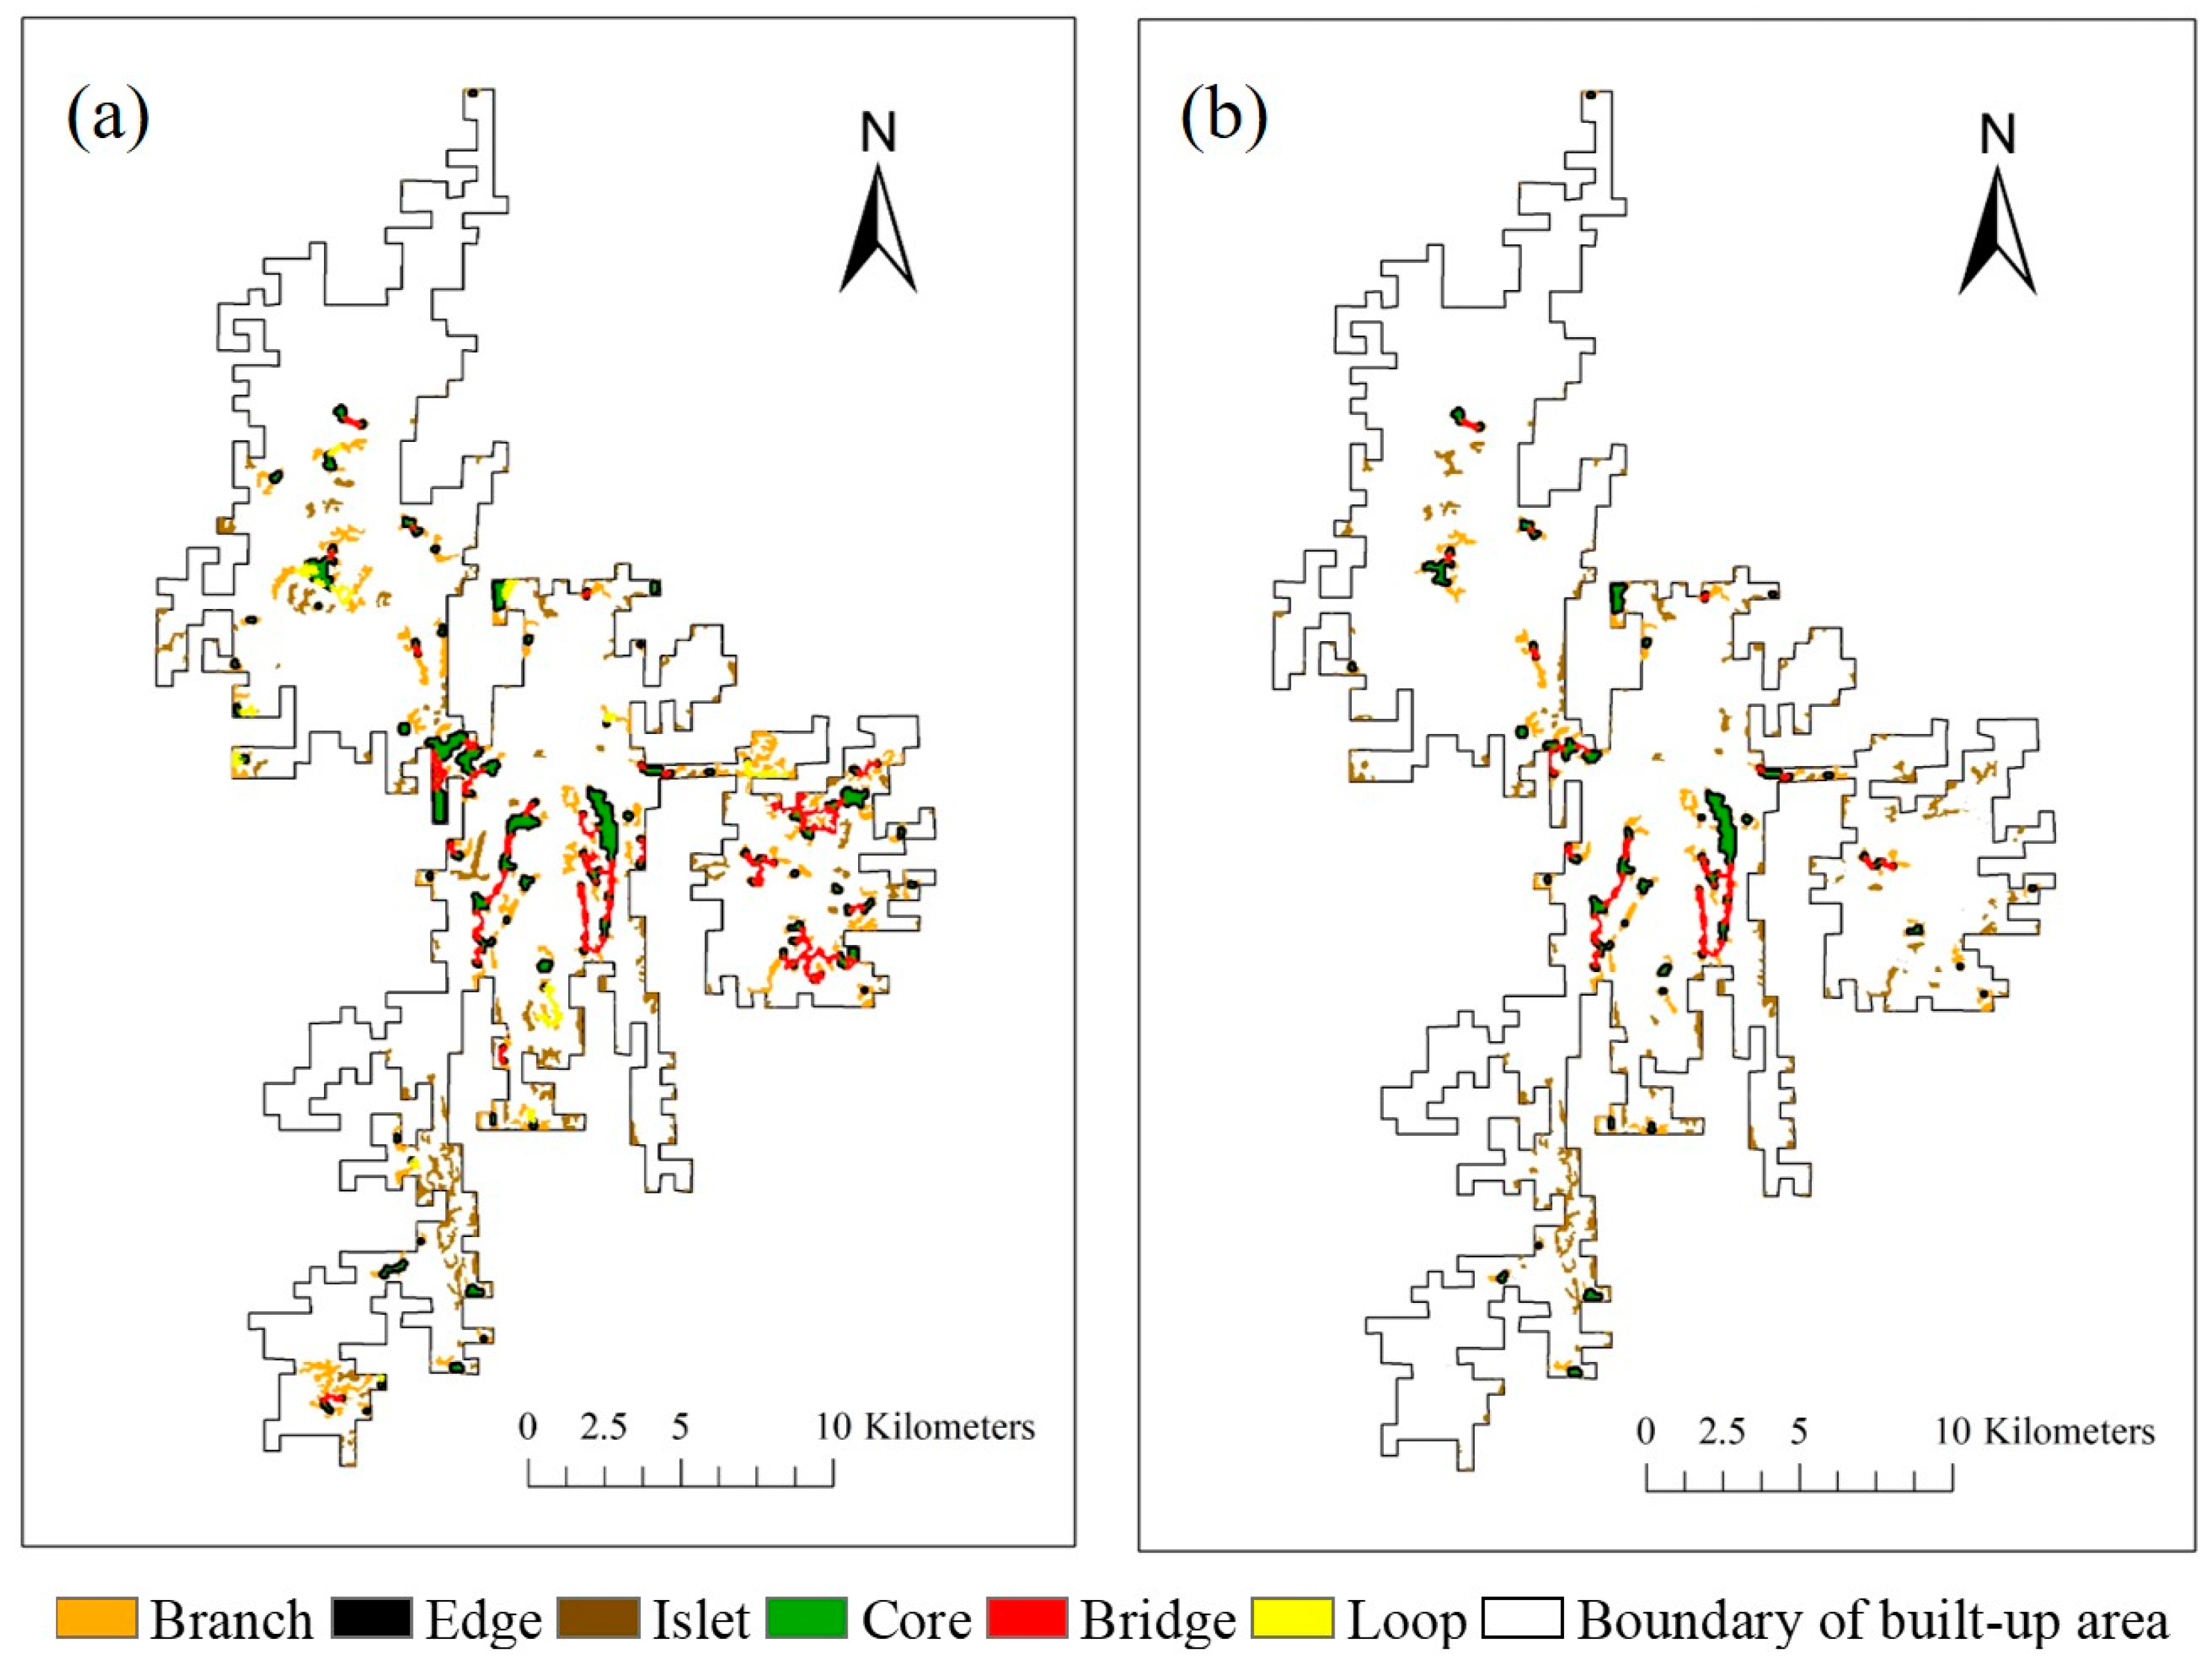
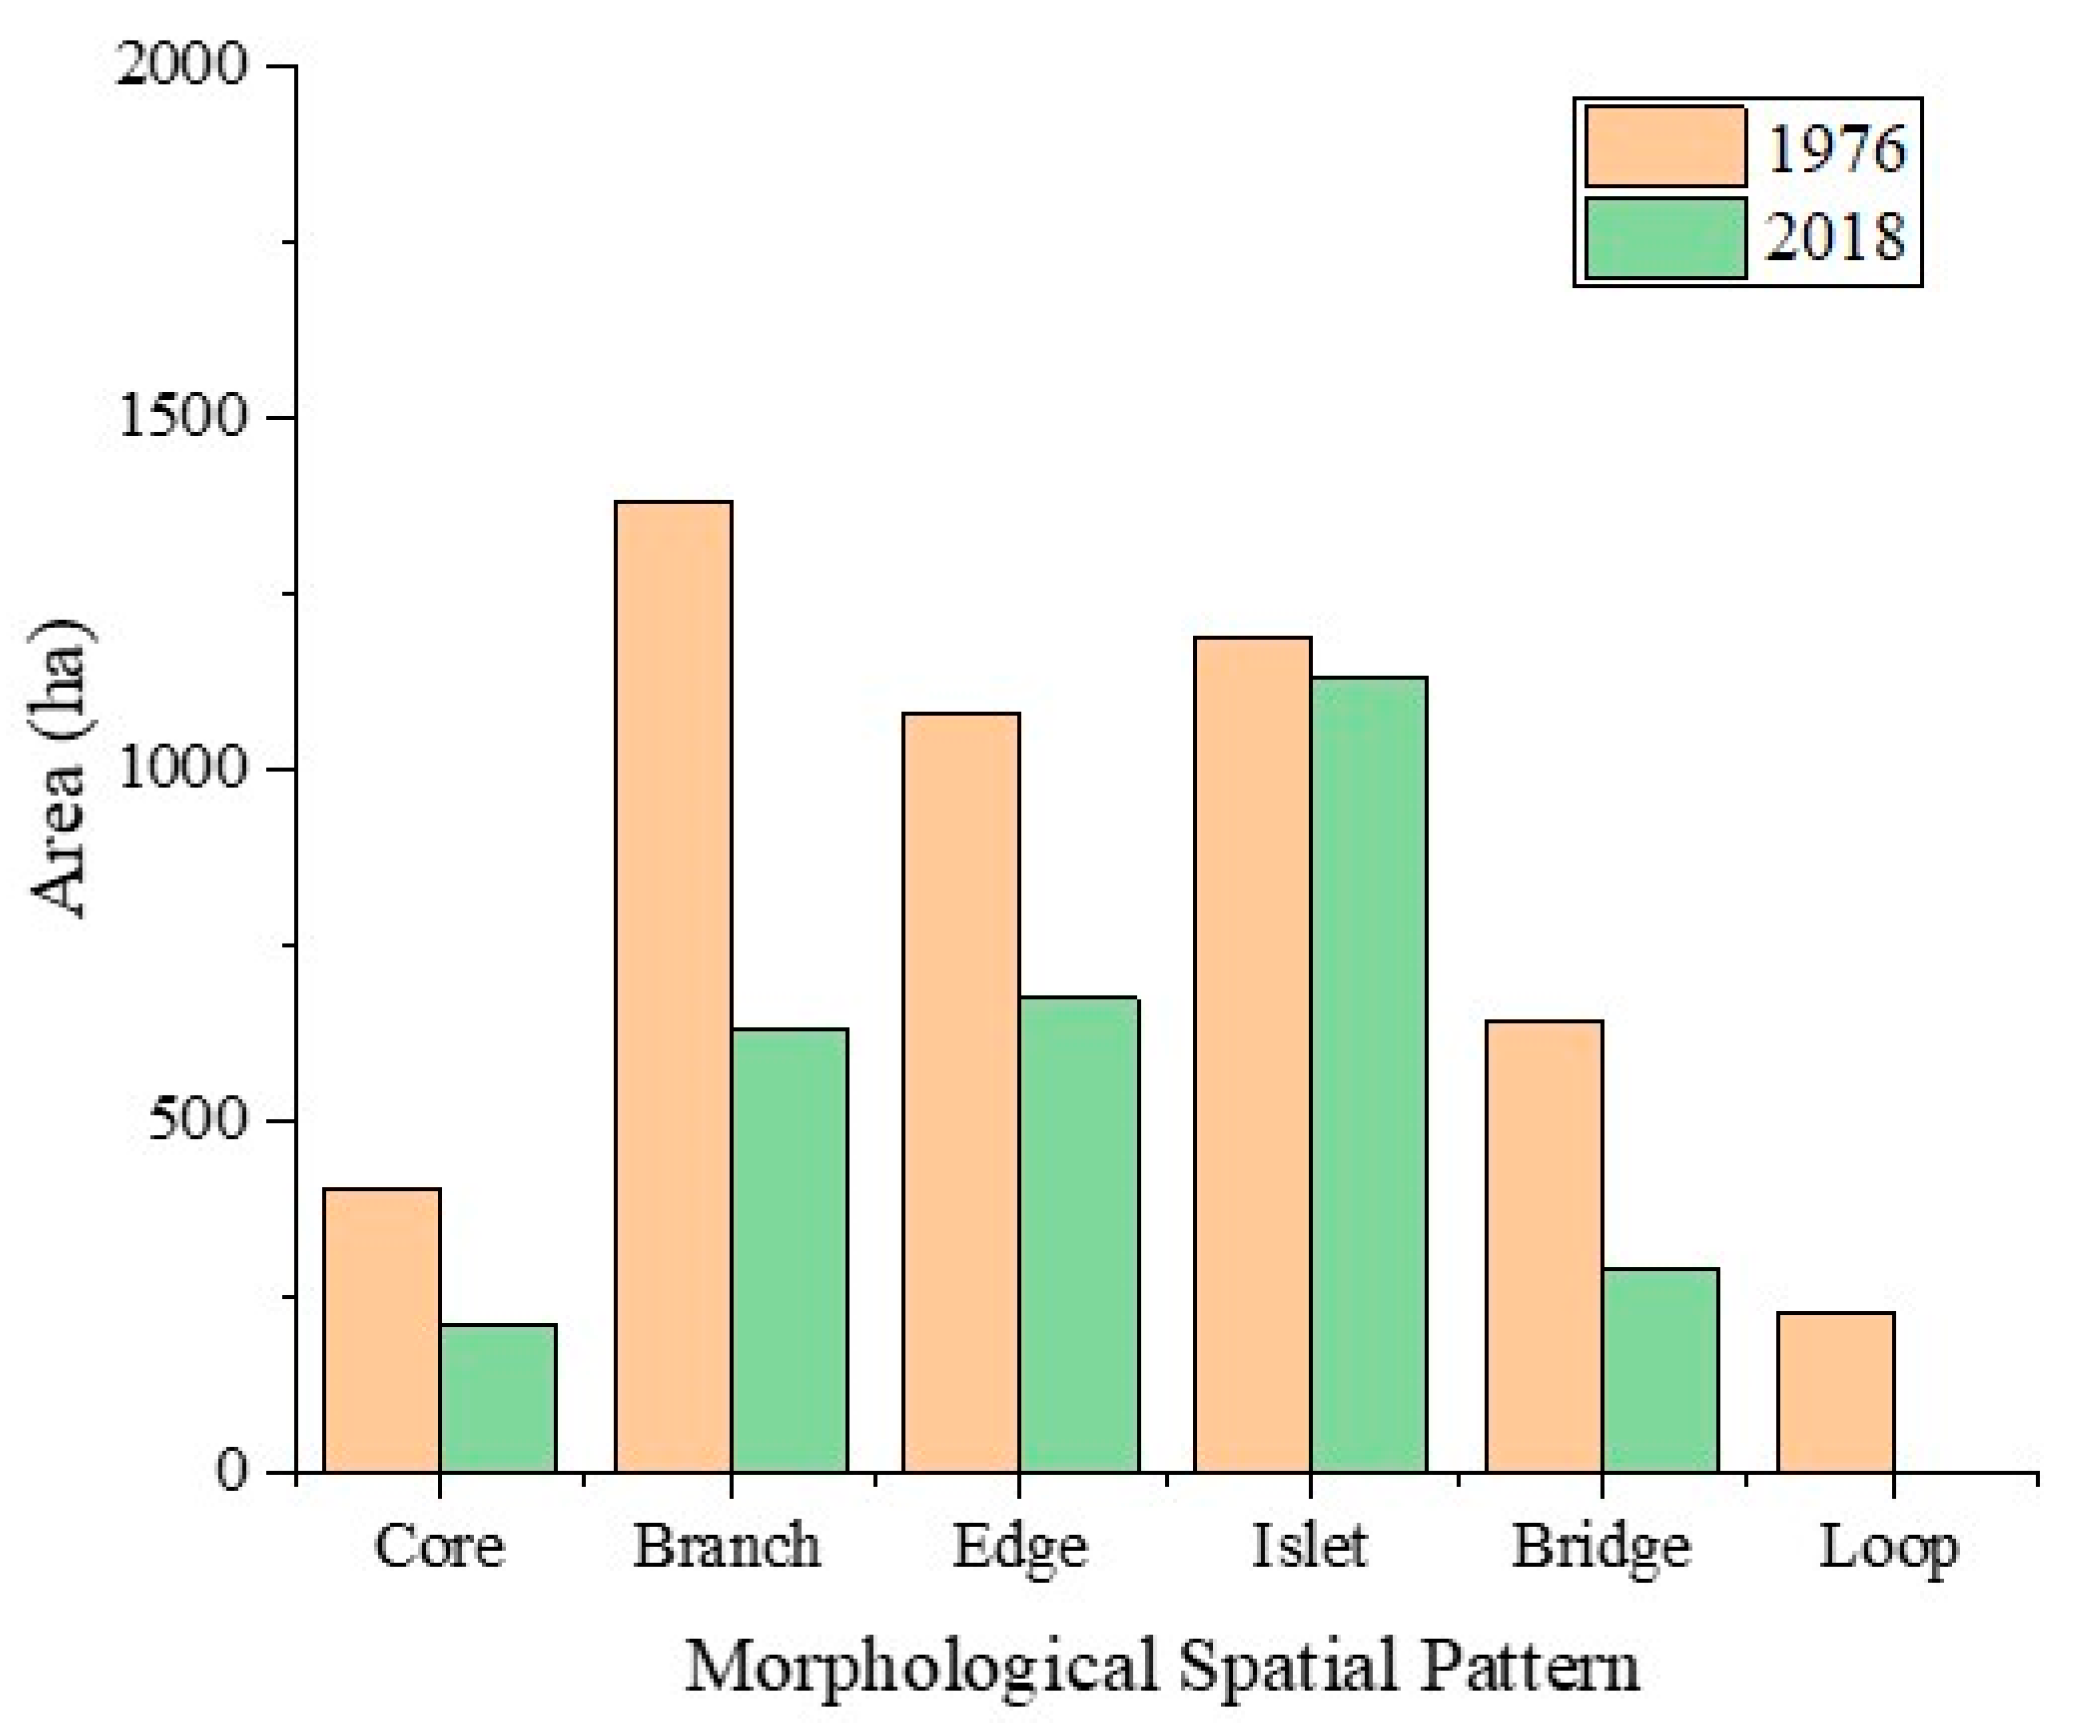
In the study area, the forest patches in 1976 were classified as follows: 106 cores, 33 bridges, 131 edges, 426 branches, 226 islets, and 13 loops (Figure 9a, Table 4). In 2018, the historical forests were composed of 62 cores, 21 bridges, 67 edges, 238 branches, and 275 islets (Figure 9b, Table 4). There were no perforations in the study area. Among the six morphological spatial pattern classes, the area of islets accounted for the majority of the total forest area (Figure 10). The proportion of islets was 24.1% and 38.5% in 1976 and 2018, respectively. Cores and bridges, which are two indispensable patterns, decreased considerably from 1976 to 2018. Compared to 1976, the area of cores decreased by 48%, while that of bridges decreased by 55%.
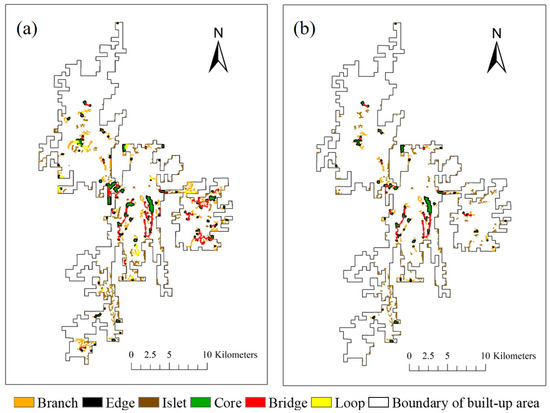
Figure 9.
Morphological spatial patterns of historical forests in (a) 1976 and (b) 2018.
Table 4.
Number of morphological spatial patterns.

Figure 10.
The areas of different morphological spatial pattern classes of historical forests in 1976 and 2018.
3.4. Probability of Connectivity
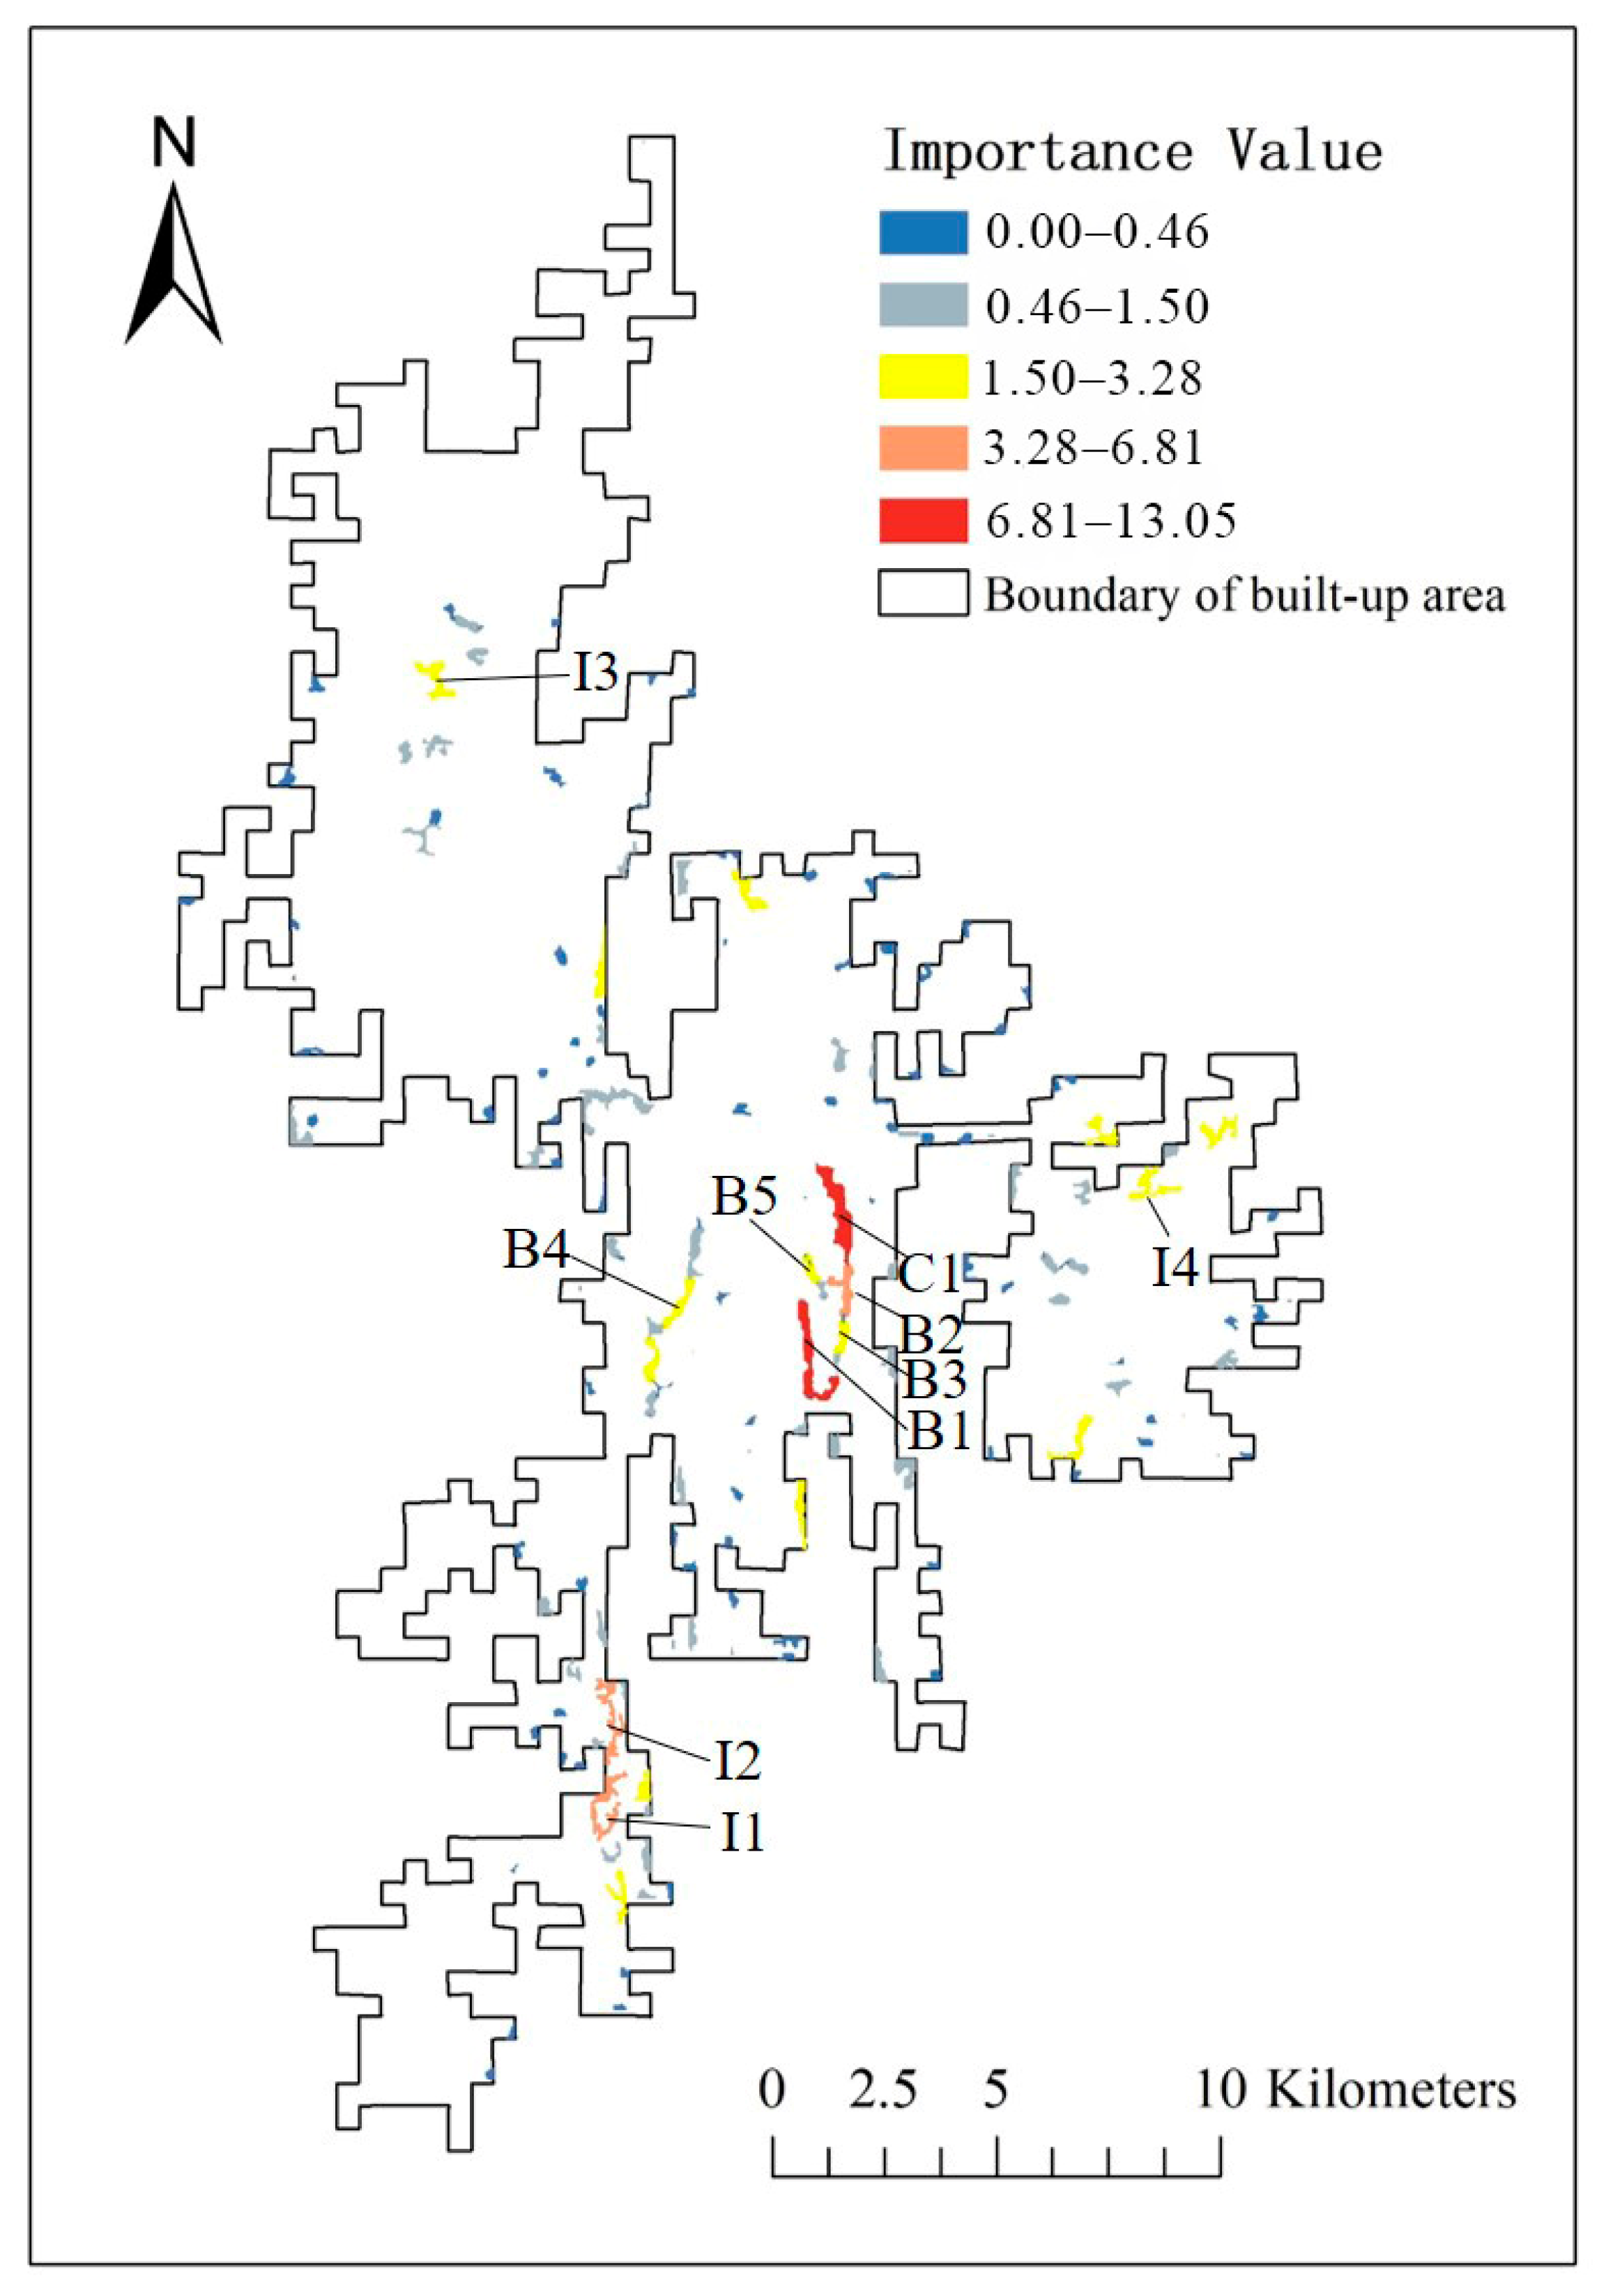
The dPC values (%) of cores, bridges, and some islets are presented in Figure 11. The top 10 most important elements of spatial patterns only included one core, which was located in the center of the city. Its dPC value was 13.5%, which is a very high value because, upon removing this core patch, the connectivity of the overall landscape would decrease by 13.5%. Five important bridges were all in the downtown area (2.23–11.87%). Four islets were far from the city center, but they also had relatively high dPC values (2.86–6.81%). Most cores, bridges, and islets next to the urban fringe had relatively low dPC values.
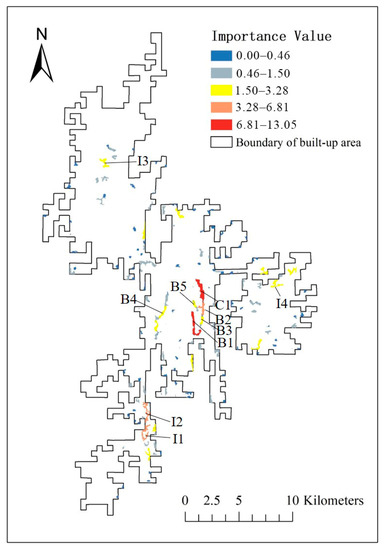
Figure 11.
Probability of connectivity values of cores, bridges, and islets for historical forest patches.
Table 5 shows the area, dPC values, and threat levels of the top 10 important cores, bridges, and islets. The most important core was in the interior of the largest patch in the built-up area, due to its large area and central position. The areas of most important bridges were relatively small (except B1), but they were vital for connecting cores in the center of the study area. It is remarkable, however, that the important core and bridges were severely threatened by the surroundings. The islet located in the northwest (I3) was threatened the most. The values of most important patterns (except I1, I2) were all above 0.15 (the average value of all the historical patches).
Table 5.
Area, dPC values, threat levels, and spatial patterns of important cores, bridges and islets.
4. Discussion
4.1. The Impacts of Urbanization on Historical Forests
The historical forestlands lost a substantial amount of land area and were mainly converted into urban land-use types, especially during the 2009–2018 period. The 41% decline in the total area of historical forests was driven by urbanization from 1976 to 2018. Extensive loss of urban historical forests during recent decades has also been reported in other regions. For example, the total area of historical forests in the southern part of Seoul in 2015 decreased by 35% compared to the value in 1972 [27]; the historical forests in Rome’s metropolitan area lost 26,000 ha from 1936 to 2010 [58]. We found that the area of historical forests in Guiyang declined dramatically during the 2009–2018 period. The primary reason for this observation was that the Chinese State Council released the “Several Opinions of the State Council on Further Promoting Sound and Fast Economic and Social Development in Guizhou” in 2012 [59]. The economic situation and urbanization process of Guiyang city were relatively unadvanced before this report due to the city’s steep terrain and poor transportation, but the city entered a period of urbanization and very rapid development after 2012 [60]. The stimulus of economic policy often results in a significant influence of urban expansion on natural habitats [61].
The expansion of urban lands surrounding historical forest patches increased the threat levels to ecosystems. We found that the threat levels of historical forest patches increased from the urban fringe to the city center. The threat levels of habitats are determined by the strength of threat source and the distance between habitats and threat source. Urban land use/cover has a higher risk of impairing the habitat quality of historical forests. Therefore, even for several large and relatively intact patches in the center of the city, although less area was lost, the high urbanization intensity of the surroundings increased the risk of forest degradation, because they are fairly close to massive infrastructure and residential areas. The consequences of intensive urbanization on urban forests are oxidative stress [62], changes in biogeochemical cycles [63], biotic homogenization [64], etc. Observations from field studies also support the possibility that the compositional dissimilarity of woody plants among forest patches in Guiyang city was low when the percentage of surrounding impervious area was high [15].
The historical forest patches in the study area were fragmented, as determined by the spatial characteristics. The MSPA method can evaluate the spatial patterns simply and intuitively according to their functions [45]. The historical forest patches had a high proportion of islets, edges, and branches, which indicated high levels of fragmentation. Islets are isolated islands separated from intact and large forest patches [65]. Edges are often impacted by edge effects that are unfavorable for forest species sensitive to edge conditions [66]. Branches are interruptions of the bridge connection [53]. This landscape pattern may exist because the forest patches are fragmented due to urban expansion, and the patches in the built-up area of Guiyang were mainly in the form of irregular, elongated shapes. However, the proportion of morphological spatial patterns that facilitate landscape connectivity was relatively low. For example, loops can facilitate species movements within the same patch [53], but they had the lowest proportion in the study area, even decreasing to zero in 2018. Cores can serve as ecological source areas, while bridges can enhance the connectivity among cores [52]. It is important to note the dramatic declines in cores and bridges from 1976 to 2018, especially for the historical patches in the eastern and southwestern areas. These patches were smaller than those in the center, causing the scattered distribution and isolation among historical patches in these regions. In addition to the decline in connectivity, small patches are at high risk of being destroyed because small or moderately sized patches are less easily retained during the process of urban expansion than large patches [67].
The most important core was in the central part of the study area, but it was severely threatened by the surrounding environments. The largest forest patch located in the city center was retained relatively intact during urbanization because of its large area and steep topography. It had the highest dPC value, generally corresponding to its importance in the role of interpatch connectivity. The core area of the patch accounted for 32% of all the core areas in the study area; thus, the largest patch could provide the most ecological resources and habitats for wild species in the city. However, the patch had high threat levels for several reasons. First, it was located in the most and earliest urbanized regions that were chronically disturbed by serious human pressures. In addition, the shapes of the patches were sinuous strips that had extensive edges. Complex shapes and extensive edges increase communication with surrounding environments and decrease the buffering capacity of habitat patches [68]. Therefore, although the largest historical forest patch has a high probability of connectivity, its ecological functions may be compromised due to the high threat levels. Due to its high conservation values, protection measures should not only include impeding further shrinkage but also preventing further habitat degradation. This finding supports the necessity of integrating the evaluation of threat level, MSPA, and the PC landscape metric to identify the critical areas and recognize the potential risks to urban historical forests.
Bridges accounted for a smaller portion of spatial patterns in the study area, causing the cores to be more isolated. The area of bridges was only 9% of the total area of historical forests. A total of 62 cores in the study area had only 21 bridges connecting one another; thus, the ecological resources did not flow smoothly between most cores. In urban landscapes, corridors tend to be small in size compared to those in natural landscapes, as they are often neglected in preservation efforts. For example, the percentage of bridges in the urban forest landscape of Zhaoyuan city, China, was only 8% [55], while 35% of forests were considered as bridges in the Cantabrian Mountains of Asturias and León regions, Spain [52]. In addition, the most important bridges in the present study were found in the central region, which played a vital role in connecting the important cores and the connectivity of the whole landscape; however, similarly, these bridges were seriously threatened by their urban surroundings. In contrast, there were many corridor-lacking areas in the southwestern, northwestern, and eastern regions. The historical forest fragments in these regions need to be improved by the addition of corridors.
Islets were the most common spatial pattern in the study area, and some of them played an important role in improving connectivity of the whole landscape as steppingstones. The area of islets accounted for 38% of historical forests, and 107 islets were larger than 3 ha. In urban landscapes, most remnant patches are mainly presented in the form of isolated islands embedded in the urban matrix [65]. According to the Theory of Island Biogeography, the species diversity is positively related with the island size [69]. The results of this study also found that some large islets had high dPC values. Therefore, large islets, especially those located in the regions where cores and bridges were fewer, should be protected better to prevent further shrinkage.
4.2. Implications for the Management of Urban Historical Forests
Our finding that urbanization caused significant impacts on historical forests in Guiyang, China, can provide useful information for managing these historical forests, especially in the following aspects: (1) preventing the further massive loss of historical forestlands; (2) increasing the buffer area to protect the core areas; (3) optimizing the corridor networks of urban forests.
Urban expansion has had significant impacts on historical forests. In the study area, 41% of historical forests were lost from 1976 to 2018, and 75% of historical forest patches in 2018 were smaller than 10 ha. An area of 10 ha is regarded as a critical threshold size for maintaining the stability of urban forest patches [1], and small habitat patches are more likely than large habitat patches to be lost in urban regions. Therefore, conservation agencies should develop new ways to strictly control urban expansion into historical forestlands, such as establishing ecological red lines for protecting urban historical forests [70], especially small forests. To meet residents’ demands for outdoor recreation, some large historical forest patches can be converted into mountain parks. Trail networks should be carefully planned in these patches, and the number of impervious trails should be minimized to avoid disturbing areas with high conservation value [71]. However, small patches are often more vulnerable and susceptible to human disturbance [16]; thus, it is suggested that these areas be enclosed by protective barriers to allow fewer residents to enter the forests.
Core areas of forests can provide important habitats and resources for interior wildlife [72]. However, core areas accounted for only 7% of the urban historical forest in the study area, and the most important core was seriously threatened by the surroundings. The loss of historical forests is irreversible, but intentionally planted forests can also provide many ecosystem services and facilitate the remaining historical forests [24]. Creating tree belts surrounding historical patches as buffer areas is recommended to protect these forests. On the one hand, this measure can increase the size of integrated forest patches and enhance the buffer capability of historical forests. On the other hand, intentionally creating tree belts may adjust the shape of the habitat patches and reduce the proportion of historical forests that are classified as edge areas, simultaneously increasing the core areas and alleviating the threat levels of historical forests.
Corridors can form connections in the landscape, link isolated habitat patches, and facilitate ecological flows [73]. Bridges connecting cores estimated in the study area were grossly insufficient. Increasing ecological networks by creating forest corridors connecting core areas, especially for the small and isolated cores located in the eastern and southwestern regions, is also suggested to enhance the connectivity of the whole historical forest ecosystem. Plantations with single vegetation types should be avoided because of their poor resistance and weak ecological value [74]. Most of the remaining bridges of historical forests are narrow, sensitive, and easily damaged; thus, they require strict and special protection by human intervention. In addition, some large remaining islets also deserve more attention due to their role as steppingstones and important supplements where cores and bridges are fewer.
5. Conclusions
Knowledge about the impacts of urban land-use/cover change during urbanization on the characteristics of historical forests is needed to improve the management and conservation of these forests. In this study, we evaluated the area loss and threat levels of historical forests and identified the critical areas for historical forests in Guiyang. Our results showed that urban expansion caused significant loss and an increase in threat levels for historical forests. The degradation risks of many of the most important core and bridges for the connectivity of historical forest ecosystems were high due to the high urban intensity of the surrounding areas. On the basis of our results, we recommended active and efficient measures, such as preventing urban expansion into the remaining forestlands and planting tree belts to increase the buffer areas and forest corridors, which can enhance the connectivity of historical forests. We call for integrating the remaining historical forests into urban planning and nature conservation plans. While Guiyang is presented as a case study, the findings from our study will be useful for prioritizing the protection and restoration of historical forests in other rapidly urbanizing cities. Future studies can build upon this study by further exploring conservation priority areas combined with species distribution data.
Supplementary Materials
The following are available online at https://www.mdpi.com/article/10.3390/f13020146/s1, Table S1 Transition matrix of land use/cover from 1978 to 1993 in the built-up area of Guiyang (ha), Table S2: Transition matrix of land use/cover from 1993 to 2001 in the built-up area of Guiyang (ha), Table S3: Transition matrix of land use/cover from 2001 to 2009 in the built-up area of Guiyang (ha), Table S4: Transition matrix of land use/cover from 2009 to 2018 in the built-up area of Guiyang (ha).
Author Contributions
Conceptualization, J.Y.; methodology, J.Y. and F.W.; resources, F.W.; writing—original draft preparation, J.Y.; project administration, J.Y.; funding acquisition, J.Y. and F.W. All authors have read and agreed to the published version of the manuscript.
Funding
This research was funded by Guizhou Science and Technology Department under Grant, grant number QKHLHZ(2016)7447 and the First-Class Discipline Construction Project of Guizhou Province under grant number GNYL(2017)007.
Data Availability Statement
The data of land use/cover for the built-up area of Guiyang, China and spatial locations of urban historical forest patches are available via the Mendeley Data Repository: https://doi.org/10.17632/mdjckk34r8.1 (accessed on 6 March 2021).
Conflicts of Interest
The authors declare no conflict of interest. The funders had no role in the design of the study; in the collection, analyses, or interpretation of data; in the writing of the manuscript, or in the decision to publish the results.
References
- Ramalho, C.E.; Laliberte, E.; Poot, P.; Hobbs, R.J. Complex effects of fragmentation on remnant woodland plant communities of a rapidly urbanizing biodiversity hotspot. Ecology 2014, 95, 2466–2478. [Google Scholar] [CrossRef] [Green Version]
- Stiles, A.; Scheiner, S.M. A multi-scale analysis of fragmentation effects on remnant plant species richness in Phoenix, Arizona. J. Biogeogr. 2010, 37, 1721–1729. [Google Scholar] [CrossRef]
- Zipperer, W.C. Species composition and structure of regenerated and remnant forest patches within an urban landscape. Urban Ecosyst. 2002, 6, 271–290. [Google Scholar] [CrossRef]
- Kowarik, I.; von der Lippe, M. Plant population success across urban ecosystems: A framework to inform biodiversity conservation in cities. J. Appl. Ecol. 2018, 55, 2354–2361. [Google Scholar] [CrossRef] [Green Version]
- Niemelä, J.; Saarela, S.; Söderman, T.; Kopperoinen, L.; Yli-Pelkonen, V.; Väre, S.; Kotze, D.J. Using the ecosystem services approach for better planning and conservation of urban green spaces: A Finland case study. Biodivers. Conserv. 2010, 19, 3225–3243. [Google Scholar] [CrossRef]
- Derkzen, M.L.; Teeffelen, A.J.; Verburg, P.H. REVIEW: Quantifying urban ecosystem services based on high-resolution data of urban green space: An assessment for Rotterdam, the Netherlands. J. Appl. Ecol. 2015, 52, 1020–1032. [Google Scholar] [CrossRef]
- Fahey, R.T.; Casali, M. Distribution of forest ecosystems over two centuries in a highly urbanized landscape. Landsc. Urban Plan. 2017, 164, 13–24. [Google Scholar] [CrossRef] [Green Version]
- Lopez, B.E.; Urban, D.; White, P.S. Nativity and seed dispersal mode influence species’ responses to habitat connectivity and urban environments. Glob. Ecol. Biogeogr. 2018, 27, 1017–1030. [Google Scholar] [CrossRef]
- Williams, N.M.; Winfree, R. Local habitat characteristics but not landscape urbanization drive pollinator visitation and native plant pollination in forest remnants. Biol. Conserv. 2013, 160, 10–18. [Google Scholar] [CrossRef]
- Smale, M.; Gardner, R. Survival of Mount Eden Bush, an urban forest remnant in Auckland, New Zealand. Pac. Conserv. Biol. 1999, 5, 83–93. [Google Scholar] [CrossRef]
- Salghuna, N.; Prasad, P.R.C.; Kumari, J.A. Assessing the impact of land use and land cover changes on the remnant patches of Kondapalli reserve forest of the Eastern Ghats, Andhra Pradesh, India. Egypt. J. Remote Sens. Space Sci. 2018, 21, 419–429. [Google Scholar] [CrossRef]
- Bagnall, R. A study of human impact on an urban forest remnant: Redwood Bush, Tawa, near Wellington, New Zealand. N. Z. J. Bot. 1979, 17, 117–126. [Google Scholar] [CrossRef]
- Ranta, P.; Viljanen, V.; Virtanen, T. Spatiotemporal dynamics of plant occurrence in an urban forest fragment. Plant Ecol. 2013, 214, 669–683. [Google Scholar] [CrossRef]
- Yang, Y.C.; Fujihara, M.; Li, B.Z.; Yuan, X.Z.; Hara, K.; Da, L.J.; Tomita, M.; Zhao, Y. Structure and diversity of remnant natural evergreen broad-leaved forests at three sites affected by urbanization in Chongqing metropolis, Southwest China. Landsc. Ecol. Eng. 2014, 10, 137–149. [Google Scholar] [CrossRef]
- Yang, J.; Yang, J.; Xing, D.; Luo, X.; Lu, S.; Huang, C.; Hahs, A.K. Impacts of the remnant sizes, forest types, and landscape patterns of surrounding areas on woody plant diversity of urban remnant forest patches. Urban Ecosyst. 2021, 24, 245–254. [Google Scholar] [CrossRef]
- Maiorano, L.; Falcucci, A.; Boitani, L. Size-dependent resistance of protected areas to land-use change. Proc. R. Soc. B Biol. Sci. 2008, 275, 1297–1304. [Google Scholar] [CrossRef] [Green Version]
- Scheiner, S.M.; Willig, M.R. Developing unified theories in ecology as exemplified with diversity gradients. Am. Nat. 2005, 166, 458–469. [Google Scholar] [CrossRef] [PubMed] [Green Version]
- Hansen, A.J.; DeFries, R. Ecological mechanisms linking protected areas to surrounding lands. Ecol. Appl. 2007, 17, 974–988. [Google Scholar] [CrossRef] [PubMed]
- Stamps, J.A.; Buechner, M.; Krishnan, V.V. The Effects of Edge Permeability and Habitat Geometry on Emigration from Patches of Habitat. Am. Nat. 1987, 129, 533–552. [Google Scholar] [CrossRef]
- Yamaura, Y.; Kawahara, T.; Iida, S.; Ozaki, K. Relative importance of the area and shape of patches to the diversity of multiple Taxa. Conserv. Biol. 2008, 22, 1513–1522. [Google Scholar] [CrossRef]
- Caryl, F.M.; Thomson, K.; Ree, R. Permeability of the urban matrix to arboreal gliding mammals: Sugar gliders in Melbourne, Australia. Austral Ecol. 2013, 38, 609–616. [Google Scholar] [CrossRef]
- Niu, H.Y.; Xing, J.J.; Zhang, H.M.; Wang, D.; Wang, X.R. Roads limit of seed dispersal and seedling recruitment of Quercus chenii in an urban hillside forest. Urban Urban For. Gree. 2018, 30, 307–314. [Google Scholar] [CrossRef]
- Malkinson, D.; Kopel, D.; Wittenberg, L. From rural-urban gradients to patch-matrix frameworks: Plant diversity patterns in urban landscapes. Landsc. Urban Plan. 2018, 169, 260–268. [Google Scholar] [CrossRef]
- Fernández, I.C.; Wu, J.; Simonetti, J.A. The urban matrix matters: Quantifying the effects of surrounding urban vegetation on natural habitat remnants in Santiago de Chile. Landsc. Urban Plan. 2018, 187, 181–190. [Google Scholar] [CrossRef]
- Huang, L.; Chen, H.; Ren, H.; Wang, J.; Guo, Q. Effect of urbanization on the structure and functional traits of remnant subtropical evergreen broad-leaved forests in South China. Environ. Monit. Assess. 2013, 185, 5003–5018. [Google Scholar] [CrossRef] [PubMed]
- Modica, G.; Praticò, S.; Laudari, L.; Ledda, A.; Montis, A.D. Implementation of multispecies ecological networks at the regional scale: Analysis and multi-temporal assessment. J. Environ. Manag. 2021, 289, 112494. [Google Scholar] [CrossRef]
- Han, Y.; Kang, W.; Thorne, J.; Song, Y. Modeling the effects of landscape patterns of current forests on the habitat quality of historical remnants in a highly urbanized area. Urban For. Urban Gree. 2019, 41, 354–363. [Google Scholar] [CrossRef]
- Ramalho, C.E.; Hobbs, R.J. Time for a change: Dynamic urban ecology. Trends Ecol. Evol. 2012, 27, 179–188. [Google Scholar] [CrossRef]
- Ramalho, C.E.; Laliberte, E.; Poot, P.; Hobbs, R. Effects of fragmentation on the plant functional composition and diversity of remnant woodlands in a young and rapidly expanding city. J. Veg. Sci. 2018, 29, 285–296. [Google Scholar] [CrossRef]
- Hosonuma, N.; Herold, M.; De Sy, V.; De Fries, R.S.; Brockhaus, M.; Verchot, L.; Angelsen, A.; Romijn, E. An assessment of deforestation and forest degradation drivers in developing countries. Environ. Res. Lett. 2012, 7, 044009. [Google Scholar] [CrossRef]
- Yang, J.; Yang, J.; Luo, X.; Huang, C. Impacts by expansion of human settlements on nature reserves in China. J. Environ. Manag. 2019, 248, 109233. [Google Scholar] [CrossRef] [PubMed]
- Lees, A.C.; Peres, C.A. Conservation value of remnant riparian forest corridors of varying quality for Amazonian birds and mammals. Conserv. Biol. 2008, 22, 439–449. [Google Scholar] [CrossRef]
- Reider, I.J.; Donnelly, M.A.; Watling, J.I. The influence of matrix quality on species richness in remnant forest. Landsc. Ecol. 2018, 33, 1147–1157. [Google Scholar] [CrossRef]
- Xu, X.; Pang, Z.; Yu, X. Spatial-Temporal Pattern Analysis of Land Use/Cover Change: Methods & Application; Science and Technology Literature Press: Beijing, China, 2014. (In Chinese) [Google Scholar]
- Sharp, R.; Tallis, H.T.; Ricketts, T.; Guerry, A.D.; Wood, S.A.; Chaplin-Kramer, R.; Nelson, E.; Ennaanay, D.; Wolny, S.; Olwero, N.; et al. InVEST +VERSION+ User’s Guide; The Natural Capital Project, Stanford University, University of Minnesota, The Nature Conservancy, and World Wildlife Fund: Palo Alto, CA, USA, 2016. [Google Scholar]
- Terrado, M.; Sabater, S.; Chaplin-Kramer, B.; Mandle, L.; Ziv, G.; Acuna, V. Model development for the assessment of terrestrial and aquatic habitat quality in conservation planning. Sci. Total Environ. 2016, 540, 63–70. [Google Scholar] [CrossRef] [Green Version]
- Sallustio, L.; De Toni, A.; Strollo, A.; Di Febbraro, M.; Gissi, E.; Casella, L.; Geneletti, D.; Munafo, M.; Vizzarri, M.; Marchetti, M. Assessing habitat quality in relation to the spatial distribution of protected areas in Italy. J. Environ. Manag. 2017, 201, 129–137. [Google Scholar] [CrossRef] [PubMed]
- Chen, Y.; Qiao, F.; Jiang, L. Effects of land use pattern change on regional scale habitat quality based on InVEST model—A Case Study in Beijing. Acta Sci. Nat. Univ. Pekin. 2016, 52, 553–562. (In Chinese) [Google Scholar]
- Wu, J.; Zhang, X.; Cao, Q. Ecological Security Assessment of Wetlands in Rapidly Urbanizing Areas: A Case Study of Shenzhen, China. Wetl. Sci. 2017, 15, 321–328. (In Chinese) [Google Scholar]
- Wu, C.; Lin, Y.; Chiang, L.; Huang, T. Assessing highway’s impacts on landscape patterns and ecosystem services: A case study in Puli Township, Taiwan. Landsc. Urban Plan. 2014, 128, 60–71. [Google Scholar] [CrossRef]
- Kim, T.; Song, C.; Lee, W.K.; Kim, M.; Lim, C.H.; Jeon, S.W.; Kim, J. Habitat Quality Valuation Using InVEST Model in Jeju Island. J. Korea Soc. Environ. Restor. Technol. 2015, 18, 1–11. (In Korean) [Google Scholar] [CrossRef] [Green Version]
- Zhou, F.; Ma, T.; Li, X.; Cui, B. The Simulation and Assessment of the Ecosystem Services in the Coastal Wetlands of the Yellow River Delta based on InVEST Model. Wetl. Sci. 2015, 13, 667–674. (In Chinese) [Google Scholar]
- Soille, P.; Vogt, P. Morphological segmentation of binary patterns. Pattern Recognit. Lett. 2009, 30, 456–459. [Google Scholar] [CrossRef]
- Vogt, P.; Riitters, K. GuidosToolbox: Universal digital image object analysis. Eur. J. Remote Sens. 2017, 50, 352–361. [Google Scholar] [CrossRef]
- Vogt, P.; Ferrari, J.R.; Lookingbill, T.R.; Gardner, R.H.; Riitters, K.H.; Ostapowicz, K. Mapping functional connectivity. Ecol. Indic. 2009, 9, 64–71. [Google Scholar] [CrossRef]
- Bentrup, G. Conservation buffers—design guidelines for buffers, corridors, and greenways. Gen. Tech. Rep.—South. Res. Stn. USDA For. Serv. 2008, 109, 110. [Google Scholar]
- Environment Canada. How Much Habitat is Enough? 3rd ed.; Environment Canada: Toronto, ON, Canada, 2013.
- Forman, R.T. Land Mosaics: The Ecology of Landscapes and Regions; Cambridge University Press: Cambridge, UK, 1995. [Google Scholar]
- Saura, S.; Torné, J. Conefor sensinode 2.2: A software package for quantifying the importance of habitat patches for landscape connectivity. Environ. Model. Softw. 2009, 22, 135–139. [Google Scholar] [CrossRef]
- Saura, S.; Pascual-Hortal, L. A new habitat availability index to integrate connectivity in landscape conservation planning: Comparison with existing indices and application to a case study. Landsc. Urban Plan. 2007, 83, 91–103. [Google Scholar] [CrossRef]
- Laita, A.; Kotiaho, J.S.; Mönkkönen, M. Graph-theoretic connectivity measures: What do they tell us about connectivity? Landsc. Ecol. 2011, 26, 951–967. [Google Scholar] [CrossRef]
- Velázquez, J.; Gutiérrez, J.; Hernando, A.; García-Abril, A. Evaluating landscape connectivity in fragmented habitats: Cantabrian capercaillie (tetrao urogallus cantabricus) in northern spain. For. Ecol. Manag. 2017, 389, 59–67. [Google Scholar] [CrossRef]
- An, Y.; Liu, S.; Sun, Y.; Shi, F.; Beazley, R. Construction and optimization of an ecological network based on morphological spatial pattern analysis and circuit theory. Landsc. Ecol. 2021, 36, 2059–2076. [Google Scholar] [CrossRef]
- Saura, S.; Vogt, P.; Velazquez, J.; Hernando, A.; Tejera, R. Key structural forest connectors can be identified by combining landscape spatial pattern and network analyses. For. Ecol. Manag. 2011, 262, 150–160. [Google Scholar] [CrossRef]
- Gao, Y.; Mu, H.; Zhang, Y.; Tian, Y.; Tang, D.; Li, X. Research on construction path optimization of urban-scale green network system based on MSPA analysis method: Taking Zhaoyuan City as an example. Acta Ecol. Sin. 2019, 39, 7547–7556. (In Chinese) [Google Scholar]
- Du Toit, M.J.; Kotze, D.J.; Cilliers, S.S. Landscape history, time lags and drivers of change: Urban natural grassland remnants in Potchefstroom, South Africa. Landsc. Ecol. 2016, 31, 2133–2150. [Google Scholar] [CrossRef] [Green Version]
- Geslin, B.; Gauzens, B.; Thebault, E.; Dajoz, I. Plant Pollinator Networks along a Gradient of Urbanisation. PLoS ONE 2013, 8, e63421. [Google Scholar] [CrossRef] [PubMed]
- Solano, F.; Praticò, S.; Piovesan, G.; Chiarucci, A.; Argentieri, A.; Modica, G. Characterizing historical transformation trajectories of the forest landscape in rome’s metropolitan area (italy) for effective planning of sustainability goals. Land Degrad. Dev. 2021, 32, 4708–4726. [Google Scholar] [CrossRef]
- The Chinese State Council. Several Opinions of the State Council on Further Promoting Sound and Fast Economic and Social Development in Guizhou; The Chinese State Council: Beijing, China, 2012.
- Yao, L.; Wu, C.; Lu, Z. Co-evolution Relationship between the Quality of Urbanization and the Health of Land Use System in Karst Regions. Resour. Environ. Yangtze Basin 2018, 27, 768–778. (In Chinese) [Google Scholar]
- Martinuzzi, S.; Radeloff, V.C.; Joppa, L.N.; Hamilton, C.M.; Helmers, D.P.; Plantinga, A.J.; Lewis, D.J. Scenarios of future land use change around United States’ protected areas. Biol. Conserv. 2015, 184, 446–455. [Google Scholar] [CrossRef]
- Isaksson, C. Urbanization, oxidative stress and inflammation: A question of evolving, acclimatizing or coping with urban environmental stress. Funct. Ecol. 2015, 29, 913–923. [Google Scholar] [CrossRef]
- Alberti, M. Maintaining ecological integrity and sustaining ecosystem function in urban areas. Curr. Opin. Sust. 2010, 2, 178–184. [Google Scholar] [CrossRef]
- Kuhn, I.; Klotz, S. Urbanization and homogenization—Comparing the floras of urban and rural areas in Germany. Biol. Conserv. 2006, 127, 292–300. [Google Scholar] [CrossRef]
- Olejniczak, M.J.; Spiering, D.J.; Potts, D.L.; Warren, R.J. Urban forests form isolated archipelagos. J. Urban Ecol. 2018, 4, juy007. [Google Scholar] [CrossRef] [Green Version]
- Soga, M.; Kanno, N.; Yamaura, Y.; Koike, S. Patch size determines the strength of edge effects on carabid beetle assemblages in urban remnant forests. J. Insect. Conserv. 2013, 17, 421–428. [Google Scholar] [CrossRef] [Green Version]
- Wintle, B.A.; Kujala, H.; Whitehead, A.; Cameron, A.; Veloz, S.; Kukkala, A.; Moilanen, A.; Gordon, A.; Lentini, P.E.; Cadenhead, N.C.R.; et al. Global synthesis of conservation studies reveals the importance of small habitat patches for biodiversity. Proc. Natl. Acad. Sci. USA 2019, 116, 909–914. [Google Scholar] [CrossRef] [PubMed] [Green Version]
- Ewers, R.M.; Didham, R.K. Confounding factors in the detection of species responses to habitat fragmentation. Biol. Rev. 2006, 81, 117–142. [Google Scholar] [CrossRef]
- MacArthur, R.H.; Wilson, E.O. The Theory of Island Biogeography; Princeton University Press: Princeton, NJ, USA, 1967. [Google Scholar]
- Zhang, H.; Ouyang, Z. Practice and Consideration for Ecological Redlining. Bull. Chin. Acad. Sci. 2014, 29, 448, 457–461. (In Chinese) [Google Scholar]
- Ballantyne, M.; Pickering, C.M. Differences in the impacts of formal and informal recreational trails on urban forest loss and tree structure. J. Environ. Manag. 2015, 159, 94–105. [Google Scholar] [CrossRef] [Green Version]
- Pirnat, J.; Hladnik, D. Connectivity as a tool in the prioritization and protection of sub-urban forest patches in landscape conservation planning. Landsc. Urban Plan. 2016, 153, 129–139. [Google Scholar] [CrossRef]
- Liang, J.; He, X.; Zeng, G.; Zhou, M.; Gao, X.; Li, X.; Li, X.; Wu, H.; Feng, C.; Xing, W.; et al. Integrating priority areas and ecological corridors into national network for conservation planning in China. Sci. Total Environ. 2018, 626, 22–29. [Google Scholar] [CrossRef]
- Hong, L.; Huang, Y.; Lin, S.; Zhao, K.; Zou, Y.; Yu, X.; Yang, L.; Wang, X.; Zhu, M.; Zhou, Z. Study on plant diversity of mountain areas of yangmeikeng and chiao, Shenzhen, China. Am. J. Plant Sci. 2016, 7, 2527–2552. [Google Scholar]


Publisher’s Note: MDPI stays neutral with regard to jurisdictional claims in published maps and institutional affiliations. |
© 2022 by the authors. Licensee MDPI, Basel, Switzerland. This article is an open access article distributed under the terms and conditions of the Creative Commons Attribution (CC BY) license (https://creativecommons.org/licenses/by/4.0/).