Article

Provenance Variation in Early Survival, Growth, and Carbon Isotope Discrimination of Southwestern Ponderosa Pine Growing in Three Common Gardens across an Elevational Gradient

1
School of Forestry, Northern Arizona University, Flagstaff, AZ 86011, USA
2
John T. Harrington Forestry Research Center, New Mexico State University, Mora, NM 87732, USA
3
Wildland Resources Department and Ecology Center, Utah State University, Logan, UT 84322, USA
*
Author to whom correspondence should be addressed.
Forests 2021, 12(11), 1561; https://doi.org/10.3390/f12111561
Submission received: 17 September 2021 / Revised: 4 November 2021 / Accepted: 10 November 2021 / Published: 12 November 2021

Abstract

:
We investigated early survival, growth, and carbon isotope discrimination of ponderosa pine (Pinus ponderosa Lawson & C. Lawson var. scopulorum Engelm.) seedlings from different provenances using common gardens across an elevational gradient in order to examine the potential for adaptation to extreme environments and constraints to artificial regeneration. Twenty-one provenances from a range of elevations across Arizona and New Mexico were planted in three common gardens: a high-elevation meadow in aspen-mixed conifer forest, a mid-elevation ponderosa pine forest, and a low-elevation pinyon juniper woodland. Two years after planting in 2018, survival was highest at the mid-elevation site (54%), low at the high-elevation site (1.5%), and 0% at the low-elevation site. At the hot and dry low-elevation site, provenances from low-elevations survived longer than provenances from mid- and high-elevations, which suggests greater drought tolerance of low-elevation provenances. Mortality agents changed from abiotic (drought) to biotic (herbivory) with an increase in elevation across sites. High mortality of seedlings planted at high-elevation sites from biotic agents, such as rodents, may challenge efforts to establish ponderosa pine in assisted migration projects. Seedlings had significantly higher growth rate and carbon isotope discrimination (∆13C) at the mid-elevation site than the high-elevation site. Provenances differed significantly in diameter, and ∆13C, but not in height growth rate for the first year after planting. Provenance variation in ∆13C suggests genetic variation in water use efficiency that may be useful for future evaluation of southwestern ponderosa pine seed sources for reforestation.

1. Introduction

Climate warming and associated high-severity fires and extended droughts have caused large-scale tree mortality in the southwestern United States [1,2]. In southwestern ponderosa pine (Pinus ponderosa Lawson & C. Lawson var. scopulorum Engelm.) forests, severe wildfires and droughts have also reduced natural regeneration [3,4]. A continuation of high tree mortality and meager regeneration threatens to shrink the geographical distribution of these forests [5]. Range contraction of southwestern ponderosa pine forests after severe drought has already been observed [6,7]. Climatic constraints on natural regeneration of ponderosa pine by drought and high temperature are expected to increase in the future [8].
In the absence of sufficient natural regeneration, it is important to explore the use of tree planting as a possible tool to compensate for recent deforestation [9,10]. Future plantings should include seedlings that are genetically and physiologically pre-adapted to future arid conditions through enhancing drought tolerance [11,12]. Non-local populations may have more pre-adaptation to the future climate of a site than local populations because populations that currently occur at a site are adapted to past local conditions [13,14] that, in the American Southwest, were cooler and wetter [15]. Assisted migration of populations has been proposed to mitigate climate change impacts on forests by preemptively moving drought tolerant populations to sites predicted to increase in aridity [11]. In addition to climate, assisted migration strategies and tree planting in general should consider constraints to success of planted seedlings from biotic agents [16,17], that have been previously reported to negatively impact ponderosa pine seedlings [18,19,20].
Previous common garden investigations of ponderosa pine in the southwestern United States set the stage for our work by showing clinal patterns of genetic differences among provenances in seedling traits, such as growth rate, spring budburst timing, and frost tolerance [21,22]. These previous investigations, however, did not specifically include low-elevation provenances [21], which may be arid adapted [23], did not cover a wide environmental and geographic range [24], or only studied seedlings growing under resource-rich nursery or greenhouse conditions [22]. More studies of ponderosa pine provenance performance in field conditions over environmental gradients are needed in order to understand impacts of abiotic and biotic factors on planted seedlings and to refine seed transfer guidelines based on a changing climate.
Our study builds on earlier investigations of provenance variation in ponderosa pine growth rate, drought tolerance and carbon isotope discrimination by specifically focusing on fine-grained spatial variation in the southwestern United States. Kerr et al. [25] reported a tradeoff between seedling growth rate and drought tolerance for ponderosa pine provenances from Oregon. Carbon isotope discrimination (∆13C) is a proxy for water use efficiency, a potentially important mechanism of drought tolerance [26]. Carbon isotope discrimination is determined by leaf internal CO2 concentration, which is controlled by the ratio of net photosynthesis to stomatal conductance [27]. Carbon isotope discrimination differed among widely separated ponderosa pine provenances from the interior United States [28,29], but these previous studies did not specifically focus on southwestern or low-elevation provenances within a region.
In this study, we compared early survival, growth, and ∆13C among seedlings from 21 ponderosa pine provenances from Arizona and New Mexico at three planting sites that varied in elevation, temperature, and precipitation. The planting sites were selected to bracket the current climatic niche of ponderosa pine in the southwestern U.S. by including a site in the middle of the current species distribution; a hot, low-elevation site with a temperature expected to occur within the core range of the species in the next 100 years [15], and a cool high-elevation site where assisted migration of the species could occur in the future. We address the following questions: (1) How does common garden environment, provenance, and their interaction influence early survival, growth, and carbon isotope discrimination of planted ponderosa pine seedlings? (2) How does seedling performance relate to provenance environmental characteristics?

2. Materials and Methods

2.1. Common Garden Sites

The study was conducted in three common gardens across an elevational gradient. The common gardens were planted in the core of the species range (mid-elevation site; elevation 2200 m, Mean Annual Temperature (MAT) 7.6 °C) and outside the current range at high-elevation (elevation 2780 m, MAT 4.9 °C) and low-elevation (elevation 1930 m, MAT 9.7 °C) sites (Figure 1). Mean annual temperature of the low-elevation site is similar to the projected temperature of sites in the core of the species range by the end of the 21st century. Each site was equipped with a weather station and a datalogger (Campbell Scientific, Logan, UT, USA) to measure air temperature and precipitation. The planted areas at all sites were protected against ungulate herbivory by fences that prevented access by large mammals such as cattle, deer, and elk, but not small animals.
The low-elevation site was planted on 21 July 2018, in an open area within a pinyon–juniper woodland in northern Arizona. The soil at the site is a clay loam derived from basalt and limestone parent material (https://sega.nau.edu/gardens/blue-chute, accessed on 19 September 2020). The year of planting (2018) was 1.4 °C warmer and received only 33 percent of average annual precipitation compared to 30-year normals (1981–2010; https://prism.oregonstate.edu, accessed on 19 September 2020). The mid-elevation site was planted on 20 July 2018, in an open grass-dominated meadow in a ponderosa pine forest in northern Arizona. The soil type at this site is clay loam derived from basalt parent material (https://sega.nau.edu/gardens/arboretum-forest, accessed on 19 September 2020). At this site, the planting year was 0.2 °C warmer and received only 66 percent of mean annual precipitation compared to 30-year normals. Conditions at this site were particularly dry in the year 2020 with only 33 percent of mean annual precipitation. The high-elevation site was planted on 24 July 2018, in a grassy meadow within an aspen and mixed conifer forest in southern Utah. The soil type at this site is a silty loam [30] derived from volcanic parent material. The planting year was 1.5 °C warmer and received about 85 percent of mean annual precipitation compared to the 30-year mean. Conditions at this site were particularly dry in the year 2020 with about 40 percent of 30-year mean annual precipitation. Overall, the study period (2018–2020) was drier compared to the long-term average at all three sites (Supplementary Figures S1 and S2). During this period, temperatures were warmer at all sites except for the year 2019 when the mean annual temperatures were 0.8 °C and 0.6 °C lower than long term average at the mid- and high-elevation sites, respectively (Supplementary Figure S1). The role of mycorrhizae specific to ponderosa pine on early seedling survival and performance could not be addressed in our study.

2.2. Experimental Design and Plant Material

At each of the three sites, 1008 seedlings were planted in a randomized complete block design. At each site, seedlings were planted in 4 blocks, each consisting of one 12-tree linear plot for each provenance. The arrangement of provenance plots was randomized within each block. Spacing among seedlings was 1.2 m. Each of the 21 provenances was represented by 48 seedlings from between 3 and 6 mother trees or a pooled collection of seeds in cases where mother tree level information was not available (5 provenances). We planted a buffer row of ponderosa pine seedlings spaced at 1.2 m outside of the experimental trees to reduce potential edge effects. Existing vegetation within the fenced exclosures at the mid-and high-elevation sites was reduced using herbicide (Ranger Pro, Bayer Crop Science, Chesterfield, MO, USA) prior to planting. Herbicide was not needed at the low-elevation site due to sparse grass cover.
To produce the seedlings, seeds were sown in March 2018 in 164 mL containers (Ray Leach Cone-tainers SC10 Super, Stuewe & Sons, Inc., Tangent, OR, USA) at the John T. Harrington Forestry Research Center with New Mexico State University located in Mora, New Mexico. Seedlings were grown in the greenhouse nursery under standard operational protocols for approximately four months until planting in July 2018. Detailed greenhouse growing conditions, and seed and provenance information are described in [31].
The provenances were located over a gradient of elevation, temperature, and precipitation throughout Arizona and New Mexico (Table 1). Provenances ranged from ~1600 m to ~2800 m in elevation, 364 mm to 767 mm mean annual precipitation, and 5.7 °C to 14.2 °C mean annual temperature. Provenance elevation had a strong negative correlation with mean annual temperature (MAT) (r = −0.902, p < 0.0001) and a moderate positive correlation with mean annual precipitation (MAP) (r = 0.500, p = 0.020); provenance MAT and MAP had a moderate negative correlation (r = −0.434, p = 0.048). Latitude and MAT had a moderate negative trend (r = −0.406, p = 0.067) and longitude and elevation had a moderate positive trend (r = 0.370, p = 0.098).

2.3. Survival and Growth Measurements

At the mid- and high-elevation sites, survival was measured once every fall and summer between 2018 and 2020. Height and diameter at the soil surface (ground line diameter) were measured every fall (October or November) between 2018 and 2020. At the low-elevation site, survival was assessed once per week between August and September 2018. We did not measure growth at the low-elevation site due to complete lack of seedling survival by the end of fall 2018. Seedlings were classified as dead when they were 100 percent brown or were removed from planting locations by herbivores. We also observed and recorded potential causes of mortality and signs of mortality agents such as scats, gopher holes, and ant nesting.

2.4. Carbon Isotopic Discrimination

In November 2019 at the end of the second full growing season after planting, we collected current year true needles from between 7 and 13 seedlings from each provenance at each of the mid- and high-elevation sites. At each site, seedlings were selected for sampling from each provenance–block combination (row plot) using stratified random sampling. We used mother trees from each row plot as strata to ensure balanced sampling over all surviving mother trees. Provenance rows in some of the blocks had no survival, and thus, samples were not taken. For the 5 provenances without mother tree information, we randomly sampled 3 seedlings from each row plot per block. The needles were oven-dried (Sheldon Manufacturing, INC, Cronelius, OR) at 65 °C for 72 h and ground to homogenous powder using a ball mill grinder (Mixer Mill MM200, Retsch, Haan, Germany). The samples were analyzed for carbon stable isotopic composition at the Colorado Plateau Stable Isotope Laboratory at Northern Arizona University, Flagstaff, Arizona using a DELTA V Advantage isotope ratio mass spectrometer (Thermo Fisher Scientific, Waltham, MA, USA), which is configured through a Finnigan ConFlo III for automated continuous-flow analysis of δ13C using a Carlo-Erba NC2100 elemental analyzer for combustion and separation of carbon and nitrogen. Carbon isotope discrimination (∆13C) was calculated using the following equation [32] where δ13C is the isotopic ratio of 13C to 12C in needle tissues, and −0.008 is the approximate δ13C of atmospheric CO2, compared with the Pee Dee Belemnite standard.
Δ 13 C = 0.008 + [ ( δ 13 C ) / ( 1000 ) ] 1 [ ( δ 13 C ) / ( 1000 ) ] × 1000

2.5. Data Analyses

For seedling growth, we used a mixed-effects model with provenance, common garden site, and the interaction between provenance and site as fixed effects and blocks nested within sites as a random effect. We conducted the analyses on block-level provenance means and regarded the row plot of seedlings from same provenance within a block as the experimental unit. We used post hoc Tukey’s Honestly Significant Difference (HSD) comparison of means to evaluate significant common garden site and provenance differences (α = 0.05). Provenance effect on growth was not tested for the year 2020 due to very low survival at the high-elevation site at the end of the year. We used relative height growth to assess growth since planting calculated as: (Fall height—Height at planting)/Height at planting. We used survival analysis to assess the impact of common garden site on seedling survival between July 2018 and October 2020. All data approximated a normal distribution. The relationships between provenance traits and provenance environmental characteristics were evaluated on provenance means with correlation and regression analyses. We interpreted the strength of relationship based on the value of the correlation coefficient (r) as: weak between 0 and 0.3, moderate between 0.3 and 0.7, and strong between 0.7 and 1.0 [33]. JMP Pro version 14 (SAS Institute Inc., Cary, NC, USA) was used to perform all analyses.

3. Results

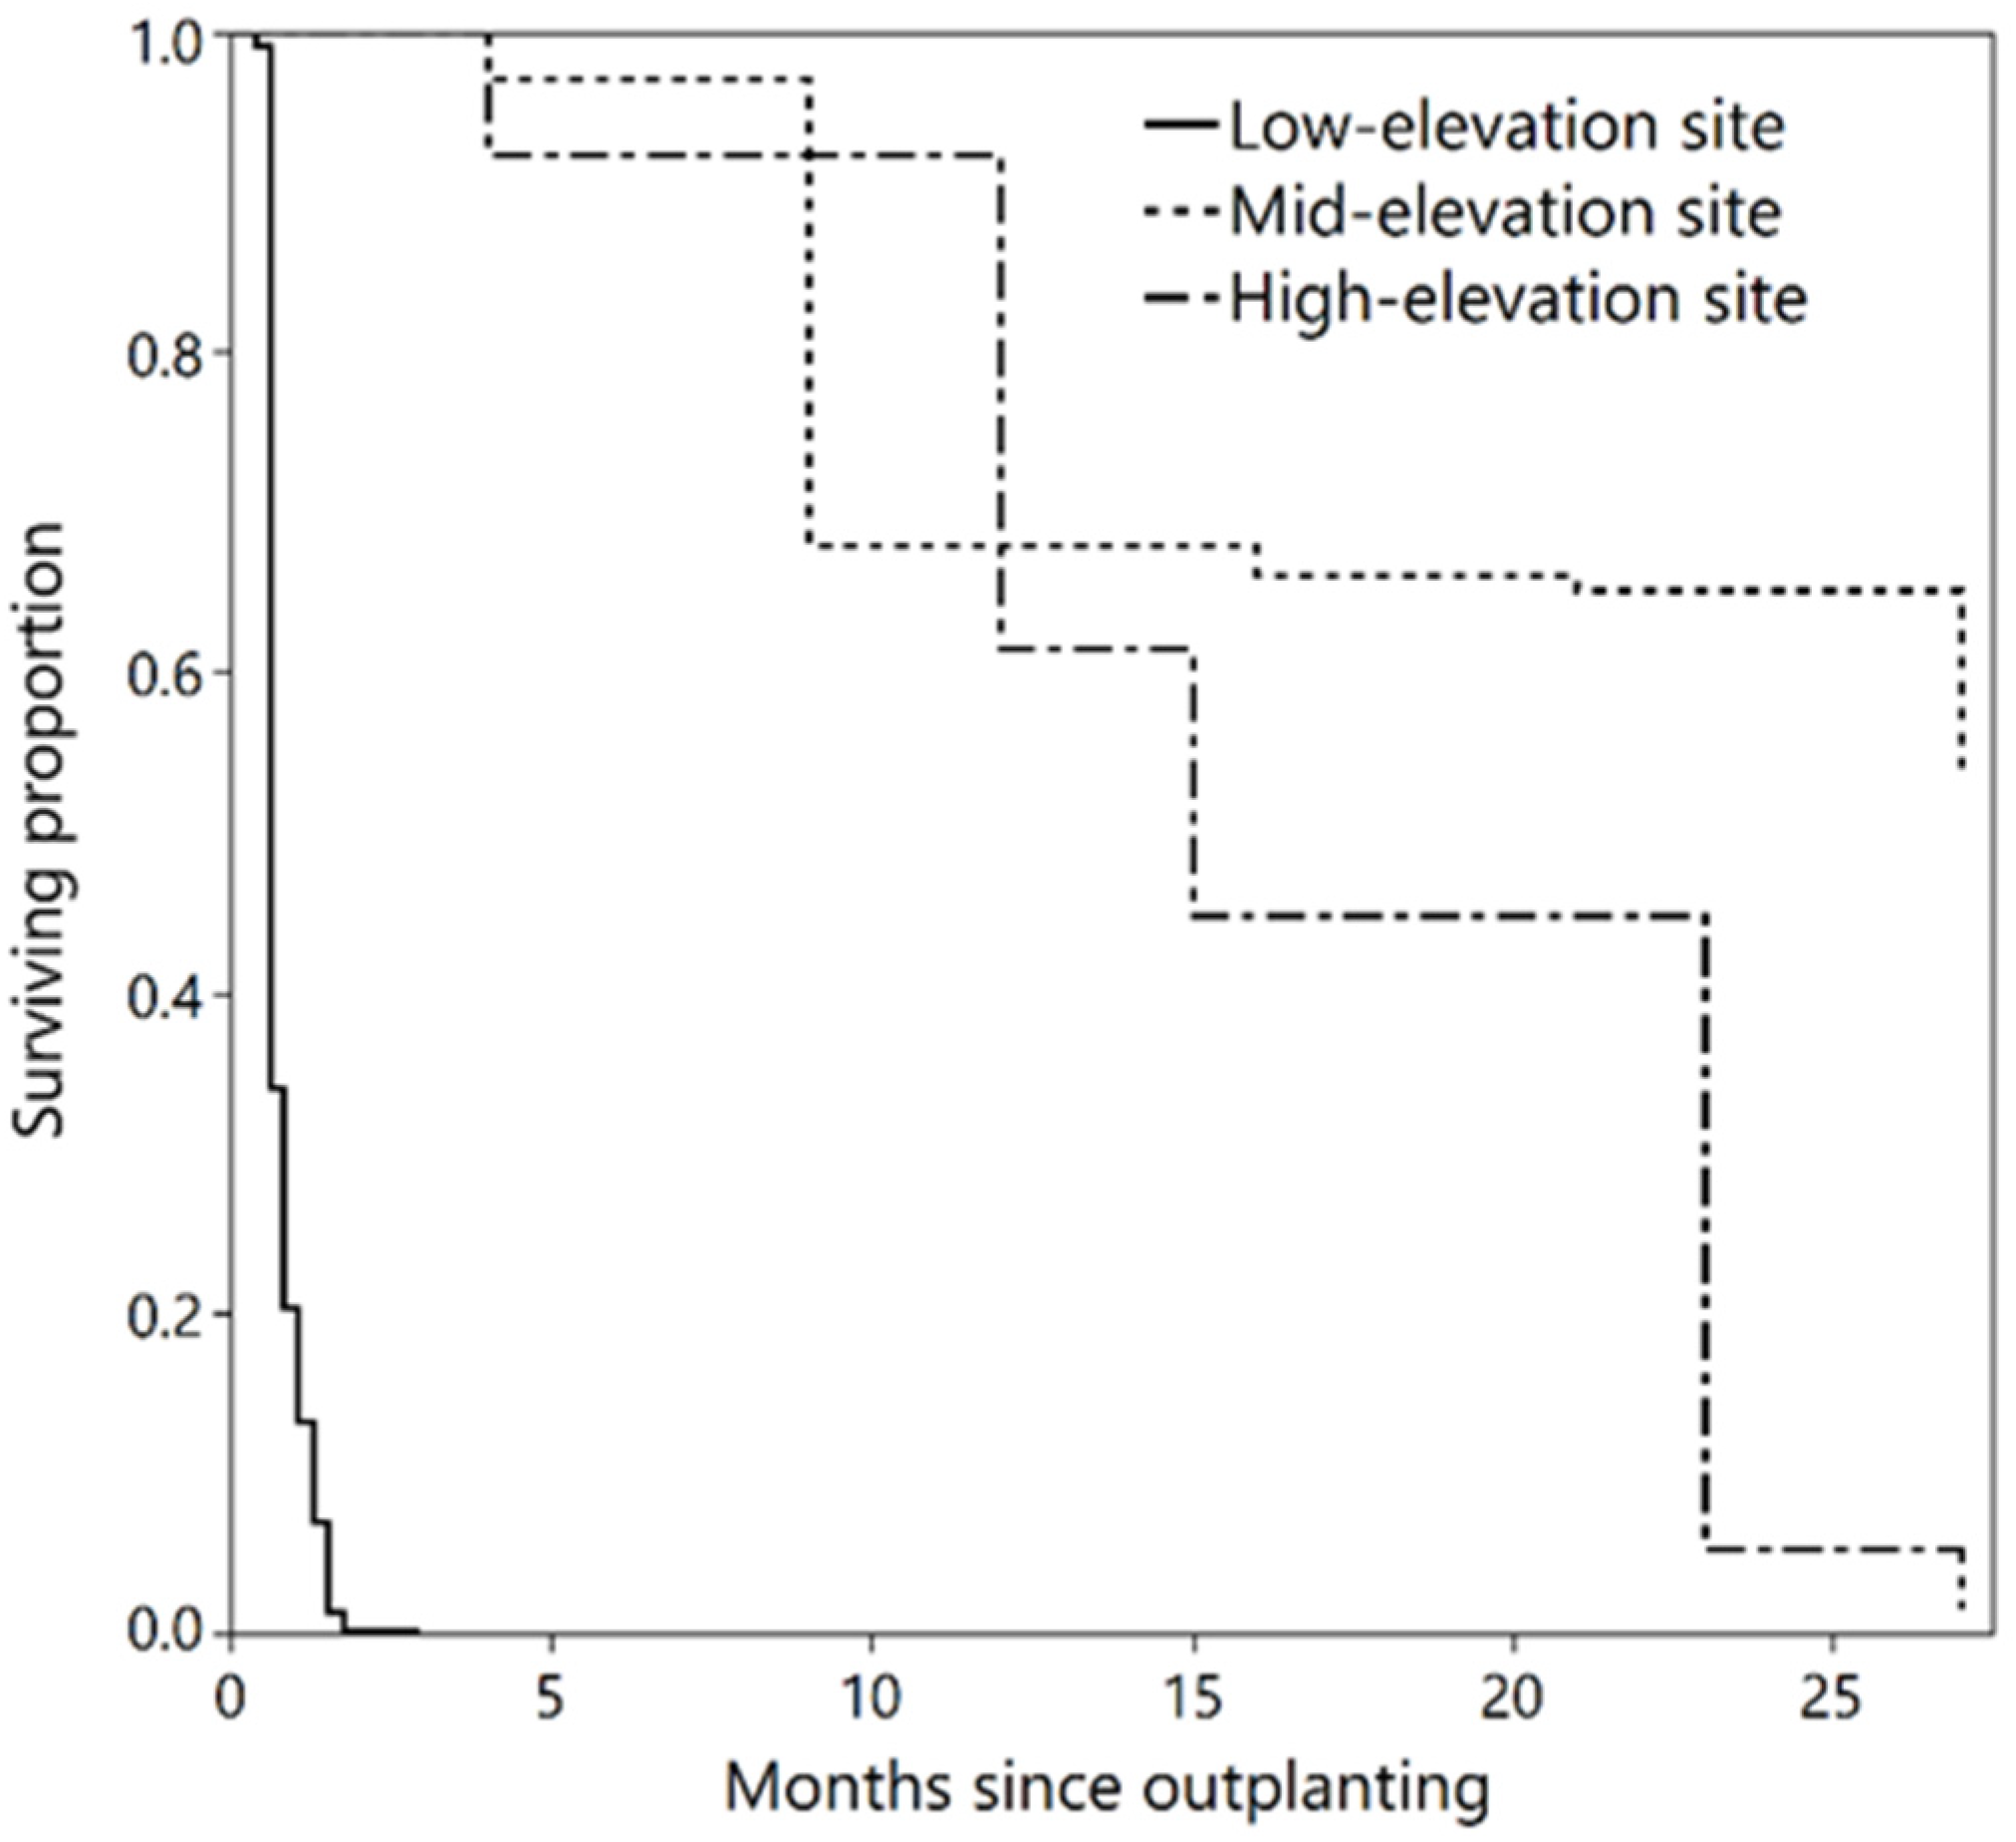
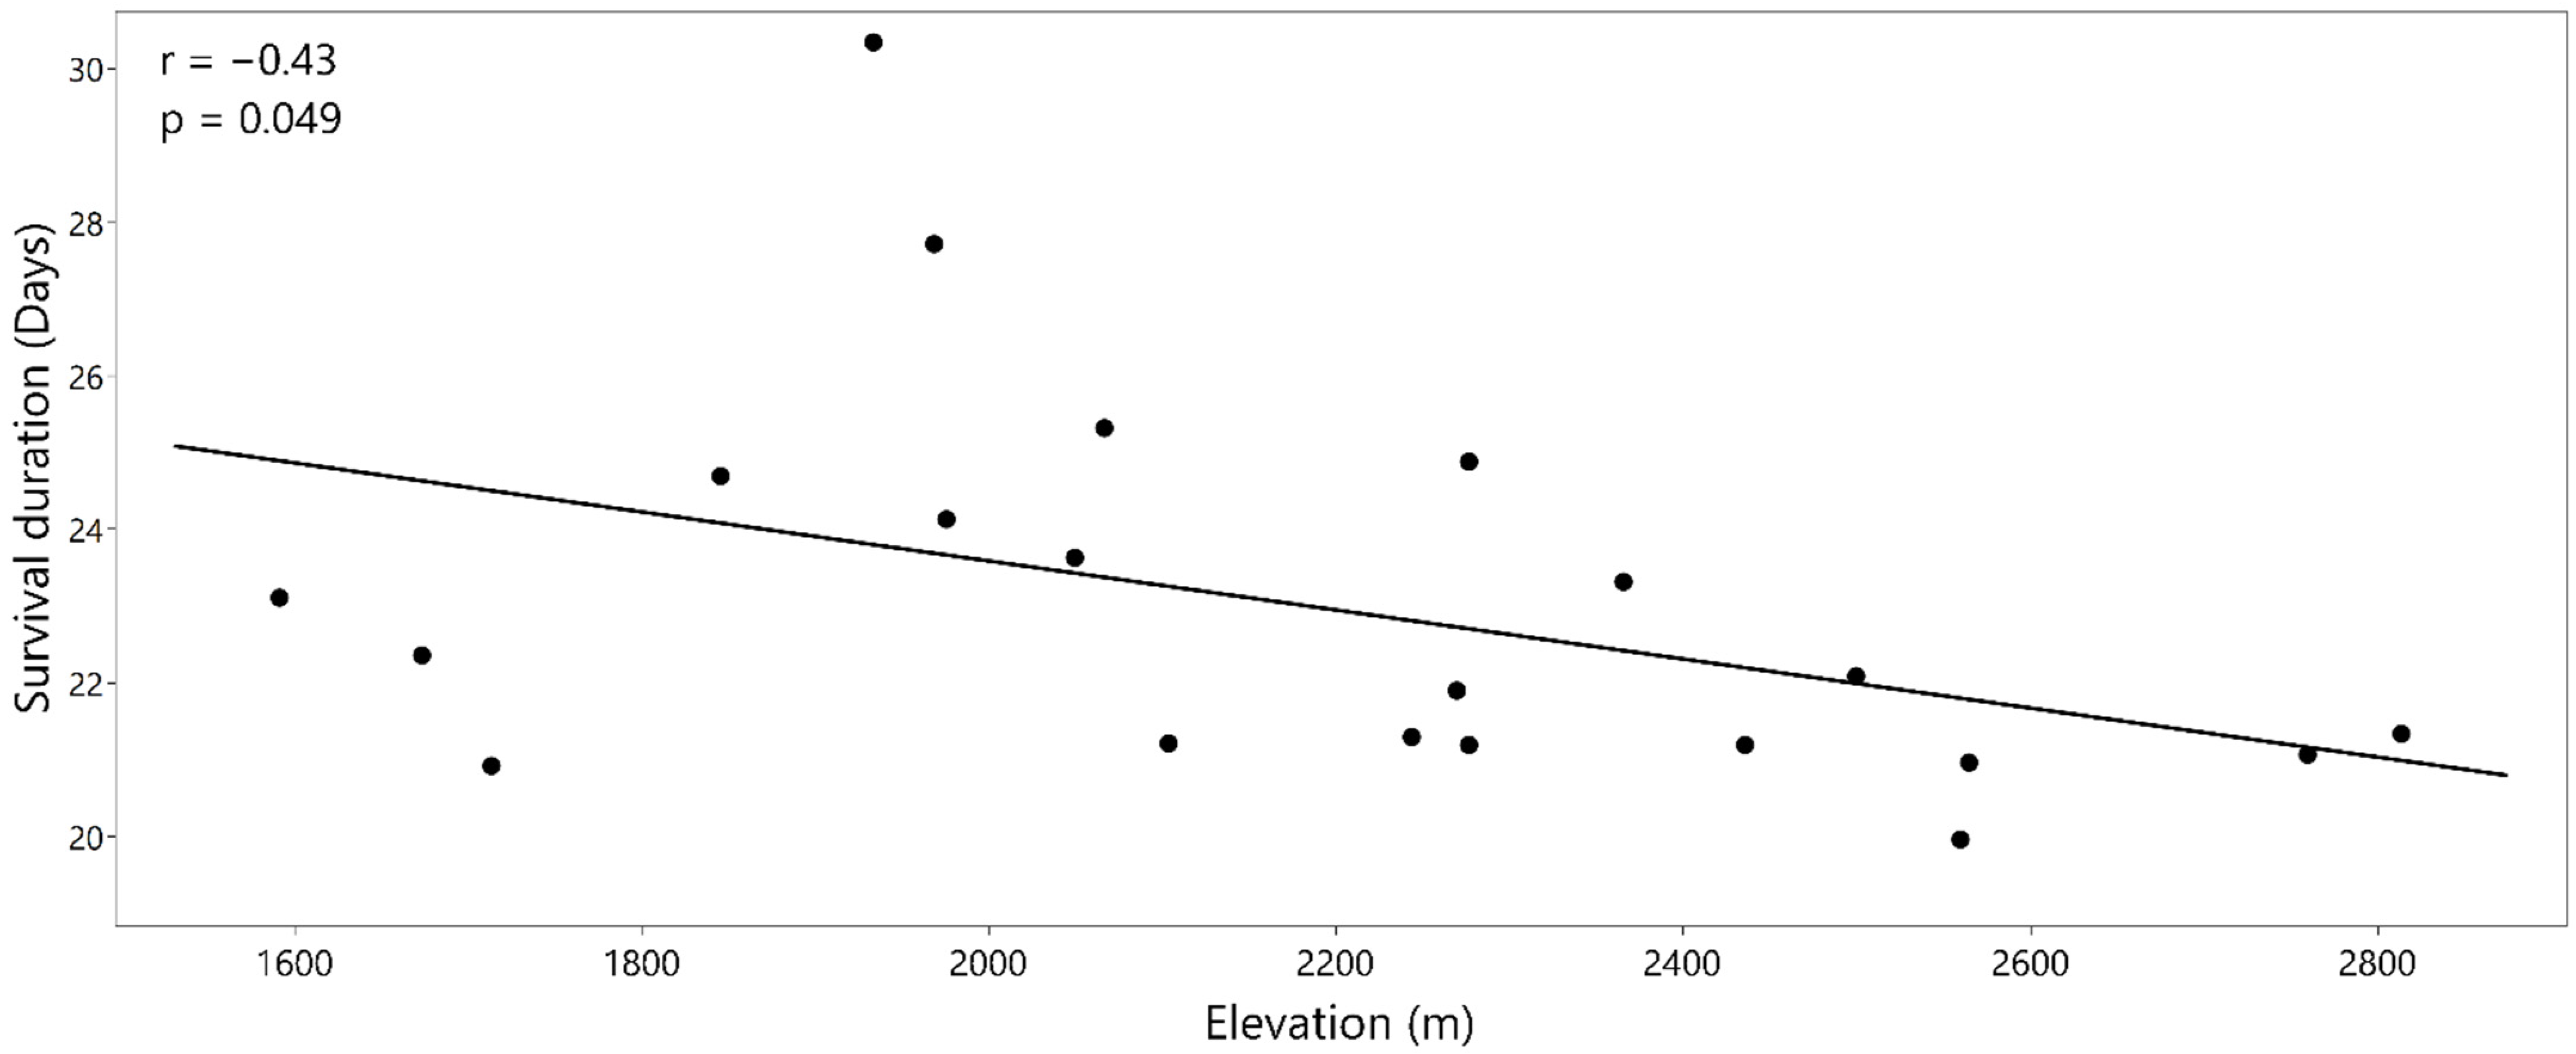
3.1. Survival Analyses
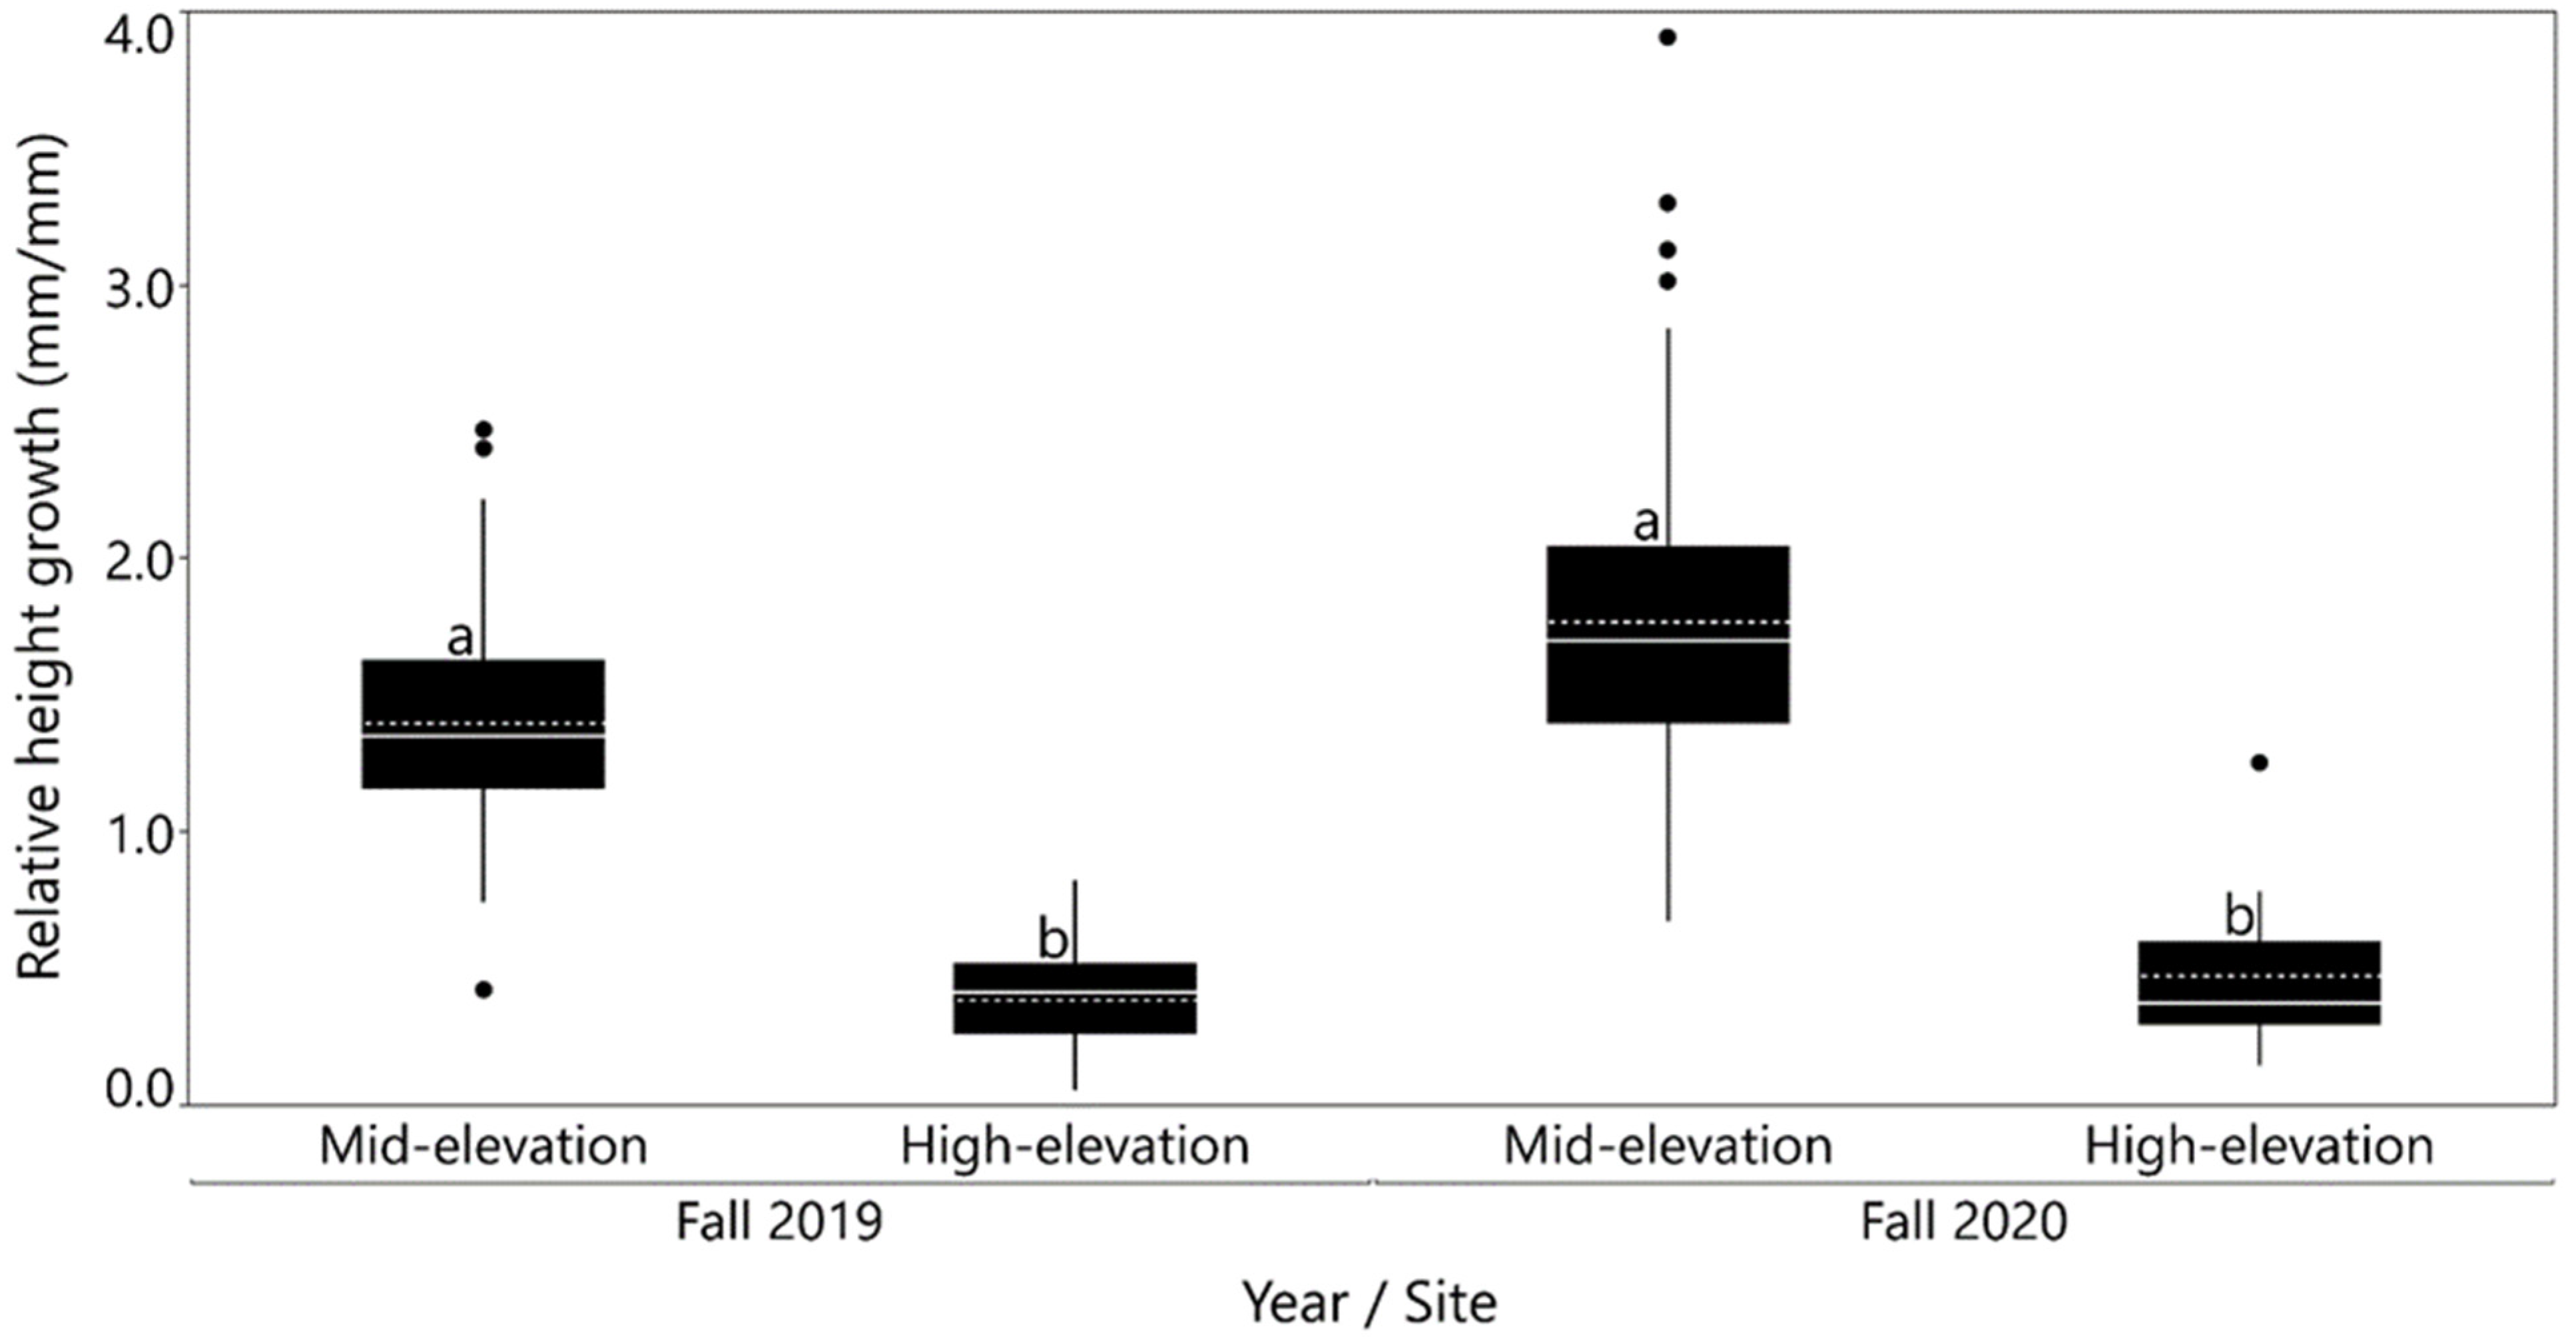
Early seedling survival differed significantly (p < 0.0001) among the three common garden sites (Figure 2). By fall 2020, survival at the mid-elevation site was much higher than the other two sites; 54 percent of the seedlings survived at the mid-elevation site compared to 1.5 and 0 percent at the high and low-elevation sites, respectively. Survival duration since outplanting at the low-elevation site differed significantly among provenances (p = 0.0006) and had a moderate negative correlation with provenance elevation (r = −0.43; p = 0.049; Figure 3). Most seedlings (80 percent) at the low-elevation site died in the first month after planting, and survival was 0 percent at the end of fall 2018. At the mid- and high-elevation sites, survival at the end of 2020 did not differ significantly among provenances (p = 0.600 and 0.058, respectively). Two major mortality events occurred at the mid-elevation site; summer 2019 (30 percent mortality) and fall 2020 (10 percent mortality). At the high-elevation site, survival decreased continuously between 2018 and 2020, with the largest decrease (40 percent) in summer 2020.
Mortality agents changed from abiotic to biotic factors with an increase in elevation over the site elevational gradient. At the low-elevation site, 99.7 percent of seedling mortality was attributed to desiccation (visually observed dry seedlings with intact roots). The only exception was herbivory-induced mortality of three seedlings that were planted close to ant colonies. At the mid-elevation site, important mortality agents were rabbit herbivory (~30 percent seedlings; obvious scat and feeding patterns) and desiccation (~10 percent seedlings). Rabbit herbivory occurred over an 8-week period in the first spring after planting (2019). At the high-elevation site, most seedling mortality (90 percent) was attributed to pocket gopher (Thomomys bottae) herbivory as evidenced by gopher holes, complete absence of seedlings, and seedlings with missing roots, with a smaller amount (10 percent) attributed to desiccation.

3.2. Growth

Provenances did not vary significantly in relative height growth between planting and fall 2019 (Table 2 and Table 3). However, relative height growth differed among planting sites for years 2019 and 2020 and was significantly higher at the mid-elevation site than the high-elevation site for both years (Figure 4). The provenance effect on growth was not tested for the year 2020 because only 1.5 percent of seedlings survived at the high-elevation site during that year. Site differences were consistent over provenances as indicated by the non-significant provenance x site interaction (Table 3).
Correlation analysis provided evidence of relationships between provenance environmental characteristics and site-specific growth traits (Table 4). At the mid-elevation site, 2019 relative height growth had a positive correlation with provenance elevation (r = 0.56; p = 0.007; Supplementary Figure S3) and provenance MAP (r = 0.54; p = 0.010), and a negative correlation with MAT (r = −0.51; p = 0.015). At the high-elevation site, 2019 GLD was correlated negatively with provenance latitude (r = −0.53; p = 0.014) and positively with provenance MAP (r = 0.60; p = 0.004).

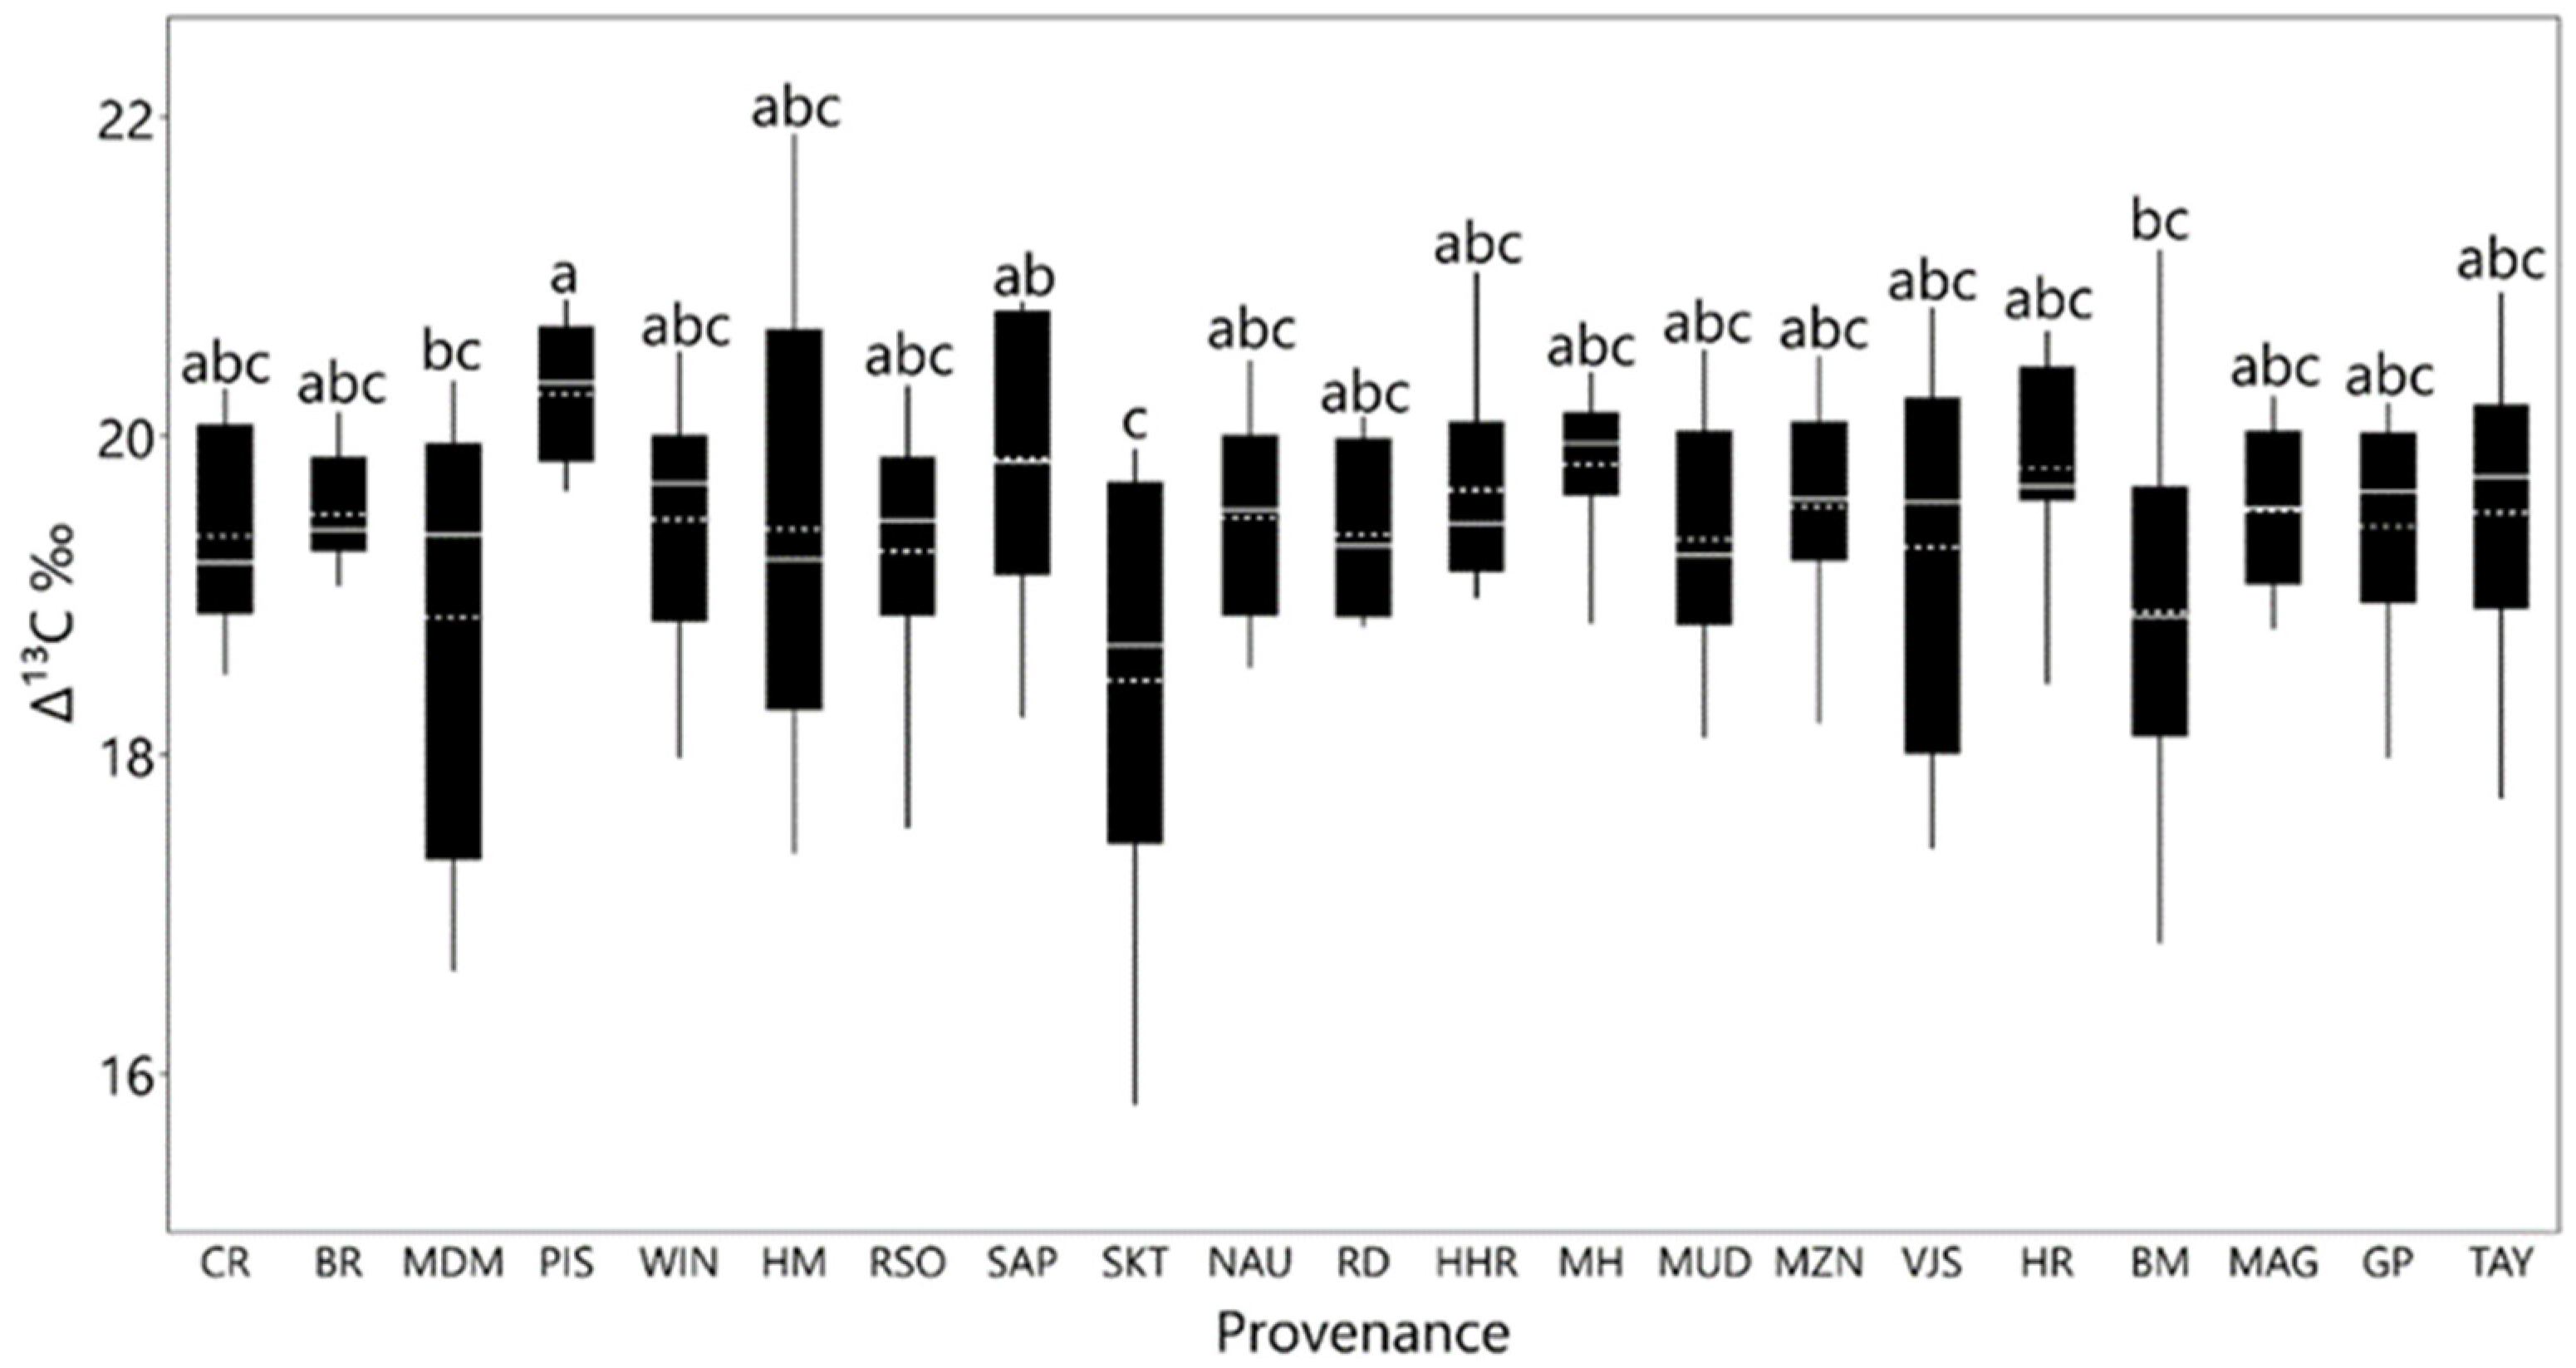
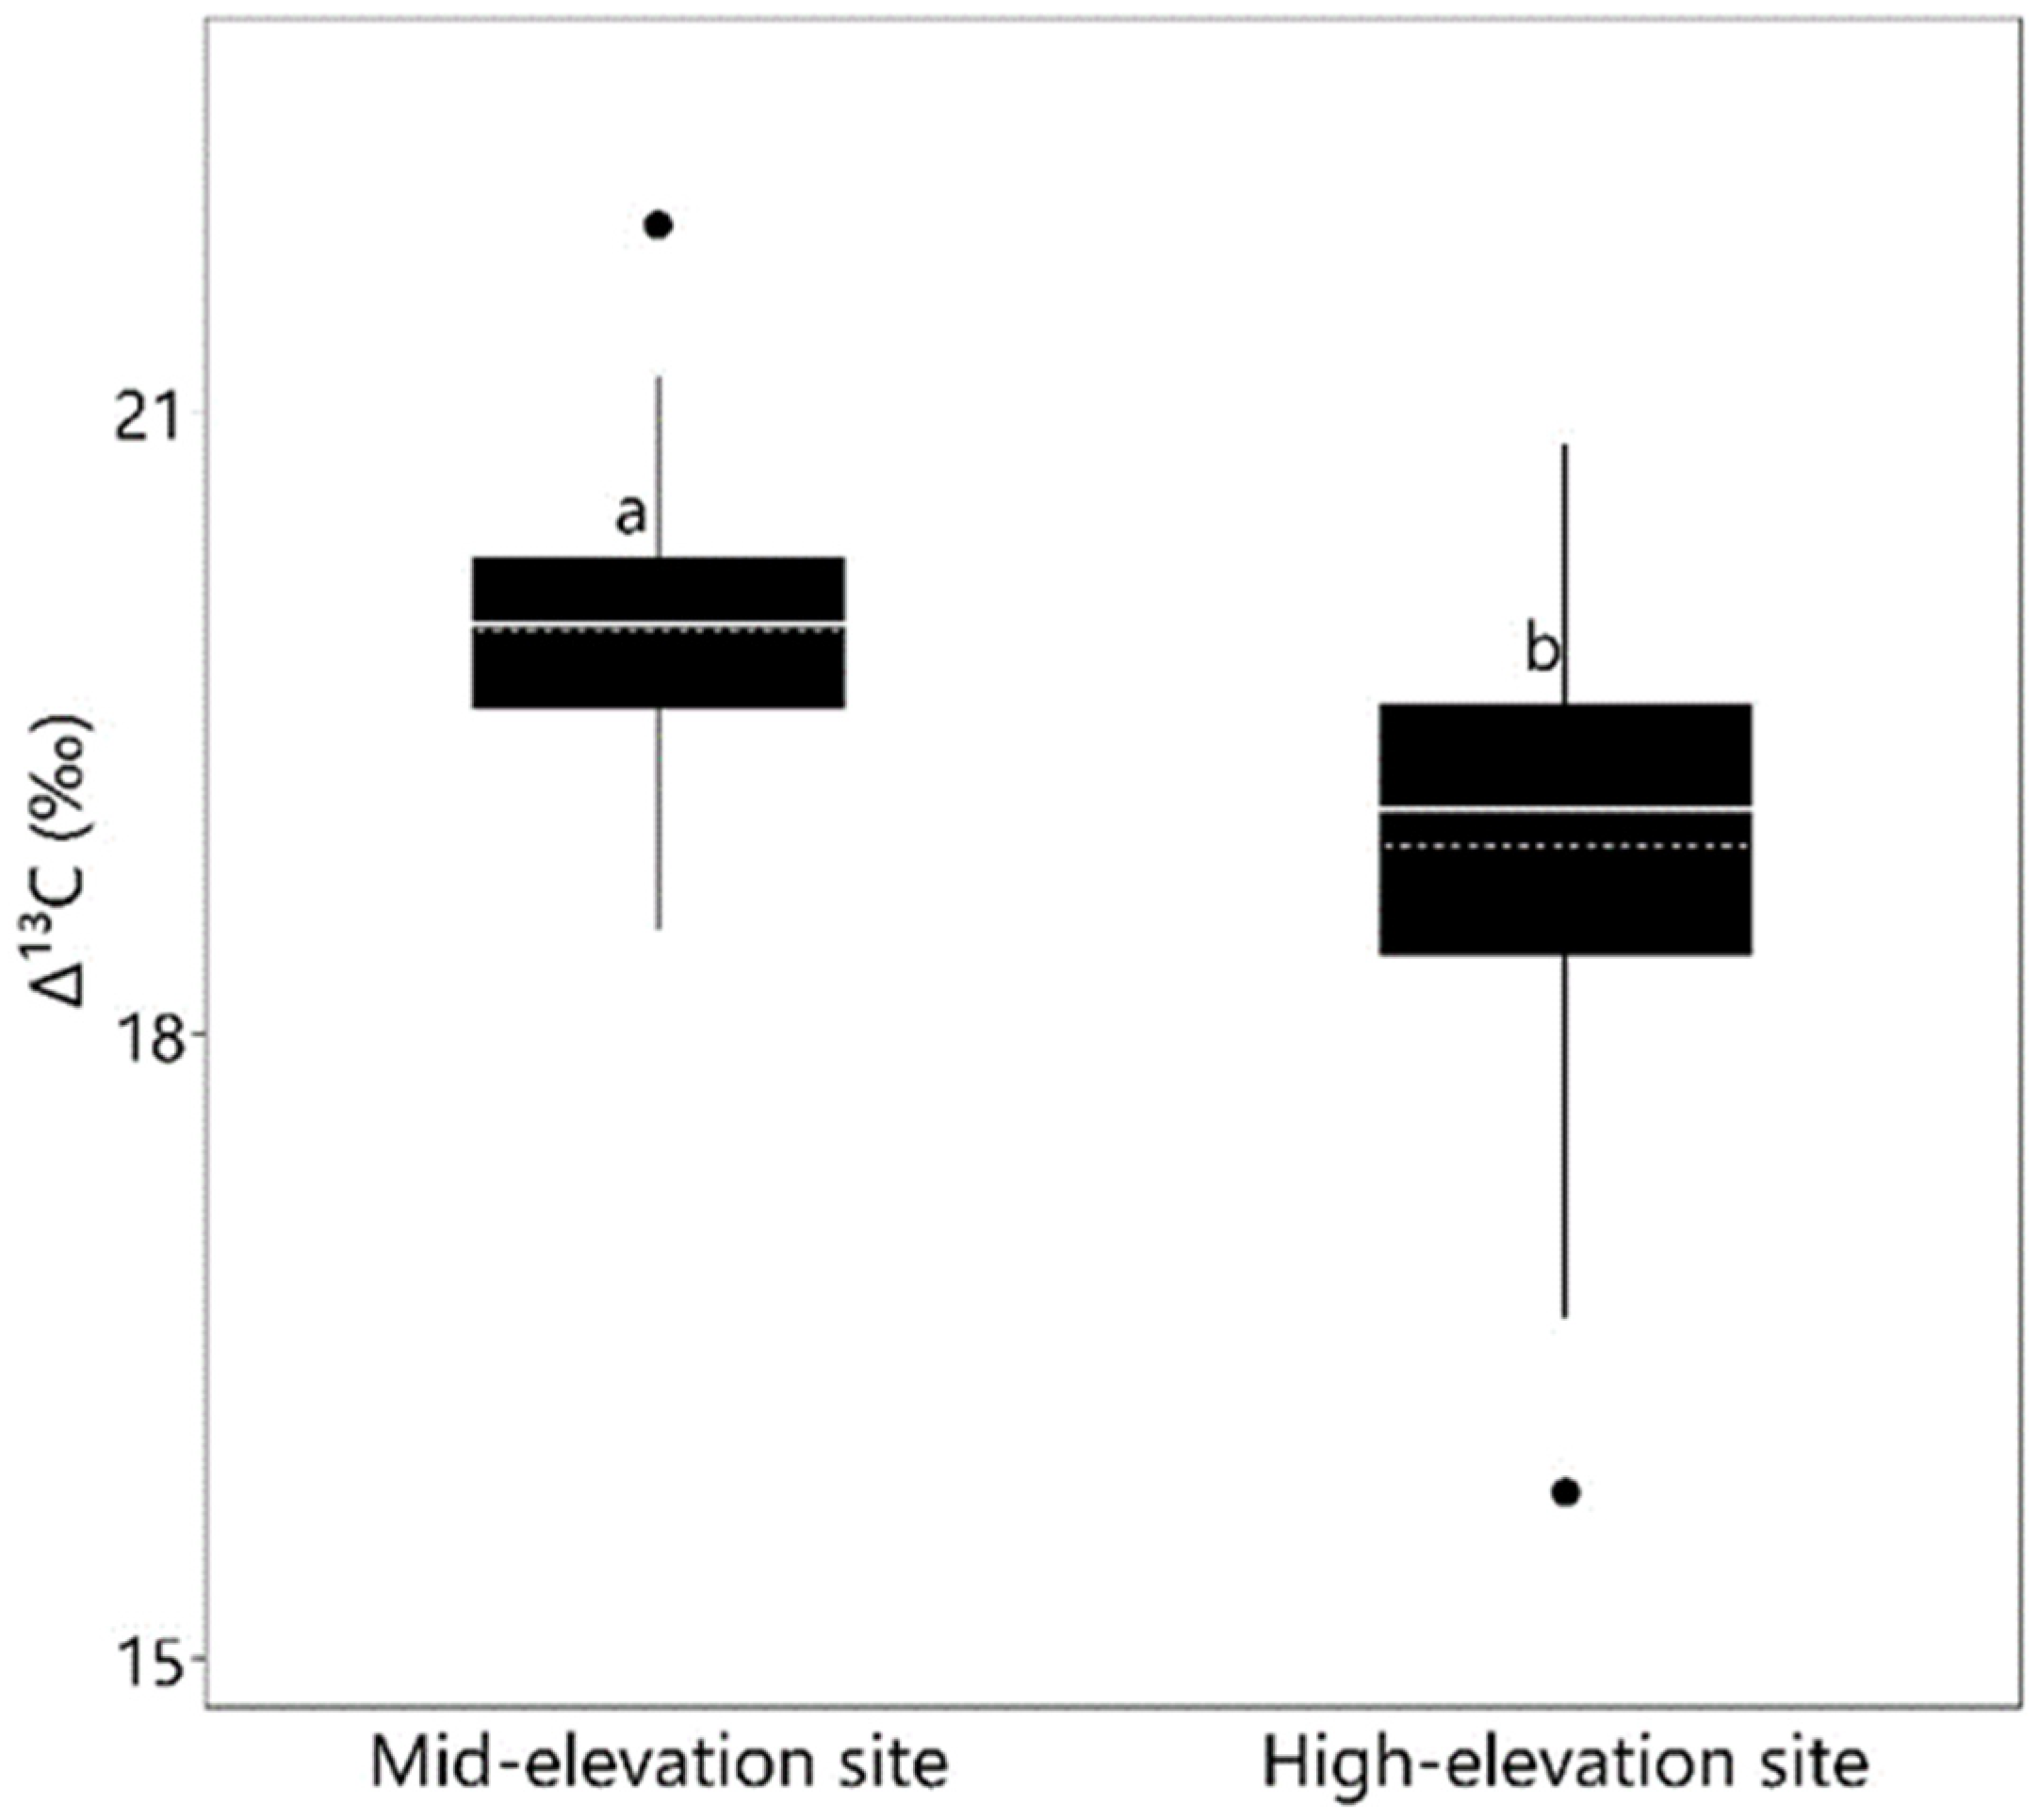
3.3. Carbon Isotope Discrimination

Provenances (p = 0.006; Figure 5) and common garden sites (p = 0.0001; Figure 6) varied significantly in ∆13C, whereas the provenance x site interaction was not significant (p = 0.239) (Table 3). ∆13C was about 1‰ higher in seedlings growing at the mid-elevation site compared with the high-elevation site (Figure 6). ∆13C ranged among provenances from 18.4 ‰ for SKT to 20.2 ‰ for PIS (Figure 5). Correlations between mean ∆13C and provenance environmental characteristics were weak and non-significant at the mid-elevation site. However, at the high-elevation site, provenance latitude had a moderate negative trend with ∆13C (r = −0.42; p = 0.054; Table 4).

4. Discussion

Our results show that early seedling survival was highest at the mid-elevation site in the core of the species current range and decreased substantially at sites outside the current range with no survival at the low-elevation site and almost none at the high-elevation site. Our finding of differences in survival among sites is similar to a recent report of significant site effects for survival of Jeffrey (Pinus jeffreyi Grev. & Balf.) and ponderosa pine (Pinus ponderosa Lawson & C. Lawson) seedlings planted at three different elevations in California [34]. In our study, the lowest survival occurred at the low-elevation site where almost all seedlings died within the first two months after planting due to desiccation. The ~2 °C warmer MAT of the low-elevation site than the mid-elevation site is an example of the future warmer climate in the current range of ponderosa pine in the southwestern United States by the end of this century [15]. Our result of 0 percent survival at this low-elevation site implies future challenges in successful planting of ponderosa pine within the core of its current geographical range due to high temperature and water stress. In the future, reforestation via planting might need to be timed with particularly wet years, if possible.
A general decline in survival duration with an increase in provenance elevation at the hot, low-elevation site (Figure 3) suggest better adaptation of low-elevation provenances to warmer and drier conditions. This result is consistent with a previous report of longer survival of ponderosa pine seedlings from provenances from arid locations under experimental drought in the greenhouse [24]. While we found a negative correlation between survival duration and provenance elevation, under extreme field conditions, it is important to note that no provenances successfully established at the low-elevation site. Ponderosa pine provenances from low-elevation and drier locations have been shown to have traits related to drought tolerance such as lower specific leaf area and higher growth allocation to roots [22,24]. These traits are one of the reasons that lower elevation or southern sources have been recommended for future planting to mitigate impacts of climate warming [11,12]. However, mechanisms of drought tolerance in such provenances are not fully understood and should be investigated in future studies.
At the mid- and high-elevation sites, the most important source of seedling mortality was herbivory followed by desiccation. Herbivory and drought have been recognized as major challenges in the outplanting success of nursery grown seedlings for reforestation [10,35]. Since the mid-elevation site was located in a ponderosa pine-dominated forest and in the core of current range in northern Arizona, high survival of planted seedlings was expected. However, at this site, ~30 percent of seedlings died due to rabbit herbivory. At the high-elevation site, gophers were the most important mortality agent, accounting for ~90 percent seedling mortality. Our findings of seedling mortality due to rabbits and gophers is consistent with ponderosa pine mortality agents previously reported [19]. However, the use of fences at our sites to prevent ungulate herbivory may have indirectly increased herbivory by small mammals due to restricted access of the fenced areas by predators [36]. As of fall 2020, about 10 percent of seedlings died due to desiccation at the mid- and high-elevation sites each. This could be attributed to the dry conditions in summer 2020 at both sites (Supplementary Figures S1 and S2). Overall, our results of high seedling mortality due to herbivory suggests severe biotic constraints to planting success at some high-elevation sites [37]. Future research should investigate the effectiveness of protective measures against herbivory such as tree shelters or tubes and if herbivory patterns can be spatially predicted [38,39,40].
Relative height growth differed significantly across sites with seedlings at the mid-elevation site growing faster than seedlings at high-elevation site (Figure 4). Seedling growth at the high-elevation site may have been limited by a shorter frost-free season and cooler temperatures compared with the mid-elevation site. At the mid-elevation site, provenances from high-elevation, cooler, and wetter areas had a higher relative height growth rate than low-elevation, warmer, and drier provenances. This result shows that high-elevation provenances can take advantage of warmer conditions, which in our study were created by planting these high-elevation provenances at the mid-elevation common garden site.
Results for leaf ∆13C suggest an increase in water use efficiency with increasing elevation of the planting site. Our results for ∆13C are consistent with Hultine and Marshall [41], which suggested that a decrease in ∆13C with increasing elevation may result from a decrease in stomatal conductance with elevation due to lower temperature. Our findings of a decrease in ∆13C with elevation of the planting site are similar to an earlier study of ten provenances of ponderosa pine growing at three sites in Nebraska [42]. We also found a significant provenance effect on ∆13C, which was mainly due to provenance SKT, which had the lowest ∆13C among all provenances across both sites; this provenance needs to be further investigated as it might be useful for future reforestation due to its high water use efficiency. Provenances from more southern latitudes had higher ∆13C and by inference lower water use efficiency than northern provenances at the high-elevation site. This latitudinal pattern is similar to a greenhouse study involving 21 provenances of Populus balsamifera L. [43], but differs from a common garden study of Pinus strobiformis seedlings [44]. This latitudinal pattern could result from local adaptation of provenances to abiotic or biotic factors that vary with geographic location, or perhaps are related to genetic variation among putative subspecies of ponderosa pine [45].
In summary, our results provide evidence of site and provenance effects on early survival and performance of planted southwestern ponderosa pine seedlings growing at different elevations. Our finding of longer survival of low-elevation provenances under dry, hot field conditions support previous recommendations for planting ponderosa pine provenances from lower elevations in a warming climate [12]. In addition to taking site environment and provenance origin into consideration, our study highlights the importance of accounting for mortality from biotic agents in reforestation projects [10], especially at high-elevation meadow sites [37]. Additional studies should focus on predicting the influence of biotic agents over a longer period of time and the interactions between abiotic and biotic stresses on seedling survival and performance [46]. Overall, our findings enhance understanding of constraints on the success of planted seedlings and thus inform strategies to maintain ponderosa pine during changing climate by active reforestation.

Supplementary Materials

The following are available online at https://www.mdpi.com/article/10.3390/f12111561/s1, Figure S1: Mean air temperature (°C) and Annual precipitation for the study period (2018–2020) compared to 30-year normals (1981–2010; https://prism.oregonstate.edu/, accessed on 19 September 2020). At each site, gaps in weather station data were included via PRISM, Figure S2: Monthly air temperature (°C) and precipitation for the study period (2018–2020) compared to 30-year normals (1981–2010; https://prism.oregonstate.edu/, accessed on 19 September 2020). Gaps in line represent unavailable data from weather stations, Figure S3: Relationship between relative height growth and provenance elevation at the mid-elevation site.

Author Contributions

Conceptualization, A.D., T.K., O.B., and K.M.; methodology, A.D., T.K., O.B., and K.M.; formal analysis, A.D.; resources, T.K., O.B., K.M., and K.G.; writing—original draft preparation, A.D.; writing—review and editing, T.K., O.B., K.M., and K.G.; supervision, T.K., O.B., K.M., and K.G.; funding acquisition, T.K., O.B., and K.M. All authors have read and agreed to the published version of the manuscript.

Funding

This material is based upon work supported by the McIntire-Stennis Program project accession numbers 1014222 and 1002447 from the USDA National Institute of Food and Agriculture and Utah State University Cedar Mountain Initiative. This work was also supported by the Utah Agricultural Experimental Station Project 1291, and this manuscript is UAES paper #9469.

Institutional Review Board Statement

Not applicable.

Informed Consent Statement

Not applicable.

Data Availability Statement

Data are available on request from the corresponding author.

Acknowledgments

The authors thank Philip Patterson and Adair Patterson (Northern Arizona University) for providing seeds, Kelsey Dixit (Coconino Community College) for help with data collection, and Tammy Parsons (New Mexico State University), Chris Updike (Northern Arizona University), Randall Violett (Southern Utah University), Zachary Ventrella (Northern Arizona University), and many volunteers for help with establishing the field study.

Conflicts of Interest

The authors declare no conflict of interest.

References

  1. Williams, A.P.; Allen, C.D.; Macalady, A.K.; Griffin, D.; Woodhouse, C.A.; Meko, D.M.; Swetnam, T.W.; Rauscher, S.A.; Seager, R.; Grissino-Mayer, H.D.; et al. Temperature as a potent driver of regional forest drought stress and tree mortality. Nat. Clim. Chang. 2012, 3, 292–297. [Google Scholar] [CrossRef]
  2. Hicke, J.A.; Meddens, A.J.H.; Kolden, C.A. Recent Tree Mortality in the Western United States from Bark Beetles and Forest Fires. For. Sci. 2016, 62, 141–153. [Google Scholar] [CrossRef]
  3. Savage, M.; Nystrom, M.J.F. Double whammy: High-severity fire and drought in ponderosa pine forests of the Southwest. Can. J. For. Res. 2013, 43, 570–583. [Google Scholar] [CrossRef]
  4. Rodman, K.C.; Veblen, T.T.; Chapman, T.B.; Rother, M.T.; Wion, A.P.; Redmond, M.D. Limitations to recovery following wildfire in dry forests of southern Colorado and northern New Mexico, USA. Ecol. Appl. 2020, 30, e02001. [Google Scholar] [CrossRef] [PubMed] [Green Version]
  5. Rehfeldt, G.E.; Crookston, N.L.; Warwell, M.V.; Evans, J.S. Empirical Analyses of Plant-Climate Relationships for the Western United States. Int. J. Plant Sci. 2006, 167, 1123–1150. [Google Scholar] [CrossRef]
  6. Allen, C.D.; Breshears, D.D. Drought-induced shift of a forest–woodland ecotone: Rapid landscape response to climate variation. Proc. Natl. Acad. Sci. USA 1998, 95, 14839–14842. [Google Scholar] [CrossRef] [Green Version]
  7. Minott, J.A.; Kolb, T.E. Regeneration patterns reveal contraction of ponderosa forests and little upward migration of pinyon-juniper woodlands. For. Ecol. Manag. 2020, 458, 117640. [Google Scholar] [CrossRef]
  8. Petrie, M.D.; Bradford, J.B.; Hubbard, R.M.; Lauenroth, W.K.; Andrews, C.M.; Schlaepfer, D.R. Climate change may restrict dryland forest regeneration in the 21st century. Ecology 2017, 98, 1548–1559. [Google Scholar] [CrossRef]
  9. Kolb, T.E.; Dixit, A.H.; Burney, O. Challenges and opportunities for maintaining ponderosa pine forests in the southwestern United States. Tree Plant. Note 2019, 62, 104–112. [Google Scholar]
  10. Fargione, J.; Haase, D.L.; Burney, O.T.; Kildisheva, O.A.; Edge, G.; Cook-Patton, S.C.; Chapman, T.; Rempel, A.; Hurteau, M.D.; Davis, K.T.; et al. Challenges to the Reforestation Pipeline in the United States. Front. For. Glob. Chang. 2021, 4, 8. [Google Scholar] [CrossRef]
  11. Williams, M.I.; Dumroese, R.K. Preparing for Climate Change: Forestry and Assisted Migration. J. For. 2013, 111, 287–297. [Google Scholar] [CrossRef]
  12. Rehfeldt, G.E.; Jaquish, B.C.; Sáenz-Romero, C.; Joyce, D.G.; Leites, L.P.; Bradley St Clair, J.; López-Upton, J. Comparative genetic responses to climate in the varieties of Pinus ponderosa and Pseudotsuga menziesii: Reforestation. For. Ecol. Manag. 2014, 1324, 47–157. [Google Scholar] [CrossRef]
  13. Aitken, S.N.; Yeaman, S.; Holliday, J.A.; Wang, T.; Curtis-McLane, S. Adaptation, migration or extirpation: Climate change outcomes for tree populations. Evol. Appl. 2008, 1, 95–111. [Google Scholar] [CrossRef] [PubMed]
  14. Kremer, A.; Ronce, O.; Robledo-Arnuncio, J.J.; Guillaume, F.; Bohrer, G.; Nathan, R.; Bridle, J.R.; Gomulkiewicz, R.; Klein, E.K.; Ritland, K.; et al. Long-distance gene flow and adaptation of forest trees to rapid climate change. Ecol. Lett. 2012, 15, 378–392. [Google Scholar] [CrossRef] [PubMed] [Green Version]
  15. Garfin, A.; Jardine, A.; Merideth, R.; Black, M.; LeRoy, S. Assessment of Climate Change in the Southwest United States: A Report Prepared for the National Climate Assessment; Island Press: Washington, DC, USA, 2013; 531p. [Google Scholar]
  16. Grady, K.C.; Kolb, T.E.; Ikeda, D.H.; Whitham, T.G. A bridge too far: Cold and pathogen constraints to assisted migration of riparian forests. Restor. Ecol. 2015, 23, 811–820. [Google Scholar] [CrossRef]
  17. Bucharova, A. Assisted migration within species range ignores biotic interactions and lacks evidence. Restor. Ecol. 2017, 25, 14–18. [Google Scholar] [CrossRef]
  18. Pearson, G.A. Management of Ponderosa Pine in the Southwest; Agriculture Monograph No. 6; U.S. Department of Agriculture, Forest Service: Washington, DC, USA, 1950; 218p.
  19. Schubert, G.H.; Heidmann, L.J.; Larson, M.M. Artificial Reforestation Practices for the Southwest; U.S. Department of Agriculture, Handbook: Washington, DC, USA, 1970; Volume 370, 25p.
  20. Kolb, T.E.; Flathers, K.; Bradford, J.B.; Andrews, C.; Asherin, L.A.; Moser, W.K. Stand density, drought, and herbivory constrain ponderosa pine regeneration pulse. Can. J. For. Res. 2020, 50, 862–871. [Google Scholar] [CrossRef]
  21. Rehfeldt, G.E. Genetic Variation in the Ponderosae of the Southwest. Am. J. Bot. 1993, 80, 330–343. [Google Scholar] [CrossRef]
  22. Dixit, A.; Kolb, T. Variation in seedling budburst phenology and structural traits among southwestern ponderosa pine provenances. Can. J. For. Research 2020, 50, 872–879. [Google Scholar] [CrossRef]
  23. Alberto, F.J.; Aitken, S.N.; Alía, R.; González-Martínez, S.C.; Hänninen, H.; Kremer, A.; Lefèvre, F.; Lenormand, T.; Yeaman, S.; Whetten, R.; et al. Potential for evolutionary responses to climate change—Evidence from tree populations. Glob. Chang. Biol. 2013, 19, 1645–1661. [Google Scholar] [CrossRef] [Green Version]
  24. Kolb, T.E.; Grady, K.C.; McEttrick, M.P.; Herrero, A. Local-Scale Drought Adaptation of Ponderosa Pine Seedlings at Habitat Ecotones. For. Sci. 2016, 62, 641–651. [Google Scholar] [CrossRef]
  25. Kerr, K.L.; Meinzer, F.C.; McCulloh, K.A.; Woodruff, D.R.; Marias, D.E. Expression of functional traits during seedling establishment in two populations of Pinus ponderosa from contrasting climates. Tree Physiol. 2015, 35, 535–548. [Google Scholar] [CrossRef] [Green Version]
  26. Moran, E.; Lauder, J.; Musser, C.; Stathos, A.; Shu, M. The genetics of drought tolerance in conifers. New Phytol. 2017, 216, 1034–1048. [Google Scholar] [CrossRef] [Green Version]
  27. Farquhar, G.D.; O’Leary, M.H.; Berry, J.A. On the Relationship Between Carbon Isotope Discrimination and the Intercellular Carbon Dioxide Concentration in Leaves. Funct. Plant Biol. 1982, 9, 121–137. [Google Scholar] [CrossRef]
  28. Cregg, B.M.; Olivas-García, J.M.; Hennessey, T.C. Provenance variation in carbon isotope discrimination of mature ponderosa pine trees at two locations in the Great Plains. Can. J. For. Res. 2000, 30, 428–439. [Google Scholar] [CrossRef]
  29. Olivas-García, J.M.; Cregg, B.M.; Hennessey, T.C. Genotypic variation in carbon isotope discrimination and gas exchange of ponderosa pine seedlings under two levels of water stress. Can. J. For. Res. 2000, 30, 10. [Google Scholar] [CrossRef]
  30. Howe, A.A.; Landhäusser, S.M.; Burney, O.T.; Long, J.N.; Violett, R.D.; Mock, K.E. Exploring seedling-based aspen (Populus tremuloides) restoration near range limits in the Intermountain West, USA. For. Ecol. Manag. 2020, 476, 118470. [Google Scholar] [CrossRef]
  31. Dixit, A.; Kolb, T.; Burney, O. Provenance Geographical and Climatic Characteristics Influence Budburst Phenology of Southwestern Ponderosa Pine Seedlings. Forests 2020, 11, 1067. [Google Scholar] [CrossRef]
  32. Farquhar, G.D.; Ehleringer, J.R.; Hubick, K.T. Carbon Isotope Discrimination and Photosynthesis. Annu. Rev. Plant Physiol. Plant Mol. Biol. 1989, 40, 503–537. [Google Scholar] [CrossRef]
  33. Ratner, B. The correlation coefficient: Its values range between +1/−1, or do they? J. Target Meas. Anal. Mark. 2009, 17, 139–142. [Google Scholar] [CrossRef] [Green Version]
  34. Martínez-Berdeja, A.; Hamilton, J.A.; Bontemps, A.; Schmitt, J.; Wright, J.W. Evidence for population differentiation among Jeffrey and Ponderosa pines in survival, growth and phenology. For. Ecol. Manag. 2019, 434, 40–48. [Google Scholar] [CrossRef]
  35. Burney, O.T.; Jacobs, D.F. Ungulate herbivory of boreal and temperate forest regeneration in relation to seedling mineral nutrition and secondary metabolites. New For. 2013, 44, 753–768. [Google Scholar] [CrossRef]
  36. Shepperd, W.D.; Mata, S.A. Planting Aspen to Rehabilitate Riparian Areas: A Pilot Study; United States Department of Agriculture, Forest Service, Rocky Mountain Research Station: Fort Collins, CO, USA, 2005.
  37. Howe, A.A. Assessment of a Seedling-Based Approach to Aspen Restoration in the Intermountain West. Ph.D. Thesis, Utah State University, Logan, UT, USA, 2018. Available online: https://digitalcommons.usu.edu/etd/7062 (accessed on 4 November 2021).
  38. Oliet, J.A.; Blasco, R.; Valenzuela, P.; de Blas, M.M.; Puértolas, J. Should we use meshes or solid tube shelters when planting in Mediterranean semiarid environments? New For. 2019, 50, 267–282. [Google Scholar] [CrossRef]
  39. Engemann, R.M.; Anthony, R.M.; Barnes, V.G., Jr.; Krupa, H.W.; Evans, J. Evaluations of plastic mesh tubes for protecting conifer seedlings from pocket gophers in three western States. West. J. Appl. For. 1999, 14, 86–90. [Google Scholar] [CrossRef] [Green Version]
  40. Taylor, T.S.; Loewenstein, E.F.; Chappelka, A.H. Effect of animal browse protection and fertilizer application on the establishment of planted Nuttall oak seedlings. New For. 2006, 32, 133–143. [Google Scholar] [CrossRef]
  41. Hultine, K.R.; Marshall, J.D. Altitude trends in conifer leaf morphology and stable carbon isotope composition. Oecologia 2000, 123, 32–40. [Google Scholar] [CrossRef]
  42. Zhang, J.; Cregg, B.M. Growth and physiological responses to varied environments among populations of Pinus ponderosa. For. Ecol. Manag. 2005, 219, 1–12. [Google Scholar] [CrossRef]
  43. Soolanayakanahally, R.Y.; Guy, R.D.; Silim, S.N.; Drewes, E.C.; Schroeder, W.R. Enhanced assimilation rate and water use efficiency with latitude through increased photosynthetic capacity and internal conductance in balsam poplar (Populus balsamifera L.). Plant Cell Environ. 2009, 32, 1821–1832. [Google Scholar] [CrossRef]
  44. Goodrich, B.A.; Waring, K.M.; Kolb, T.E. Genetic variation in Pinus strobiformis growth and drought tolerance from southwestern US populations. Tree Physiol. 2016, 36, 1219–1235. [Google Scholar] [CrossRef]
  45. Willyard, A.; Gernandt, D.S.; Potter, K.; Hipkins, V.; Marquardt, P.; Mahalovich, M.F.; Langer, S.K.; Telewski, F.W.; Cooper, B.; Douglas, C.; et al. Pinus ponderosa: A checkered past obscured four species. Am. J. Bot. 2017, 104, 161–181. [Google Scholar] [CrossRef] [Green Version]
  46. Sáenz-Romero, C.; O’Neill, G.; Aitken, S.N.; Lindig-Cisneros, R. Assisted Migration Field Tests in Canada and Mexico: Lessons, Limitations, and Challenges. Forests 2021, 12, 9. [Google Scholar] [CrossRef]
Figure 1. Location map of the 21 provenance collection sites and the location of the three field common gardens.
Forests 12 01561 g001
Figure 2. Surviving proportion of ponderosa pine seedlings at the three common garden sites over 27 months (July 2018 to October 2020).
Forests 12 01561 g002
Figure 3. Relationship between mean survival duration since outplanting and provenance elevation (m) at the low-elevation site.
Forests 12 01561 g003
Figure 4. Relative height growth by planting sites (pooled over provenances) for 2019 and 2020. Dashed lines are mean and solid lines are the median. Means followed by the same letter do not differ significantly (Tukey’s HSD tests; α = 0.05).
Forests 12 01561 g004
Figure 5. Leaf carbon isotope discrimination (∆13C) by provenance averaged over the mid and high elevation sites (Ordered by elevation). Dashed lines are mean and solid lines are the median. Means followed by the same letter do not differ significantly (Tukey’s HSD tests; α = 0.05).
Forests 12 01561 g005
Figure 6. Leaf carbon isotope discrimination (∆13C) averaged over all provenances by planting site. Dashed lines are mean, and solid lines are the median. Means followed by the same letter do not differ significantly (Tukey’s HSD tests; α = 0.05).
Forests 12 01561 g006
Table 1. Name (code), latitude, longitude, elevation (m a.s.l.), mean annual temperature (MAT), and mean annual precipitation (MAP) for provenances and common garden sites, ordered by increasing elevation. Climate data (30 year normal, 1981–2010) are from PRISM (PRISM Climate Group, Oregon State University, http://prism.oregonstate.edu, created 19 September 2020). Values are means over mother tree locations at each provenance.
Latitude/LongitudeElevation (m)MAT (°C)MAP (mm)
Provenance (code)
Cherry Road (CR)34.586/–112.057159214.2408
Blue River (BR)33.555/–109.193167411.8581
Mesa Del Medio (MDM)35.116/–105.217171412.3397
Prescott—Iron Springs Road (PIS)34.585/–112.559184611.0546
Townsend Winona (WIN)35.254/–111.415193410.2398
Hualapai Mountains (HM)35.084/–113.875196911.5403
Ruidoso Service Office (RSO)33.350/–105.583197611.1506
Sapello Rt. 3 (SAP)35.700/–105.25020509.8456
South Kaibab Tusayan Dist. (SKT)35.939/–112.08420678.9410
Northern Arizona University (NAU)35.182/–111.65521048.4540
Rim District (RD)34.487/–111.34322449.4767
HH Ranch (HHR)34.183/–107.52522709.2364
Mineral Hill (MH)35.633/–105.46122778.5528
Mud Springs (MUD)36.463/–106.85922776.9443
Manzano Mountains (MZN)34.623/–106.40023668.6638
Vallecitos-Jemez Springs (VJS)35.809/–106.58924366.8571
Hartman Ridge (HR)35.550/–105.53325008.8526
Borrego Mesa (BM)35.990/–105.79425606.3470
Magdalena Mountains (MAG)34.006/–107.21525658.9512
Green’s Peak (GP)34.126/–109.53527605.7671
Mount Taylor (TAY)35.266/–107.63328146.1722
Common Garden Site
Low-elevation35.586/–111.96919309.7482
Mid-elevation35.160/–111.73022007.6556
High-elevation 37.620/–113.02527804.9685
Table 2. Provenance relative height growth ((Fall 2019 height—Height at planting)/Height at planting) and ground line diameter (GLD) at mid- and high-elevation sites (ordered by increasing elevation). Values are means (1 SE); NA indicates SE not calculated due to low survival in most blocks. Means in the same column followed by the same letters do not differ significantly (Tukey’s HSD tests; α = 0.05).
ProvenanceFall 2019 Relative Height Growth (mm/mm)Fall 2019 GLD (mm)
Mid-elevation site
CR1.0 (0.1) a7.66 (0.41) a
BR1.3 (0.2) a7.96 (0.45) a
MDM1.2 (0.0) a6.24 (0.06) a
PIS1.4 (0.0) a7.27 (0.23) a
WIN1.3 (0.0) a7.53 (0.45) a
HM1.5 (0.1) a7.00 (0.31) a
RSO1.4 (0.2) a7.38 (0.33) a
SAP1.4 (0.1) a7.21 (0.21) a
SKT1.0 (0.0) a7.80 (0.23) a
NAU1.1 (0.1) a7.75 (0.34) a
RD1.6 (0.1) a8.46 (0.45) a
HHR1.2 (0.0) a7.49 (0.20) a
MH1.5 (0.1) a7.55 (0.46) a
MUD1.4 (0.2) a6.50 (0.25) a
MZN1.2 (0.2) a7.86 (0.36) a
VJS1.3 (0.1) a7.90 (0.24) a
HR1.5 (0.2) a7.80 (0.22) a
BM1.6 (0.2) a7.41 (0.32) a
MAG1.1 (0.1) a6.40 (0.52) a
GP1.7 (0.3) a7.45 (0.58) a
TAY1.7 (0.1) a7.19 (0.19) a
High-elevation site
CR0.08 (NA) a5.15 (NA) ab
BR0.3 (0.0) a5.32 (0.01) ab
MDM0.3 (0.1) a4.46 (0.20) ab
PIS0.4 (0.0) a5.39 (0.26) ab
WIN0.5 (0.0) a5.58 (0.59) ab
HM0.3 (0.1) a5.10 (0.09) ab
RSO0.5 (0.2) a6.01 (0.07) a
SAP0.4 (0.0) a5.05 (0.84) ab
SKT0.4 (NA) a5.32 (NA) ab
NAU0.3 (0.0) a5.75 (0.22) ab
RD0.2 (NA) a6.42 (NA) a
HHR0.3 (NA) a3.80 (NA) ab
MH0.3 (NA) a4.58 (NA) ab
MUD0.2 (NA) a3.90 (NA) ab
MZN0.3 (0.0) a5.70 (0.12) ab
VJS0.6 (NA) a4.72 (NA) ab
HR0.2 (0.0) a4.14 (0.56) b
BM0.4 (0.0) a4.50 (0.05) ab
MAG0.0 (NA) a5.80 (NA) ab
GP0.6 (NA) a6.45 (NA) a
TAY0.3 (0.2) a5.60 (0.40) ab
Table 3. p-value of seedling relative height growth, ground line diameter (GLD), and carbon isotope discrimination (∆13C) for the provenance effect, planting site effect, and provenance × site interaction. Bolded values significant at p < 0.05.
ProvenanceSiteProvenance × Site
2019 relative height growth0.926<0.00010.982
2019 GLD0.0080.0010.143
13C0.0060.00010.239
Table 4. Correlation coefficients between provenance environmental characteristics and trait means for mid and high elevation sites. Values in parentheses are p values. Boldface type indicates significance (p < 0.05). Ground line diameter (GLD); carbon isotope discrimination (∆13C).
LatitudeLongitudeElevationMATMAP
Mid-elevation site
2019 relative height growth (mm/mm)0.09 (0.668)0.13 (0.561)0.56 (0.007)−0.51 (0.015)0.54 (0.010)
2019 GLD (mm)−0.12 (0.586)−0.26 (0.244)0.001 (0.993)−0.04 (0.843)0.43 (0.051)
13C (‰)0.32 (0.154)−0.05 (0.806)−0.001 (0.996)0.03 (0.864)−0.09 (0.683)
High-elevation site
2019 relative height growth (mm/mm)0.09 (0.708)0.007 (0.973)0.10 (0.657)−0.30 (0.175)0.04 (0.850)
2019 GLD (mm)−0.53 (0.014)−0.40 (0.066)0.06 (0.789)0.01 (0.960)0.60 (0.004)
13C (‰)−0.42 (0.054)0.01 (0.942)0.02 (0.936)0.09 (0.699)0.31 (0.161)
Publisher’s Note: MDPI stays neutral with regard to jurisdictional claims in published maps and institutional affiliations.

