Abstract
High-value timber species such as monarch birch (Betula maximowicziana Regel), castor aralia (Kalopanax septemlobus (Thunb.) Koidz), and Japanese oak (Quercus crispula Blume) play important ecological and economic roles in forest management in the cool temperate mixed forests in northern Japan. The accurate measurement of their tree height is necessary for both practical management and scientific reasons such as estimation of biomass and site index. In this study, we investigated the similarity of individual tree heights derived from conventional field survey, digital aerial photographs derived from unmanned aerial vehicle (UAV-DAP) data and light detection and ranging (LiDAR) data. We aimed to assess the applicability of UAV-DAP in obtaining individual tree height information for large-sized high-value broadleaf species. The spatial position, tree height, and diameter at breast height (DBH) were measured in the field for 178 trees of high-value broadleaf species. In addition, we manually derived individual tree height information from UAV-DAP and LiDAR data with the aid of spatial position data and high resolution orthophotographs. Tree heights from three different sources were cross-compared statistically through paired sample t-test, correlation coefficient, and height-diameter model. We found that UAV-DAP derived tree heights were highly correlated with LiDAR tree height and field measured tree height. The performance of individual tree height measurement using traditional field survey is likely to be influenced by individual species. Overall mean height difference between LiDAR and UAV-DAP derived tree height indicates that UAV-DAP could underestimate individual tree height for target high-value timber species. The height-diameter models revealed that tree height derived from LiDAR and UAV-DAP could be better explained by DBH with lower prediction errors than field measured tree height. We confirmed the applicability of UAV-DAP data for obtaining the individual tree height of large-size high-value broadleaf species with comparable accuracy to LiDAR and field survey. The result of this study will be useful for the species-specific forest management of economically high-value timber species.
1. Introduction
High-value timber species play important ecological and economic roles in forest management [1,2]. Trees with high economic value are often large in size [3] contributing to structural heterogeneity, dynamics, and functions of the forest ecosystem [4,5], and make up a large fraction of aboveground biomass [6]. They play an important role in the rate and pattern of regeneration and forest succession [7] and provide habitats for wildlife species [8]. Because of their high commercial value, high-value timber species are subjected to excessive and illegal harvesting [9,10]. In many regions of the world, their numbers are declining [11] and therefore, species of high-value timber trees have often been earmarked for special attention in conservation and forest management practices [12]. Due to their economic and ecological importance in forest management, the single-tree management of high-value timber species was recommended in previous studies [3,11]. Single tree selection, measuring and periodic monitoring for the optimal management of these species are important elements under single-tree management.
For management and conservation purposes, the forest inventory needs to provide accurate information of high-value individuals such as tree height and diameter at breast height (DBH). The individual tree DBH can be measured accurately by traditional field measurements, but tree height is relatively difficult to measure accurately [13]. Further, the results of tree height measurements are greatly influenced by many factors including biophysical and topographic factors, instrument errors, and human errors [14,15,16,17]. Although errors are likely to be presented in the field measurements of tree height than other parameters, such as DBH [15,18], field-measured tree heights have been widely understood to be the most reliable source of tree height information [19].
With the advancement of remote sensing (RS) technology such as airborne laser scanning (ALS) and digital aerial photographs derived from unmanned aerial vehicle (UAV-DAP), the use of RS technology may overcome difficulty in accurate tree height measurement in the field. ALS is an active remote sensing technique that uses a light detection and ranging (LiDAR) sensor, which enables us to measure the three-dimensional (3D) distribution of vegetation canopy components as well as sub-canopy topography, resulting in an accurate estimation of vegetation height and ground elevation [20,21]. Many previous studies have demonstrated the ability of LiDAR data in the estimation of forest information over large areas of forests with high accuracy [22,23,24]. Further, a LiDAR 3D forest structure can provide accurate individual tree height information [25,26,27,28,29]. However, the major limitation of LiDAR data is the high acquisition cost, which limits its application in forest management directives [30,31].
Recently UAV-DAP has become a popular RS technique for fine-scale remote sensing due to its flexibility in data acquisition, low operational cost, and high spatial and temporal resolution [32]. Software developments, such as Structure-from-Motion (SfM), offer the efficient processing of digital aerial photographs (DAPs) acquired from low-cost UAV platforms, providing an cost-effective alternative to generate the 3D forest information, i.e., photogrammetric point cloud (PPC) [33,34,35]. Although PPC fails to provide ground information especially in dense vegetation cover, it can provide an upper canopy surface [36,37]. Thus, the accurate digital terrain model (DTM) is a prerequisite for the accurate characterization of forest information using PPC. Where highly accurate DTM exists, PPC has been proven to provide a cost-effective estimation of forest information with high accuracy comparable to LiDAR data [38,39,40,41,42,43,44]. Moreover, recent studies suggested that UAV-DAP could provide highly accurate individual tree height information [45,46,47,48]. However, most of these studies have been employed in forests with simple structural complexity such as plantations or even-aged forests.
Applications of UAV-DAP for individual tree height measurement, particularly for large-size broadleaf trees, have not been widely studied, especially in structurally complex mixed forests. Moreover, a rigorous comparison of individual tree height estimation between LiDAR, UAV-DAP and field survey data is rare. Therefore, we tried to address these issues in this study.
In cool-temperate mixed forests in northern Japan, monarch birch is the most valuable timber species, with the log price reaching 20,000 USD per cubic meter, and castor aralia is the second most expensive timber species, with its prices reaching 7500 USD per cubic meter [3]. Japanese oak, is another valuable broadleaved timber species; its timber supply is exclusively dependent on the cutting of large trees within mixed forests [49]. Accurate individual tree information of these high-value timber species is important for the reliable application of single-tree management system [2,3]. However, tree height estimation for these species is a challenging task for forest managers.
The aim of the present study is, therefore, to examine whether UAV-DAP could be used to derive the height of large-size high-value trees. First, we compare individual tree height derived from field survey, LiDAR, and UAV-DAP data. Since tree height can be predicted from the individual tree DBH (e.g., [50,51,52]), secondly, we assess the relationship between individual tree DBH and the tree height derived from field survey, LiDAR, and UAV-DAP through height-diameter models to examine how three height sources can be explained by tree diameter.
2. Materials and Methods
2.1. Study Site
This study was conducted in the University of Tokyo Hokkaido Forest (UTHF) (Figure 1). UTHF is located in Furano City, central Hokkaido Island in northern Japan (43°10–20′ N, 142°18–40′ E, 190–1459 m asl). UTHF is a pan-mixed forest, where uneven-aged mixed forests with coniferous and broad-leaved tree species are the main vegetation cover. The mean annual temperature was 6.4 °C and precipitation was 1297 mm at the arboretum of the UTHF (230 m asl) during 2001‒2010, and snow usually covers the ground from late November to early April with a maximum depth of approximately 1 m. The predominant tree species included Sakhalin fir (Abies sachalinensis), Yezo spruce (Picea jezoensis), Japanese linden (Tilia japonica), and painted maple (Acer pictum var. mono) [53]. Other common conifer tree species include Taxus cuspidata, Picea glehnii. B. maximowicziana, K. septemlobus, Q. crispula, and Ulmus laciniata, which are among the common deciduous broadleaved species.
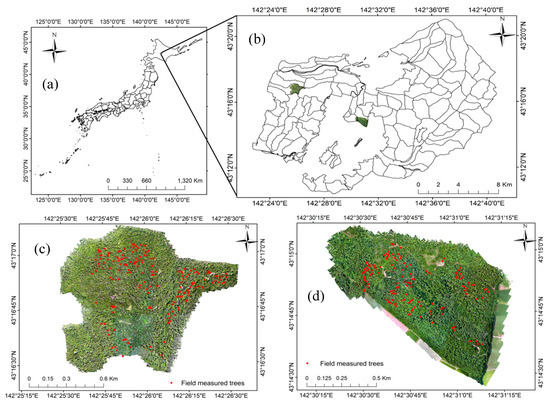
Figure 1.
Location of the study area. (a) The University of Tokyo Hokkaido Forest, (b) Sub-compartment 36 B and 59 A, (c) Measured trees at sub-compartment 36B, (d) Measured trees at sub-compartment 59A.
For this study, two forest management sub-compartments - compartment 36B and compartment 59A—were selected. Compartment 36B is scheduled for management activities in 2020 and compartment 59A was managed in 2019. Major management activities included selection harvesting except in reserved forest areas. Harvesting rates were determined based on the forest inventory practices one year ahead of management activities.
2.2. Data
2.2.1. Field Data
Field measurements of 178 trees of three high-value timber species (Figure 2) were carried out during July and August of 2019. Measurement parameters included the DBH, tree height, and spatial positions of individual trees. A summary of field measurement is given in Table 1. DBH was measured using diameter tape. The tree heights were measured using a Vertex III hypsometer and transponder (Haglöf, Sweden AB). Tree height measurements were carried out three times, and average height values were assumed as the corresponding tree height. Individual tree spatial positions were recorded using global navigation satellite system (GNSS). We used an R2 integrated GNSS system (Trimble, USA) to record individual tree spatial positions with an accuracy of less than 1 m.
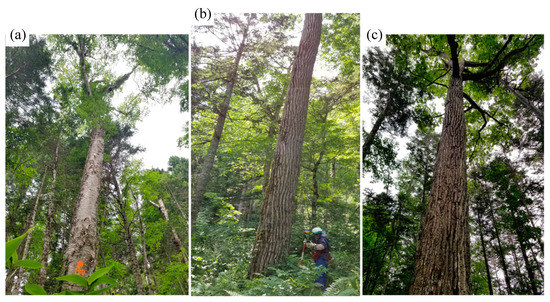
Figure 2.
High-value timber species. (a) Monarch birch (Betula maximowicziana), (b) Castor aralia (Kalopanax septemlobus), and (c) Japanese oak (Quercus crispula).

Table 1.
Summary statistics of field measured trees (standard deviation in parenthesis).
2.2.2. LiDAR Data
LiDAR data were acquired in September 2018 using an Optech Airborne Laser Terrain Mapper (ALTM) Orion M300 sensor (Teledyne Technologies, Waterloo, ON, Canada) mounted on a helicopter. The detail specifications of LiDAR data are summarized in Table 2. The acquired data included first, second, third and last return and waveform data. The classification of LiDAR data into ground and non-ground points was initially processed by the data provider (Hokkaido Aero Asahi, Hokkaido, Japan), and data were delivered in LAS format. In this study, we used first and last return data only.
Table 2.
LiDAR flight parameters.
2.2.3. UAV Data
UAV imagery was acquired on 8 and 10 July 2019 for compartment 36B and 11 and 30 July 2019 for compartment 59A. We used an Inspire-2 platform mounted with a Zenmuse X5S RGB camera (DJI, Shenzhen, China) for image acquisition. Eight separate flights for compartment 36B and 10 separate flights for compartment 59A were employed. In both compartments, the flying altitudes were set to 120 m, but the actual flying height may have varied because of the terrain conditions. The average ground sampling distances were 2.3 cm/pixel. Image overlaps were 80% for both longitudinal and lateral overlaps. Before flight missions, ground control points (GCPs), take-off and landing points were set in available open areas. The locations of GCPs were recorded using the Trimble R2 GNSS. We collected 10 GCPs in Compartment 36B and 9 GCPs in Compartment 59A. There were total of 3292 images for compartment 36B and 2231 images for compartment 59A. All imagery had a photo resolution of 5280 × 3956 pixels.
2.3. Data Processing and Canopy Height Model (CHM) Generation
2.3.1. LiDAR Data Processing and LiDAR-CHM Generation
For this study, LiDAR data processing was performed using US Forest Service FUSION/LDV 3.8.0 software [54]. LiDAR digital terrain models (LiDAR-DTM) of 0.5 m spatial resolution were generated using GroundFilter and GridSurfaceCreate functions. LiDAR point clouds were normalized to the height above ground by the subtraction of the LiDAR-DTM elevation from LiDAR digital surface models (LiDAR-DSM) to generate the LiDAR canopy height model (LiDAR-CHM). We used the CanopyModel function in FUSION/LDV software to generate a LiDAR-CHM with a 0.5 m spatial resolution.
2.3.2. UAV Data Processing and UAV-DAP-CHM Generation
We used the 3D modelling software Agisoft Metashape Professional Edition 1.5.3 (Agisoft, St. Petersburg, Russia) for UAV photogrammetric processing. Metashape offers a user-friendly workflow that combines proprietary algorithms based on computer vision SfM and stereo-matching for image alignment and reconstruction of the 3D image [35]. The workflow included four stages: image alignment, building a dense point cloud, building a digital elevation model (DEM) and building an orthomosaic. During the image alignment stage, the stage at which camera location, orientation and other internal parameters are optimized [55], we used high accuracy for image matching. Using the SfM techniques, this stage extract features within the images and match those features to pair the images. This stage produced a sparse 3D point cloud. After initial alignment, we deleted many abnormal points based on gradual selection procedures in Metashape [55] to optimize the camera locations. We then added GCPs in each corresponding image for a more accurate optimization of camera locations and orientation as well as other internal camera parameters. In the building dense point cloud stage, the stage that generates a dense point clouds, we used medium quality to reduce the image processing time and mild depth filtering to remove the outliers. We followed the Metashape default setting for the DEM building stage and orthomosaic building stage. Dense point clouds were exported in LAS format with average point density of 547.01 points/m2. and orthophotographs with a 3 cm pixel resolution were exported in GeoTiff format.
Previous studies [37,40,42] highlighted the need for accurate DTM for the normalization of DAP point clouds. To generate UAV-DAP-CHM, we used LiDAR-DTM for normalization of PPC. We used the same procedure as the LiDAR-CHM generation in the FUSION software package, and the resulting DAP-CHM was exported with a 0.5 m spatial resolution.
2.4. Individual Tree Height Measurement Using RS Data
In order to evaluate the reliability of individual tree height measurement using different data sources—i.e., field, LiDAR and UAV-DAP—exact individual trees need to be identified in all three data sources. Further, methods of measuring tree height need to be carried out separately to ensure independent measurements from the statistical point of view. An individual tree crown detection algorithm may impose errors in detecting individual trees and previous studies reported poor results in tree detection under a complex forest structure [23,56]. Therefore, field measured individual tree positions were used to identify the exact trees on both CHMs with the help of UAV-DAP orthophotographs. The manual delineation of an individual tree crown was carried out using high resolution orthophotographs. These crown polygons were used as reference crowns and for extracting individual tree heights from both LiDAR-CHM and UAV-DAP-CHM.
In forestry, tree height can be defined as the vertical distance between the ground level and tip of the tree [57]. We also used this definition in measuring tree height in the field. According to this definition, the difference between maximum point within a crown and the ground is the tree height. Therefore, the maximum value within a manually delineated crown polygon was considered to be the corresponding tree height. Height measurements were carried out separately for LiDAR-CHM and UAV-DAP-CHM.
It should be noted that there is a temporal discrepancy of 10 to 11 months between the LiDAR data acquisition and UAV imagery acquisition. Field measurements were carried out at the same time as UAV imagery acquisition. Previous studies suggested that trees typically invest heavily in height growth when young, rapidly approaching their maximum height, but then continue to grow in diameter throughout their lives [58]. In our data, only large diameter trees (DBH > 40 cm) were included (Table 1). Therefore, we assumed that there are no large increments in the tree heights of large size trees.
2.5. Data Analysis
2.5.1. Individual Tree Height Comparison
The individual tree height comparison was carried out in pairs; i.e., Field height vs. LiDAR height, Field height vs. UAV-DAP height, and LiDAR height vs. UAV-DAP height. To access the degree of association between pairs, we calculated the Pearson correlation coefficient (r). Further, we calculated the root mean square difference (RMSD). The RMSD indicates the average height difference between measurement methods and clarifies the magnitude of the differences between measurement methods. Further we calculated the mean difference (MD) to indicate whether tree heights derived from one measurement technique were generally greater or smaller than those derived from another measurement technique.
2.5.2. Height-Diameter Relationships
Tree height-diameter (H-D) models are widely used to predict individual tree heights (e.g., [51,52,59]). Tree height data predicted from DBH using these models can be used as an input variable in various forest models such as growth and yield models, and biomass models [15,24]. Most of the previously published studies used one tree height measurement technique, i.e., field survey, in H-D models. As UAV-DAP and LiDAR data could provide accurate tree height information, it is worth to examine how different tree height data sources may provide improved H-D models. To assess the performance of different tree height measuring techniques in the H-D model, we tested a simple non-linear function (Equation (1)) which was widely used in the height-diameter allometric models:
where, a and b are parameters to be estimated. The value of 1.3 is included in all models to account for the fact that DBH is measured at 1.3 m above the ground. It was excluded when height values from LiDAR and UAV-DAP were used in model development. We tested species-specific non-linear models to examine the relationships between DBH and tree height derived from field, LiDAR and UAV-DAP data. RMSE and coefficient of determination (R2) values were used for model evaluation. All statistical analyses were performed in R software [60].
Height = 1.3 + a × DBHb
3. Results
3.1. Correlation between Observed Tree Heights
Observed tree heights are listed in Table 3. The comparison of field, LiDAR and UAV-DAP tree height for the three species is summarized in Table 4 and Figure 3. The RMSD and r values showed good agreement and consistency between the field, LiDAR and UAV-DAP tree height measurement. Among the three pairs for the individual tree height comparison of all species, the LiDAR vs. UAV-DAP pair has the highest r values and lowest RMSD values, while the lowest r values and highest RMSD values occurred in Field vs. UAV-DAP pair. The same results were also found for species specific comparison. The correlation coefficients in Table 4 also indicate that tree height measurement accuracy could differ between species.
Table 3.
Observed tree height from field, LiDAR and UAV-DAP (standard deviation in parenthesis).
Table 4.
Correlation of tree height derived from field, LiDAR and UAV-DAP data for three high-value timber species.
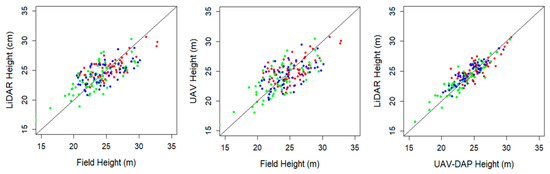
Figure 3.
Correlation between tree heights derived from field survey, LiDAR, and UAV-DAP data. Red, green, and blue dots represent individual monarch birch, castor aralia, and Japanese oak tree heights, respectively.
3.2. Height Differences between Three Height Measurement Methods
Height differences between Field vs. LiDAR, Field vs. UAV-DAP and LiDAR vs. UAV-DAP are shown in Table 5 and Figure 4. As shown in Figure 4a, the height differences between field and LiDAR tree height increase as the field measured tree heights increase. A similar trend was observed in the height differences of field-measured and UAV-DAP tree height (Figure 4b). However, tree height differences between LiDAR and UAV-DAP decreased with increasing UAV-DAP tree height as shown in Figure 4c.
Table 5.
Height differences between field measured and RS tree height (standard deviation in parenthesis).
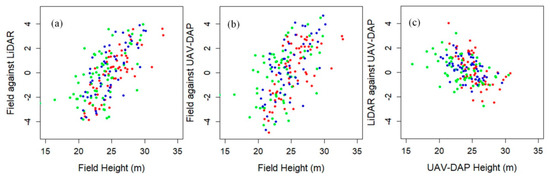
Figure 4.
Height differences between measurement methods. (a) Difference between field height and LiDAR height, (b) Difference between field height and UAV-DAP height, and (c) Difference between LiDAR height and UAV-DAP height. Red, green, and blue dots represent individual monarch birch, castor aralia, and Japanese oak tree height respectively.
According to Figure 4a,b, field tree height measurements were likely to produce lower tree height values for lower height trees and higher tree height values for higher trees when compared with RS data. Figure 4c indicates that UAV-DAP could produce higher tree height values of higher trees and lower tree height values for lower trees when compared with LiDAR data. However, the mean difference in Table 5 indicates that UAV-DAP underestimates the individual tree height in comparison with LiDAR data. The lowest and highest individual tree height differences between LiDAR data and UAV-DAP were −2.74 m and 4.00 m, respectively, with mean tree height differences for all species of less than 1 m.
3.3. Relation between Tree Height and DBH
3.3.1. Height-Diameter Relationships
Correlations between individual tree DBH and tree height derived from the field survey, LiDAR, and UAV-DAP are summarized in Table 6 and Figure 5. The tree height derived from LiDAR data showed a stronger correlation with DBH than field-measured and UAV-DAP tree height. A better correlation between tree height and DBH was observed for castor aralia than the other two species, while Japanese oak exhibited a significant but relatively poor correlation among the three species.
Table 6.
Pearson’s correlation coefficient between tree height and DBH.
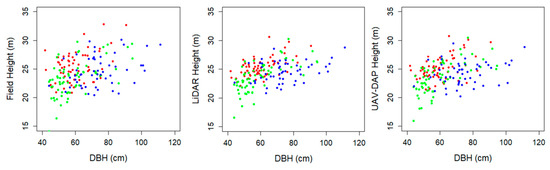
Figure 5.
Correlation between individual tree DBH and tree height derived from Field, LiDAR, and UAV-DAP. Red, green, and blue dots represent individual monarch birch, castor aralia, and Japanese oak tree respectively.
3.3.2. H-D Models
The results of the non-linear H-D models are summarized in Table 7. In comparison with the field measured tree height, the UAV-DAP tree height showed better prediction power in terms of RMSE for all species (Table 7). H-D model using LiDAR derived tree height exhibited lower RMSE values and higher R2 values for all target species. Figure 6 indicates the distribution of prediction errors across DBH and tree height which also shows the lower variation for LiDAR derived tree height estimation. It also shows that UAV-DAP derived tree height can be predicted from tree DBH with comparable level of prediction errors to field and LiDAR derived tree height. Figure 6 also reveals the smaller prediction errors for LiDAR derived tree height and UAV-DAP derived tree height. The mean prediction errors across height classes were shown in Figure 7. According to Figure 7, highest negative mean prediction errors were observed for field measured tree height in the lower high classes and larger positive mean prediction errors were observed in higher height classes for all species. Lower positive and negative mean prediction errors were found for LiDAR and UAV-DAP derived tree height. In Figure 8, we showed the similarity of LiDAR and UAV-DAP tree height predicted from tree DBH to the field measured tree height for height diameter curve.
Table 7.
H-D models using tree height derived from field survey, LiDAR and UAV-DAP data.
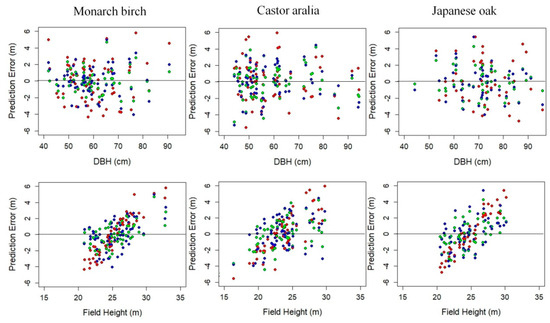
Figure 6.
Distribution of prediction error across DBH and height. Red, green, and blue dots represent prediction errors for field height, LiDAR height, and UAV-DAP height, respectively.
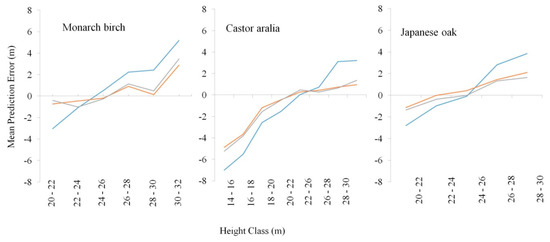
Figure 7.
Mean prediction errors and height classes (field measured height). Blue, red, and gray lines represent mean prediction errors for field height, LiDAR height, and UAV-DAP height, respectively.
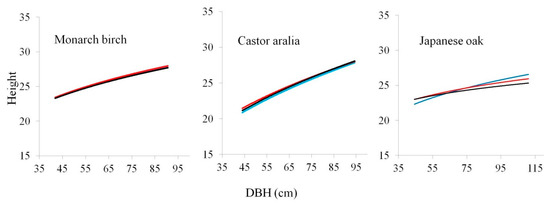
Figure 8.
Height-Diameter curves. Blue, red, and black lines represent field measured height, predicted LiDAR height, and predicted UAV-DAP height, respectively.
4. Discussion
In this study, we demonstrated the ability of UAV-DAP to perform the individual tree height estimation of high-value timber individuals in mixed conifer-broadleaf forests in northern Japan. We observed that UAV-DAP enabled individual tree height estimation with comparable accuracy to airborne laser scanning or LiDAR data and field-measured data.
According to Table 4, stronger correlation coefficients were observed in LiDAR and UAV-DAP tree height comparison among three pairs of comparison. LiDAR derived tree height showed better correlation with field measure tree height than UAV-DAP derived tree height. This result is consistent with a previous study by Wallace et al. [44]. They also reported a stronger correlation between Field vs. LiDAR than Field vs. UAV-DAP. However, the correlation between LiDAR and field measured tree height in this study was lower than other studies [25,27,28,29]. This lower correlation could be related to the species, the tree height itself and measurement errors in the field. In addition, the accuracy of tree heights derived from RS data might also be influenced by many factors such as structural complexity of the forest canopy which could affect photogrammetric reconstruction [44,61,62]. Moreover, LiDAR data also have limitations such as tree height estimation errors due to different canopy height model generation methods [63], susceptibility to influence of slope and crown shape on canopy height [64].
One of the key questions when using field-measured tree height as reference data for the evaluation of LiDAR or UAV-DAP is the accuracy of field measurement. Sibona et al. [29] assessed the accuracy of LiDAR tree height using actual tree height derived from 100 felled trees. They found that tree height derived from LiDAR data was closer to actual height than field measurement. Since our target species are large-size high-value broadleaved trees, some error in field measurement could be expected because of the tree height itself and tree crowns which limit the visibility to the tree tops. This was also highlighted by Hunter et al. [15] and Stereńczak et al. [17]. These studies reported that small measurement errors were found in conifer species and larger trees were subjected more to height measurement errors in the field. Further, the number of leaves present in our study species may impact the accuracy of field tree height measurement. Huang et al. [48] also highlighted that the effect of number of leaves in the canopy may affect the tree height estimation for deciduous trees.
For all three high-value broadleaved species, the highest correlation and consistency was observed between UAV-DAP tree height and LiDAR tree height. Using the area-based approach, previous studies comparing the performance of UAV-DAP and LiDAR data also reported the high correlation and accuracy in forest attribute estimation such as mean height, and dominant height (e.g., [38,39,41,61]).
Among the three broadleaved species, castor aralia showed a higher correlation than the other two species in all three pairs of comparison. The crown of castor aralia is somewhat rounded and regular in shape, which makes it easier for the surveyor to detect the tree tops from the ground during the field measurement than other two species. The size and shape of monarch birch crown are highly irregular. Moreover, the maximum size of field measured trees of Japanese oak was 110 cm in DBH with an average DBH larger than other two species. The older and larger oak tree crowns may produce extensive crowns, causing difficulty in determining the position of the highest point of the oak trees. This could contribute to some errors in estimating tree height using height measuring instruments. Larjavaara and Muller-Landau [16] also reported that, under typical forest conditions with limited visibility to the tree tops, tree height measurement instruments cannot produce manufacturer-reported accuracies.
Positive height differences were observed for higher trees and negative height differences were found for lower height trees between field and RS-derived tree height (Figure 4), meaning field measured tree height overestimated the tree height of higher trees and underestimated the height of lower trees. This result is consistent with previous studies. For example, Hunter et al. [15] in their study in the Brazilian Amazon reported that ground-based measurements of tree heights of emergent crowns exceeded LiDAR-measured tree heights by an average of 1.4 m. Moreover Laurin et al. [13] and Wang et al. [28] reported that traditional field measurement techniques may overestimate the tree height of tall trees. Imai et al. [26] also concluded in their study in Japan that LiDAR data tend to estimate the tree height as lower than the actual height.
In terms of LiDAR and UAV-DAP tree height differences; there was a positive height difference in lower trees and negative height difference in higher trees. Tree height differences between LiDAR and UAV-DAP varied with species. The largest height difference was found for monarch birch (-2.74 m and 4.00 m). A previous study in a mixed conifer-broadleaf forest in northern Japan [61] reported that the mean differences between LiDAR-CHM and UAV-DAP-CHM in terms of the maximum tree heights of the sample plots were 2.96 m and 1.05 m in two study compartments. However, higher mean height differences were found in UAV-DAP data [61].
The applicability of tree height information derived from UAV-DAP was analysed using the height-diameter model for each species since tree diameter play significant role in predicting the tree height. UAV-DAP derived tree height can be explained by tree diameter with high accuracy compare to LiDAR and field measured tree height (Table 7, Figure 6, Figure 7 and Figure 8). Mean prediction errors of the tested height-diameter models also revealed the lowest errors for LiDAR and UAV-DAP derived tree height in all height class. In Figure 7, highest negative mean prediction errors were found for castor aralia which may be due to the unequal high distribution of field measured tree of castor aralia trees with minimum height values of 14.1 m which could affect the model performance. For all species, higher prediction errors were observed for field measure tree height. This can also be confirmed by the larger RMSE values of field measured tree height. Although there is not sufficient evidence in the existing literature for these results, the tree height of large-size high-value trees derived from LiDAR and UAV-DAP can be explained better by the tree diameter than field-measured height. Therefore, this study confirmed the applicability of the UAV-DAP for tree height estimation of large-size high-value trees and its potential for estimating tree diameter. The use of UAV-DAP could facilitate the periodic monitoring and assessment of high-value timber species.
5. Conclusions
Our study demonstrates the applicability of UAV-DAP for individual tree height estimation of large-size high-value timber species in mixed conifer-broadleaf forests in northern Japan. We compared the tree heights derived from field survey, LiDAR data and UAV-DAP data through statistical analysis and height-diameter models. The results revealed the high similarity between three different height sources. Lower tree height values for higher trees and higher values for lower trees may occur in UAV-DAP derived tree height in comparison with field-based measurement. Although overall mean tree height difference between LiDAR and UAV-DAP data indicates that UAV-DAP could underestimate the tree height, it is likely to observe higher tree height values for higher trees and lower tree height values for lower trees in UAV-DAP derived tree height when comparing with LiDAR derived tree height for our study species. In addition, the height-diameter models revealed that tree height derived from UAV-DAP can be explained by tree DBH with comparable accuracy to LiDAR and field measured tree height. Smaller mean prediction errors across RS-derived tree height classes were observed in comparison with field measured tree height confirming the high accuracy of UAV-DAP which can facilitate tree height estimation of high-value timber species.
Our focus in this study only includes high-value broadleaf species. As this study demonstrated the applicability of UAV-DAP for tree height estimation, it would be better to further examine other species so that it can use in the periodic monitoring of permanent sample plots in the study area. Further research should also focus on how UAV-DAP in combination with LiDAR data would be useful for species-specific or single-tree management planning by accurately locating the spatial position and stem size of high-value tree individuals.
Author Contributions
Formal analysis, writing—original draft preparation, K.T.M.; resource, supervision, writing-review and editing, T.O.; review and editing N.F. and T.H. All authors have read and agreed to the published version of the manuscript.
Funding
This study was supported by JSPS KAKENHI grant numbers 16H04946 and 17H01516.
Acknowledgments
We would like to express our thanks to the technical staff of the University of Tokyo Hokkaido Forest—Kazunobu Iguchi, Shinya Inukai, Yoshikazu Takashima, Takashi Inoue, Yoshinori Eguchi, Masaki Tokuni, Satoshi Fukuoka, Haruki Sato, Hitomi Ogawa—for their significant contribution in field measurements and UAV data collection.
Conflicts of Interest
The authors declare no conflict of interest.
References
- Hemery, G.; Spiecker, H.; Aldinger, E.; Kerr, G.; Collet, C.; Bell, S. COST Action E42: Growing Valuable Broadleaved Tree Species. Final Report. 2008, p. 40. Available online: http://www.valbro.uni-freibur (accessed on 31 October 2008).
- Oosterbaan, A.; Hochbichler, E.; Nicolescu, V.N.; Spiecker, H. Silvicultural principles, goals and measures in growing valuable broadleaved tree species. Die Bodenkultur 2009, 60, 45–51. [Google Scholar]
- Owari, T.; Okamura, K.; Fukushi, K.; Kasahara, H.; Tatsumi, S. Single-tree management for high-value timber species in a cool-temperate mixed forest in northern Japan. Int. J. Biodivers. Sci. Ecosyst. Serv. Manag. 2016, 12, 74–82. [Google Scholar] [CrossRef]
- Lutz, J.A.; Furniss, T.J.; Johnson, D.J.; Davies, S.J.; Allen, D.; Alonso, A.; Anderson-Teixeira, K.J.; Andrade, A.; Baltzer, J.; Becker, K.M.L.; et al. Global importance of large-diameter trees. Glob. Ecol. Biogeogr. 2018, 27, 849–864. [Google Scholar] [CrossRef]
- Vandekerkhovea, K.; Vanhellemont, M.; Vrška, T.; Meyer, P.; Tabaku, V.; Thomaes, A.; Leyman, A.; De Keersmaeker, L.; Verheyen, K. Very large trees in a lowland old-growth beech (Fagus sylvatica L.) forest: Density, size, growth and spatial patterns in comparison to reference sites in Europe. For. Ecol. Manag. 2018, 417, 1–17. [Google Scholar] [CrossRef]
- Ali, A.; Lin, S.L.; He, J.K.; Kong, F.M.; Yu, J.H.; Jiang, H.S. Big-sized trees overrule remaining trees’ attributes and species richness as determinants of aboveground biomass in tropical forests. Glob. Chang. Biol. 2019, 25, 2810–2824. [Google Scholar] [CrossRef] [PubMed]
- Keeton, W.S.; Franklin, J.F. Do remnant old-growth trees accelerate rates of succession in mature Douglas-Fir forests? Ecol. Monogr. 2005, 75, 103–118. [Google Scholar] [CrossRef]
- Alexander, C.; Korstjens, A.H.; Hankinson, E.; Usher, G.; Harrison, N.; Nowak, M.G.; Abdullah, A.; Wich, S.A.; Hill, R.A. Locating emergent trees in a tropical rainforest using data from an Unmanned Aerial Vehicle (UAV). Int. J. Appl. Earth Obs. Geoinf. 2018, 72, 86–90. [Google Scholar] [CrossRef]
- Bourland, N.; Kouadio, Y.L.; Lejeune, P.; Sonké, B.; Philippart, J.; Daïnou, K.; Fétéké, F.; Doucet, J.-L. Ecology of Pericopsis elata (Fabaceae), an endangered timber species in southeastern Cameroon. Biotropica 2012, 44, 840–847. [Google Scholar]
- Khai, T.C.; Mizoueb, N.; Kajisa, T.; Otab, T.; Yoshida, S. Stand structure, composition and illegal logging in selectively logged production forests of Myanmar: Comparison of two compartments subject to different cutting frequency. Glob. Ecol. Conserv. 2016, 7, 132–140. [Google Scholar] [CrossRef]
- Lindenmayer, D.B.; Laurance, W.F.; Franklin, J.F.; Likens, G.E.; Banks, S.C.; Blanchard, W.; Gibbons, P.; Ikin, K.; Blair, D.; McBurney, L.; et al. New policies for old trees: Averting a global crisis in a keystone ecological structure. Conserv. Lett. 2013, 7, 61–69. [Google Scholar] [CrossRef]
- Prates-Clark, C.D.C.; Saatchi, S.S.; Agosti, D. Predicting geographical distribution models of high-value timber trees in the Amazon Basin using remotely sensed data. Ecol. Modell. 2008, 211, 309–323. [Google Scholar] [CrossRef]
- Laurin, G.V.; Ding, J.; Disney, M.; Bartholomeus, H.; Herold, M.; Papale, D.; Valentini, R. Tree height in tropical forest as measured by different ground, proximal, and remote sensing instruments, and impacts on above ground biomass estimates. Int. J. Appl. Earth Obs. Geoinf. 2019, 82, 101899. [Google Scholar] [CrossRef]
- Kitahara, F.; Mizoue, N.; Yoshida, S. Effects of training for inexperienced surveyors on data quality of tree diameter and height measurements. Silva Fenn. 2010, 44, 657–667. [Google Scholar] [CrossRef]
- Hunter, M.O.; Keller, M.; Victoria, D.; Morton, D.C. Tree height and tropical forest biomass estimation. Biogeosciences 2013, 10, 8385–8399. [Google Scholar] [CrossRef]
- Larjavaara, M.; Muller-Landau, H.C. Measuring tree height: A quantitative comparison of two common field methods in a moist tropical forest. Methods Ecol. Evol. 2013, 4, 793–801. [Google Scholar] [CrossRef]
- Stereńczak, K.; Mielcarek, M.; Wertz, B.; Bronisz, K.; Zajączkowski, G.; Jagodziński, A.M.; Ochał, W.; Skorupski, M. Factors influencing the accuracy of ground-based tree-height measurements for major European tree species. J. Environ. Manag. 2019, 231, 1284–1292. [Google Scholar] [CrossRef]
- Luoma, V.; Saarinen, N.; Wulder, M.A.; White, J.C.; Vastaranta, M.; Holopainen, M.; Hyyppä, J. Assessing precision in conventional field measurements of individual tree attributes. Forests 2017, 8, 38. [Google Scholar] [CrossRef]
- Bragg, D.C. Accurately measuring the height of (real) forest trees. J. For. 2014, 112, 51–54. [Google Scholar] [CrossRef]
- Wulder, M.A.; Hilker, T.; Bater, C.W.; White, J.C.; Coops, N.C. The role of LiDAR in sustainable forest management. For. Chron. 2014, 84, 807–826. [Google Scholar] [CrossRef]
- Lim, K.; Treitz, P.; Wulder, M.; St-Ongé, B.; Flood, M. LiDAR remote sensing of forest structure. Prog. Phys. Geogr. 2003, 27, 88–106. [Google Scholar] [CrossRef]
- Hyyppä, J.; Yu, X.; Hyyppä, H.; Vastaranta, M.; Holopainen, M.; Kukko, A.; Kaartinen, H.; Jaakkola, A.; Vaaja, M.; Koskinen, J.; et al. Advances in forest inventory using airborne laser scanning. Remote Sens. 2012, 4, 1190–1207. [Google Scholar] [CrossRef]
- Kaartinen, H.; Hyyppä, J.; Yu, X.; Vastaranta, M.; Hyyppä, H.; Kukko, A.; Holopainen, M.; Heipke, C.; Hirschmugl, M.; Morsdorf, F.; et al. An international comparison of individual tree detection and extraction using airborne laser scanning. Remote Sens. 2012, 4, 950–974. [Google Scholar] [CrossRef]
- Takagi, K.; Yone, Y.; Takahashi, H.; Sakai, R.; Hojyo, H.; Kamiura, T.; Nomura, M.; Liang, N.; Fukazawa, T.; Miya, H.; et al. Forest biomass and volume estimation using airborne LiDAR in a cool-temperate forest of northern Hokkaido, Japan. Ecol. Inform. 2015, 26, 54–60. [Google Scholar] [CrossRef]
- Ganz, S.; Käber, Y.; Adler, P. Measuring tree height with remote sensing—A comparison of photogrammetric and LiDAR data with different field measurements. Forests 2019, 10, 694. [Google Scholar] [CrossRef]
- Imai, Y.; Setojima, M.; Yamagishi, Y.; Fujiwara, N.; Greenery, U.; Development, T.; Management, I. Tree-height measuring characteristics of urban forests by LiDAR data different in resolution. Int. Soc. Photogramm. Remote Sens. Florida USA 2004, 1–4. Available online: https://pdfs.semanticscholar.org/7fa0/420ac76886a6c3b0f9a9c3b8734d040c3623.pdf?_ga=2.135260145.1168880634.1581732006-780315749.1579141710 (accessed on 1 February 2020).
- Hirata, Y. The effects of footprint size and sampling density in airborne laser scanning to extract individual trees in mountainous terrain. Int. Arch. Photogramm. Remote Sens. Spat. Inf. Sci. 2004, 36, 102–107. [Google Scholar]
- Wang, Y.; Lehtomäkia, M.; Lianga, X.; Pyörälä, J.; Kukko, A.; Jaakkola, A.; Liu, J.; Feng, Z.; Chend, R.; Hyyppäa, J. Is field-measured tree height as reliable as believed—A comparison study of tree height estimates from field measurement, airborne laser scanning and terrestrial laser scanning in a boreal forest. ISPRS J. Photogramm. Remote Sens. 2019, 147, 132–145. [Google Scholar] [CrossRef]
- Sibona, E.; Vitali, A.; Meloni, F.; Caffo, L.; Dotta, A.; Lingua, E.; Motta, R.; Garbarino, M. Direct measurement of tree height provides different results on the assessment of LiDAR accuracy. Forests 2016, 8, 7. [Google Scholar] [CrossRef]
- Iglhaut, J.; Cabo, C.; Puliti, S.; Piermattei, L.; O’Connor, J.; Rosette, J. Structure from motion photogrammetry in forestry: A review. Curr. For. Rep. 2019, 5, 155–168. [Google Scholar] [CrossRef]
- Goodbody, T.R.H.; Coops, N.C.; White, J.C. Digital aerial photogrammetry for updating area-based forest inventories: A review of opportunities, challenges, and future directions. Curr. For. Rep. 2019, 5, 55–75. [Google Scholar] [CrossRef]
- Colomina, I.; Molina, P. Unmanned aerial systems for photogrammetry and remote sensing: A review. ISPRS J. Photogramm. Remote Sens. 2014, 92, 79–97. [Google Scholar] [CrossRef]
- Nex, F.; Remondino, F. UAV for 3D mapping applications: A review. Appl. Geomat. 2014, 6, 1–15. [Google Scholar] [CrossRef]
- Torresan, C.; Berton, A.; Carotenuto, F.; Di Gennaro, S.F.; Gioli, B.; Matese, A.; Miglietta, F.; Vagnoli, C.; Zaldei, A.; Wallace, L. Forestry applications of UAvs. in Europe: A review. Int. J. Remote Sens. 2018, 38, 2427–2447. [Google Scholar] [CrossRef]
- Verhoeven, G.; Doneus, M.; Briese, C.; Vermeulen, F. Mapping by matching: A computer vision-based approach to fast and accurate georeferencing of archaeological aerial photographs. J. Archaeol. Sci. 2012, 39, 2060–2070. [Google Scholar] [CrossRef]
- Vastaranta, M.; Wulder, M.A.; White, J.C.; Pekkarinen, A.; Tuominen, S.; Ginzler, C.; Kankare, V.; Holopainen, M.; Hyyppä, J.; Hyyppä, H. Airborne laser scanning and digital stereo imagery measures of forest structure: Comparative results and implications to forest mapping and inventory update. Can. J. Remote Sens. 2013, 39, 382–395. [Google Scholar] [CrossRef]
- White, J.C.; Wulder, M.A.; Vastaranta, M.; Coops, N.C.; Pitt, D.; Woods, M. The utility of image-based point clouds for forest inventory: A comparison with airborne laser scanning. Forests 2013, 4, 518–536. [Google Scholar] [CrossRef]
- Bohlin, J.; Wallerman, J.; Fransson, J.E.S. Forest variable estimation using photogrammetric matching of digital aerial images in combination with a high-resolution DEM. Scand. J. For. Res. 2012, 27, 692–699. [Google Scholar] [CrossRef]
- Cao, L.; Liu, H.; Fu, X.; Zhang, Z.; Shen, X.; Ruan, H. Comparison of UAV LiDAR and digital aerial photogrammetry point clouds for estimating forest structural attributes in subtropical planted forests. Forests 2019, 10, 145. [Google Scholar] [CrossRef]
- Jayathunga, S.; Owari, T.; Tsuyuki, S. The use of fixed–wing UAV photogrammetry with LiDAR DTM to estimate merchantable volume and carbon stock in living biomass over a mixed conifer–broadleaf forest. Int. J. Appl. Earth Obs. Geoinf. 2018, 73, 767–777. [Google Scholar] [CrossRef]
- Noordermeer, L.; Bollandsås, O.M.; Ørka, H.O.; Næsset, E.; Gobakken, T. Comparing the accuracies of forest attributes predicted from airborne laser scanning and digital aerial photogrammetry in operational forest inventories. Remote Sens. Environ. 2019, 226, 26–37. [Google Scholar] [CrossRef]
- Ota, T.; Ogawa, M.; Shimizu, K.; Kajisa, T.; Mizoue, N.; Yoshida, S.; Takao, G.; Hirata, Y.; Furuya, N.; Sano, T.; et al. Aboveground biomass estimation using structure from motion approach with aerial photographs in a seasonal tropical forest. Forests 2015, 6, 3882–3898. [Google Scholar] [CrossRef]
- Puliti, S.; Ørka, H.O.; Gobakken, T.; Næsset, E. Inventory of small forest areas using an unmanned aerial system. Remote Sens. 2015, 7, 9632–9654. [Google Scholar] [CrossRef]
- Wallace, L.; Lucieer, A.; Malenovskỳ, Z.; Turner, D.; Vopěnka, P. Assessment of forest structure using two UAV techniques: A comparison of airborne laser scanning and structure from motion (SfM) point clouds. Forests 2016, 7, 62. [Google Scholar] [CrossRef]
- Zarco-Tejada, P.J.; Diaz-Varela, R.; Angileri, V.; Loudjani, P. Tree height quantification using very high resolution imagery acquired from an unmanned aerial vehicle (UAV) and automatic 3D photo-reconstruction methods. Eur. J. Agron. 2014, 55, 89–99. [Google Scholar] [CrossRef]
- Surový, P.; Almeida Ribeiro, N.; Panagiotidis, D. Estimation of positions and heights from UAV-sensed imagery in tree plantations in agrosilvopastoral systems. Int. J. Remote Sens. 2018, 39, 4786–4800. [Google Scholar] [CrossRef]
- Panagiotidis, D.; Abdollahnejad, A.; Surový, P.; Chiteculo, V. Determining tree height and crown diameter from high-resolution UAV imagery. Int. J. Remote Sens. 2017, 38, 2392–2410. [Google Scholar] [CrossRef]
- Huang, H.; He, S.; Chen, C. Leaf abundance affects tree height estimation derived from UAV images. Forests 2019, 10, 931. [Google Scholar] [CrossRef]
- Kanazawa, Y. Some analysis of the production process of a Quercus crispula Blume population in Nikko I. A record of acorn dispersal and seedling establishment for several years at three natural stands. Jpn. J. Ecol. 1982, 32, 325–331. [Google Scholar]
- Feldpausch, T.R.; Banin, L.; Phillips1, O.L.; Baker, T.R.; Lewis, S.L.; Quesada, C.A.; Affum-Baffoe, K.; Arets, E.J.M.M.; Berry, N.J.; Bird, M.; et al. Height-diameter allometry of tropical forest trees. Biogeosciences 2011, 8, 1081–1106. [Google Scholar] [CrossRef]
- Hulshof, C.M.; Swenson, N.G.; Weiser, M.D. Tree height-diameter allometry across the United States. Ecol. Evol. 2015, 5, 1193–1204. [Google Scholar] [CrossRef]
- Mehtätalo, L.; De-Miguel, S.; Gregoire, T.G. Modeling height-diameter curves for prediction. Can. J. For. Res. 2015, 45, 826–837. [Google Scholar] [CrossRef]
- Owari, T.; Matsui, M.; Inukai, H.; Kaji, M. Stand structure and geographic conditions of natural selection forests in central Hokkaido, northern Japan. J. For. Plan. 2011, 16, 207–214. [Google Scholar]
- McGaughey, R.J. FUSION/LDV: Software for LIDAR data analysis and visualizationn; USDA Forest Service Pacific Northwest Research Station: Seattle, WA, USA, 2018. [Google Scholar]
- Agisoft. Agisoft PhotoScan user manual: professional edition, Version 1.4; Agisoft: St. Petersburg, Russia, 2018. [Google Scholar]
- Wang, Y.; Hyyppa, J.; Liang, X.; Kaartinen, H.; Yu, X.; Lindberg, E.; Holmgren, J.; Qin, Y.; Mallet, C.; Ferraz, A.; et al. International benchmarking of the individual tree detection methods for modeling 3-D canopy structure for silviculture and forest ecology using airborne laser scanning. IEEE Trans. Geosci. Remote Sens. 2016, 54, 5011–5027. [Google Scholar] [CrossRef]
- Husch, B.; Beers, T.W.; Kershaw, J.A. Forest mensuration, 4th ed.; John Wiley & Sons: New York, NY, USA, 2003. [Google Scholar]
- King, D.A. Linking tree form, allocation and growth with an allometrically explicit model. Ecol. Modell. 2005, 185, 77–91. [Google Scholar] [CrossRef]
- Imani, G.; Boyemba, F.; Lewis, S.; Nabahungu, N.L.; Calders, K.; Zapfack, L.; Riera, B.; Balegamire, C.; Cuni-Sanchez, A. Height-diameter allometry and above ground biomass in tropical montane forests: Insights from the Albertine Rift in Africa. PLoS ONE 2017, 12, e0179653. [Google Scholar] [CrossRef]
- R Core Team. R: The R Project for Statistical Computing; R Foundation for Statistical Computing: Vienna, Austria; Available online: https://www.r-project.org/ (accessed on 6 January 2020).
- Jayathunga, S.; Owari, T.; Tsuyuki, S. Evaluating the performance of photogrammetric products using fixed-wing UAV imagery over a mixed conifer-broadleaf forest: Comparison with airborne laser scanning. Remote Sens. 2018, 10, 187. [Google Scholar] [CrossRef]
- Lisein, J.; Pierrot-Deseilligny, M.; Bonnet, S.; Lejeune, P. A photogrammetric workflow for the creation of a forest canopy height model from small unmanned aerial system imagery. Forests 2013, 4, 922–944. [Google Scholar] [CrossRef]
- Mielcarek, M.; Stereńczak, K.; Khosravipour, A. Testing and evaluating different LiDAR-derived canopy height model generation methods for tree height estimation. Int. J. Appl. Earth Obs. Geoinf. 2018, 71, 132–143. [Google Scholar] [CrossRef]
- Khosravipour, A.; Skidmore, A.K.; Wang, T.; Isenburg, M.; Khoshelham, K. Effect of slope on treetop detection using a LiDAR Canopy Height Model. ISPRS J. Photogramm. Remote Sens. 2015, 104, 44–52. [Google Scholar] [CrossRef]
© 2020 by the authors. Licensee MDPI, Basel, Switzerland. This article is an open access article distributed under the terms and conditions of the Creative Commons Attribution (CC BY) license (http://creativecommons.org/licenses/by/4.0/).