Abstract
We measured whole-tree transpiration of mature Fagus sylvatica and Picea abies trees exposed to ambient and twice-ambient O3 regimes (1xO3 and 2xO3 free-air fumigation). After eight years, mean daily total transpiration did not vary with the O3 regime over the 31 days of our study, even though individual daily values increased with increasing daily O3 peaks in both species. Although the environmental parameters were similar at 1xO3 and 2xO3, the main factors affecting daily transpiration were vapour pressure deficit in 2xO3 spruce and O3 peaks in beech. For a mechanistic explanation, we measured O3-induced sluggish stomatal responses to variable light (sunflecks) by means of leaf-level gas exchange measurements only in the species where O3 was a significant factor for transpiration, i.e., beech. Stomata were always slower in closing than in opening. The 2xO3 stomata were slower in opening and mostly in closing than 1xO3 stomata, so that O3 uptake and water loss were amplified before a steady state was reached. Such delay in the stomatal reaction suggests caution when assessing stomatal conductance under O3 pollution, because recording gas exchange at the time photosynthesis reached an equilibrium resulted in a significant overestimation of stomatal conductance when stomata were closing (ab. 90% at 1xO3 and 250% at 2xO3). Sun and shade leaves showed similar sluggish responses, thus suggesting that sluggishness may occur within the entire crown. The fact that total transpiration was similar at 1xO3 and 2xO3, however, suggests that the higher water loss due to stomatal sluggishness was offset by lower steady-state stomatal conductance at 2xO3. In conclusion, O3 exposure amplified short-term water loss from mature beech trees by slowing stomatal dynamics, while decreased long-term water loss because of lower steady-state stomatal conductance. Over the short term of this experiment, the two responses offset each other and no effect on total transpiration was observed.
1. Introduction
Forests cover 30% of the world’s land surface, generate half of the global net primary productivity, and play a significant role in regulating water supply [1]. Carbon assimilation and water use efficiency can be impaired by ground-level ozone (O3), an air pollutant of strong concern for forests because of its phytotoxicity and widespread distribution [2,3,4]. Ozone effects on forest ecosystems include changes in carbon fixation and allocation, shifts in nutrient supply, biodiversity changes, and higher susceptibility to natural disturbances, i.e., insects, disease, fires, wind storms and drought [5,6,7,8]. Such changes have important implications for forest responses to climate change. Scalar and conceptual uncertainties limit our understanding of the basic physiological mechanisms that underly responses of forests to O3 [9,10]. The scalar uncertainties are due to the transfer of results from seedlings in controlled environments to mature forests in the field [11], while the conceptual uncertainties are due to contrasting results about tree water-use responses to ambient O3 (e.g., [12]). A critical issue is thus to define stomatal responses to O3 exposure in mature trees [13].
Stomatal responses to air pollutants are complex, depending on plant species, leaf and tree age, level and length of exposure, and vary in conjunction with other environmental stressors [14,15]. There is a general consensus that stomatal closure is a response to the O3–induced damage to the photosynthetic machinery [5]. In parallel, however, stomatal control of transpiration may be reduced following O3 exposure, leading to wider or narrower stomatal apertures and uncoupling of stomatal conductance and photosynthesis (with effects on instantaneous water-use efficiency, WUEi; [16,17,18,19,20,21] and allowing for O3 influx at night [19,22,23,24]. The mechanism explaining delayed and/or slowed closing responses of stomata to fluctuating environmental stimula under O3 stress is termed stomatal sluggishness, defined as a longer time to respond to the ‘close’ signal and a slower rate of closing [13,15]. Paoletti [25] found that the dynamics of stomatal responses to light and water deficit slowed following controlled O3 exposure of Arbutus unedo seedlings. Sluggish stomatal responses are usually observed when O3 exposure is combined with water stress [17,25,26,27] or fluctuating light [25,28,29], because steady-state stomatal conductance measurements cannot reveal sluggishness [25]. Paoletti and Grulke [13] suggested that sluggish stomatal responses may be viewed basically as distinctly retarded stomatal movements under changing environmental conditions. In fact, stomatal conductance responds in general 10–100 times more slowly to changes in conditions than photosynthesis [30]. Ozone-induced ethylene emission has been suggested to affect the sluggish response by reducing stomatal sensitivity to abscisic acid (ABA) [31]. As a consequence of stomatal sluggishness, dynamic controls on tree water loss and stomatal O3 uptake may be impaired [32].
All the above results on sluggishness, however, were obtained with seedlings or saplings under controlled conditions. Relatively high O3 concentrations, potted plants, chamber effects, relatively short duration of most experiments, young tree age and low light are other controlled-condition factors that may affect upscaling of results from juvenile to mature trees [2]. In a Pinus ponderosa forest in California, Grulke et al. [33] reported the lack of stomatal closure at night in early summer which was greater in pole-sized than mature trees; thus there was greater total O3 uptake in pole-sized trees as a result of the greater nocturnal uptake. In mature trees from a US mixed deciduous forest, McLaughlin et al. [9,34] examined hourly to seasonal patterns of environmental parameters, stem growth, and sap flow velocity, and concluded that ambient O3 caused a periodic slowdown in seasonal growth patterns that was attributable in part to amplification of diurnal patterns of water loss in tree stems. This was supported by O3–induced increases in average sap-flow rates over the growing season. Statistically significant increases in whole-tree canopy conductance, depletion of soil moisture in the rooting zone, and reduced late-season streamflow in forested watersheds were concurrently detected in response to increasing ambient O3 levels. In mature Populus spp. trees protected or not by the antiozonant ethylenediurea and exposed to ambient O3 in Italy, Giovannelli et al. [35] found evidence of stomatal sluggishness only in mornings in the summer when the O3-injured trees increased sap flow so that the internal water resources were mobilized during periods of intense evaporative demand. Also, Sun et al. [36] found that stand sap flux of a mixed aspen-birch community in the Aspen O3 FACE increased progressively during the summer relative to ambient air, suggesting increased stomatal opening. Conversely, mature beech trees under free-air fumigation within the stand canopy showed the enhanced O3 regime to reduce crown transpiration and conductance in summer during late-morning through early-afternoon hours [24].
Lack of data on water-use responses of mature trees under enhanced O3 exposure and on the leaf to tree-level integration are major limitations in understanding and modeling responses of forests to environmental changes [4,7,37]. To fill these gaps, we aimed at quantifying whole-tree transpiration and leaf-level variable-light (flecky, where sunflecks are rapid changes in light on leaf surfaces) gas exchange at Kranzberg Forest, where ambient and twice-ambient O3 regimes had been applied to adult trees of Fagus sylvatica and Picea abies for 8 years [38,39]. Interactions between O3 and other environmental variables that could change transpiration by individual trees were quantified. To investigate the mechanisms of O3 action, we postulated that O3-induced sluggish stomatal responses to fluctuating environmental parameters, namely flecky light, increase short-term water loss from the foliage. Variable light may represent two-thirds of the incident light sums in forest canopies [40] with relevance for productivity. As light intensity may affect sluggishness [41] and light regimes within canopies affect leaf differentiation, we tested sun and shade leaves to explore whether sluggishness has the potential to occur across an entire tree crown.
2. Materials and Methods
2.1. Experimental Design and Environmental Data
The site was located at Kranzberger Forst near Freising, Germany (48°25′ N, 11°39′ E, elevation 485 m a.s.l.) in a mixed stand of 53 to 60-year-old Norway spruce (Picea abies) and European beech (Fagus sylvatica).
Exposure to above-ambient O3 concentrations was conducted through an O3 FACE employed within the forest canopy [42,43]. Entire crowns were exposed throughout eight growing seasons (2000–2007) to a twice-ambient O3 regime (2xO3) and compared to trees in unchanged ambient air (1xO3) which served as controls. At 2xO3, maximum O3 concentrations were restricted to 150 ppb to prevent the risk of acute O3 injury [42]. A total of eight O3 analyzers were operated across the site, checked each day for consistency across zero lines and spans, and recalibrated as necessary (an average, once a month). Further details about stand and exposure are in [12,39].
In July 2007, four to five dominant trees of each species within each exposure regime were selected as described in [12,39], each individual is regarded as a replicated case study on its own [44]. 1xO3 and 2xO3 trees were in two separated groups. Air temperature, relative humidity of the air, photosynthetic photon flux density and O3 levels were monitored at 24 m aboveground at top of the canopy (psychro- and baro-transmitter, ThiesClima, Goettingen, Germany; O3 analyzer: ML8811, Monitor Labs, USA). Soil moisture was recorded at 20-cm depth. Environmental data were recorded as 10-min means (DL2e data logger, Delta-T-Devices, Burwell, Cambridge, U.K.). AOT40 was calculated as the sum of O3 concentrations exceeding a threshold of 40 ppb during daylight hours (global radiation > 50 W m−2) [45] (CLRTAP, 2017).
During the 8th year of free-air fumigation, we carried out this experiment in July 2017 (1st to 31st). Descriptors of environmental conditions during the 31-day experiment are in Figure 1 and Table 1, and show no significant difference of environmental variables between the two O3 regimes, while O3 daily means, O3 daily spikes and AOT40 (hourly values exceeding 40 ppb accumulated over the light hours of the experimental period) were significantly higher at 2xO3. Soil moisture and the other environmental parameters were not limiting for gs of beech and spruce over the experiment.

Figure 1.
Descriptors of ozone exposure at ambient (1xO3) and twice-ambient ozone (2xO3). Data are daily means of hourly concentrations and accumulated hourly values above 40 ppb (+SE) in July 2007. Different letters show significant differences between the ozone regimes (t-test or Mann–Whitney U test, p < 0.001, n = 31 days).

Table 1.
Mean daily environmental parameters (±Standard Error) did not differ between 1xO3 and 2xO3 (t-test, ns, p > 0.05, n = 31 days). Data are daily values for all parameters except photosynthetic photon flux density (diurnal) for July 2007.
2.2. Assessment of Xylem Sap Flow and Calculation of Whole-Tree Transpiration
Sap flow was measured with 2-cm long continuously heated sap flow gauges according to Granier [46] at 0–2 cm sapwood depth. Sensors were inserted into the tree xylem at breast height (one sensor each at S and N-exposure) in beech and spruce trees. Additional sensors at 4 and 6 cm depth determined the variation in sap flow across the cross-sectional sapwood area of two trees per species. The sapwood area-related flow density at depths beyond 6 cm was linearly extrapolated towards the heartwood area on the basis of the assessments at 2, 4 and 6 cm depth. The proportional reductions in sap flow with increasing depths were used to express the sap flow density across the entire cross-sectional sapwood area in relation to the sensor readings at 2 cm depth. The relationship was adapted to all study trees in each species. The cross-sectional sapwood area was derived from increment cores of neighboring trees with DBH similar to that of the study trees. The product of sap flow density and cross-sectional sapwood area at breast height rendered whole-tree transpiration. Sap flow data were recorded as 10-min means, at the same intervals as environmental data. Results are shown for the 31-day experimental period.
2.3. Assessment of Stomatal Responses to Fleck Light
As O3 resulted to be a significant factor affecting transpiration only in beech (Table 2), leaf-level gas exchange was measured at 8–13 CET only in this species, by means of an open-flow gas analyzer (Li-6400; Li-Cor, Inc., Lincoln NE, USA), recording data every 30 s. Twelve leaves (six sun leaves at top of the crown and 6 shade leaves at 2 m below the top) per beech tree, three trees per each of the two O3 regimes, were selected for experimental manipulation of light. Leaves were free of visible injury on the 3rd to 5th position from the shoot tip. According to [25], light levels were alternated between 1500 and 100 μmol m−2 s−1, waiting for stomatal adjustment after each light level. Full adjustment was established at two consecutive minutes of stable stomatal conductance (gs). Steady-state in practice means that gs showed no systematic decrease or increase (±2%) over a 2 min period. The treatment was repeated two times, under constant leaf-to-air vapour pressure deficit (<2 kPa). Descriptors of gas exchange responses to light manipulation were calculated as average of the two cycles per leaf: maximum and minimum gs and photosynthesis (A); span of gs and A variation, as difference between maximum and minimum values; time gs and A reached equilibrium when stomata closed and opened; error in recording gs at the time A reached equilibrium, calculated as percent of steady-state gs; cumulated water loss and stomatal O3 uptake, calculated as during closing, and as during opening, where Vk is the mean value of each 30-s interval and Veq is the value at equilibrium. Water loss was calculated as mmol of transpired H2O per leaf m2. Assuming that O3 concentrations inside the mesophyll approach zero [47], stomatal O3 uptake was calculated by converting gs into stomatal conductance for O3 and multiplying times the concurrent O3 concentrations in ambient air [48].
Table 2.
Summary of a stepwise multiple linear regression to quantify the effects of the daily 10-min means of O3 concentrations (ozavg), O3 peaks (ozmax), vapour pressure difference means (vpd_avg), VPD peaks (vpd_max), air temperature means (t_avg), air temperature peaks (t_max), photosynthetic photon flux density means (ppfd), on mean daily total transpiration in beech at spruce at different ozone regimes. Bold p values are significant at p < 0.05.
2.4. Data Analysis
Data were checked for normal distribution (Kolmogorov–Smirnov D test). A one-way analysis of variance (ANOVA) was applied to environmental and O3 data, with the O3 regime as a factor. Differences between regimes were tested by a t-test for normally distributed variables and by a non parametric Mann–Whitney U test for non-normally distributed variables, i.e., daily means of O3 peaks and AOT40. A two-way ANOVA was applied to transpiration data, with O3 regime (1xO3 vs. 2xO3) and tree species (beech vs. spruce) as factors. A two-way ANOVA was applied to data from fleck light responses, with O3 regime (1xO3 vs. 2xO3) and leaf type (sun vs. shade) as factors. Linear correlations among all the variables were tested. The effects of O3 on transpiration were tested between lines for colinearity [49]. Stepwise multiple regressions were applied to consider concurrent influences of the daily means of 10-min O3 means (ozavg), O3 peaks (ozmax), vapour pressure difference means (vpd_avg), VPD peaks (vpd_max), air temperature means (t_avg), air temperature peaks (t_max), photosynthetic photon flux density means (ppfd), and to identify the variables that most significantly influenced daily transpiration in beech and spruce in the two O3 regimes. Tests of significance were made at a 95% confidence level. Data were processed using the STATISTICA 10.0 package for Windows (StatSoft, Tulsa, OK, USA).
3. Results
3.1. Tree-Level Transpiration
Sap-flow measurements showed that daily total transpiration increased with increasing daily O3 concentrations (both mean and max), in both species (Figure 2, Table 3). The correlation was not significant at 1xO3 in beech, so that slope and intercept of the 1xO3 and 2xO3 correlation lines were not compared while they significantly differed in spruce (Figure 2). In spruce, transpiration was more sensitive to O3 at 1xO3 than at 2xO3 as supported by a higher slope. To explain this surprising result, we focused on the environmental parameters, as other-than-O3 factors may have affected this result. Although environmental parameters were similar at 1xO3 and 2xO3 (Table 1), most of the investigated variables (daily means of 10-min transpiration, O3 means, O3 peaks, VPD means, VPD peaks, air temperature means, air temperature peaks, photosynthetic flux density means) were inter-correlated, with the notable exception of (mean and peak) O3 and beech transpiration at 1xO3 (Table 3). A multiple linear stepwise regression was thus applied to quantify the relative contribution of each factor to transpiration. The main factors affecting transpiration were light (in both species and O3 regimes) and VPD (in spruce) (Table 2). Ozone peaks affected transpiration (5–8% of the variance) only in beech.
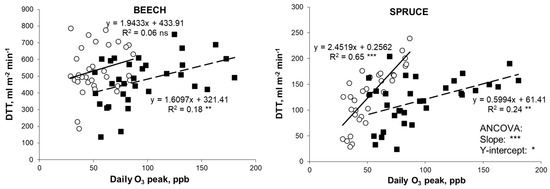
Figure 2.
Daily total transpiration (DTT) increased with increasing daily ozone peaks in mature trees of European beech and Norway spruce exposed to ambient (○ solid line) and twice-ambient O3 regimes (■, dashed line) (July 2007). Each point is the average of 4–5 trees. Asterisks show the significance of the analysis: ***, p < 0.001; **, p < 0.01; *, p < 0.05; ns, p ≥ 0.05.
Table 3.
Correlation coefficient (r) and level of significance (p) in the correlation matrix among daily values of total transpiration in beech (BTr) and spruce (STr) and 10-min means of O3 concentrations (ozavg), O3 peaks (ozmax), vapour pressure difference means (vpd_avg), vapour pressure deficit peaks (vpd_max), air temperature means (t_avg), air temperature peaks (t_max), photosynthetic photon flux density means (ppfd) at ambient (1x) and twice-ambient ozone (2x). Bold p values are significant at p < 0.05.
When analyzing total transpiration with O3 regime as a factor, the 2xO3 regime did not induce a significant reduction in transpiration (Figure 3). The reduction was in agreement with 2xO3 leaf-level steady-state measurements showing lower gs than 1xO3 (Figure 4A).
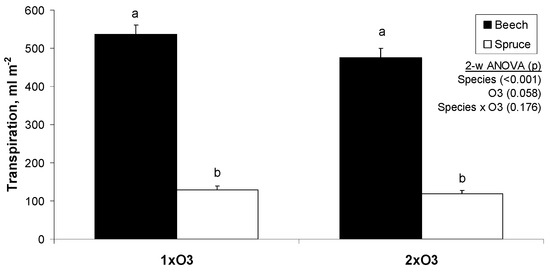
Figure 3.
Mean daily total transpiration (±SE) calculated from sap flow measurements in beech and spruce trees. Each bar is the average of 4–5 trees in 31 days (July 2007). The inset shows the levels of significance from a two-way (tree species x O3 regime) analysis of variance (n = 31 days).
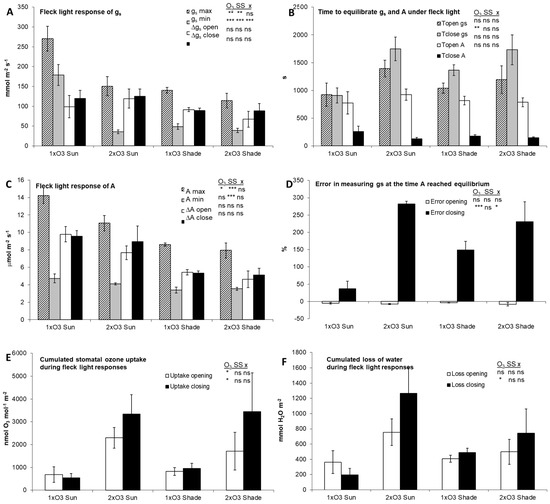
Figure 4.
Summary of stomatal and assimilatory responses to fleck light in beech (± SE): (A) max and min stomatal conductance (gs) and span of gs variation (Δ); (B) time gs and A reached equilibrium when stomata closed and opened (T); (C) max and min photosynthesis (A) and span of A variation (Δ); (D) error in measuring gs at the time A reached equilibrium when stomata closed and opened (error); (E) relative stomatal ozone uptake during opening and closing (uptake); (F) relative water loss during opening and closing (loss). The insets show the results of a two-way (O3 regime x Sun/Shade leaf) ANOVA: ns, p > 0.05; *, p < 0.05; **, p < 0.01; ***, p < 0.001. Each bar is the average of two cycles on six leaves (n = 6).
3.2. Leaf-Level Flecky Light Responses
At both O3 regimes, beech stomata were slower in closing (Tclose gs) than in opening (Topen gs), with no significant difference depending on the leaf light exposure level (i.e., sun vs. shade; Figure 4B). The 2xO3 stomata were slower in opening and—in particular—in closing than 1xO3 stomata, again with no significant difference between leaf light exposure level. As a result, cumulated stomatal O3 uptake before stomata reached equilibrium was 1.7 (during opening) and 4.6 times (during closing) greater in 2xO3 leaves than in 1xO3 leaves, both for sun (+236% and +527%, respectively) and shade leaves (+109% and +272%, respectively) (Figure 4E), while O3 concentrations were just 0.6 times greater at 2xO3 than that at 1xO3 (Figure 1). Cumulated water loss during stomatal adjustment was also greater at 2xO3 than at 1xO3, although the difference was significant only during stomata closing (Figure 4F). Shade and sun leaves showed similar responses, except for the maximum and minimum values of gs and A, which were lower in shade leaves (Figure 4A,C). A number of unresponsive 2xO3 leaves were detected. After shutting down, the stomata of unresponsive leaves did not reopen regularly (Figure 5). Data from unresponsive leaves were discarded because a steady state was not reached. If gs was recorded at the time A reached an equilibrium, an error was generated (Figure 4D and Figure 6). This error was larger when measurements were carried out from high to low light (on average, +174%) than from low to high light (−6%). This error was much larger in 2xO3 leaves (+256% and −8% during closing and opening, respectively) than in 1xO3 leaves (+93% and −5%). The error during stomatal closure was higher in shade than sun leaves at 1xO3 (230% vs. 282%) and vice versa at 2xO3 (149% vs. 37%).
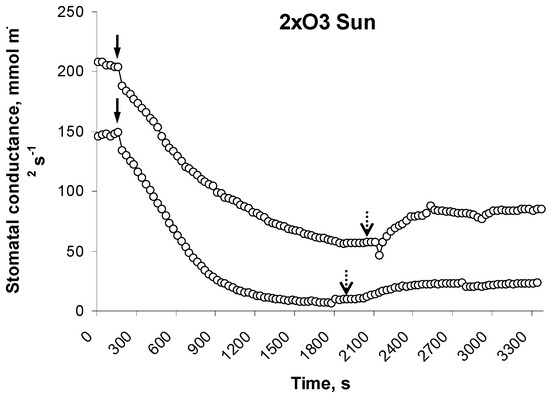
Figure 5.
Examples of unresponsive 2xO3 beech leaves. Stomata closed regularly when the light was off (full arrows) but did not re-open when the light was on (dotted arrows).
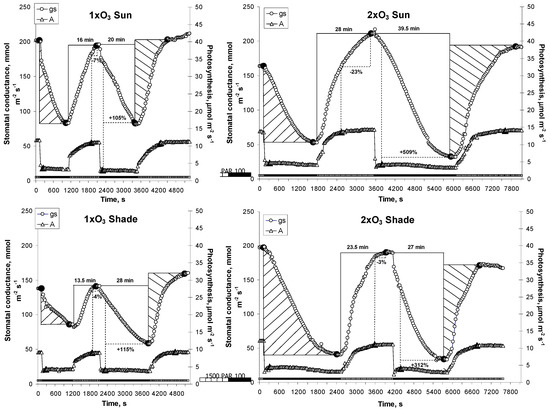
Figure 6.
Example of fleck light responses in sun and shade leaves of beech trees. When stomatal conductance (gs) achieved equilibrium, the light intensity was sharply decreased from 1500 to 100 μmol m−2 s−1 until equilibrium, and then increased again. The treatment was repeated two times. Full symbols show the time equilibrium was reached, i.e., gs or A (photosynthesis) values were stable in the following two minutes. Full lines show examples of calculation of the time to open and to close stomata (in min). Dotted lines show examples of calculation of the error in recording gs at the time A reached equilibrium (as percent of steady-state gs). Slashed surfaces show examples of cumulated water loss and stomatal O3 uptake when stomata closed (/) and opened (\).
4. Discussion
4.1. Responses of Tree-Level Transpiration
By regulating evapotranspiration, forests play a key role in the global hydrologic cycle [50] and how O3 affects transpiration via stomata is thus critical to modeling efforts [13]. Drought stress has often been reported to mitigate the negative impacts of O3 on young tree physiology and growth under controlled conditions [11,51,52,53]. However, empirical evidence from mature trees including physiological [33,35,54] and growth measurements [9,34] suggests that drought effects are exacerbated, not reduced, by the combination with elevated O3, which would challenge forest capacity to buffer extreme hydrological events [36]. To investigate the reasons for this dichotomy, we measured whole-tree transpiration of mature beech and spruce trees that had been exposed for 8 years to ambient and twice-ambient O3 regimes. Over the 31 days of our summer study, mean daily total transpiration did not vary with the O3 regime, because the slight reductions from 1xO3 to 2xO3 (−11% in beech and –8% in spruce) were not significant, although a tendency was found (p = 0.058). Our current study conducted in 2007 contrasted with findings by Matyssek et al. [24] during the summer months of 2006, reporting on distinct decreases of crown-level transpiration and conductance around noon in beech under 2xO3, suggesting a major role of environmental factors in regulating O3 impacts.
When individual daily values were correlated with daily O3 peaks, daily transpiration was found to increase with increasing daily values of O3 in both species (but insignificant in beech at 1xO3). An analysis carried out with mean O3 values and non-linear approaches gave very similar results (not shown). However, O3 levels are known to co-vary with a number of environmental factors (e.g., VPD, SWC; [55] that may remarkably affect plant transpiration as confirmed in our experiment. A multiple linear regression demonstrated the role of O3 in affecting transpiration in beech (5–8% of the total variance) but not in spruce. Such species-specific differential responses are typical of O3 [56,57]. In particular, spruce is usually considered more O3-tolerant than beech [58] as it is the case for most conifers, characterized by lower gas exchange and O3 uptake and higher antioxidant capacity than broadleaf trees. A meta-analysis by Li et al. [5] found that the plant functional type has a major role in affecting the growth, physiological, and biochemical responses of woody species to O3.
4.2. Steady-State and Dynamic Responses of Leaf-Level Gas Exchange (Sun/Shade)
It is well known that stomata close because of higher intercellular CO2 concentration following O3 attack to the photosynthetic membranes [5]. In our beech experiment, the responses of steady-state gs and A to O3 varied in tandem, suggesting coupling and decrease of transpiration and carbon assimilation, although effects on the latter were minor [59]. Several previous studies found an uncoupling of gs and A under O3, in that A decreased and gs did not vary [17,18,19,20,21,60]. The even higher decline of steady-state gs (−44% and −19% in sun and shade leaves, respectively; in consistency with Matyssek et al. [24]) than of A (−21% and −11%) when comparing 2xO3 with 1xO3 leaves, is the result of the rather long time we waited before actual steady-state of gs was reached: 15–17 min to open and 15–25 min to close at 1xO3 and 23–20 min to open and 29–29 min to close at 2xO3 in sun-shade leaves. Equilibrium of A, in fact, required shorter times, namely 13–14 min to open and 4–3 min to close at 1xO3 and 15–13 min to open and 2–2 min to close at 2xO3 in sun-shade leaves. These results are in agreement with Morison [30] that stomata require more time to reach equilibrium than A. Recording gs when A reaches equilibrium, however, it is a common practice. In response to flecky light, this practice may generate significant overestimations of gs when measurements are carried out during stomatal closing movement (ab. 90% at 1xO3), and especially when stomatal responses to enhanced O3 exposure are investigated (ab. 250% at 2xO3). Such delay in stomatal responsiveness suggests caution when assessing gs under O3 pollution. Steady-state A is typically measured within 2–5 min from changing conditions [61,62], because longer measurement times would affect the steady-state activation of Rubisco and introduce errors [61]. Parameterizing gs is a pillar of flux-based O3 risk assessment for vegetation [63,64]. Therefore, we recommend separate recordings i.e., first for steady-state A and then for steady-state gs, especially when leaves are exposed to O3.
Timespans of gs equilibration confirmed a significant slowdown of the stomatal dynamics at elevated O3 [25]. During such extended periods, stomata absorbed more O3 (3.4 and 2.1 times to open and 6.3 and 3.6 times to close in sun and shade leaves, respectively) and lost more water (2.1 and 1.2 times to open and 6.4 and 1.5 times to close in sun and shade leaves, respectively) than the rapidly responding stomata in ambient O3 (1xO3). Thus, modeling uptake and effects of future O3 pollution may result in underestimation if stomatal sluggishness is not considered [20]. The ecological consequences of these sluggish stomatal responses were estimated for carbon and water balance of deciduous temperate forests at global scale: enhanced O3 was suggested to decrease instantaneous water use efficiency, i.e., the ratio of net CO2 assimilation to transpiration, up to 20% when stomatal sluggishness is considered, and up to only 5% when absent [32]. Such an O3-induced decoupling of A and gs implies that O3 affects gross primary productivity more than transpiration [60]. We postulate that the extra loss of water during sluggish stomatal responses offset part of the reduction in transpiration due to lower steady-state gs. The combination of the two contrasting stomatal phenomena translated into a modest 11% reduction of transpiration in beech at 2xO3 relative to 1xO3, while steady-state gs decreased by 44% in sun leaves and 19% in shade leaves (cf. [24]).
Following Giovannelli [35], longer stomatal opening may increase sap flow and mobilizing the internal water resources in the stem, especially during summer periods with high evaporative demand. Stem water reserves (mainly from phloem and living bark along with capacities from the xylem body) are able to support daily transpiration by 8 to 20% in mature trees [65,66]. This sluggish response supports the hypothesis that O3 pollution amplifies water deficits in forest trees [33,34,54]. However, a means of buffering uncontrolled water loss by sluggish stomata leaves in premature shedding of severely injured leaves [67]. We did not assess leaf shedding in our study, although autumnal leaf shedding was accelerated annually to the variable extent under 2xO3 throughout the eight-year experiment [42]. Additional buffering of water loss factor may be provided by unresponsive leaves that did not reopen their stomata after shutting down. Understanding the mechanisms of stomatal responsiveness under O3 stress will help the upscaling of stomatal responses to O3 from the leaf to the tree crown and regional level [48].
Gas exchange of shade leaves was less responsive to O3 exposure than that of sun leaves (in this experiment, but see also [58]). In addition, sluggishness is enhanced at high light availability [41]. Nevertheless, our hypothesis that stomatal sluggishness occurred only in the peripheral crown needs to be rejected. Sluggish responses were similar between O3 regimes and leaf types, and in the absence of significant interactions. We conclude that sluggishness may occur across an entire crown, independently on the leaf type.
5. Conclusions
Stomatal sluggishness occurred under O3 stress across entire crowns, independent of leaf type. Hence, short-term water loss from mature beech trees was amplified by slowed stomatal dynamics, while long-term water loss was restricted because of decreased steady-state stomatal conductance. Over the short term of our observations, the two responses appeared to offset each other with a tendency of declining whole-tree transpiration. Whether stomatal sluggishness is a means for buffering gs decline and, hence, mobilizing internal water resources, or a collateral effect of O3-perturbed hormonal relationships [31] remains an intriguing question.
The elevated O3 concentrations simulated in our experiment (55 ppb as daily average) are similar to those predicted for large areas of the most polluted world regions by RCP8.5 [68]. Increased water use of mature forest trees under episodically high O3 events may exacerbate the adverse effects of climatic changes on forest growth and hydrology. As climate change increases the risk of drought and flooding, hydrological consequences of contrasting stomatal O3 responses should be evaluated in the longer term and for more species, as only beech transpiration was significantly affected by O3 in this experiment.
Author Contributions
Conceptualization, E.P., N.E.G., R.M.; methodology, E.P., N.E.G., R.M.; formal analysis, E.P., N.E.G.; data analysis, E.P., N.E.G., R.M.; writing—original draft preparation, E.P.; writing—review and editing, E.P., N.E.G., R.M; project coordination R.M.; funding acquisition, R.M. All authors have read and agreed to the published version of the manuscript.
Funding
This research was funded by the CASIROZ project (“The carbon sink strength of beech in a changing environment: Experimental risk assessment of mitigation by chronic ozone impact’’), funded through European Commission—Research Directorate General, Environment Programme, Natural Resources Management and Services (contract no. EVK2—2002—00165, Ecosystem Vulnerability), and by Integrated Research Center ‘SFB 607: Growth and parasite defense—competition for resources in economic plants from agronomy and forestry’, funded through Deutsche Forschungsgemeinschaft (DFG). And The APC was funded by the LIFE project MOTTLES (LIFE15 ENV/IT/000183).
Acknowledgments
We acknowledge support by Angela J. Nunn in getting the field measurements of transpiration and meteorological parameters. Soil water content data are courtesy of L. Zimmermann; LWF, climate station ‘Kranzberger Forst’.
Conflicts of Interest
The authors declare no conflict of interest.
References
- Bonan, G.B. Forests and climate change: Forcings, feedbacks, and the climate benefits of forests. Science 2008, 320, 1444–1449. [Google Scholar] [CrossRef]
- Paoletti, E. Ozone impacts on forests. Cab Rev. Perspect. Agric. Vet. Sci. Nutr. Nat. Resour. 2007, 2, 13. [Google Scholar] [CrossRef]
- Mills, G.; Pleijel, H.; Malley, C.S.; Sinha, B.; Cooper, O.R.; Schultz, M.G.; Neufeld, H.S.; Simpson, D.; Sharps, K.; Feng, Z.; et al. Tropospheric Ozone Assessment Report: Present-day tropospheric ozone distribution and trends relevant to vegetation. Elem. Sci. Anthr. 2018, 6, 47. [Google Scholar] [CrossRef]
- Matyssek, R.; Kozovits, A.R.; Wieser, G.; King, J.; Rennenberg, H. Woody-plant ecosystems under climate change and air pollution—response consistencies across zonobiomes? Tree Physiol. 2017, 37, 706–732. [Google Scholar] [CrossRef] [PubMed]
- Li, P.; Feng, Z.; Catalayud, V.; Yuan, X.; Xu, Y.; Paoletti, E. A meta-analysis on growth, physiological, and biochemical responses of woody species to ground-level ozone highlights the role of plant functional types. Plant Cell Environ. 2017, 40, 2369–2380. [Google Scholar] [CrossRef] [PubMed]
- Grulke, N.E.; Heath, R.L. Ozone effects on plants in natural ecosystems. Plant Biol. 2019, 22, 1435–8603. [Google Scholar] [CrossRef] [PubMed]
- Matyssek, R.; Kozovits, A.R.; Schnitzler, J.; Pretzsch, J.; Dieler, J.; Wieser, G. Forest trees under air pollution as a factor of climate change. In Trees in a Changing Environment; Tausz, M., Grulke, N., Eds.; Plant Ecophysiology; Springer: Berlin/Heidelberg, Germany, 2014; Volume 9, pp. 117–163. [Google Scholar]
- Weigt, R.; Haeberle, K.-H.; Roetzer, T.; Matyssek, R. Whole-tree seasonal nitrogen uptake and partitioning in adult Fagus sylvatica L. and Picea abies L. [Karst.] trees exposed to elevated ground-level ozone. Environ. Pollut. 2015, 196, 511–517. [Google Scholar] [CrossRef]
- McLaughlin, S.B.; Nosal, M.; Wullschleger, S.D.; Sun, G. Interactive effects of ozone and climate on tree growth and water use in a southern Appalachian forest in the USA. New Phytol. 2007, 174, 109–124. [Google Scholar] [CrossRef]
- Matyssek, R.; Wieser, G.; Fleischmann, F.; Grünhage, L. Ozone Research, quo vadis? Lessons from the free-air canopy fumigation experiment at Kranzberg Forest. In Climate Change, Air Pollution and Global Challenges: Understanding and Perspectives from Forest Research; Matyssek, R., Clarke, N., Cudlin, P., Mikkelsen, T.N., Tuovinen, J.-P., Wieser, G., Paoletti, E., Eds.; Developments in Environmental Science 13; Elsevier: Amsterdam, The Netherlands, 2013; pp. 103–129. [Google Scholar]
- Kolb, T.E.; Matyssek, R. Limitations and perspectives about scaling ozone impact in trees. Environ. Pollut. 2001, 115, 373–393. [Google Scholar] [CrossRef]
- Löw, M.; Herbinger, K.; Nunn, A.J.; Haberle, K.-H.; Leuchner, M.; Heerdt, C.; Werner, H.; Wipfler, P.; Pretzsch, H.; Tausz, M.; et al. Extraordinary drought of 2003 overrules ozone impact on adult beech trees (Fagus sylvatica). Trees 2006, 20, 539–548. [Google Scholar] [CrossRef]
- Paoletti, E.; Grulke, N.E. Does living in elevated CO2 ameliorate tree response to ozone? A review on stomatal responses. Environ. Pollut. 2005, 137, 483–493. [Google Scholar] [CrossRef] [PubMed]
- McAinsh, M.R.; Evans, N.H.; Montgomery, L.T.; North, K.A. Calcium signalling in stomatal responses to pollutants. New Phytol. 2002, 153, 441–447. [Google Scholar] [CrossRef]
- Paoletti, E.; Grulke, N.E. Ozone exposure and stomatal sluggishness in different plant physiognomic classes. Environ. Pollut. 2010, 158, 2664–2671. [Google Scholar] [CrossRef] [PubMed]
- Matyssek, R.; Günthardt-Goerg, M.S.; Keller, T.; Scheidegger, C. Impairment of the gas exchange and structure in birch leaves (Betula pendula) caused by low ozone concentrations. Trees 1991, 5, 5–13. [Google Scholar] [CrossRef]
- Grulke, N.E. Physiological responses of ponderosa pine to gradients of environmental stressors. In Oxidant Air Pollution Impacts in the Montane Forests of Southern California; Miller, P.R., McBride, J.R., Eds.; Springer-Verlag: New York, NY, USA, 1999. [Google Scholar]
- Paoletti, E.; Nali, C.; Lorenzini, G. Early responses to acute ozone in two Fagus sylvatica clones differing in xeromorphic adaptations: Photosynthetic and stomatal processes, membrane and epicuticular characteristics. Environ. Monit. Assess. 2007, 128, 93–108. [Google Scholar] [CrossRef] [PubMed]
- Grulke, N.E.; Paoletti, E.; Heath, R.L. Chronic vs. short-term acute O3 exposure effects on nocturnal transpiration in two Californian oaks. Sci. World J. 2007, 7, 134–140. [Google Scholar] [CrossRef][Green Version]
- Grulke, N.E.; Paoletti, E.; Heath, R.L. Comparison of calculated and measured foliar O3 flux in crop and forest species. Environ. Pollut. 2007, 146, 640–647. [Google Scholar] [CrossRef]
- Hoshika, Y.; Carriero, G.; Feng, Z.; Zhang, Y.; Paoletti, E. Determinants of stomatal sluggishness in ozone-exposed deciduous tree species. Sci. Total Environ. 2014, 481, 453–458. [Google Scholar] [CrossRef]
- Hoshika, Y.; De Carlo, A.; Baraldi, R.; Neri, L.; Carrari, E.; Agathokleous, E.; Zhang, L.; Fares, S.; Paoletti, E. Ozone-induced impairment of night-time stomatal closure in O3-sensitive poplar clone is affected by nitrogen but not by phosphorus enrichment. Sci. Total Environ. 2019, 692, 713–722. [Google Scholar] [CrossRef]
- Matyssek, R.; Gunthardt-Goerg, M.; Maurer, S.; Keller, T. Nighttime exposure to ozone reduces whole-plant production in Betula pendula. Tree Physiol. 1995, 15, 159–165. [Google Scholar] [CrossRef]
- Matyssek, R.; Baumgarten, M.; Hummel, U.; Häberle, K.-H.; Kitao, M.; Wieser, G. Canopy-level stomatal narrowing in adult Fagus sylvatica under O3 stress–means of preventing enhanced O3 uptake under high O3 exposure? Environ. Pollut. 2015, 196, 518–526. [Google Scholar] [CrossRef] [PubMed]
- Paoletti, E. Ozone slows stomatal response to light and leaf wounding in a Mediterranean evergreen broadleaf, Arbutus unedo. Environ. Pollut. 2005, 134, 439–445. [Google Scholar] [CrossRef] [PubMed]
- Patterson, M.T.; Rundel, P.W. Seasonal physiological responses of ozone stressed Jeffrey pine in Sequoia National Park, California. In Effects of Air Pollution on Western Forests; Olson, R.K., Lefohn, A., Eds.; Air and Waste Management Association: Pittsburgh, PA, USA, 1989. [Google Scholar]
- Pearson, M.; Mansfield, T.A. Interacting effects of ozone and water stress on the stomatal resistance of beech (Fagus sylvatica L.). New Phytol. 1993, 123, 351–358. [Google Scholar] [CrossRef]
- Keller, T.; Häsler, R. The influence of a fall fumigation with ozone on the stomatal behavior of spruce and fir. Oecologia 1984, 64, 284–286. [Google Scholar] [CrossRef] [PubMed]
- Reich, P.B.; Lassoie, J.P. Effects of low level ozone exposure on leaf diffusive conductance and water use efficiency caused be air pollutants. Plant Cell Environ. 1984, 7, 661–668. [Google Scholar] [CrossRef]
- Morison, J.I.L. Stomatal response to increased CO2 concentration. J. Exp. Bot. 1998, 49, 443–452. [Google Scholar] [CrossRef]
- Wilkinson, S.; Davies, W. Drought, ozone, ABA and ethylene: New insights from cell to plant community. Plant Cell Environ. 2010, 33, 510–525. [Google Scholar] [CrossRef]
- Hoshika, Y.; Katata, G.; Deushi, M.; Watanabe, M.; Koike, T.; Paoletti, E. Ozone-induced stomatal sluggishness changes carbon and water balance of temperate deciduous forests. Sci. Rep. 2016, 5, 9871. [Google Scholar] [CrossRef]
- Grulke, N.E.; Alonso, R.; Nguyen, T.; Cascio, C.; Dobrowolski, W. Stomata open at night in pole-sized and mature ponderosa pine: Implications for O3 exposure metrics. Tree Physiol. 2004, 24, 1001–1010. [Google Scholar] [CrossRef]
- McLaughlin, S.B.; Wullschleger, S.D.; Sun, G.; Nosal, M. Interactive effects of ozone and climate on water use, soil moisture content and streamflow in a southern Appalachian forest in the USA. New Phytol. 2007, 174, 125–136. [Google Scholar] [CrossRef]
- Giovannelli, A.; Traversi, M.L.; Anichini, M.; Hoshika, Y.; Fares, S.; Paoletti, E. Effect of long-term vs. short-term ambient ozone exposure on radial stem growth, sap flux and xylem morphology of O3-sensitive poplar trees. Forests 2019, 10, 396. [Google Scholar] [CrossRef]
- Sun, G.; Mclaughlin, S.M.; Porter, J.H.M.; Uddling, J.; Mulholland, P.J.; Adams, M.B.; Pederson, N. Interactive influences of ozone and climate on streamflow of forested watersheds. Glob. Chang. Biol. 2012, 18, 3395–3409. [Google Scholar] [CrossRef]
- Hoshika, Y.; Watanabe, M.; Carrari, E.; Paoletti, E.; Koike, T. Ozone-induced stomatal sluggishness changes stomatal parameters of Jarvis-type model in white birch and deciduous oak. Plant Biol. 2018, 20, 20–28. [Google Scholar] [CrossRef] [PubMed]
- Matyssek, R.; Bahnweg, G.; Ceulemans, R.; Fabian, P.; Grill, D.; Hanke, D.E.; Kraigher, H.; Osswald, W.; Rennenberg, H.; Sandermann, H.; et al. Synopsis of the CASIROZ case study: Carbon sink strength of Fagus sylvatica L. in a changing environment: Experimental risk assessment of mitigation by chronic ozone impact. Plant Biol. 2007, 9, 163–180. [Google Scholar] [CrossRef] [PubMed]
- Matyssek, R.; Wieser, G.; Ceulemans, R.; Rennenberg, H.; Pretzsch, H.; Haberer, K.; Löw, M.; Nunn, J.J.; Werner, H.; Wipfler, P.; et al. Enhanced ozone strongly reduces carbon sink strength of adult beech (Fagus sylvatica)-Resume from the free-air fumigation study at Kranzberg Forest. Environ. Pollut. 2010, 158, 2527–2532. [Google Scholar] [CrossRef]
- Pearcy, F.W. Sunflecks and photosynthesis in plant canopies. Annu. Rev. Plant Physiol. Plant Mol. Biol. 1990, 41, 421–453. [Google Scholar] [CrossRef]
- Hoshika, Y.; De Marco, A.; Materassi, A.; Paoletti, E. Light intensity affects ozone-induced stomatal sluggishness in snapbean. Water Air Soil Pollut. 2016, 227, 419–425. [Google Scholar] [CrossRef]
- Nunn, A.J.; Reiter, I.M.; Häberle, K.H.; Werner, H.; Langebartels, C.; Sandermann, H.; Heerdt, C.; Fabian, P.; Matyssek, R. “Free-Air” ozone canopy fumigation in an old-growth mixed forest: Concept and observations in beech. Phyton 2002, 42, 105–119. [Google Scholar]
- Werner, H.; Fabian, P. Free-air fumigation of mature trees. Environ. Sci. Pollut. Res. 2002, 9, 117–121. [Google Scholar] [CrossRef]
- Matyssek, R. Ozone sensitivity of adult forest trees. Plant Biol. 2007, 9, 163–356. [Google Scholar] [CrossRef]
- CLRTAP. Mapping Critical Levels for Vegetation, Chapter III of manual on methodologies and criteria for modelling and mapping critical loads and levels and air pollution effects, risks and trends. UNECE Convention on Long-range Transboundary Air Pollution. 2017. Available online: http://icpvegetation.ceh.ac.uk/ (accessed on 18 October 2017).
- Granier, A. Evaluation of transpiration in a Douglas-fir stand by means of sap flow measurements. Tree Physiol. 1987, 3, 309–320. [Google Scholar] [CrossRef] [PubMed]
- Laisk, A.; Kull, O.; Moldau, H. Ozone concentration in leaf intercellular air spaces is close to zero. Plant Physiol. 1989, 90, 1163–1167. [Google Scholar] [CrossRef] [PubMed]
- Wieser, G.; Matyssek, R.; Then, C.; Cieslik, S.; Paoletti, E.; Ceulemans, R. Upscaling ozone flux in forests from leaf to landscape. Ital. J. Agron. 2008, 1, 35–41. [Google Scholar] [CrossRef]
- Draper, N.; Smith, H. Applied Regression Analysis; John Wiley and Sons Inc.: New York, NY, USA, 1981; p. 209. [Google Scholar]
- Jung, M.; Reichstein, M.; Ciais, P.; Seneviratne, S.I.; Sheffield, J.; Goulden, M.L.; Bonan, G.; Cescatti, A.; Chen, J.; de Jeu, R.; et al. Recent Deceleration Glob. Land Evapotranspiration Due Moisture Supply Limit. Nat. 1981, 467, 951–954. [Google Scholar]
- Pääkkonen, E.; Vahala, J.; Pohjola, M.; Holopainen, T.; Karenlampi, L. Physiological, stomatal and ultrastructural ozone responses in birch (Betula pendula Roth.) are modified by water stress. Plant Cell Environ. 1998, 21, 671–684. [Google Scholar] [CrossRef]
- Li, L.; Manning, W.J.; Tong, L.; Wang, X.K. Chronic drought stress reduced but not protected Shantung maple (Acer truncatum Bunge.) from adverse effects of ozone O3 on growth and physiology in the suburb of Beijing. China. Environ. Pollut. 2015, 201, 34–41. [Google Scholar] [CrossRef]
- Gao, F.; Catalayud, V.; Paoletti, E.; Hoshika, Y.; Feng, Z. Water stress mitigates the negative effects of ozone on photosynthesis and biomass in poplar plants. Environ. Pollut. 2007, 230, 268–279. [Google Scholar] [CrossRef]
- Grulke, N.E.; Preisler, H.K.; Rose, C.; Kirsch, J.; Balduman, L. O3 uptake and drought stress effects on carbon acquisition of ponderosa pine in natural stands. New Phytol. 2002, 154, 621–631. [Google Scholar] [CrossRef]
- Paoletti, E.; De Marco, A.; Anav, A.; Gasparini, P.; Pompei, E. Five-year volume growth of European beech does not respond to ozone pollution in Italy. Environ. Sci. Pollut. Res. 2018, 25, 8233–8239. [Google Scholar] [CrossRef]
- Hoshika, Y.; Moura, B.B.; Paoletti, E. Ozone risk assessment in three oak species as affected by soil water availability. Environ. Sci. Pollut. Res. 2018, 25, 8125–8136. [Google Scholar] [CrossRef]
- Calatayud, V.; Cerveró, J.; Sanz, M.J. Foliar, physiological and growth responses of four maple species exposed to ozone. Water Air Soil Pollut. 2007, 185, 239–254. [Google Scholar] [CrossRef]
- Nunn, A.J.; Reiter, I.M.; Haberle, K.-H.; Langebartels, C.; Bahnweg, G.; Pretzsch, H.; Sandermann, H.; Matyssek, R. Response patterns in adult forest trees to chronic ozone stress: Identification of variations and consistencies. Environ. Pollut. 2005, 136, 365–369. [Google Scholar] [CrossRef] [PubMed]
- Kitao, M.; Löw, M.; Heerdt, C.; Grams, T.E.E.; Häberle, K.H.; Matyssek, R. Effects of chronic elevated ozone exposure on gas exchange responses of adult beech trees (Fagus sylvatica) as related to the within-canopy light gradient. Environ. Pollut. 2009, 157, 537–544. [Google Scholar] [CrossRef] [PubMed]
- Lombardozzi, D.; Sparks, J.P.; Bonan, G.; Levis, S. Ozone exposure causes a decoupling of conductance and photosynthesis: Implications for the Ball-Berry stomatal conductance model. Oecologia 2012, 169, 651–659. [Google Scholar] [CrossRef] [PubMed]
- Long, S.P.; Bernacchi, C.J. Gas exchange measurements, what can they tell us about the underlying limitations to photosynthesis? Proced. Sources Error. J. Exp. Bot. 2003, 54, 2393–2401. [Google Scholar] [CrossRef]
- Niinemets, Ü.; Cescatti, A.; Rodeghiero, M.; Tosens, T. Leaf internal diffusion conductance limits photosynthesis more strongly in older leaves of Mediterranean evergreen broad-leaved species. Plantcell Environ. 2005, 28, 1552–1566. [Google Scholar] [CrossRef]
- Matyssek, R.; Sandermann, H.; Wieser, G.; Booker, F.; Cieslik, S.; Musselman, R.; Ernst, D. The challenge of making ozone risk assessment for forest trees more mechanistic. Environ. Pollut. 2008, 156, 567–582. [Google Scholar] [CrossRef]
- Zhang, L.; Hoshika, Y.; Carrari, E.; Badea, O.; Paoletti, E. Ozone risk assessment is affected by nutrient availability: Evidence from a simulation experiment under free air controlled exposure (FACE). Environ. Pollut. 2018, 328, 812–822. [Google Scholar]
- Cermák, J.; Kucera, J.; Bauerle, W.L.; Phillips, N.; Hinckley, T.M. Tree water storage and its diurnal dynamics related to sap flow and changes in stem volume in old-growth Douglas-fir trees. Tree Physiol. 2007, 27, 181–198. [Google Scholar] [CrossRef]
- Schulze, E.-D.; Cermak, J.; Matyssek, R.; Penka, M.; Zimmermann, R.; Vasicek, F.; Gries, W.; Kucera, J. Canopy transpiration and water fluxes in the xylem of the trunk of Larix and Picea trees-a comparison of xylem flow, porometer and cuvette measurements. Oecologia 1985, 66, 475–483. [Google Scholar] [CrossRef]
- Hoshika, Y.; Omasa, K.; Paoletti, E. Whole-tree water use efficiency is decreased by ambient ozone and not affected by O3-induced stomatal sluggishness. PLoS ONE 2012, 7, e39270. [Google Scholar] [CrossRef] [PubMed]
- Sicard, P.; Anav, A.; De Marco, A.; Paoletti, E. Projected global tropospheric ozone impacts on vegetation under different emission and climate scenarios. Atm. Chem. Phys. 2017, 17, 12177–12196. [Google Scholar] [CrossRef]
© 2019 by the authors. Licensee MDPI, Basel, Switzerland. This article is an open access article distributed under the terms and conditions of the Creative Commons Attribution (CC BY) license (http://creativecommons.org/licenses/by/4.0/).