Abstract
The efficiency of methods in adequately interpreting the nutritional status of Eucalyptus spp. rooted cuttings remains unknown. The aim was to evaluate the quality of diagnoses obtained using the critical level (CL), diagnosis and recommendation integrated system (DRIS) and compositional nutrient diagnosis (CND) methods to assess the nutritional status of Eucalyptus spp. rooted cuttings, based on two different yield indicators. The data were obtained from commercial nursery and calibration experiments, using seven nutrients as treatments (N, P, K, Mg, Ca, B and Fe) and four concentrations per nutrient, arranged in randomized blocks, with four repetitions. The Eucalyptus spp. clone used in the experiments was AEC 0144. A total of 222 rooted cuttings were obtained from the experimental area and commercial nurseries and the following were determined: leaf nutrient content, whole plant dry matter (DM) content and the Dickson quality index (DQI). Diagnostic accuracy in the experimental plots was ascertained by comparing the diagnosis with plant response as a function of adding the corresponding nutrient. Five measures of accuracy were used to test the efficiency of the diagnostic methods: total accuracy, accuracy for deficiency and sufficiency, deficiency ratio, efficiency ratio, and the net increase in in DM and DQI. The performance of diagnostic methods varied between CL, DRIS and CND, and among the nutrients studied. Given that the seedling production system is largely more controlled, where environmental variations are minimal, and considering that the different diagnostic methods exhibited distinct performance in terms of assessing the true nutritional status of eucalyptus rooted cuttings, the CL method is the most indicated for this situation, due to its better performance in evaluating the nutritional status of most nutrients and easy implementation.
1. Introduction
The eucalyptus growing is dispersed in several regions of the world. For adequate crop formation, it is necessary to obtain seedlings with correct nutritional status, which can guarantee greater adaptability to the adverse conditions in the field. To that end, optimal root system and shoot development is vital and whole plant dry matter is a good indicator of seedling quality [1,2]. The Dickson quality index (DQI) has also been widely used as an indicator of seedling quality [3,4], since it is calculated based on the robustness and equilibrium of phytomass distribution, and highly correlated with all plant morphological characteristics [5].
In addition to an adequate sampling method, a correct nutritional diagnosis obtained from the results of plant tissue analysis requires the establishment of criteria to interpret the findings [6].
The most widely used diagnostic methods to interpret leaf analysis are univariate, namely, critical level (CL) and sufficiency range (SR). For Eucalyptus spp. rooted cuttings there are a number of indications of adequate content for the second and third pair of fully expanded leaves, obtained in controlled experiments only for boron [7] and potassium [8]. Obtaining the critical level (CL) and sufficiency range (SR) for most pf the nutrients considered more responsive in a substrate with nutrient solution (N, P, K, Ca, Mg, B and Fe) is important in assessing the nutritional status of rooted cuttings, especially since these plants are grown in semi-controlled conditions with little interference from the environment on dry matter accumulation.
Other leaf analysis interpretation methods consider interactions between nutrients, such as the bivariate diagnosis and recommendation integrated system (DRIS) [9] and multivariate compositional nutritional diagnosis (CND) [10], which introduce the concept of nutritional balance. For this reason, they do not depend on calibration tests [9] and may reduce the non-controlled effects of the biomass accumulation rate [11]. Up from DRIS, indexes that express the relative nutrient balance in a plant are calculated by comparing dual ratios in the sample to be diagnosed, with standard values or norms [9]. However, the CND is a method that relates nutrient contents in a multivariate manner, based on the compositional analysis method, from obtaining multinutrient variables, each of them weighted by the geometric mean of the nutritional composition [10].
There could be a difference in the efficiency of diagnostic methods, as reported by Teixeira et al. [12], in the diagnosis of banana plants. Assessing the performance of diagnostic methods makes it possible to qualify the extent to which the true nutritional status has been determined. This can be evaluated using controlled experiments and prescient diagnostic analysis (PDA) [13], being this innovator in the eucalyptus rooted cuttings nutritional management.
In this respect, the hypothesis to be tested is that the different diagnostic methods to determine the nutritional status of Eucalyptus spp. clonal rooted cuttings exhibit varying performance depending on the nutrient analyzed.
As such, the aim of this study was to assess the performance of nutritional diagnoses obtained using the CL, DRIS and CND methods to analyze nitrogen, phosphorous, potassium, calcium, magnesium, boron and iron in Eucalyptus spp. rooted cuttings, adopting whole plant dry matter and the Dickson quality index as yield indicators.
2. Material and Methods
2.1. Description of the Experiments
Fertilizer experiments were conducted in the UNESP (São Paulo State University) greenhouse in Jaboticabal, Brazil, between September and December 2016. Relative humidity (%) and maximum and minimum temperatures (°C) were obtained during the experimental period, with an average temperature of 31 °C, close to the optimal temperature for Eucalyptus grandis × Eucalyptus urophylla hybrid of 32 °C [14] (Figure 1).
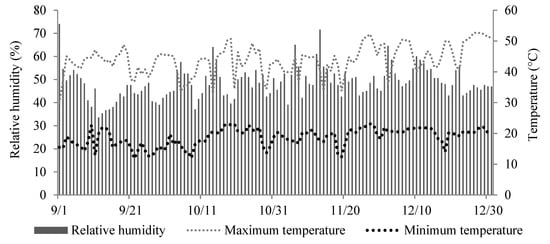
Figure 1.
Daily mean values of relative humidity and maximum and minimum temperature within the greenhouse during the experimental period.
The experiments used a 7×4 factorial randomized block design consisting of seven nutrients (N, P, K, Mg, Ca, B and Fe), four concentrations per nutrient and four repetitions, with five plants per repetition. The concentrations were 0, 50, 100 and 150% of complete Hoagland and Arnon [15] nutrient solution, adapted to the Fe source (replacing Fe EDTA with FeEDDHMA), suppressing the nutrient under study.
The following treatments were used: N (0; 7.5; 15 and 22.5 mmol L−1) (KNO3; Ca(NO3)2 .4H2O), P (0; 0.5; 1 and 1.5 mmol L−1) (K2HPO4), K (0; 3.5; 7 and 10.5 mmol L−1) (KNO3; KCl), Ca (0; 2.5; 5 and 7.5 mmol L−1) (Ca(NO3)2. 4H2O), Mg (0; 1; 2 and 3 mmol L−1) (MgSO4. 7H2O), B (0; 0.023; 0.046 and 0.069 mmol L−1) (H3BO3) and Fe (0; 0.225; 0.450 and 0.675 mmol L−1) (FeEDDHMA).
The eucalyptus clone used was AEC 0144, from genetic base Eucalyptus urophylla × Eucalyptus grandis, cloned by mini-cuttings, containing one pair of leaves and average shoot height of 8 cm. The recently rooted cuttings were removed from the substrate, their roots were washed and they were then placed in new containers (50 cm³ tubes) filled with fine vermiculite. Next, the rooted cuttings were deposited in a greenhouse under sprinkler irrigation for two weeks to ensure good rooting and less stress.
The recently rooted cuttings received complete Hoagland and Arnon [15] solution diluted at 10% of ionic strength for four days, and later the same solution for one week, followed by 25% dilution for a further week and 50% until the end of the experiment, with the pH of the solution adjusted from 5.5 to 6.0 using NaOH (1 mol L−1) or HCl (1 mol L−1) when necessary. Ten ml of a nutrient solution per day was applied as well as 5 ml of deionized water per day per tube, in order to control salinity. A collector was placed at the bottom of each tube to avoid loss of nutrient solution.
When the rooted cuttings were ready for planting in the field, the following growth data were collected: height, root collar diameter, shoot, root and whole plant (sum of the shoot and root) dry matter. The second and third pair of fully expanded leaves were collected for nutritional analysis [7,8]. The sampled leaves were washed in deionized water, 0.1% detergent solution, acid solution (0.3% HCl) and once again in deionized water, dried in a forced air oven at 60 to 70 ºC until reaching constant mass, followed by grinding and determination of N, P, K, Ca, Mg, S, Cu, Fe, Mn, Zn and B concentration [16].
2.2. Reference Values and Yield Indicators
Eucalyptus spp. rooted cuttings in the planting phase (between 90–120 days) were obtained from four commercial nurseries, considering seven different clones (Eucalyptus urophylla × Eucalyptus grandis, AEC 0144, IPB1, GG100, AEC 1528, CO 1407, 2361 e PL 3334), and grown in 50 cm³ tubes filled with pine bark substate and fertilized according to the nursery’s routine, with no interference in management.
The height, root collar diameter, shoot, root and whole plant dry matter of rooted cuttings obtained from the commercial nurseries were measured, in addition to N, P, K, Ca, Mg, S, Cu, Fe, Mn, Zn and B concentration, as described in item 2.1.
Based on the growth data, the DQI of each seedling was obtained for samples from the experimental plots and commercial nurseries, using the following formula [17]:
DQI = [total matter/ (SHRCD + SDMRDM)]
In which:
-Total dry matter, in grams is the sum of leaf, stem and root dry matter;
-SHRCD: shoot height/root collar diameter ratio;
-SDMRDM: shoot dry matter/root dry matter ratio.
DM and DQI were used as seedling yield indicators to calculate DRIS and CND.
The database consisted of data from commercial nursery and fertilizer experiment samples, as recommended by Rodríguez and Rodríguez [18], totaling 222 observations.
To calculate the reference values using DRIS and CND, only reference samples with DM or DQI above average yield values (X) (MS>X or DQI>X) [9] were used.
2.3. Critical Level
To calculate the critical level (CL), only nutrient concentration (N, P, K, Ca, Mg, B and Fe) and the DM or DQI of experimental plots were used, obtained by quadratic regression to determine nutrient content corresponding to 90% of maximum DM or DQI. Diagnoses were obtained by comparing plot levels with the CL calculated for each nutrient, and samples with contents below or above the CL considered deficient or sufficient, respectively.
2.4. DRIS and CND Guidelines
CND and DRIS guidelines were produced by transforming original data to g kg−1, to allow comparison between nutrients from different units. Next, extreme nutrient levels were excluded, that is, below the average level of −2.55 × standard deviation and above +2.55 × standard deviation. The other values were maintained to obtain the guidelines and determine the DRIS and CND indices. Thus, nutrient levels that were within the mean values +/−2.55 × standard deviation of the normal distribution (95% of data around the mean) were considered valid and the others were ignored in all the procedures below.
The DRIS and CND indices were calculated from the leaf content of all the nutrients and the DM or DQI of the samples.
The formula simplified by Jones [19] was applied to calculate the DRIS functions for nutrient ratios, as follows:
in which:
F_X = (vX − Mi)/Si,
vX = level of each nutrient in g kg−1, where: X represents each of the nutrients assessed (N, P, K …Zn);
Mi = mean ratios of the desired population (reference);
Si = standard deviation of the ratios of the desired population (reference);
The R value was determined for each leaf sample, corresponding to the dry matter portion for 1000 g, according to the expression:
where:
R = 1000 − (vN+vP+vK+vCa+vMg+vS+vB+vCu+vFe+vMn+vZn)
R = dry matter portion for 1000 g;
1000 = 100 % of dry matter;
vX = level of each nutrient in g kg−1, where X represents each of the nutrients assessed (N, P, K …Zn) [10].
Next, the geometric mean (mGeo) of the nutrient content of each sample was calculated using the following formula:
where:
mGeo = (vN × vP × vK × vCa × vMg × vS × vB × vCu vFe × vMn × vZn × R)(1/n)
mGeo = nth root of the product of nutrient content according to the R value;
“n” = number of factors used to calculate the geometric mean [10].
Next, the multivariate ratio (zX) was calculated, obtained from the natural logarithm of the quotient between the levels of N, P, K, Ca, Mg, S, B, Cu, Fe, Mn and Zn and the geometric mean of nutrient composition in the leaf sample, according to the following expression:
where vX = the level of each nutrient expressed in g kg−1, and mGeo the geometric mean of sample nutrients [10].
zX = ln (vX/mGeo)
Finally, the means and standard deviations of log-transformed ratios and multivariate ratios were calculated for the nutrients assessed, which constituted the DRIS and CND guidelines, respectively.
2.5. DRIS, CND and NBIm
The Jones [19] formula was applied to calculate the DRIS indices, which were obtained by the sum of the functions of the possible ratios (Fi) of a nutrient (log-tranformed), divided by the number of ratio functions that entered into the sum (n).
where Fi (A/B) = ratio between the nutrients assessed.
DRIS indices = [Fi(A/B) + … + Fi(A/Z)] / n
The CND index (I_X) was obtained for each case contained in the database used. The following expression was used in the calculation:
where I_X = CND index of any nutrient (X), zX = multivariate ratio for this nutrient, and mX and sX, the mean and standard deviation guideline, respectively, of the multivariate ratios of nutrient X [10].
I_X = (zX − mX) / sX
Next, the mean nutritional balance index (NBIm) was calculated for the two methods, using the following expression:
where NBIm = mean nutritional balance index, |I_X| = module of the DRIS or CND nutritional indices of each nutrient, where X represents each of the nutrients assessed (N, P, K …Zn), n = number of nutrients assessed in a given plant or leaf sample [20].
NBIm = (|I_N|+|I_P|+|I_K|+|I_Ca|+|I_Mg|+|I_S|+|I_B|+|I_Cu|+|I_Fe|+|I_Mn|+|I_Zn|) / n,
2.6. Interpretation of Nutritional Status
Nutritional status was interpreted using the DRIS index (INDRIS) and CND index (INCND), in two interpretation classes: balanced and deficient, using the fertilization response potential (FRP) [21]. The samples were considered balanced when the index of a nutrient (INDRIS or INCND) in a module was less than the NBIm, or when the INDRIS or INCND index was greater than zero. Samples with negative INDRIS or INCND and with their module greater than the NBIm were considered deficient.
2.7. Nutritional Diagnostic Accuracy
To assess the performance of nutritional diagnoses, we determined the diagnostic accuracy of the nutritional status of samples from the experimental plots for the nutrients N, P, K, Ca, Mg, B and Fe, defined for two interpretation classes: deficient and sufficient.
The diagnoses (deficient and sufficient) obtained for the nutrients N, P, K, Ca, Mg, B and Fe were compared with the true nutritional status (TNS) of the rooted cuttings in order to assess the efficiency of CL, DRIS and CND methods. The TNS was determined based on the response of the plant to fertilization with a given nutrient in relation to a control condition. The plant responses assessed were DM and DQI, with 10% increases or decreases in DM or DQI considered sufficient to compare diagnoses and yield [22].
Thus, for each nutrient (N, P, K, Ca, Mg, B and Fe), nutritional diagnoses were contrasted with plant response to increasing contents by comparing a situation with no nutrient in a situation-control test to another treatment involving only the addition of a nutrient (situation-response), or comparing between treatments with a lower (situation-control) and higher content of the nutrient (situation-response) (Table 1).

Table 1.
Distribution of nutritional diagnosis to assess the nutritional status of Eucalyptus spp. clonal rooted cuttings, using CL, DRIS and CND methods.
The following accuracy measures were used to assess the performance of nutritional diagnoses: total accuracy, sufficient and deficient accuracy, deficiency ratio and efficiency ratio. These measures were obtained by counting the cases in each category [13,22,23] (Table 2).
Table 2.
Measures of accuracy and acceptable values to assess the nutritional status of Eucalyptus spp. rooted cuttings using the CL, DRIS and CND methods.
In the calculation of the deficiency ratio, when FDEF was zero, the indicator was not considered undefined, as suggested by Beverly [22], but rather the number of correct diagnoses obtained by the method in this category, since when FDEF = 0 and TDEF > 0, adopting this value better reflects the efficiency of the method at correctly diagnosing the cases of true deficiency.
The net increase in production (DM or DQI) was obtained by the following equation:
where P is the increase or decrease in production related to each case possibility, adding or subtracting the production related to true and false diagnoses, respectively [13].
increase = |P_TDEF| + |P_TSUF| - |P_FDEF| - |P_FSUF|
2.8. Statistical Analysis
Pearson’s correlation was used for NBI and DM or DQI values, as well as nutrient levels (N, P, K, Ca, Mg, B and Fe), DM and DQI of experimental plot samples. A regression study at 5% probability was conducted for the contents of the nutrients studied and their effects on nutrient levels and DM or DQI of the experimental plots, using SAS 9.4 software [24].
3. Results
Of the 222 observations in the samples from commercial nurseries and fertilization experiments, 110 and 103 exhibited high yield using DM (DM>2.49 g plant−1) and DQI (DQI>0.23) as yield indicators, respectively (Table 3). Of these, 37 and 41% were samples from fertilization experiments, respectively.
Table 3.
Mean and standard deviation (SD) of nutrient content (N, P, K, Ca, Mg, B and Fe), in whole plant dry matter (DM) and the Dickson quality index (DQI) of high and low-yield subpopulations of Eucalyptus spp. clonal rooted cuttings of commercial nurseries.
The DM in the samples from the high-yield population was approximately 60% higher than in the low-yield population (Table 3).
For both DM and DQI, the average contents for most of the nutrients analyzed were higher in low-yield samples when compared to the contents observed in their high-yield counterparts, while standard deviations, except for micronutrients B and Fe, had the same magnitude in both groups (Table 3). However, the DQI in the high-yield population was approximately 59% higher than in the low-yield population.
The dispersion of DM data and nutrient levels in the experimental samples showed high positive correlations [25] (Figure 2).

Figure 2.
Correlation between leaf nitrogen (A), phosphorous (B), potassium (C), calcium (D), magnesium (E), boron (F) and iron (G) content and dry matter (DM) of experimental plot samples in Eucalyptus spp. rooted cuttings, **Significant at 1% probability using the t-test.
Assessment of DQI dispersion as a function of N content indicated a positive linear correlation in experimental plot samples (Figure 3), but no significant correlations for the other nutrients.
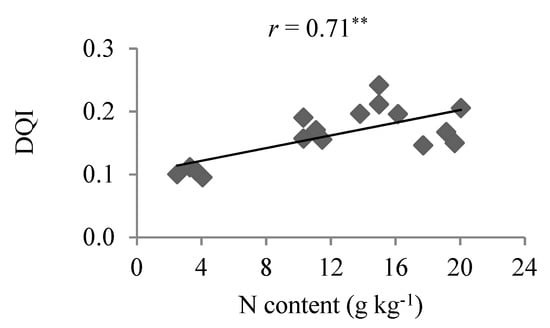
Figure 3.
Correlation between leaf N content and Dickson quality index (DQI) in the experimental plot samples of Eucalyptus spp. rooted cuttings, ** Significant at 1% using the t-test.
It is observed that the line’s slope that correlates the foliar contents and growth variables (Figure 2 and Figure 3) are not high but it is sufficient to indicate correlation with high significance at 1% of probability by the t test.
The increased concentrations in the nutrient solution of all the nutrients studied raised the leaf nutrient content and DM (Figure 4). This was not observed with DQI, which only rose with an increase in N and P (Figure 5), and there was no significant DQI response to greater concentrations of the other nutrients tested (K, Ca, Mg, B and Fe) in the nutrient solution.
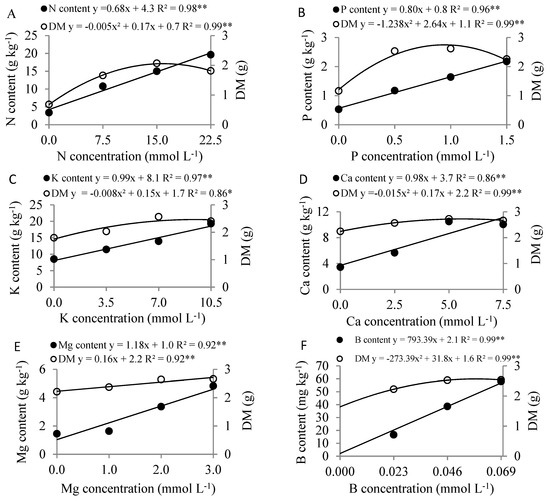
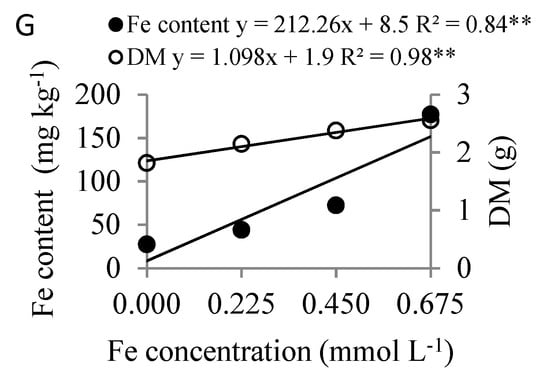
Figure 4.
Leaf and dry matter (DM) content as a function of nitrogen (A), phosphorous (B), potassium (C), calcium (D), magnesium (E), boron (F) and iron concentration (G) in the nutrient solution on Eucalyptus spp. clonal rooted cuttings, ** significant at 1% probability using the F-test.
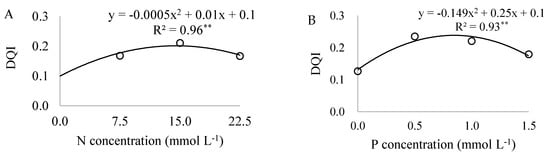
Figure 5.
Dickson quality index (DQI) as a function of nitrogen (N) (A) and phosphorous (P) (B) concentrations in the nutrient solution of Eucalyptus spp. clonal rooted cuttings,**significant at 1% probability using the F-test.
The increase in N concentrations in the nutrient solution caused a linear rise in leaf N content, reaching 19.6 g kg−1, and an increase in DM, with a maximum at 17 mmol L−1 of N (Figure 4A), in addition to increasing the DQI, obtaining 0.19 at a concentration of 14.1 mmol L−1 of N (Figure 5A). With an increase in P concentrations, P leaf content rise, reaching 2.0 g kg−1. Maximum DM was attained at 1.07 mmol L−1 of P (Figure 4B) and DQI reached 0.24 at 0.85 mmol L−1 of P (Figure 5B).
The increase in K levels led to a rise in K leaf content, reaching 18.5 g kg−1, with DM peaking at 9.4 mmol L−1 of K (Figure 4C).
With an increase in Ca concentrations, Ca leaf content reached 11.0 g kg−1, and DM achieved its maximum value at 5.7 mmol L−1 of Ca (Figure 4D). With the application of increasing Mg concentrations, the levels of Mg and DM were 4.5 g kg−1 and 2.7 g, respectively (Figure 4E).
Applying growing B concentrations increased leaf B content, reaching 56.8 mg kg−1, with maximum DM at 0.058 mmol L−1 of B (Figure 4F). Applying increasing Fe concentrations resulted in leaf Fe content of 151.7 mg kg−1 and DM of 2.6 g (Figure 4G).
The CLs were obtained by determining the leaf content of the nutrient associated with 90% of maximum DM, corresponding to N, P, K, Ca, Mg, B and Fe values of 14.9; 1.8; 13.6; 6.5; 1.9 g kg−1; 30.9 and 64.9 mg kg−1, respectively. The CLs obtained from the DQI were 14.4 g kg−1 for N, 1.8 g kg−1 for P, 12.9 g kg−1 for K, 6.8 g kg−1 for Ca, 4.3 g kg−1 for Mg, 39.9 mg kg−1 for B and 88.6 mg kg−1 for Fe.
Logarithmic transformation of the ratios between the nutrients used to obtain DRIS guidelines enables the direct and inverse expression of the ratios to produce the same variation in magnitude [26], differing only in one, which exhibited a negative value. As such, only direct expression was adopted for both the guidelines obtained for DM and the DQI (Table 4).
Table 4.
DRIS guidelines log transformed for Eucalyptus spp. clonal rooted cuttings for the yield indicators whole plant dry matter (DM) and Dickson quality index (DQI).
The mean and standard deviation of each multinutrient obtained in the high-yield population constituted the CND guidelines for both yield indicators (DM and DQI) considered. In these guidelines, negative values indicate only that the geometric mean of the nutrient composition was higher than the leaf content of the element in the multinutrient variable (Table 5).
Table 5.
CND guidelines for Eucalyptus spp. clonal rooted cuttings for the yield indicators whole plant dry matter (DM) and Dickson quality index (DQI).
Analysis of dispersion between NBIm and DM values and the NBIm and DQI of the samples, for the different DRIS and CND guidelines, indicated a negative linear correlation, since, for the range of low NBIm values, low to high DM and DQI levels were obtained (Figure 6).
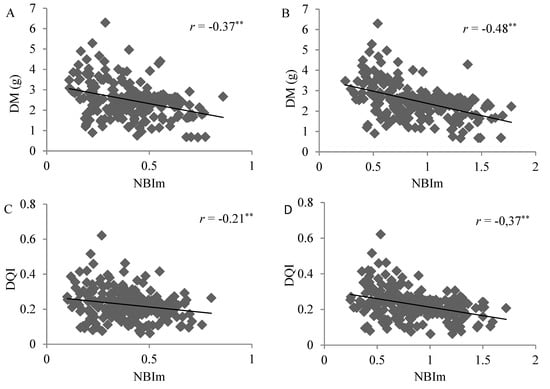
Figure 6.
Correlation between whole plant dry matter (DM) and NBIm obtained using the DRIS (A) and CND (B) methods and between the Dickson quality index (DQI) and the NBIm applying the DRIS (C) and CND (D) methods, in 222 samples of Eucalyptus spp. clonal rooted cuttings, **Significant at 1% probability using the t-test.
The performance of nutritional diagnoses for N, P, K, Ca, Mg, B and Fe using CL, DRIS and CND criteria in eucalyptus clonal rooted cuttings, adopting DM and DQI as yield indicators, was assessed according to Beverly [22,23] and Beverly and Hallmark [13] (Table 6). For each method and nutrient analised, 12 cases of comparisons were made.
Table 6.
Nutritional diagnosis performance for N, P, K, Ca, Mg, B and Fe in Eucalyptus spp. clonal rooted cuttings for DM and DQI associated with true and false diagnoses.
The CL method obtained the highest number of correct diagnoses in cases of deficiency for most nutrients, but a low percentage in cases of sufficiency, except for N (Table 6), for both DM and DQI as yield indicators.
The CND method showed total accuracy with satisfactory values [22] for all the nutrients studied, considering DM or DQI as yield indicator, whereas DRIS was only satisfactory when DQI was adopted as yield indicator. For most nutrients, the CL method exhibited greater accuracy than the DRIS and CND methods, when DM was the yield indicator, and only for N was the DQI indicator adopted (Table 6).
The DR indicates the number of correct diagnoses of deficiency [13], that is, values greater than 1 mean that the number of correct diagnoses was higher than the number of errors in diagnosing deficiency. Thus, only for N did all methods display satisfactory DR, irrespective of the yield indicator (Table 6). Considering DM as yield indicator, the CL method indicated satisfactory DR for K, B and Fe, DRIS for P and CND for P, B and Fe. The CND method also displayed satisfactory DR for P, with the DQI as yield indicator.
When DM was adopted as yield indicator, the CL method for N, Ca, B and Fe, DRIS for P and the CND method for P, Ca, Mg and B showed AccDef and AccSuf above the reference value for diagnoses of deficiency and sufficiency [23] (Table 6). Taking the DQI as reference, the CL method for N, DRIS and CND for P and Fe, and CND for Mg exceeded the accuracy limit for diagnoses of both deficiency and sufficiency (Table 6).
Satisfactory ER was not obtained for the methods and nutrients assessed [23], regardless of the yield indicator adopted (Table 6). The ER is similar to the deficiency ratio, but it considers and compensates for the disproportional distribution of the number of deficiency and sufficiency cases [23].
Assuming DM as a yield indicator, all the methods exhibited a total net increase in DM for N and P, with a positive yield, as well as the CL method for K, Ca, B and Fe, DRIS for Mg and CND for P, Ca, Mg and B. Based on the gains in DQI, all the methods showed a total net increase for N, P and K, with a positive yield, as well as CL for Ca and Mg, CND for Mg and DRIS for micronutrients B and Fe (Table 6). As with most of the nutrients, the diagnoses were confirmed by plant responses to fertilizer application [13].
4. Discussion
The fact that a higher mean content and lower DQI were observed for all the nutrients in the low-yield population when compared to their high-yield counterparts (Table 3), may be due to the effect of contents, which occurs when the growth rate of dry matter is lower than the nutrient absorption rate [27].
The rise in K concentrations increased the K leaf content and DM of Eucalyptus spp. clonal rooted cuttings (Figure 4C). Similarly, applying high K concentrations (0 to 2988 mg L−1) in Eucalyptus spp. clonal rooted cuttings in the rustification phase, resulted in an increase in K content above 20 g kg−1 for all the treatments and a rise in root collar diameter with a K concentration of 249 mg L−1 (6.4 mmol L−1) [8].
It was evidenced that the highest nutrients concentrations in the nutritive solution were associated with high foliar nutrient contents, but with no increase in biomass (Figure 4). This effect is not due to toxicity problems, as there were no symptoms in the plants, but probably occurred due to luxury consumption. The greater amount of nutrients in the plant tissues in the growth phase of the rooted cuttings has important practical implication in the initial performance of the plant in the field. This greater nutrients reserve in plants can supply part of their nutritional requirement especially if there are momentary problems such as environmental stress like water restriction or another that may decrease the absorption of the nutrients coming from the soil.
Boron is one of the micronutrients most in demand for eucalyptus cultivation in the seedling phase [28], and applying increasing B concentrations raised the leaf content of the nutrient and the DM of the rooted cuttings (Figure 4F). Mattielo et al. [7] found that the highest dry matter production from Eucalyptus spp. clones occurred at an average B concentration of 40 μmol L−1 (0.04 mmol L−1) in nutrient solution and was associated with leaf B content (young leaves up to the 3rd pair from the apex of the branches) of 46 mg kg−1.
The high correlations (r < 0.70) [25] between nutrient content and DM in the experimental samples may be associated with the ideal experimental conditions (Figure 2). With respect to correlation analysis between nutrient content and DQI, it was only possible to determine a clear and direct relationship for N (Figure 3), suggesting that this indicator was responsive to the greater availability of the nutrient. In the regression analysis between DQI data and increasing nutrient concentrations it was also not possible to confirm significance for most of the nutrients, except for N and P (Figure 5), even when controlled experimental data and rising contents of responsive nutrients were involved.
The CL of B in DM was lower than that obtained by Mattielo et al. [7] for the rooted cuttings of eight different Eucalyptus spp clones submitted to boron concentrations in a nutrient solution (0 to 100 μmol L−1 of B), with CL between 35.9 and 50.9 mg kg−1 in the different clones, for the second and third pairs of fully expanded leaves. This variation in CL among clones may be due to the different requirements of the genetic materials. However, the CL of B was similar to that obtained by Mattielo et al. [7] when maximum DQI was considered.
The results of dispersion analysis between NBIm and DM and between NBIm and the DQI of samples were compatible with the theoretical model suggested by Beaufils [9], where lower DM and DQI levels are obtained with a higher NBIm, indicating nutritional imbalance. At the same time, high and low DM and DQI level occurs with a lower NBIm (Figure 6), given that non-nutritional factors may result in low DM or DQI, despite the high nutritional balance (low NBI). Although the negative linear correlation indicates adequate behavior for the NBIm and yield indicators (DM and DQI), it is important to underscore that the absence of a correlation between NBIm and yield indicators for low NBIm values would be the expected response when associated with low yield indicator values for high NBIm levels.
Despite being used by a number of authors as the criterion for selecting guidelines [29,30,31,32], the ratio between yield and NBIm may not necessarily reflect good performance by the method, due to the high correlation between yield and the NBIm [33]. However, the fact that high and low yields occurred for low NBIm values indicates that factors other than nutrition affect yield. This means that it is not feasible to compare methods using the ratio between NBI and any other production variable.
The correct way to compare the role of leaf diagnostic methods was indicated by Beverly and Hallmark [13], who assessed a treatment-control diagnosis by comparing it to a treatment with nutrient application and validated the diagnosis produced in the treatment-control. Applying this criterion to the data presented here showed that, regardless of the yield indicator used, the CL, DRIS and CND methods exhibited different behaviors when the experimental plots were classified as deficient or sufficient, for the same nutrient and between nutrients.
Given that the primary objective of diagnosis is to identify the cases of true deficiency [23], the CL method was more successful in indicating this condition for most of the nutrients, except for N (Table 6), irrespective of the yield indicator adopted. However, the major decision-making problem in relation to fertilization management is the failure to recognize true deficiencies, since in this condition applying the nutrient will result in yield gains [13,34].
The CL method was more efficient than its DRIS and CND counterparts for the same experimental conditions, regardless of the yield indicator (DM or DQI). Nevertheless, the CL displays limited usefulness in the nutritional assessment of plants, since it is a univariate method that provides information on only one nutrient, unlike bi and multivariate methods. The superior performance of CL in diagnosing true deficiency owes to the fact that it is obtained from experiments in which all environmental conditions were controlled, the gains or declines in yield being the result of adding the nutrient in those conditions [35]. The CL method is conventionally used to obtain reference values, albeit very restricted, since the tests are not repeated under different conditions [36].
Even if a method achieves a higher percentage of correct diagnoses for true deficiencies, its total accuracy may be lower when compared to other techniques because accuracy considers not only TDEF, but also TSUF cases [13], such as for P. The fact that the CL method diagnosed many FDEF but no TSUF cases meant total accuracy was below the recommended level, even though the method diagnosed TDEF cases.
Total accuracy and DR may be over and underestimated, respectively, due to the high percentage of true deficiency cases. As such, according to Beverly [37], only accuracy and DR are not sufficient to assess the diagnostic methods, given that the primary aim of nutritional diagnosis is to identify cases of deficiency. Thus, Beverly [23] proposed differentiating between AccDef and AccSuf.
It is important that all deficiency cases be detected, and few if any false positives be admitted, since possible yield gains are unattainable if the nutrient is not applied. Similarly, when many FDEF cases are diagnosed, as observed for P using the CL method for DM, the nursery owner’s financial gains may decline and environmental damage occur from the excessive application of a number of nutrient sources [13].
The findings of the present study indicate that the CL method performed well in prognoses because the results of calibration experiments were used in the database, making diagnoses more accurate. An innovative study in Brazil on banana plants that also used experimental results from its database showed that the CL and DRIS methods were efficient in diagnosing N and K, since using both produced yield gains in the crop [12].
It is pertinent to highlight that DRIS and CND methods can have high performance if there are genetic and environmental variability in the crops, because there are indications of these methods in eucalyptus cultivated in the field [38,39,40]. These methods may also have the potential to diagnose, but only for some specific nutrients (P, Mg, B, and Fe) even in crops with low environmental variability, as in the case of this work in the seedling production phase, given the possible interionic interactions of these nutrients.
An additional factor considered in this research is the relation of seedling quality and its nutritional status, which is indispensable to the success of the implantation of new forest plantations with better growth and quality, mainly with the use of rooted cuttings produced in cultivation without soil.
5. Conclusions
It is important to underscore that diagnostic performance varied with the nutrient analyzed, the CL method being the most indicated to analyze the nutritional status of N, K, Ca, B and Fe. When DM was considered the yield indicator, the DRIS method for Mg diagnosis and the CND method for P were the most appropriate. The CL method was also the most recommended to analyze the nutritional status of N, K and Ca, adopting the DQI as yield indicator, the DRIS method for B and Fe, and CND for P and Mg, in Eucalyptus spp. clonal rooted cuttings.
Given that the seedling production system is largely more controlled and environmental variations are minimal, and considering that the different diagnostic methods showed distinct behavior in assessing the true nutritional status of eucalyptus rooted cuttings, the CL method should be indicated for this situation, owing to its superior performance in evaluating nutritional status for most of the nutrients and its easy implementation.
Author Contributions
Conceptualization, T.C.B.d.M. and P.G.S.W.; Data curation, T.C.B.d.M.; Formal analysis, T.C.B.d.M., E.I.F.T. and A.M.S.R.; Investigation, T.C.B.d.M., E.I.F.T. and A.M.S.R.; Methodology, T.C.B.d.M. Supervision, R.d.M.P. and P.G.S.W.; Visualization, T.C.B.d.M.; Writing – original draft, T.C.B.d.M.; Writing – review & editing, R.d.M.P., P.G.S.W. and R.C.d.P.
Funding
This research received no external funding.
Acknowledgments
Authors would like to thank the CAPES (Coordenação de Aperfeiçoamento de Pessoal de Nível Superior – Higher Education Personnel Improvement Coordination) for supporting our research.
Conflicts of Interest
The authors declare no conflict of interest.
References
- Abreu, A.H.M.; Leles, P.S.S.; Melo, L.A.; Ferreira, D.H.A.A.; Monteiro, F.A.S. Produção de mudas e crescimento inicial em campo de Enterolobium contortisiliquum produzidas em diferentes recipientes. Floresta 2015, 45, 141–150. [Google Scholar] [CrossRef]
- Baldin, T.; Conte, B.; Denardi, L.; Moraes, R.; Saldanha, C.W. Crescimento de mudas de Angico-vermelho em diferentes volumes de substratos. Pesqui. Florest. Bras. 2015, 35, 129–133. [Google Scholar] [CrossRef]
- Eloy, E.; Caron, B.O.; Schmidt, D.; Behling, A.; Schwers, L.; Elli, E.F. Avaliação da qualidade de mudas de Eucalyptus grandis utilizando parâmetros morfológicos. Floresta 2013, 43, 373–384. [Google Scholar] [CrossRef]
- Silva, R.B.G.; Simões, D.; Silva, M.R. Qualidade de mudas clonais de Eucalyptus urophylla x E. grandis em função do substrato. Rev. Bras. Eng. Agríc. Ambient. 2012, 16, 297–302. [Google Scholar] [CrossRef]
- Fonseca, E.P.; Valeri, S.V.; Miglioranza, E.; Fonseca, N.A.N.; Couto, L. Padrão de qualidade de mudas de Trema micranta (L.) Blume, produzidas sob diferentes períodos de sombreamento. Rev. Árvore 2012, 26, 515–523. [Google Scholar] [CrossRef]
- Chávez, L.R.M.; López, M.A.L.; Botello, E.E.; Martínez, A.V. Diagnóstico de necesidades de fertilización de Abies religiosa (H. B. K.) Schl. et Cham, en vivero mediante el DRIS. Madera y Bosques 2002, 8, 51–60. [Google Scholar] [CrossRef]
- Mattiello, E.M.; Ruiz, H.A.; Silva, I.R.; Guerra, P.C.; Andrade, V.M. Características fisiológicas e crescimento de clones de eucalipto em resposta ao boro. Rev. Árvore 2009, 33, 821–830. [Google Scholar] [CrossRef]
- D’Ávila, F.S.; Paiva, H.N.P.; Leite, H.G.; Barroso, N.F.; Leite, F.P. Efeito do potássio na fase de rustificação de mudas clonais de eucalipto. Rev. Árvore 2011, 35, 13–19. [Google Scholar] [CrossRef]
- Beaufils, E.R. Diagnosis and Recommendation Integrated system (DRIS): A General Scheme for Experimentation and Calibration Based on Principles Develop from Research in Plant Nutrition; Soil Science Bulletin, 1; University of Natal: Pietermaritzburg, South Africa, 1973; p. 132. [Google Scholar]
- Parent, L.E.; Dafir, M.A. Theoretical concept of compositional nutrient diagnosis. J. Am. Soc. Hortic. Sci. 1992, 117, 239–242. [Google Scholar] [CrossRef]
- Wadt, P.G.S. Análise foliar para recomendação de adubação em culturas agrícolas. In Diagnose Foliar em Grandes Culturas; Nutrição de plantas; Prado, R.M., Rozane, D.E., do Vale, D.W., Correia, M.A.R., de Souza, H.A., Eds.; Fundenesp: Jaboticabal, Brazil, 2008; pp. 115–133. [Google Scholar]
- Teixeira, L.A.J.; Santos, W.R.; Bataglia, O.C. Diagnose nutricional para nitrogênio e potássio em bananeira por meio do Sistema Integrado de Diagnose e Recomendação (DRIS) e de níveis críticos. Rev. Bras. Frutic. 2002, 24, 530–535. [Google Scholar] [CrossRef]
- Beverly, R.B.; Hallmalk, W.B. Prescient diagnostic analysis: a proposed new approach to evaluating plant nutrient diagnostic methods. Commun. Soil Sci. Plant Anal. 1992, 23, 2633–2640. [Google Scholar] [CrossRef]
- Corrêa, V.B.; Pezzopane, J.E.M.; Xavier, T.M.T.; Toledo, J.V.; Schiwider, Y.S. Determinação da umidade para o desenvolvimento de mudas de eucalipto sob diferentes regimes térmicos. Encicl. Biosf. 2013, 9, 711–722. [Google Scholar]
- Hoagland, D.R.; Arnon, D.I. The Water Culture Method for Growing Plants without Soils; California Agricultural Experimental Station: Berkeley, CA, USA, 1950. [Google Scholar]
- Sadzawka, A.; Carrasco, M.; Demanet, R.; Flores, H.; Grez, R.; Mora, M.L.; Neaman, A. Métodos De Análisis De Tejidos Vegetales; Segunda Edición; Instituto de Investigaciones Agropecuarias, Series Actas INIA N° 40: Santiago, Chile, 2007. [Google Scholar]
- Dickson, A.; Leaf, A.L.; Hosner, J.F. Quality appraisal of white spruce and white pine seedling stock in nurseries. For. Chron. 1960, 36, 10–13. [Google Scholar] [CrossRef]
- Rodríguez, O.; Rodríguez, V. Desarrollo, determinación einterpretación de normas DRIS para el diagnóstico nutricional en plantas. Una revisión. Rev. Fac. Agron. 2000, 17, 449–470. [Google Scholar] [CrossRef]
- Jones, C.A. Proposed modifications of the diagnosis and recommendation integrated system (DRIS) for interpreting plant analyses. Commun. Soil Sci. Plant Anal. 1981, 12, 785–794. [Google Scholar] [CrossRef]
- Sumner, M.E. Applications of Beaufils diagnostic indices to maize data published in the literature irrespective of age and conditions. Plant Soil 1977, 46, 359–369. [Google Scholar] [CrossRef]
- Wadt, P.G.S. Relationships between soil class and nutritional status of coffee plantations. Rev. Bras. Ciênc. Solo 2005, 29, 227–234. [Google Scholar] [CrossRef][Green Version]
- Beverly, R.B. Prescient diagnostic analysis shows sufficiency range approach superior to DRIS for Citrus. Commun. Soil Sci. Plant Anal. 1992, 23, 2641–2649. [Google Scholar] [CrossRef]
- Beverly, R.B. Re-evaluation reveals weaknesses of DRIS and Sufficiency range diagnoses for wheat, corn and alfafa. Commun. Soil Sci. Plant Anal. 1993, 24, 5–6. [Google Scholar] [CrossRef]
- SAS Institute Inc. Versão 9.4. Procedures Guide; SAS Institute Inc.: Cary, NC, USA, 2013. [Google Scholar]
- Dancey, C.P.; Reidy, J. Estatística Sem Matemática Para Psicologia: Usando SPSS Para Windows; Artmed: Porto Alegre, Brazil, 2006. [Google Scholar]
- Beverly, R.B. Comparison of DRIS and alternative nutrient diagnostic methods for soybean. J. Plant Nutr. 1987, 10, 901–920. [Google Scholar] [CrossRef]
- Jarrel, W.M.; Beverly, R.B. The dilution effect in plant nutrition studies. Adv. Agron. 1981, 34, 197–224. [Google Scholar] [CrossRef]
- Barretto, V.C.M.; Valeri, S.V.; Silveira, R.L.V.A.; Takahashi, E.N. Boron use efficiency on growth by Eucalyptus clones in pots. Sci. For. 2007, 76, 21–33. [Google Scholar]
- Guindani, R.H.P.; Anghinoni, I.; Nachtigall, G.R. DRIS na avaliação do estado nutricional do arroz irrigado por inundação. Rev. Bras. Ciênc. Solo 2009, 33, 109–118. [Google Scholar] [CrossRef]
- Píperas, G.V.; Creste, J.E.; Echer, F.E. Uso do DRIS na avaliação do estado nutricional da cana-de-açúcar. Rev. Ceres 2009, 56, 818–825. [Google Scholar]
- Serra, A.P.; Marchetti, M.E.; Rojas, E.P.; Morais, H.S.; Conrad, V.A.; Guimarães, F.C.N. Estabelecimento de normas DRIS para o algodoeiro com diferentes critérios de seleção da população de referência. Pesqui. Agropecu. Bras. 2013, 48, 1472–1480. [Google Scholar] [CrossRef]
- Serra, A.P.; Marchetti, M.E.; Ensinas, S.C.; Morais, H.S.; Conrad, V.A.; Guimarães, F.C.N.; Barbosa, G.P.O. Diagnosis and Recommendation Integrated System (DRIS) to Assess the Nutritional State of Cotton Crop in Brazil. Am. J. Plant. Sci. 2014, 5, 508–516. [Google Scholar] [CrossRef][Green Version]
- Wadt, P.G.S.; Traspadini, E.I.F.; Martins, R.A.; Melo, F.B.; Oliveira, I.J.; Rodrigues, J.E.L.F.; Bastos, E.A.; Araújo, S.M.B. Medidas de acurácia na qualificação dos diagnósticos nutricionais: Teoria e prática. In Nutrição e Adubação de Hortaliças, 1st ed.; Prado, R.M., Cecílio Filho, A.B., Eds.; FCAV/CAPES: Jaboticabal, Brazil, 2016; pp. 373–391. [Google Scholar]
- Wadt, P.G.S.; Lemos, C.O. Medidas de acurácia para diagnósticos nutricionais e seu impacto no manejo das adubações. In Nutrição de Plantas: Diagnose Foliar em Hortaliças; Prado, R.M., Cecílio Filho, A.B., Correia, M.A.R., Puga, A.P., Eds.; Universidade Estadual Paulista: Jaboticabal, Brazil, 2010; pp. 213–236. [Google Scholar]
- Gott, R.M.; Aquino, L.; Carvalho, A.; Santos, L.; Nunes, P.; Coelho, B.S. Índices diagnósticos para interpretação de análise foliar do milho. Rev. Bras. Eng. Agríc. Ambient. 2014, 18, 1110–1115. [Google Scholar] [CrossRef]
- Coelho, F.S.; Fontes, P.C.R.; Cecon, P.R.; Braun, H.; Silva, I.R. Valor e predição do nível crítico de índices para avaliar o estado nitrogenado da batateira. Rev. Ciênc. Agron. 2013, 44, 122–155. [Google Scholar] [CrossRef]
- Beverly, R.B. DRIS diagnoses of soybean nitrogen, phosphorus, and potassium status are unsatisfactory. J. Plant. Nutr. 1993, 16, 431–447. [Google Scholar] [CrossRef]
- Silva, G.G.C.; Neves, J.C.L.; Alvarez, V.V.H.; Leite, F.P. Avaliacao da universalidade das normas Dris, M-Dris e CND. Rev. Bras. Cienc. Solo 2005, 29, 755–761. [Google Scholar] [CrossRef]
- Silva, G.G.C.; Neves, J.C.L.; Alvarez, V.V.H.; Leite, F.P. Nutritional diagnosis for eucalypt by dris, M.-Dris, and CND. Sci. Agric. 2004, 61, 507–515. [Google Scholar] [CrossRef]
- Wadt, P.G.S. Nutritional status of Eucalyptus grandis clones evaluated by critical level and DRIS methods. Rev. Arvore. 2004, 28, 15–20. [Google Scholar] [CrossRef][Green Version]
© 2019 by the authors. Licensee MDPI, Basel, Switzerland. This article is an open access article distributed under the terms and conditions of the Creative Commons Attribution (CC BY) license (http://creativecommons.org/licenses/by/4.0/).