Article

“Diminishing Returns” in the Scaling between Leaf Area and Twig Size in Three Forest Communities Along an Elevation Gradient of Wuyi Mountain, China

1
Fujian Provincial Key Laboratory of Plant Ecophysiology, Fujian Normal University, Fuzhou 350007, China
2
Key Laboratory of Humid Subtropical Eco-Geographical Process, Ministry of Education, Fuzhou 350007, China
3
Plant Biology Section, School of Integrative Plant Science, Cornell University, Ithaca, NY 14853, USA
4
School of City and Civil Engineering, Zaozhuang University, Zaozhuang 277160, China
*
Author to whom correspondence should be addressed.
Forests 2019, 10(12), 1138; https://doi.org/10.3390/f10121138
Submission received: 7 October 2019 / Revised: 26 November 2019 / Accepted: 10 December 2019 / Published: 12 December 2019
(This article belongs to the Section Forest Ecophysiology and Biology)

Abstract

:
Background and aims: The “diminishing returns” hypothesis postulates that the scaling exponent governing the lamina area versus lamina mass scaling relationships has, on average, a numerical value less than one. Theoretically, a similar scaling relationship may exist at the twig level. However, this possibility has not been explored empirically. Methods: We tested both hypotheses by measuring the lamina area and mass, petiole mass of individual leaves, and the total foliage area and stem mass of individual current-year shoots (twigs) of 64 woody species growing in three characteristic forest community types: (1) Evergreen broad-leaved, (2) mixed coniferous and broad-leaved, and (3) deciduous. Key results: The results demonstrate that lamina area vs. mass and lamina area vs. petiole mass differ significantly among the three forest types at both the individual leaf and twig levels. Nevertheless, the scaling exponents of lamina area vs. mass were <1.0 in each of the three community types, as were the corresponding exponents for lamina area vs. petiole mass, both within and across the three community types. Similar trends were observed at the individual twig level. The numerical values of the scaling exponent for lamina area vs. petiole mass and total foliage area vs. stem mass per twig decreased with increased elevation. Conclusions: These data support the “diminishing returns” hypothesis at both the individual leaf level and at the individual twig level, phenomena that can inform future inquiries into the mechanistic basis of biomass allocation patterns to physiological (leaf) and mechanical (stem) plant organs.

1. Introduction

Leaf area varies by almost six orders of magnitude across species, ranging from less than 1.0 mm2 to more than 1.0 m2 [1]. As the primary light-harvesting organ for the majority of species, it is important to understand, both empirically and theoretically, how variation in leaf size (measured as area or mass) affects the capacity to capture solar energy and how this in turn affects ecosystem functions [2]. One approach is to analyze the size-dependent (scaling) relationships between leaf lamina area (A) with respect to leaf mass and the mass (M) of supporting structures, such as the petiole and stem, to determine whether they conform to the general scaling equation A = β Mα, where β is the normalization constant and α is the scaling exponent [3,4,5].
In this context, the “diminishing returns” hypothesis predicts that, at the individual leaf level, the interspecific scaling exponent governing the relationship between lamina area (al) and lamina mass (ml), on average, will be less than unity (i.e., α < 1.0), such that incremental gains in lamina mass fail to produce proportional increases in lamina area [5]. If true, specific leaf area (SLA = al/mL), which is a key index of photosynthetic efficiency [6,7], is predicted to decrease with increasing lamina mass across species. Furthermore, it is reasonable to suppose that a larger lamina area or mass would be associated with a more massive petiole, as reported by some early empirical work [8]. For example, using data collected from 44 species, Niinemets et al. [9] found that larger leaves tend to have disproportionately more massive petioles compared with smaller leaves. Pickup et al. [10] reached a similar conclusion. Taken together, the “diminishing returns” hypothesis and empirical data support the notion that increases in lamina area will fail to keep pace with increasing lamina and petiole mass (mp) at the individual leaf level.
Lamina area and lamina mass are crucial leaf traits underpinning the metabolic performance of plants [11]. The “diminishing returns” economic principle provides one explanation for why the scaling of total plant growth as a function of total mass is governed by a scaling exponent with a value significantly less than one [12]. Although the “diminishing returns” hypothesis has been tested at the individual leaf level within and among species [5,13], it remains unclear whether this hypothesis holds for plants growing along major environmental gradients or different community types. For example, the scaling exponent of al vs. ml can shift from <1.0 to >1.0 with increasing elevation, as shown by Pan et al. [14], whereas the corresponding scaling exponent for bamboos is <1.0 and more or less constant along an elevation gradient, as reported by Sun et al. [11]. Evidently, more comprehensive field data are needed to assess the generalizable validity of the “diminishing returns” hypothesis.
Another mostly untested aspect of this hypothesis is whether it holds true at the individual twig level, i.e., does total foliage area per twig scale at <1.0 with respect to total lamina and petiole mass (ML and MP, respectively)? In this regard, Niklas et al. [5] reported that total foliage area (AL) per twig is proportional to both the leaf number per twig (NL) and mean lamina area of individual leaves (i.e., AL NL × al), and that ML is also proportional to NL and the mean lamina mass of individual leaves (i.e., ML NL × ml). If individual lamina area scales disproportionately (allometrically) with individual lamina mass (on average) as proposed by the “diminishing returns” hypothesis (i.e., al mlα< 1.0), it is not unreasonable to speculate that total foliage area at the twig level could be recast as AL NL × ml α< 1.0 ML α< 1.0. Similar reasoning leads to the conclusion that a negative scaling relationship exists between AL and total petiole mass (MP). Yet, to the best of our knowledge, there has been no systematic, extensive testing of the “diminishing returns” hypothesis conducted simultaneously at the individual leaf level and the individual twig level for different plant community types along an elevation gradient.
In order to fill this gap in our knowledge, we report on the lamina size (i.e., measured as lamina surface area and mass), petiole mass, and stem mass from the current-year shoots (i.e., twigs) of 64 woody plant species collected from three different types of forests (i.e., evergreen, mixed coniferous and broad-leaved, and deciduous) along an elevation gradient in China. Several key environmental conditions (i.e., light intensity, temperature, and nutrient availabilities) were also measured and recorded. The data were used to (1) test whether the “diminishing returns” hypothesis holds at both the individual leaf and twig levels, and (2) determine the scaling relationship between lamina area and total supporting mass (the sun of petiole and stem mass) at the twig level.

2. Materials and Methods

2.1. Site Description

The study site is located in the National Natural Reserve of the Wuyi Mountains, southeastern China (27°48.11′–28°00.35′N, 117°39.30′–117°55.47′E). The reserve has a typical subtropical monsoon climate, featuring abundant precipitation and abundant solar radiation. Mean annual precipitation is 2583 mm, with a mean annual temperature of 14.2 °C and evaporation of 778 mm, and 72–92% relative humidity (yearly average). The Wuyi Mountains are characterized by vertical vegetation zonation, going from evergreen forest at low elevation to mountainous steppe at high elevation. The area belongs to the mid-subtropical monsoon climate, with an annual average temperature of 13.2~14.8 °C, an extreme minimum temperature of −14.2 °C, an extreme maximum temperature of 36.3 °C, and an increase in altitude. The annual, monthly, and seasonal average temperatures decrease with the annual average. The vertical decline rate of temperature is 0.44 °C/100 m, that is, for every 100 m rise, the annual average temperature drops by 0.44 °C. The average annual precipitation is 2583 mm, and the period from April to June is the precipitation concentration period in the area. The annual evaporation is 778 mm, and the annual average relative humidity is 72–92%. The annual sunshine hours are 774–1144 h, and the annual average frost-free period is 231 days [15]. The major soil types are classified as mountain yellow–red soil (400–600 m a.s.l.), mountain yellow soil (600–1300 m a.s.l.), mountain dark yellow–brown soil (1300–1900 m a.s.l.), and mountain meadow soil (above 1900 m a.s.l.) [16].

2.2. Leaf and Twig Sampling

Based on the distribution pattern of forest ecosystems at Wuyi Mountain, three types of forest discernable along the elevation gradient were selected: Evergreen broad-leaved forest (EF; 1319 m a.s.l.), a mixed forest (MF; 1697 m a.s.l.), and a deciduous forest (DF; 1818 m a.s.l.). A total of 32, 20, and 23 species (including overlapping species) were respectively sampled in EF, MF, and DF (Table 1). The dominant species in the EF were Rhododendron simiarum Hance, Schima superba, Gardner & Champ., Cyclobalanopsis glauca (Thunb.) Oerst., Rhododendron ovatum (Lindl.) Planch. ex Maxim., and Symplocos sumuntia Buch.-Ham. ex D. Don; the MF was dominated by Symplocos sumuntia, Cyclobalanopsis multiervis W. C. Cheng et T. Hong, Tsuga chinensis (Franch.) Pritzel ex Diels., Taxu schinensis (Rehder & E.H.Wilson) Rehder, Acer elegantulum W.P.Fang & P.L.Chiu, and Illicium minwanense B. N. Chang et S. D. Zhang; and the DF was dominated by Clethra barbinervis Siebold & Zucc., Photinia beauverdiana C. K. Schneider, Acer nikoense Miq., and Fraxinus chinensis Roxb. [17]. The stand densities were 3033 trees/hm2, 1133 trees/hm2, and 2725 trees/hm2 for EF, MF, and DF, respectively, with corresponding mean plant heights of 7.87 m, 10.56 m, and 6.94 m. Three 20 m × 20 m plots were established in each forest type, with at least a 20 m spacing between plots. In each plot, all healthy woody plants with a diameter at breast height (DBH) > 5 cm were marked and their species, DBH, and height recorded.
Three to five representative individuals of each plant species were selected, from which five current-year twigs of medium size with mature leaves (but lacking reproductive organs) were randomly selected at the periphery and two sides of each plant’s crown. Twigs were removed and placed into sealable plastic bags with their ID-code and brought to the laboratory to separate laminas, petioles, and stems. The length and diameter of each stem were measured with a ruler and a vernier caliper, respectively, and the total number of leaves counted. All individual leaves on twigs were digitally scanned using an Epson scanner (Epson V39, Epson, Japan). After separating the organ components, the fresh lamina mass and area, petiole mass, stem mass, and quantitative characteristics of the twig parts and accessories were measured. All leaves on a given twig were removed to measure total foliage area and mass at the twig level. Immediately afterwards, the laminas, petioles, and stems were oven-dried at 75 °C to constant weight to determine their respective dry mass. Each scanned lamina was analyzed using ImageJv1.2 software (National Institute of Health, Bethesda, MD, USA), and its lamina area (al) was recorded.

2.3. Data Analysis

The scaling relationships among lamina area and mass, petiole mass, stem mass, and total supporting mass (MSTM; the sum of petiole and stem mass) at the individual leaf and twig level were analyzed using the equation Y1 = βY2α, where Y1 and Y2 are the interdependent variables of interest, α is the scaling exponent, and β is the normalization constant. All equations were log10-transformed to yield logY1 = logβ + αlogY2. Scaling relationships were quantified using the “smatr” package v 3.4-3 [18] in the R v3.2.3 software platform (R Development Core Team 2012; R Foundation for Statistical Computing, Vienna, Austria). The significance level used for testing slope heterogeneity was set a priori at p ≤ 0.05 (i.e., slope heterogeneity was rejected for p-values > 0.05).

3. Results

3.1. Variation in Lamina Size, Petiole and Stem Mass at the Leaf and Twig Levels

Across the three forest types, at the individual leaf level, mean values of petiole mass (mp), lamina mass (ml), and lamina area (al) individual leaf were 0.010 g, 0.168 g, and 2228 mm2, respectively. The mp differed significantly among the three forest communities, but not al, and individual leaf mass (mL) decreased significantly as elevation increased (Table 2).
At the twig level, the mean values of ML, petiole mass (MP), MS, AL, and MSTM were, respectively, 0.824 g, 0.052 g, 0.107 g, 10994 mm2, and 0.154 g across the three forest types (Table 3). The ML of the three forest types declined with elevation, being significantly lowest in DF, while the AL in the EF and DF significantly exceeded that of the MF (Table 2).

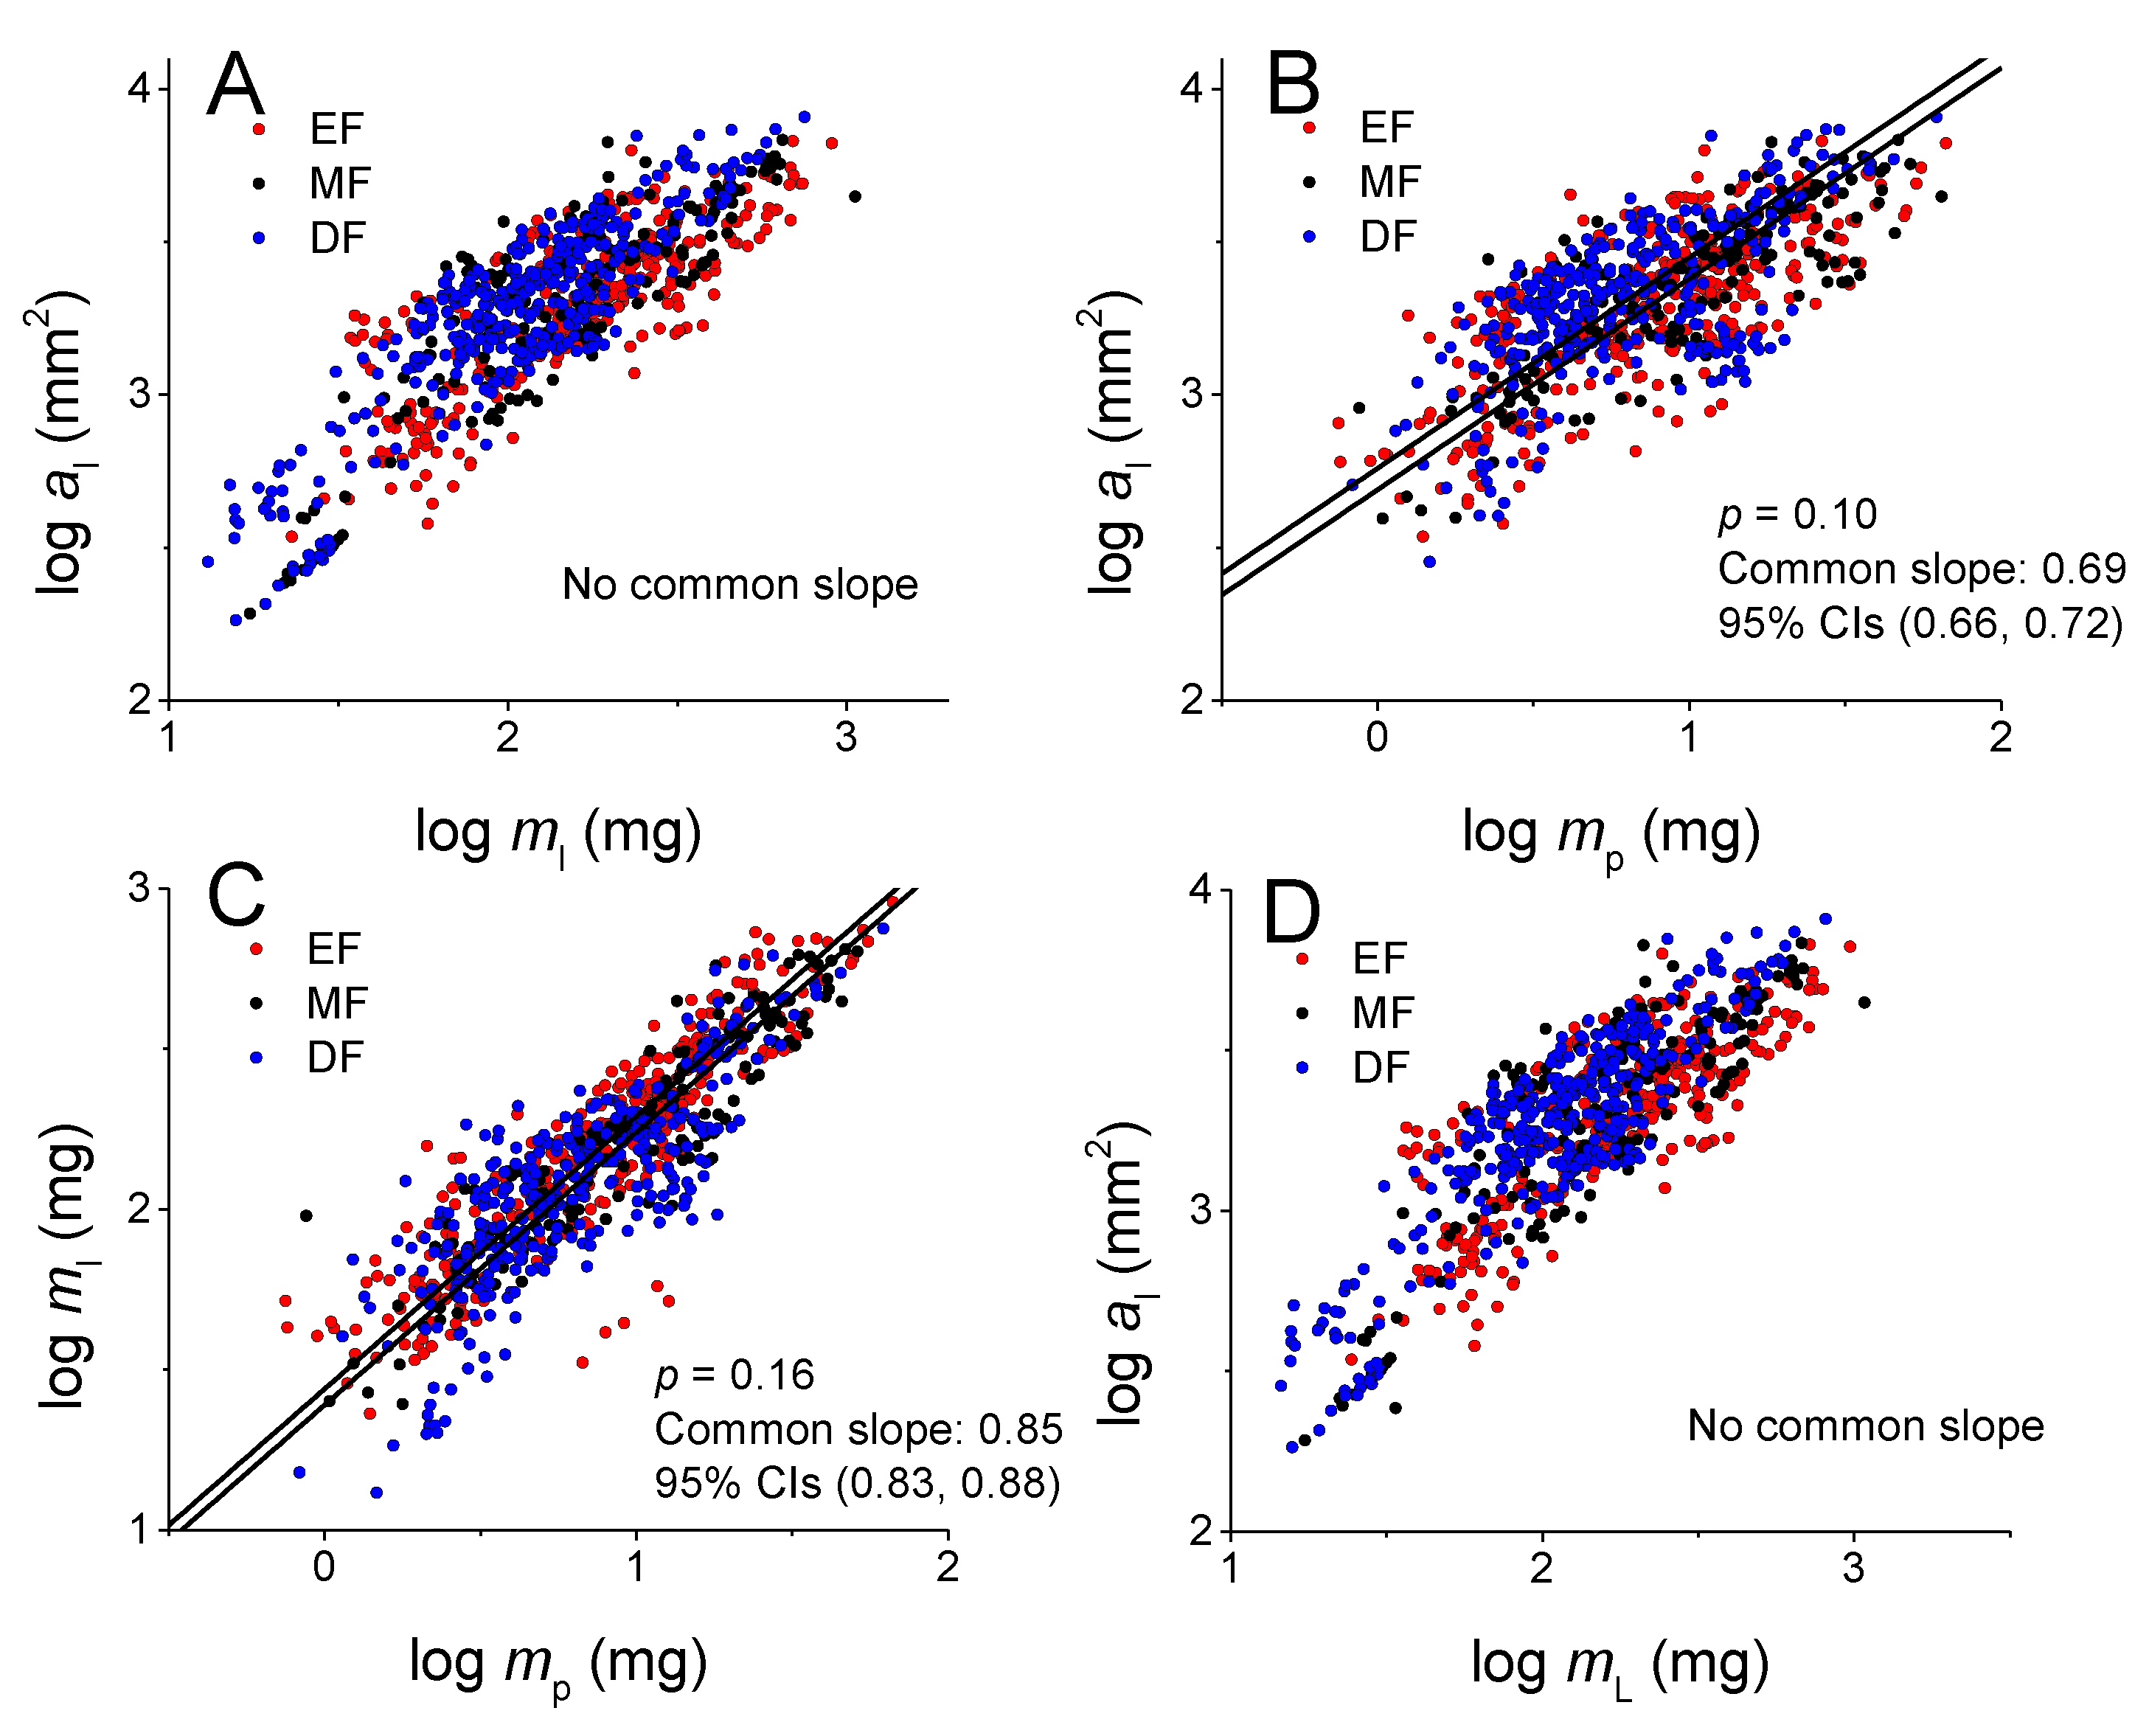
3.2. Scaling Relationships at the Leaf Level among Lamina Area and Mass, and Petiole Mass

Statistically robust correlations of al with respect to other twig traits at the individual leaf level were detected in each of the three forest types (Table 1 and Table 2). Specifically, the scaling exponents of al vs. ml were significantly <1.0 in the EF and DF, being respectively 0.79 (95% CIs = 0.74, 0.84, n = 335, r2 = 0.62) and 0.92 (95%CIs=0.87, 0.96, n = 375, r2 = 0.77) (Table 3; Figure 1A). By contrast, al scaled is ometrically with ml in the MF (i.e., α = 1.00, 95% CIs = 0.96, 1.03, n = 205, r2 = 0.94) (Table 3; Figure 1A). Across all three forest types, al scaled all ometrically and not is ometrically with respect to ml (Table 3; Figure 1A).
Lamina area scaled significantly with respect to petiole mass within and across the three forest types (Table 2 and Table 3). The scaling exponents of al vs. mp did not differ significantly among the three forest types (p = 0.1), having a common slope of 0.69 (95% CIs = 0.66, 0.72). However, the normalization constants of al vs. mp increased significantly with elevation (Table 3; Figure 1B). Similarly, ml increased significantly with mp in each of the three forest community types (Table 2 and Table 3), for which the scaling exponents were all significantly <1.0, having a common slope of 0.85 (95% CIs = 0.83, 0.88; Figure 1C), although their scaling constants of ml vs. mp declined with altitude (Table 2). The scaling exponents of al vs. mL differed among the three forest types. However, they were all significantly <1.0 (Table 3; Figure 1D). Furthermore, across the three forest types, al scaled significantly with an exponent <1.0 with respect to mL (95% CIs = 0.91, 0.96, n = 825, r2 = 0.83) (Table 2; Figure 1D).

3.3. Scaling Relationships at the Twig Level among Lamina Areaand Petiole and Stem Mass

Statistically robust regressions of AL with respect to other twigs traits at the twig level were detected in each forest type (Table 4). Specifically, the scaling exponents for AL vs. ML in EF, MF, and DF were 0.90 (95% CIs = 0.84, 0.96, n = 335, r2 = 0.60), 0.95 (95% CIs = 0.90, 0.99, n = 160, r2 = 0.88), and 0.90 (95% CIs = 0.86, 0.94, n = 330, r2 = 0.78), respectively; each was significantly <1.0, with a common slope of 0.92 (95% CIs = 0.89, 0.95)(Table 4; Figure 2A).
The scaling exponents for AL vs. MP in the EF and MF were, respectively, 0.71 (95% CIs = 0.66, 0.76, n = 335, r2 = 0.56) and 0.72 (95% CIs = 0.66, 0.78, n = 160, r2 = 0.73), each being significantly <1.0 with a common slope of 0.70 (95%CIs=0.67, 0.73) (Table 3; Figure 2B). Further, the scaling exponent in the DF was 0.67 (95% CIs = 0.62, 0.72, n = 330, r2 = 0.54) and also significantly <1.0 (Table 4; Figure 2B).
For AL vs. MS, the scaling exponents in the EF and DF were, respectively, 0.85 (95% CIs = 0.78, 0.92, n = 335, r2 = 0.33) and 0.71 (95% CIs = 0.66, 0.76, n = 330, r2= 0.53) and significantly <1.0 (Table 4). In contrast, AL in the MF scaled is ometrically with respect to MS, with an exponent of 1.03 (95% CIs = 0.96, 1.10, n = 160, r2 = 0.74; Table 4). Further, across the three forest types, AL scaled all ometrically with respect to MS, with each having exponents significantly <1.0 (Table 4; Figure 2C).
For AL vs. MSTM, the EF, MF, and DF had scaling exponents of 0.85 (95% CIs = 0.79, 0.92, n = 335, r2 = 0.48), 0.93 (95% CIs = 0.88, 0.98, n = 160, r2 = 0.86), and 0.75 (95% CIs = 0.71, 0.80, n = 330, r2 = 0.64); both were significantly <1.0 (Table 4), as in the case across the three forest types (Table 4; Figure 2D).
Finally, the scaling exponents of MP vs. MS decreased significantly with increasing elevation, going from 1.19 (95% CIs =1.10, 1.30, n = 335, r2 = 0.47) in the EF to 0.88 (95% CIs = 0.81, 0.94, n = 330, r2 = 0.52) in the DF (Table 4; Figure 2E).

4. Discussion

4.1. Thelamina Area vs. Lamina Mass Scaling Relationship

Our results indicate that the numerical value of the scaling exponent governing the relationships between lamina area (al) and lamina mass (ml) is less than 1.0 along an elevational gradient in the evergreen and deciduous forests of Wuyi Mountain and across all three forest types at the individual leaf level. Therefore, the data support a key prediction of the “diminishing returns” hypothesis [5,19], i.e., increases in lamina area fail to keep pace with increases in lamina mass at the individual leaf level. We also found that the scaling exponent for al versus ml is less than 1.0 in the highest elevation forest (the DF), a result inconsistent with Pan et al. [14], who report a scaling exponent >1.0 at a comparable elevation. One plausible explanation for this discrepancy is differences between the species composition and the precipitation and temperature associated with the two different environments, both of which can influence the scaling relationship between lamina area and lamina mass [5,20,21].
Perhaps more importantly, our analyses demonstrate that the scaling exponent for whole lamina area versus total foliage mass is less than 1.0 at the level of current-year twigs, both within and across the three forest types (Table 4; Figure 2A). With increasing leaf vascular lignifications, the dry-weight investment on a per-leaf area basis should increase, yielding a lower SLA for large-sized leaves [6,7]. If this is a general phenomenon, it would imply that leaf area, as an investment trait for capturing more light, would gradually fail to keep pace with increasing leaf biomass. Indeed, some empirical results indicate that whole-plant leaf area scales as a 0.90 power law with respect to whole-plant leaf mass in a young Hinoki cypress forest [22]. Likewise, it is known that net primary production (NPP) in older forest stands declines [23]. It is possible that the diminishing returns hypothesis helps to explain why the efficiency of light harvesting decreases as total leaf biomass increases, such that NPP declines as forests age. Clearly, more data are needed to verify the link between diminishing returns and declining NPP in forest ecosystems.

4.2. Scaling Relationships of Lamina Area and Petiole Mass

Petiole investment has an important influence on biomass allocation at the twig level [9,24,25,26]. For example, previous studies have shown that petiole investment is size-dependent [9], varying from ca. 2 to 30%, and by even more than 60% in the largest leaves [8,9,25]. However, the scaling relationships between lamina area and petiole mass have seldom been determined for woody plants at both the within-leaf and within-twig level.
Once again, our data are consistent with a size-dependent (scaling) relationship between lamina area and petiole mass predicted by the diminishing returns hypothesis, i.e., increases in lamina area (al) fail to keep pace with increases in petiole biomass (mp) at both the individual leaf and twig levels, both within and across different forest types (Table 3 and Table 4; Figure 1 and Figure 2). These results are interesting from a biomechanical as well as a metabolic perspective, because a petiole mechanically behaves as an elastic cantilevered beam that must support the static load of the leaf lamina [24]. The capacity of a cantilevered beam to static loads becomes less efficient as the beam becomes longer [27]. Therefore, with increasing lamina area, a disproportionately larger investment must be provided to provide mechanical support [20]. Similarly, fluid mechanics shows that the dynamic drag force induced by wind pressure is proportional to lamina area [24,27] and that this force is transmitted to the petiole [20,24,27,28]. Taken together, these two facts help to explain why petiole mass increases disproportionately with respect to lamina area and mass. Indeed, consistent with our results, prior studies have shown that the scaling exponent relating lamina area and petiole mass is significantly <1.0 in different subtropical forest types [26,29]. Our data similarly show that lamina area fails to keep pace with increases in total supporting biomass (i.e., the sum of stem and petiole mass) within and across the three forest communities examined in this study.

4.3. Scaling Relationships of Petiole and Stem Biomass Along an Elevation Gradient

Previous studies have generally neglected the effects of abiotic factors on structural biomass allocation patterns. In the present study, we examined the scaling relationship between total petiole mass and stem mass (i.e., MP and MS) at the whole twig level across three forest communities. We have shown that this relationship shifts systematically, in that the numerical value of the scaling exponent decreases with increasing elevation (Table 4; Figure 2E), i.e., for any given petiole biomass, woody plants in the evergreen and mixed forests allocate more stem biomass than those in the deciduous forest.
A likely explanation for this result is the adaptations of deciduous versus non-deciduous species to changes in precipitation and temperature along an elevational gradient. Arguably, it is reasonable to speculate that the risk of hydraulic failure will increase (and access of soil nutrients will decrease) with increasing elevation [30,31]. A case in point is the deciduous forest, which is distributed at high elevations in our study region. Within this region, water, temperature, and other stress factors measurably increase. Species adapted to this ecosystem tend to have reduced leaf biomass and increased investments in supporting biomass, presumably to maintain a functioning nutrient and hydraulic transport system [32]. In addition, twigs also require additional investment in stem biomass to provide adequate support to cope with wind and snow mechanical loadings [24]. Otherwise, the high-altitude site is often windy in winters and suffers from winter snow cover. Windy environments necessitate a high investment in stems or petioles, as suggested by Niklas [24,28]. Yet, interpreting the relationship between leaf biomass and stem biomass at the twig level along an elevation gradient must be done cautiously. For example, Yang et al. [33] report that leaf biomass scales is ometrically with respect to stem biomass along an elevational gradient. In this particular case, the scaling relationship between lamina and petiole mass in tandem with the systematic shift in petiole versus stem mass can conceivably lead to variations in the investment of lamina area in different forest types, even with a constant biomass allocation between leaf and stem biomass.

5. Conclusions

We conclude that there is a diminishing return between increase biomass and leaf area as elevation increases. The predictions of the diminishing returns hypothesis appear to hold for twigs as well as leaves across diverse woody plants species. Furthermore, biomass investments in petiole and stem tissues vary with elevation in a manner that is consistent with the predictions of the diminishing returns hypothesis when juxtaposed with simple biomechanical considerations. These findings can serve to inform future inquiries into the mechanistic basis of twig biomass allocation patterns between metabolically active tissues and structurally supportive tissues, and future attempts to model twig ecophysiological traits.
We anticipate that biomass investment in supporting (petiole and stem) structures will be shown to be responsive to environmental gradients and as leaf area increases within and across different species. More comprehensive data sets, for many co-occurring species under a variety of environmental conditions, are still needed to assess the generality of the “diminishing returns” hypothesis in plant scaling theory.

Author Contributions

D.C. and M.L. conceived and designed the experiments. J.S., X.C., and M.L. (Man Li) performed the experiments. J.S., M.L. (Min Lyu), G.Z., D.C. and Q.Z. analyzed the data. G.Z., M.W., K.J.N. and D.C. wrote the manuscript. All authors contributed critically to the drafts and gave final approval for publication.

Funding

This work was supported by the National Natural Science Foundation of China (31722007), the National Key Research and Development Program of China (2017YFC0505400), and the Fujian Natural Science Funds for Distinguished Young Scholars (2018J07003).

Acknowledgments

The authors thank Y. R. Guo., L. Cheng., and R. B. Yuan. for their hospitality during the implementation of the study in the National Nature Reserve of Wuyi Mountain. The authors also appreciate the twig sampling collection assistance provided by Y. S. Chen.

Conflicts of Interest

The authors declare no conflict of interest.

References

  1. Niklas, K.J.; Enquist, B.J. On the vegetative biomass partitioning of seed plant leaves, stems, and roots. Am. Nat. 2002, 59, 482–497. [Google Scholar] [CrossRef]
  2. Reich, P.B.; Tjoelker, M.G.; Walters, M.B.; Vanderklein, D.W.; Buschena, C. Close association of RGR, leaf and root morphology, seed mass and shade tolerance in seedlings of nine boreal tree species in high and low light. Funct. Ecol. 1998, 12, 327–338. [Google Scholar] [CrossRef]
  3. Niklas, K.J. Plant Allometry: The Scaling of Form and Process; The University of Chicago Press: Chicago, IL, USA, 1994. [Google Scholar]
  4. Cheng, D.L.; Niklas, K.J. Above-and below-ground biomass relationships across 1534 forested communities. Ann. Bot. 2007, 99, 95–102. [Google Scholar] [CrossRef] [PubMed]
  5. Niklas, K.J.; Cobb, E.D.; Niinemets, Ü.; Reich, P.B.; Sellin, A.; Shipley, B.; Wright, I.J. “Diminishing returns” in the scaling of functional leaf traits across and within species groups. Proc. Natl. Acad. Sci. USA 2007, 104, 8891–8896. [Google Scholar] [CrossRef] [PubMed] [Green Version]
  6. Shipley, B. Structured interspecific determinants of specific leaf area in 34 species of herbaceous angiosperms. Funct. Ecol. 1995, 9, 312–319. [Google Scholar] [CrossRef]
  7. Milla, R.; Reich, P.B.; Niinemets, Ü.; Castro-Díez, P. Environmental and developmental controls on specific leaf area are little modified by leaf allometry. Funct. Ecol. 2010, 22, 565–576. [Google Scholar] [CrossRef]
  8. Niinemets, Ü.; Kull, O. Biomass investment in leaf lamina versus lamina support in relation to growth irradiance and leaf size in temperate deciduous trees. Tree Physiol. 1999, 19, 349–358. [Google Scholar] [CrossRef] [Green Version]
  9. Niinemets, Ü.; Portsmuth, A.; Tena, D.; Tobias, M.; Matesanz, S.; Valladares, F. Do we underestimate the importance of leaf size in plant economics? Disproportional scaling of support costs within the spectrum of leaf physiognomy. Ann. Bot. 2007, 100, 283–303. [Google Scholar] [CrossRef]
  10. Pickup, M.; Westoby, M.; Basden, A. Dry mass costs of deploying leaf area in relation to leaf size. Funct. Ecol. 2005, 19, 88–97. [Google Scholar] [CrossRef]
  11. Sun, J.; Fan, R.; Niklas, K.J.; Zhong, Q.; Yang, F.; Li, M.; Chen, X.; Sun, M.; Cheng, D. “Diminishing returns” in the scaling of leaf area vs. dry mass in Wuyi Mountain bamboos, Southeast China. Am. J. Bot. 2017, 104, 993–998. [Google Scholar] [CrossRef] [Green Version]
  12. Niklas, K.J.; Enquist, B.J. Invariant scaling relationships for interspecific plant biomass production rates and body size. Proc. Natl. Acad. Sci. USA 2001, 98, 2922–2927. [Google Scholar] [CrossRef] [PubMed] [Green Version]
  13. Milla, R.; Reich, P.B. The scaling of leaf area and mass: the cost of light in terception increases with leaf size. Proceedings of the Royal Society B: Biological Sciences 2007, 274, 2109–2114. [Google Scholar] [CrossRef] [PubMed] [Green Version]
  14. Pan, S.; Liu, C.; Zhang, W.; Xu, S.; Wang, N.; Li, Y.; Gao, J.; Wang, Y.; Wang, G. The scaling relationships between leaf mass and leaf area of vascular plant species change with elevation. PLoS ONE 2013, 8, e76872. [Google Scholar] [CrossRef] [PubMed]
  15. Liu, G.F.; Freschet, G.T.; Pan, X.; Cornelissen, J.; Li, Y.; Dong, M. Coordinated variation in leaf and root traits across multiple spatial scales in Chinese semi-arid and arid ecosystems. New Phytologist 2010, 188, 543–553. [Google Scholar] [CrossRef]
  16. Li, M.; Zheng, Y.; Fan, R.R.; Zhong, Q.L.; Cheng, D.L. Scaling relationships of twig biomass allocation in Pinus hwangshanensis along an altitudinal gradient. PLoS ONE 2017, 12, e0178344. [Google Scholar] [CrossRef]
  17. Sun, J.; Wang, M.T.; Lyu, M.; Niklas, K.J.; Zhong, Q.L.; Li, M.; Cheng, D.L. Stem Diameter (and Not Length)Limits Twig Leaf Biomass. Frontiers in Plant Science 2019, 10, 185. [Google Scholar] [CrossRef]
  18. Warton, D.I.; Duursma, R.A.; Falster, D.S.; Taskinen, S. Smatr 3-an Rpackage for estimation and inference about allometric lines. Methods Ecol. Evol. 2012, 3, 257–259. [Google Scholar] [CrossRef]
  19. Niklas, K.J.; Cobb, E.D. Evidence for “diminishing returns” from the scaling of stem diameter and specific leaf area. Am. J. Bot. 2008, 95, 549–557. [Google Scholar] [CrossRef]
  20. Givnish, T.J.; McDiarmid, R.W.; Buck, W.R. Fire adaptation in Neblinariaceliae (Theaceae), a high-elevation rosette shrub endemic to a wet equatorial tepui. Oecologia 1986, 70, 481–485. [Google Scholar] [CrossRef] [Green Version]
  21. Niinemets, Ü. Global-scale climatic controls of leaf dry mass per area, density, and thickness in trees and shrubs. Ecology 2001, 82, 453–469. [Google Scholar] [CrossRef]
  22. Ogawa, K.; Adu-Bredu, S.; Yokota, T.; Hagihara, A. Leaf biomass changes with stand development in Hinoki cypress (Chamaecyparis obtusa [Sieb. & Zucc.] Endl.). Plant Ecol. 2010, 211, 79–88. [Google Scholar] [CrossRef]
  23. Drake, J.E.; Davis, S.C.; Raetz, L.M.; Delucia, E.H. Mechanisms of age-related changes in forest production: The influence of physiological and successional changes. Glob. Chang. Biol. 2011, 17, 1522–1535. [Google Scholar] [CrossRef]
  24. Niklas, K.J. Plant Biomechanics: An Engineering Approach to Plant Form and Function; The University of Chicago Press: Chicago, IL, USA, 1992. [Google Scholar]
  25. Niinemets, Ü.; Portsmuth, A.; Tobias, M. Leaf size modifies support biomass distribution among stems, petioles and mid-ribs in temperate plants. New Phytol. 2006, 171, 91–104. [Google Scholar] [CrossRef] [PubMed]
  26. Li, G.Y.; Yang, D.M.; Sun, S.C. Allometric relationships between lamina area, lamina mass and petiole mass of 93 temperate woody species vary with leaf habit, leaf form and altitude. Funct. Ecol. 2008, 22, 557–564. [Google Scholar] [CrossRef]
  27. Niklas, K.J. The evolution of leaf form and function. In Leaf Development and Canopy Growth; Marshall, B., Roberts, J.A., Eds.; Scheffield Academic Press: Scheffield, UK, 2000. [Google Scholar]
  28. Niklas, K.J. A mechanical perspective on foliage leaf form and function. New Phytol. 1999, 143, 19–31. [Google Scholar] [CrossRef]
  29. Zhu, J.D.; Meng, T.T.; Ni, J.; Su, H.X.; Xie, Z.Q.; Zhang, S.R.; Zheng, Y.R.; Xiao, C.W. Within-leaf allometric relationships of mature forests in different bioclimatic zones vary with plant functional types. Chin. J. Plant Ecol. 2011, 35, 687–698. [Google Scholar] [CrossRef]
  30. Sun, S.C.; Jin, D.M.; Shi, P.L. The leaf size-twig size spectrum of temperate woody species along an altitudinal gradient: An invariant allometric scaling relationship. Ann. Bot. 2006, 97, 97–107. [Google Scholar] [CrossRef] [Green Version]
  31. Xiang, S.; Wu, N.; Sun, S. Within-twig biomass allocation in subtropical evergreen broad-leaved species along an altitudinal gradient: Allometric scaling analysis. Trees 2009, 23, 637–647. [Google Scholar] [CrossRef]
  32. Woodward, F.I.; Lomas, M.R.; Kelly, C.K. Global climate and the distribution of plant biomes. Philos. Trans. R. Soc. Lond. B Biol. Sci. 2004, 359, 1465–1476. [Google Scholar] [CrossRef] [Green Version]
  33. Yang, Y.; He, X.; Xu, X.; Yang, D. Scaling relationships among twig components are affected by sex in the dioecious tree Populus cathayana. Trees 2015, 29, 737–746. [Google Scholar] [CrossRef]
Figure 1. (A) relationships between al and ml in three forest community types at Wuyi Mountain, China; (B) relationships between al and mp in three forest community types at Wuyi Mountain, China; (C) relationships between ml and mp; (D) relationships between al and mL in three forest community types at Wuyi Mountain, China. EF, evergreen forest; MF, mixed forest; DF, deciduous forest. al, individual lamina area; ml, individual lamina mass; mp, individual petiole mass; mL, individual leaf mass.
Forests 10 01138 g001
Figure 2. (A) relationship between AL and ML in three forest community types at Wuyi Mountain, China; (B) relationship between AL and MP in three forest community types at Wuyi Mountain, China; (C) relationship between AL and MS in three forest community types at Wuyi Mountain, China; (D) relationship between AL and MSTM in three forest community types at Wuyi Mountain, China; E: relationship between MP and MS in three forest community types at Wuyi Mountain, China. EF, evergreen forest; MF, mixed forest; DF, deciduous forest. AL, total foliage area; ML, total foliage mass; MP, total petiole mass; MS, stem mass; MSTM, summed petiole and stem mass.
Forests 10 01138 g002
Table 1. Summary of species taxa of different forest communities in Wuyi Mountain.
Forest TypePFTSFamilyGenusSpeciesLifeformFamilyGenusSpecies
EFarbor91518evergreen81322
shrub101114deciduous91010
MFarbor91012evergreen81013
shrub458deciduous557
DFarbor889evergreen556
shrub121314deciduous141617
Note: EF, evergreen forest; MF, mixed forest; DF, deciduous forest; PFTS, a collection of species with similar structures or functions.
Table 2. Leaf-level and twig-level biomass allocation (mean ± standard error (SE)) in different forest type son Wuyi Mountain (China).
Type Leaf-level Twig-Level
nmp (g)ml (g)al (mm2) mL (g)ML (g)MP (g)MS (g)AL (mm2)MSTM (g)
EF3350.011 ± 0.52b0.2 ± 8.19a2286 ± 66.83a0.21 ± 8.66a0.91 ± 34.59a0.051 ± 2.71b0.111 ± 4.51a10983 ± 349.75a0.162 ± 6.17a
MF2050.014 ± 0.93a0.173 ± 11.77b2135 ± 115.14a0.184 ± 12.45b0.808 ± 69.04a0.063 ± 5.54a0.088 ± 7.85b9509 ± 677.66b0.137 ± 12.07b
DF3750.009 ± 0.42c0.138 ± 5.61c2228 ± 72.10a0.145 ± 5.94c0.755 ± 36.67b0.048 ± 2.86b0.114 ± 5.57a11816 ± 413.51a0.156 ± 7.74a
All9150.010 ± 0.330.168 ± 4.692228 ± 46.210.178 ± 4.960.824 ± 25.080.052 ± 1.920.107 ± 3.3310994 ± 262.390.154 ± 4.75
Note: Different letters (a, b, and c) within a column indicate significant differences among forest types at the p < 0.05 level.
Table 3. Relationships between biomass allocation to different leaf-level components in three forest communities on Wuyi Mountain (China).
log y vs. log xForestsnα (95%CIs)log β (95%CIs)r2p
al vs. mlEF3350.79 (0.74, 0.84)1.57 (1.45, 1.68)0.62<0.001
MF2051.00 (0.96, 1.03)1.13 (1.06, 1.20)0.94<0.001
DF3750.92 (0.87, 0.96)1.40 (1.31, 1.49)0.77<0.001
All9150.94 (0.92, 0.97)1.28 (1.23, 1.34)0.83<0.001
al vs. mpEF3350.68 (0.63, 0.73)2.70 (2.65, 2.75)0.52<0.001
MF1600.65 (0.60, 0.71)2.72 (2.66, 2.78)0.67<0.001
DF3300.74 (0.68, 0.80)2.72 (2.67, 2.77)0.43<0.001
All8250.68(0.65, 0.72)2.72(2.69, 2.75)0.51<0.001
ml vs. mpEF3350.86 (0.82, 0.90)1.44 (1.40, 1.48)0.81<0.001
MF1600.82 (0.77, 0.87)1.42 (1.37, 1.48)0.85<0.001
DF3300.89 (0.83, 0.94)1.36(1.31, 1.41)0.67<0.001
All8250.86(0.83, 0.89)1.40(1.38, 1.43)0.77<0.001
al vs. mLEF3350.79 (0.74, 0.84)1.55 (1.43, 1.67)0.62<0.001
MF1600.99 (0.96, 1.02)1.12 (1.05, 1.19)0.94<0.001
DF3300.91 (0.87, 0.96)1.39 (1.30, 1.48)0.77<0.001
All8250.94 (0.91,0.96)1.27 (1.22, 1.33)0.83<0.001
Note: al, individual lamina area; ml, individual lamina mass; mp, individual petiole mass; mL, individual leaf mass; 95%CIs, 95% confidence intervals.
Table 4. Between biomass allocation to different twig-level components in three forest communities on Wuyi Mountain (China).
log y vs. Log xForestsnα (95%CIs)log β (95%CIs)r2p
AL vs. MLEF3350.90 (0.84, 0.96)1.40 (1.22,1.57)0.60<0.001
MF1600.95(0.90, 0.99)1.27(1.15,1.39)0.88<0.001
DF3300.90(0.86, 0.94)1.52(1.40, 1.64)0.78<0.001
All8250.92 (0.90, 0.95)1.37(1.29, 1.45)0.76<0.001
AL vs. MPEF3350.71 (0.66, 0.76)2.87 (2.79, 2.95)0.56<0.001
MF1600.72 (0.66, 0.78)2.83(2.73, 2.92)0.73<0.001
DF3300.67(0.62, 0.72)3.01 (2.93, 3.09)0.54<0.001
All8250.70 (0.67, 0.73)2.91(2.86, 2.96)0.57<0.001
AL vs. MSEF3350.85(0.78, 0.92)2.32 (2.18, 2.47)0.33<0.001
MF1601.03 (0.96, 1.10)2.02(1.89, 2.15)0.74<0.001
DF3300.71(0.66, 0.76)2.67 (2.57, 2.76)0.53<0.001
All8250.85 (0.81, 0.89)2.35(2.28, 2.42)0.54<0.001
AL vs. MSTMEF3350.85(0.79, 0.92)2.17 (2.03, 2.31)0.48<0.001
MF1600.93 (0.88, 0.98)2.03(1.94, 2.13)0.86<0.001
DF3300.75 (0.71, 0.80)2.47 (2.37, 2.56)0.64<0.001
All8250.85 (0.82, 0.88)2.22(2.16, 2.28)0.67<0.001
MP vs. MSEF3351.19 (1.10, 1.30)–0.76 (–0.95, –0.58)0.47<0.001
MF1601.06 (0.97, 1.16)–0.37(–0.56, –0.18)0.64<0.001
DF3300.88(0.81, 0.94)–0.15 (–0.27, –0.02)0.52<0.001
All8250.92 (0.90, 0.95)1.37(1.29, 1.45)0.76<0.001
Note: AL, total foliage area; ML, total foliage mass; MP, total petiole mass; MS, stem mass; MSTM, summed petiole and stem mass; 95%CIs, 95% confidence intervals.

