Abstract
The significance of street-side greenery monitoring is increasing for precise urban planning and environmental management, especially in rapid sprawling urban cities, while there have been few studies focusing on urban greenery estimation using new profile image system. In this study, Baidu Street View (BSV) images, which were taken by Baidu vehicles and had view angles similar to those of pedestrians on the street, were selected for calculating the magnitude of street profile greenery. From 278 randomly selected street sample sites in Tai’an city of China, 3336 images were acquired via the Baidu Application Programming Interface (API). A Baidu Green View Index (BGVI) was proposed to quantitatively describe the street-side profile greenery. The results demonstrated that green vegetation can be distinguished efficiently from BSV images. The BGVI varied in the different portions of the study area, and it can be used to grade street system by considering pedestrians’ visualized greenery. Though BGVI had a significant correlation with the overlooking green canopy coverage, in some street sample sites it can delineate different scenarios. BGVI can be regarded as complementary information to urban planning and management.
1. Introduction
Urban street-side greenery (e.g., street tree, shrub wood, grass, etc.) has long been one of the most prime landscape design factors in urban ecological system (e.g., [1,2]). It can synthesize oxygen [3,4], mitigate urban heat island effect [5,6], and help to increase peoples’ esthetic feelings [7,8] in vision aspects, offering the opportunity of improving peoples’ health and welfare [9,10,11].
Previous studies have conduct field surveys [12], interviews [13,14] and audits [15] to estimate pedestrians’ feeling to the visual quality of greenery to better understand the function of street-side greenery. Since 1970s, multi-scale remotely sensed (RS) data provide a more objective access to study urban greenery and have made obvious progresses [16,17]. However, RS images have obvious limitations as they are acquired from an overlooking view, while pedestrians’ common view of greenery is from profile aspect. For instance, a green wall from profile view can be missed from above using RS images. Moreover, an overhead view from RS images may omit the grass or shrub under the canopy cover, which is the scene pedestrians on the ground can see at the street side (Figure 1).
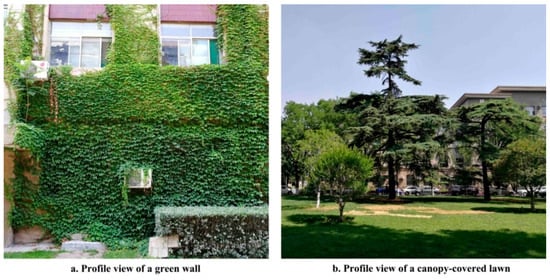
Figure 1.
Profile view of a green wall (a) and a canopy-covered lawn (b).
To overcome these defects, a Green View Index (GVI) was proposed by Yang et al. using images taken in four directions (east, south, west, and north) to evaluate the visibility of surrounding urban forests as representative of pedestrian’s view of greenery [18]. The results showed that GVI was effective and efficient in evaluating the visual effects of urban forests. However, the workflow of GVI calculation in this study was conducted manually, which was time-consuming and might introduce more human errors. In addition, pedestrians’ perception to surrounding environment has been proved to be influenced by hemispherical scene [19] and four pictures are not enough to cover the view field. Therefore, a modified GVI was developed to collect and process images from six horizontal directions and three vertical view angles to stitch a continuous image of the streetscape [8]. The results were found to be more practical and suitable for representing the greenery that pedestrians can see on the ground, despite having to process eighteen images in each street site, which were more time and labor consuming. Since 2008, urban greenery construction in China became more rapid. It is of prime importance to estimate the street-side greenery quantitatively in order to better guide the urban landscape planning. To precisely depict the greenery that pedestrians can see on the street, the Baidu Company® [20] in China provides an open map platform service, through which users can register to be developers and use a panoramic coordinate picking tool to locate and acquire the Baidu Street View (BSV) image in directions at different street site. By stitching the images together, BSV can provide a data source for urban greenery planning, and also population immigration analysis during the Chinese spring festival [21], three-dimensional urban modeling [22] and identification of commercial entities [23,24].
The literature review found that there has been no study using BSV images for urban planning or estimation of street-side greenery. Therefore, this study explored the acquisition and processing of BSV images, and demonstrated the performance of these images in estimating pedestrians’ visual quality of street greenery using a Baidu Green View Index (BGVI). The relations of BGVI with green vegetation coverage were discussed to find mutual application in urban greenery planning and environmental management.
2. Study Area
The study was conducted in the downtown of Tai’an city, China (Figure 2), which was covered with BSV images captured in summer period of 2016. The study area is enclosed by the Huanshan Road (2.73 km in length), Puzhaosi Road (1.97 km), Dongyue Road (3.50 km), and Wangyuedong Road (0.92 km). The main street system in the study area was generated referring to the Open Street Map (openstreetmap.org) and were overlaid on a 0.5 m spatial resolution RS image acquired in May, 2016. According to previous studies, Tai’an city is a representative area in urban greenery study for its high green vegetation coverage rates through north China (e.g., [25,26,27]), a more rational estimation of profile greenery is indispensable for local urban landscape planning and management.
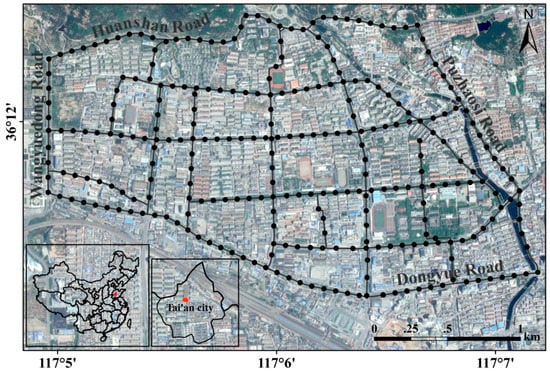
Figure 2.
Location of the study area and randomly generated street sample sites.
3. Data Acquisition and Process
3.1. BSV Images Acquisition
To depict street-side greenery of the study area, 300 street sample sites were randomly generated in professional geographical information system software ArcGIS Desktop® 10.1 (Environment System Research Institute, lnc., Redlands, CA, USA) along the road map system, and the least distance allowed between two randomly selected sites was set to 30 m; sites distributed too closely were discarded. Finally, 278 sites remained and were used to collect BSV images (Figure 2).
A street view of one street sample site is showed in Figure 3. The guide map on the left shows the streets covered by panorama street views, displayed in blue lines. It can be seen that almost all the streets in the study area were covered with BSV images. The virtual eyeball with a fan shape in the middle part presented the current user’s location. The street view is the same as a user sees a BSV panorama. BSV panorama is a 360° surrounding image generated from the original street views captured by the horizontal and vertical cameras by stitching them together. BSV panoramas have a 360° horizontal coverage and +90° to −20° vertical coverage. Each available BSV image can be requested in a HTTP URL form using BSV Image API [20] along with the position of BSV vehicle and its heading direction. By defining URL parameters sent through a standard HTTP request [28] using the BSV Image API, we can get a static BSV image [29] in each direction and at different vertical angles for the sites where BSV images are available, i.e., blue lines on the guide map in Figure 3.
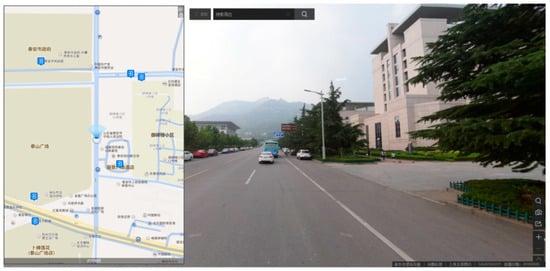
Figure 3.
A Baidu street view (BSV) in the study area.
Where “width” and “height” specified the output size of the requested image, and “location” provided the geography location of BSV image. The letter “h” in the URL meant the compass heading of the camera (ranging from 0 to 360), and “p” was the vertical angle of the camera relative to the street view vehicle. Here, the “h” and “p” were both “0”, which meant the image was acquired when the BSV vehicle was heading north with a horizontal view angle. Figure 4 is the BSV static image using the access above.
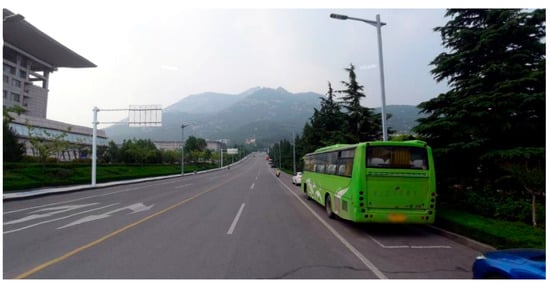
Figure 4.
An example of the BSV static image.
To distinguish the green areas that pedestrian can see, BSV images in four directions and three different vertical view angles in each direction were acquired for every street sample site. Considering the horizontal covering ranges of BSV images, four images were adequate to cover the 360° horizontal surroundings; therefore, the “h” in the URL was set to 0, 90, 180, and 270, respectively (Figure 5a). Due to the limitation of BSV vehicle camera’s base part, the vertical angle range of BSV images was from +90° to −20°, therefore the parameter “p” was set to three angles, i.e., +60 and 0 to avoid repeat part, and −20, which was the maximum down-looking angle (Figure 5b). However, as showed in Figure 5b, images of vertical angle 0°and −20° had distinct duplicative green vegetation parts, which may lead to overestimation of green vegetation results. Therefore, the repeated part of the two angles were split and discarded from that of vertical angle −20°. Finally, 3336 images were downloaded and stored for green vegetation classification and BGVI calculation.
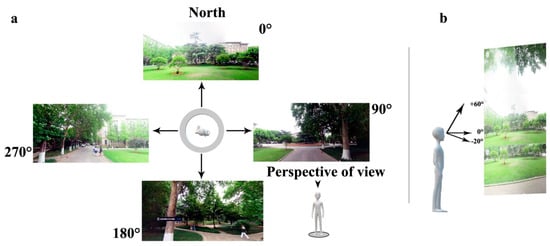
Figure 5.
BSV images acquired in horizontal directions (a) and vertical view angles (b) at a street sample site.
3.2. Greenery Extraction from BSV Images
Green vegetation extraction from RS imagery has been studied for almost half a century [30,31]. High reflectance and high absorb characteristics at near infrared and red band makes green vegetation relatively easy to be interpreted from RS images. However, BSV images only contain red, green, and blue bands. Considering the unavailability of the near infrared band, the efficient Support Vector Machine (SVM) classification method [32] was selected to extract green vegetation from the BSV image.
Before the image classification procedure, all street sample sites were checked according to the image location through in-situ field surveys, and all the BSV images were compared with the scenery. At the classification workflow, green vegetation, shadow, trunk and stem, sky, building, pavement, pitch, etc., were identified as different regions of interest according to different scenes. After the initial classified image was obtained using the SVM method, all the classes were merged into green vegetation and others. Thereafter, the post classification refinements were applied to the classification maps by checking the vegetation distinguishing results to reduce classification errors caused by the similarities in spectral responses of certain classes, such as green vegetation and shadow, green vegetation and green windows/walls, etc. In addition, many isolated pixels occurred during the classification process; a three multiply three majority filter was applied to reduce this “salt and pepper” effect [33].
3.3. BGVI Calculation and Analysis
Four images covering horizontal surroundings for each street sample site in the study area and three different vertical view angles in each direction (Figure 5b) were collected at each direction for calculating BGVI. Consequently, the index was calculated using twelve BSV images for each street sample site in the study area. The BGVI calculation formula is shown as follows:
where is the image of four horizontal directions (east, south, west and north), and is the vertical image of three angles (+60°, 0°and −20°). is the number of green pixels in one of these images captured in four directions with three vertical view angles for each sample site, and is the total pixel number in one of the twelve BSV images.
Furthermore, to analyze the distribution characteristics of BGVI and its relationship with overlooking greenery, canopy and grass areas were interpreted separately from the RS image in Figure 2 using an SVM classification method and refinement process, which was simultaneous with the BGVI calculation. Considering the width of street in the study area, the areas of canopy and grass circumjacent the 278 street sample sites with 20, 40, 60, and 80 m buffer distance were then vector intersected, vector dissolved, and the covering area was calculated in ArcGIS Desktop® 10.1. The relationship of BGVI and canopy and BGVI and grass coverage were measured using the Pearson’s correlation method. The calculation formula of Pearson’s correlation is shown as follows:
where n is the sample size (278 here), X and Y are the values of the two variables (e.g., BGVI and the area of overlooking greenery), and is the Pearson’s correlation coefficient of the two variables. If results are higher than 0, the two variables have a positive correlation; otherwise, they are negatively related. Moreover, the larger the absolute value of is, the stronger the correlation is [34].
4. Results
4.1. Green Vegetation Extraction
The green vegetation results of all the 3336 BSV images were extracted using the SVM method, and three vertical BSV images in a representative street sample site are shown in Figure 6. Figure 6a were the original BSV images, Figure 6b showed the examples of vegetation classification results based on SVM, and Figure 6c were the refinement results.
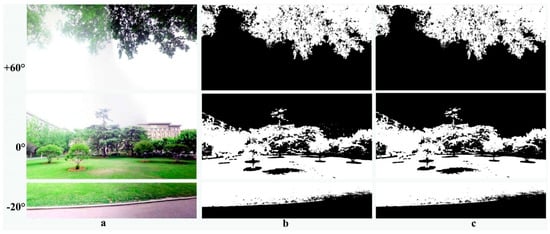
Figure 6.
Green vegetation extracting results using a Support Vector Machine (SVM). (a) BSV images, (b) SVM processing results and (c) refinement results.
The figure above indicated that most of the green vegetation pixels in the BSV image were correctly delineated in the classified image (Figure 6b) compared with the original images (Figure 6a). However, there were still some artificial walls, windows, and shadow in the classified image which were misclassified and should not be regarded as green vegetation (Figure 6c). In general, the SVM classification method can accurately pick out the green vegetation, even though some artificial green features were misclassified. However, in practical urban management applications, artificial green features possess relative small parts of landscape. The misclassification results should have little influence on the further profound analysis.
Accuracy estimation of the classification results was conducted using 50 of the 278 street sample sites. A scatter plot (see Figure 7) showed the relationship between the values of the BGVI calculated using classified maps from SVM classification method and the corresponding values calculated based on the manually classified data. It can be found that BGVI values were mainly distributed near the 1:1 line with the regression coefficient up to 0.95, which meant that BGVI values calculated using the two methods were quite similar. Additionally, the root mean square error value was 0.26, which indicated that the BGVI calculated using SVM method was of high quality.
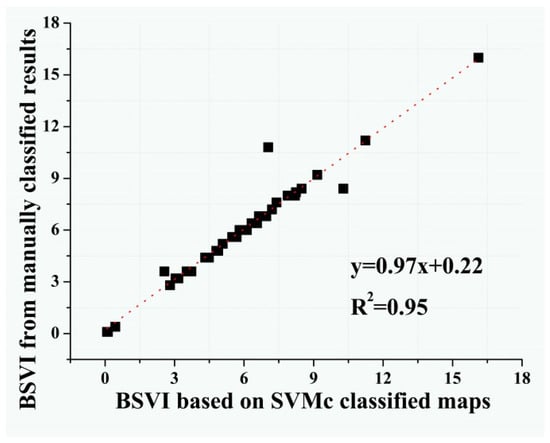
Figure 7.
Linear fitting of Baidu Green View Index (BGVI) calculated using SVM versus the refined results.
4.2. Characteristics of BGVI
Figure 8 showed the BGVI calculating results of the 278 street sample sites in the study area. The size of dots represented the magnitude of BGVI values. The results were overlaid on the RS image classified land cover map, in which dark green features represented urban canopy, light green ones were the grass areas, and white color represented the non-vegetation features. It can be found preliminarily that the study area was covered with high green vegetation coverage, while the greenery conditions differed prominently in different portion. Overall, the southeast and west parts of the study area were covered with relative larger areas of forest and grass. However, the magnitude of BGVI in these parts seemed to be not coherent with the green vegetation coverage results, i.e., low BGVI values were found in high green vegetation coverage area. Additionally, some street sample sites with high BGVI were distributed in low green vegetation coverage area.
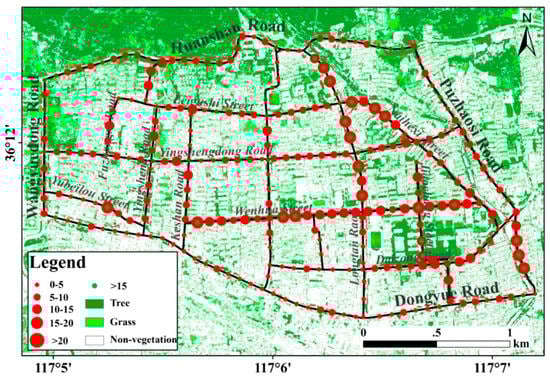
Figure 8.
BGVI results of the sample sites in the study area overlaid on the land cover map.
Furthermore, to study the spatial distribution characteristics of BGVI, road system of the study area was categorized into east-west (E-W) and north-south (N-S) sectors according to their directions. The BGVI values of street sample sites in each road were summarized into 4 intervals, i.e., [0,5) (in which the value ≥0 and < 5), [5,10), [10,15) and ≥15 (Table 1).

Table 1.
BGVI summary of the 278 street sample sites.
Statistical results found that there were 108 street sample sites with BGVI < 5, and the lowest BGVI value was 0.10. These sites were mainly located in the E-W direction of the Dongyue Road (30 sites) and Huanshan Road (11 sites), and in a N-S direction for the Aolaifeng Road (15 sites), which may not seem so green in the pedestrians’ views. Moreover, there were 112 sites with BGVI values ranging in [5,10), which were mainly distributed in the E-W Huanshan, Leigushi, and Yingshengdong Road and the N-S Puzhaosi Road. Among the 58 street sample sites with BGVI values higher than or equal to 10, 37 sites’ values ranged between 10 and 15, E-W Wenhua Road contained 13 of the 37 sites, which was the most in this interval (Figure 8), and there were 21 sites with BGVI values ≥15. An analysis found that these high BGVI street sample sites were mainly located in the N-S road sector of the east portion of the study area, which meant this region may look “greener” than the other places in the pedestrians’ views, based on the randomly selected street sample sites. Among these 21 sites, three sites were located on the N-S Puzhaosi Road in the east border, three on the N-S Jiaochang Street, and three on the N-S Naihexi Road. Moreover, the N-S Longtan Road contained seven sites with BGVI value higher than 15, which was the most throughout the road system. In the E-W sector, Wenhua Street in the middle portion of the study area consisted of four sites ≥15 with two dispersedly located in the ends of the street; only one site with the BGVI value ≥15 was located in the southwest east-west Yubeilou Street (Figure 8).
4.3. Relationship of BGVI and Overlooking Greenery
Table 2 provided the Pearson’s correlation coefficients between BGVI values and green vegetation coverage area interpreted from RS images at 20, 40, 60, and 80 m buffer distances around the street sample sites, considering the maximum street width in the study area. The results of canopy and grass coverage area were displayed in dark and light green colors in the different buffer circles, respectively (Figure 9).
Table 2.
Pearson’s correlation results of buffer distances between BGVI and green vegetation coverage.
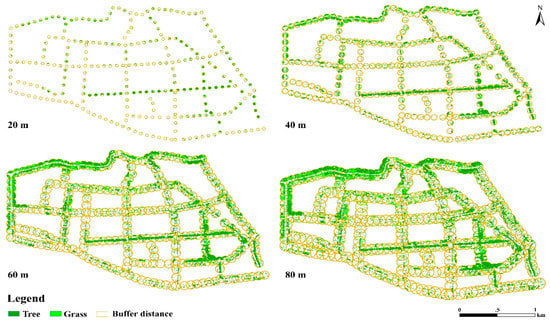
Figure 9.
Green vegetation distribution at different buffer distances from 278 street sample sites in the study area.
A comprehensive analysis found that BGVI values of the 278 street sample sites have significant strong positive correlation with green vegetation coverage in the 20 m buffer distances at the p < 0.01 level, while the correlation coefficients decreased to medium positive correlation as the buffer distance increased to 40 and 60 m, and further went downward to weak correlation beyond 80 m. Separately analysis can find that correlation of BGVI and canopy coverage were more steady than that of BGVI and green vegetation coverage (Table 2). A profile-view BGVI and overlooking-view canopy coverage were positive related. Compared with the significant correlation relationships between BGVI and canopy coverage, the correlation between BGVI and grass coverage was much weaker and showed no significance.
5. Discussion
BSV images taken by the Baidu vehicle that had view angles similar to that of pedestrians on the street were proposed to estimate the magnitude of profile street-side greenery, which was not involved before in urban cities of China. Twelve BSV images were acquired to stitch a continuous image of a streetscape in representative urban area of Tai’an city, and a BGVI was proposed to quantitatively describe street-side greenery, which was found to be fit for representing the street-side greenery that pedestrian can see on the street.
As mentioned in Section 4.3, BGVI and overlooking green vegetation coverage showed significant correlation with green vegetation coverage. In practical application, RS imagery can be used to extract overlooking biophysical information such as covering area of green canopy, above ground biomass, and leaf area index (LAI), etc., which are helpful in understanding the urban green system, choosing appropriate urban vegetation, and adjusting the urban green ratio according to urban planning concepts. However, spatial analysis of BGVI distribution found that some high BGVI values were not coherent with that of the overlooking vegetation cover. For instance, the street sample site in the southwest Yubeilou Street had a low coverage of greenery from the land cover map, while its BGVI value was relatively high (>15). BSV is affected by various factors such as the distances between greenery and pedestrian, the existence year of road, the vertical structure of greenery, and the layout of buildings. The vegetation area interpreted from RS imagery above satellite platform was determined mainly by the overlooking canopy. Supplementary field survey found that the street sample site in Yubeilou Street was located in an aged alley with big trees. In the view of RS images, the tree was not a large green-covering area, though it looked greener in the profile BSV images. High vegetation cover observed from RS imagery may not mean a high BGVI. Moreover, BGVI and grass coverage showed no significance correlation; the primary cause was most visible RS sensors had no penetration ability, the grass areas were actually blocked by above canopy from the overlooking view, while BGVI can quantitatively delineate the coverage of green vegetation from tree down to shrub and grass in profile view. This indicates that the combining of BGVI and RS-extracted information in practical use is essential for more rational urban greenery planning and management.
Overall, the BGVI-based method is a feasible tool for estimating street-side profile greenery, which provides an indispensable data source for urban green space monitoring. It starts from a new profile view and uses 12 BSV images to stitch a continuous image of a streetscape, which can overcome the flaws of existing GVI and modified GVI. Moreover, it is an efficient method in which many processes can be all- or semi- automatically conducted, e.g., this study can download BSV images in the study area by parsing the HTTP URL using the BSV Image API automatically. The downloaded BSV images were processed by a computer with supervision to extract the greenery information and calculate BGVI. The process is automatic without excessive human intervention. The method can be used for green space estimation for any urban area where BSV images in growing seasons are available. Furthermore, The BGVI based on BSV images can be used in location-based services to calculate the magnitude of visible street greenery, it can be used to detect and monitor the dynamic change in urban street greenery, and it may also be used to check the visual impact of some urban forest management practices and document the visibility of urban greenery in cities. The proposed methodology for measuring BGVI based on BSV image is understandable and easy to be utilized. As most urban cities in China have been in the BSV image covering system, it seems to be a promising tool for future urban planning and environmental management.
However, although BSV and BGVI can deliver useful urban greenery information that is not previously proposed in China, there are two restriction concerns urgent to be resolved. The first is the capture time of the BSV image. BSV provides a static access of urban street landscape; the urban space was stop-motioned at the exact moment when each image was taken, while the urban area is a dynamic system in which the street greenery changes momentarily. Therefore, acquisition time is a crucial factor to the calculating of BGVI. However, this important information did not appear in the Baidu image API. Recently, Baidu Company is updating the BSV images, and have added time stamp on the lower left side of BSV images. The second concern is the lack of multi-temporal BSV images. Due to the unavailability of BSV images taken in different time, the BSV image API cannot deliver multi-temporal BSV images for one location, which has hindered its broader use for urban landscape dynamic monitoring. Fortunately, the Unmanned Aerial Vehicle (UAV) carrying multi-band sensors was gradually used in the urban greenery study. With the aid of UAV system, dynamic change of street-side greenery can be detected and monitored for the study of urban landscape planning in the recent future.
6. Conclusions
BSV images were examined for measuring and monitoring the magnitude of street-side greenery that pedestrians can see on the ground at different street sample sites in a representative urban area of China, with a newly proposed BGVI. The results revealed that BSV images were qualified for estimating street greenery and BGVI was an objective measurement of street-side greenery. Taking advantage of the characteristics of BSV image, BGVI used 12 BSV images at different view angles to estimate profile street greenery, which can have more application significance in urban planning and environmental management. The BGVI-based method is a pedestrian-view tool for street-side greenery estimation in urban areas, which is more feasible and efficient in profile greenery monitoring. BGVI data can be an indispensable complementary data source for precision urban development. As the BSV system has already covered hundreds of urban cities in China, it can be used in other urban areas and will be useful to urban planners and decision makers to further understand the visual functions of urban green space. This paper presented a primarily study result of BSV and BGVI application; more profound researches are recommended.
Author Contributions
Conceptualization, G.Z.; Methodology, X.Y. (Xinyang Yu) and C.C.; Verification: X.Y. (Xiujie Yuan); Visualization, F.H.; Writing—original draft, X.Y. (Xinyang Yu); Writing—review & editing, G.Z.
Acknowledgments
This study is partly supported by the “Double Tops” Program Project (SYL2017XTTD02), Natural Science Found of China (41877003), “Twelfth Five-Year” National Science and Technology Support Program Project (2015BAD23B0202), Postdoctoral Study Fund of Shandong Agricultural University (010-76562) and the Youth Science & Technology Innovation Fund of Shandong Agricultural University (010-24150). The funders have had no role in study design, data collection and analysis, decision to publish, or preparation of the manuscript. The authors would like to thank the students who assisted in the study: Xiaoqian Zhang, Jingjing Zhou, Dan Li, Yukai Wei, Jianqing Zhang, Shuling Yin, Linxuan Wang, Ying Liu, Chaoling Chen, Ning Wang, Xiulei Xia, Huiwen Luo, Penghui Zhang, Shukun Xing, Jiacheng Zhang, Meimei Hu, Binglan Ding, Yunhui Yang, Mei Liu, Shanshan Zong, Siyuan Feng, Yanan Wei, Zhenjuan Wang, Xin Tian, Yu Liu, Zilong Qi, and Wenping Li (in no particular order).
Conflicts of Interest
The authors declare no conflict of interest.
References
- Eduard, F. The Care of Trees in Lawn, Street, and Park. Inorg. Chem. 1910, 53, 3668–3677. [Google Scholar]
- Zhao, Q. The application of vertical greening in urban garden. Green Technol. 2014, 1, 51–53. [Google Scholar]
- Pitman, S.; Daniels, C.; Ely, M. Green infrastructure as life support: Urban nature and climate change. Trans. Royal Soc. South Aust. 2015, 139, 97–112. [Google Scholar] [CrossRef]
- Nowak, D.; Hoehn, R.; Crane, D. Oxygen production by urban trees in the United States. Arboric. Urban For. 2007, 33, 220–226. [Google Scholar]
- Li, J.; Zhang, H.; Zhuang, J.; Schwegler, B. Urban heat island mitigation and urban energy equilibrium through urban forest development. In Advanced Engineering and Technology II: Proceedings of the 2nd Annual Congress on Advanced Engineering and Technology (CAET 2015), Hong Kong, China, 4–5 April 2015; CRC Press: Hong Kong, China, 2015; p. 37. [Google Scholar]
- Onishi, A.; Cao, X.; Ito, T.; Shi, F. and Imura, H. Evaluating the potential for urban heat-island mitigation by greening parking lots. Urban For. Urban Green. 2010, 9, 323–332. [Google Scholar] [CrossRef]
- Camachocervantes, M.; Schondube, J.E.; Castillo, A.; MacGregor-Fors, I. How do people perceive urban trees? Assessing likes and dislikes in relation to the trees of a city. Urban Ecosyst. 2014, 17, 761–773. [Google Scholar] [CrossRef]
- Li, X.; Zhang, C.; Li, W.; Ricard, R.; Meng, Q.; Zhang, W. Assessing street-level urban greenery using Google Street View and a modified green view index. Urban For. Urban Green. 2015, 14, 675–685. [Google Scholar] [CrossRef]
- Bowler, D.E.; Buyung-Ali, L.; Knight, T.M.; Pullin, A.S. Urban greening to cool towns and cities: A systematic review of the empirical evidence. Landsc. Urban Plan. 2010, 97, 147–155. [Google Scholar] [CrossRef]
- De Vries, S.; van Dillen, S.M.; Groenewegen, P.P.; Spreeuwenberg, P. Streetscape greenery and health: Stress, social cohesion and physical activity as mediators. Soc. Sci. Med. 2013, 94, 26–33. [Google Scholar] [CrossRef]
- Ulrich, R. View through a window may influence recovery from surgery. Science 1984, 224, 420–421. [Google Scholar] [CrossRef]
- Downs, R.; Stea, D.; Meining, D. Maps in Minds: Reflections on Cognitive Mapping; Geographical Association: New York, NY, USA, 1977. [Google Scholar]
- Klemm, W.; Heusinkveld, B.; Lenzholzer, S.; van Hove, B. Street greenery and its physical and psychological impact on thermal comfort. Landsc. Urban Plan. 2015, 138, 87–98. [Google Scholar] [CrossRef]
- Aoki, Y.; Yasuoka, Y.; Naito, M. Assessing the impression of street-side greenery. Landscape Research 1985, 10, 9–13. [Google Scholar] [CrossRef]
- Van Dillen, S.M.; de Vries, S.; Groenewegen, P.; Spreeuwenberg, P. Greenspace in urban neighborhoods and residents’ health: Adding quality to quantity. J. Epidemiol. Community Health 2012, 66, e8. [Google Scholar] [CrossRef] [PubMed]
- Di, S.; Li, Z.L.; Tang, R.; Pan, X.; Liu, H.; Niu, Y. Urban green space classification and water consumption analysis with remote-sensing technology: A case study in Beijing, China. Int. J. Remote Sens. 2018, 1–21. [Google Scholar] [CrossRef]
- Yang, C.B.; He, X.Y.; Wang, R.H. The Effect of Urban Green Spaces on the Urban Thermal Environment and Its Seasonal Variations. Forests 2017, 8, 153. [Google Scholar] [CrossRef]
- Yang, J.; Zhao, L.S.; Mcbride, J.; Gong, P. Can you see green? Assessing the visibility of urban forests in cities. Landsc. Urban Plan. 2009, 91, 97–104. [Google Scholar] [CrossRef]
- Asgarzadeh, M.; Lusk, A.; Koga, T.; Hirate, K. Measuring oppressiveness of streetscapes. Landsc. Urban Plan. 2012, 107, 1–11. [Google Scholar] [CrossRef]
- Baidu. Available online: http://lbsyun.baidu.com (accessed on 1 January 2000).
- Rui, B. The application analysis of Baidu Big Data. Bus. Manag. 2015, 2, 114–116. [Google Scholar]
- Zhu, H. Combined with 3D Shooting and Display Smart Phone Mobile Ordering System; Central China Normal University: Wuhan, China, 2016. [Google Scholar]
- Tuo, X.; Wang, J.; Wen, Q. Research on Commercial Space Distribution Characteristics and Optimization of Yinchuan Based on Baidu Map. J. Ningxia Univ. 2016, 37, 94–98. [Google Scholar]
- Wang, K.; Ye, X. Study on Shanghai Residents’ Outdoor Activities and Travel Mode—Based on Network Survey Data. In China Urban Transport Planning Annual Conference; The National Academies of Sciences, Engineering, and Medicine: Washington, DC, USA, 2017. [Google Scholar]
- Song, J.; Fan, X.; Qin, H.; Yu, M. The Evaluation on Green Space by Roadside of Wangmu Pool in Tai’an. J. Shandong Agric. Univ. 2017, 3, 341–345. [Google Scholar]
- Song, X.; Lang, X. Recreation and Planning of Rural Green Spaces in Tai’an under the Viewpoint of Urban-rural Coordination. Mod. Landsc. Archit. 2015, 9, 686–690. [Google Scholar]
- Zhang, Y. Study on the Design for Greenway in Tai’an City; Shandong Agricultural University: Tai’an, China, 2017. [Google Scholar]
- BSV URL example. Available online: http://api.map.baidu.com/pano/?ac=1andiec=0andshowCatalog=1andindoorSceneSwitchControl=0andh=0andp=0andpid=09017100011606091623298774Bandak=KGfqGXwvqL7uhfHElo2GnFFSuDg4OU0Y (accessed on 15 September 2017).
- BSV static image example. Available online: http://api.map.baidu.com/panorama/v2?andwidth=512andheight=256andlocation=117.095196,36.203035andak=KGfqGXwvqL7uhfHElo2GnFFSuDg4OU0Y (accessed on 15 September 2017).
- Feng, T.; Brandt, M.; Liu, Y.Y.; Verger, A.; Tagesson, T.; Diouf, A.A.; Rasmussen, K.; Mbow, C.; Wang, Y.; Fensholt, R. Remote sensing of vegetation dynamics in drylands: Evaluating vegetation optical depth (VOD) using AVHRR NDVI and in situ, green biomass data over West African Sahel. Remote Sens. Environ. 2016, 177, 265–276. [Google Scholar]
- Motohka, T.; Nasahara, K.; Oguma, H.; Tsuchida, S. Applicability of green-red vegetation index for remote sensing of vegetation phenology. Remote Sens. 2010, 2, 2369–2387. [Google Scholar] [CrossRef]
- Vapnik, V. The Nature of Statistical Learning Theory; Springer: Berlin, Germany, 1995; Volume 8, pp. 133–137. [Google Scholar]
- Lillesand, T.; Kiefer, R. Remote Sensing and Image Interpretation; Wiley: New Jersey, NJ, USA, 2008; pp. 3035–3038. [Google Scholar]
- Adler, J.; Parmryd, I. Quantifying colocalization by correlation: The Pearson correlation coefficient is superior to the Mander’s overlap coefficient. Cytom. Part A 2010, 77, 733–742. [Google Scholar] [CrossRef] [PubMed]


© 2018 by the authors. Licensee MDPI, Basel, Switzerland. This article is an open access article distributed under the terms and conditions of the Creative Commons Attribution (CC BY) license (http://creativecommons.org/licenses/by/4.0/).