Abstract
This paper presents TVAE-SSL, a novel semi-supervised learning (SSL) paradigm that involves Tabular Variational Autoencoder (TVAE)-sampled synthetic data injection into the training process to enhance model performance under low-label data conditions in Educational Data Mining tasks. The algorithm begins with training a TVAE on the given labeled data to generate imitative synthetic samples of the underlying data distribution. These synthesized samples are treated as additional unlabeled data and combined with the original unlabeled ones in order to form an augmented training pool. A standard SSL algorithm (e.g., Self-Training) is trained using a base classifier (e.g., Random Forest) on the combined dataset. By expanding the pool of unlabeled samples with realistic synthetic data, TVAE-SSL improves training sample quantity and diversity without introducing label noise. Large-scale experiments on a variety of datasets demonstrate that TVAE-SSL can outperform baseline supervised models in the full labeled dataset in terms of accuracy, F1-score and fairness metrics. Our results demonstrate the capacity of generative augmentation to enhance the effectiveness of semi-supervised learning for tabular data.
1. Introduction
One of the most significant advancements in the field of education over the past two decades has been the integration of emerging technologies. Today, Information and Communication Technologies play a vital role in the educational process, providing both educators and learners with a wide range of interactive learning environments that support instruction and promote educational quality [1]. Consequently, substantial volumes of data are continuously generated and stored in institutional databases and information systems, reflecting students’ learning behaviors, online activities, and academic achievements.
The growing need to analyze various types of educational data and extract meaningful insights has led to the emergence of Educational Data Mining (EDM), which is recognized as a rapidly evolving research domain [2]. EDM primarily focuses on the development and application of data mining techniques to educational data derived from diverse learning environments [3]. Its overarching goal is to address key educational challenges, ultimately aiming to enhance the learning process and improve the overall quality of education [4]. One of the most widely studied applications of EDM is prediction, which involves building a machine learning (ML) model by training a supervised algorithm on a labeled dataset, and subsequently applying it to predict unknown or future outcomes of students [5].
Unfortunately, in many practical scenarios, obtaining a sufficient amount of labeled training data is difficult due to the high cost of data labeling. This challenge has led to the emergence of novel machine learning approaches such as Semi-Supervised Learning (SSL) [6]. SSL represents a core branch of Weakly Supervised Learning, aiming to leverage a small set of labeled examples in combination with a large set of unlabeled ones to build highly accurate and robust predictive ML models [7]. A variety of methodologies grounded in the core principles of SSL have been developed and successfully applied across a wide range of domains, including web mining, text mining, image processing, information retrieval, and bioinformatics [8].
In recent years, a growing body of research has explored the effectiveness of SSL methods in the field of education, primarily for predictive tasks. Consequently, numerous studies have reported highly promising results, often outperforming traditional supervised learning approaches [9]. SSL algorithms enable the development of highly accurate early-warning models for the timely identification of students at risk of academic failure. This facilitates the implementation of targeted support measures and specialized intervention strategies aimed at enhancing the learning outcomes of underperforming students [10].
While educational data offer immense research and pedagogical potential, acquiring them is frequently hampered by high costs and time-consuming procedures. Moreover, stringent privacy regulations impose legal barriers that limit access to raw student records, complicate cross-institutional sharing, and require strict oversight of personally identifiable information. Furthermore, existing ethical frameworks exhibit concerns and gaps that limit their effectiveness in guiding the ethical development and implementation of educational data initiatives [11]. These privacy and legal considerations, when combined with limited technical expertise and budget constraints, result in under-collected, biased, and/or incomplete educational datasets that decrease their utility for robust machine learning.
Synthetic data generation and augmentation methods have emerged as practical alternatives to compensate for limited real-world educational data. Unlike expensive and laborious data collection processes, synthetic data can be generated easily and rapidly at scale while maintaining statistical fidelity to the original distributions, enabling researchers to explore varied hypothetical scenarios, balance underrepresented student groups, and simulate events that are rarely captured in real datasets.
The primary contribution of this research is TVAE-SSL, a novel framework that combines generative modeling and SSL to improve predictive performance and fairness under low-label settings. Unlike traditional SSL methods that are solely based on accessible unlabeled data, TVAE-SSL intentionally incorporates high-quality synthetic samples drawn from the limited labeled set, generated by a Tabular Variational Autoencoder (TVAE), into the unlabeled set. This approach enriches the data with diversity without adding label noise and enables stronger learning. The framework is also modular and independent of SSL algorithm selection and base classifier choice. We show via large-scale experiments that TVAE-SSL not only boosts typical performance measures such as accuracy and F1-score but also enhances fairness measures such as demographic parity and equalized odds—demonstrating its ability to build fair and resilient models from small labeled datasets.
The rest of the paper is organized as follows: Section 2 provides an overview of recent applications of SSL methods within the educational domain, with particular emphasis on synthetic data generation techniques and fairness considerations in the field of EDM. Section 3 defines the research methodology, while Section 4 describes the experimental framework. Section 5 presents the experimental results, while Section 6 provides a detailed discussion of these results, emphasizing the key findings and their implications. Finally, Section 7 concludes the research outcomes and suggests future research directions.
2. Related Work
A plethora of studies have been conducted to address prediction tasks within the field of EDM. These tasks primarily involve predicting student performance, dropout, grade level, and final grade [12]. Accurate predictions of student outcomes can enable educators and tutors to offer timely interventions for underperforming students, thereby reducing the risk of academic failure and enhancing the overall quality of education [10].
2.1. Overview of Semi-Supervised Learning in EDM
Student performance prediction is a central focus in the field of EDM. Typically, this involves two main aspects: predicting whether a student will pass or fail a unit or course, and classifying students into multiple categories based on their grade level.
The effectiveness of various SSL algorithms was investigated in [13] for predicting student performance in the final examination of a one-year distance learning course. Several SSL algorithms were applied using four classifiers as base learners: the Naïve Bayes (NB) classifier, the C4.5 decision tree, the k-nearest neighbors (k-NN) algorithm, and the Sequential Minimal Optimization (SMO) algorithm. The results demonstrated that SSL algorithms were notably effective in the early prediction of low-performing students. Among the methods evaluated, Tri-Training using three C4.5 decision trees as base classifiers, each configured with different parameters to ensure diversity, outperformed not only the other SSL algorithms but also the supervised C4.5 classifier. A co-training method was developed in [9] for the early prediction of student performance in distance higher education, leveraging two distinct and independent feature views: academic achievement data and activity in the Learning Management System. A plethora of experiments was conducted to evaluate the effectiveness of the proposed method in comparison with various Self-Training and co-training variants across three scenarios, each based on a different ratio of labeled data within the training set: 2.5%, 10%, and 15%. The proposed method consistently outperformed all other SSL algorithms as well as several supervised classification algorithms in terms of accuracy and F1-score, regardless of the labeled ratio and the base learner used.
Various SSL algorithms were applied in [14] to predict the grade level (Poor, Good, Very Good, Excellent) of high school students in the final examinations of the mathematics module at the end of the academic year. The experimental results demonstrated that Self-Training, Tri-Training, and co-training, utilizing the Naïve Bayes (NB) algorithm as the base classifier, achieved superior performance, with accuracy ranging from 64.41% to 67.35% by the midpoint of the academic year.
Student dropout remains a significant concern in education, particularly in distance learning environments such as MOOCs. The effectiveness of the SSL approach was investigated in [15] for predicting students at risk of dropping out in a distance higher education course. A series of experiments were conducted, dividing the academic year into three consecutive time periods, and employing various semi-supervised classification algorithms. The experimental results indicated that Tri-Training and Self-Training achieved superior performance, with accuracy ranging from 71.74% to 76.73% prior to the midpoint of the academic year, thereby supporting the implementation of timely intervention measures. A multi-view SSL model based on behavioral features of students was introduced in [16] for predicting student dropout in a MOOC. To this end, data reflecting different types of learning behavior of students were collected and used to form multiple views of behavioral features. Experiments on the KDD Cup 2015 dataset demonstrated that the proposed method outperformed established supervised methods.
Grade prediction represents another important task in EDM. This task is typically approached using regression algorithms, as the target variable is continuous. An ensemble-based algorithm, termed the Multi-Scheme Semi-Supervised Regression (SSR) approach, was introduced in [17] for predicting undergraduate students’ final examination grades in a one-year distance learning course. Three k-NN regressors were employed within a Self-Training framework to iteratively expand the labeled dataset by leveraging unlabeled data. Subsequently, a Random Forest (RF) regressor was utilized to build the regression model. The proposed method outperformed conventional regression methods in terms of four metrics: Mean Absolute Error, Relative Absolute Error, Root Mean Squared Error and Pearson Correlation Coefficient. A multi-view SSR algorithm was implemented in [18] to predict the final examination grades of undergraduate students enrolled in a one-year distance learning course. The prediction was conducted at two distinct time points prior to the midpoint of the academic year. Additionally, the study investigated the influence of input attributes on the target one, generating a range of interpretable visualizations that illustrate their impact on the output of the ML model. The experimental results revealed that the highest-performing students were those who achieved high grades in the two compulsory written assignments completed during the first semester.
A comprehensive review of the applications of SSL in the fields of EDM and Learning Analytics is presented in [10].
2.2. Synthetic Data Generation
The quality of training data significantly influences the efficiency of ML classification models. Poor data quality leads to models with low accuracy, which may result in incorrect predictions. Moreover, in many practical scenarios, obtaining a sufficient amount of labeled training data is difficult due to the high cost of data labeling. Furthermore, the dissemination of data is frequently constrained by privacy and fairness considerations across many domains, such as education [19]. In light of these concerns, synthetic data generation emerges as a compelling alternative, facilitating secure data sharing and application beyond the limitations of real-world datasets.
Concerning the educational field, synthetic data offers a plethora of advantages, such as the following:
- (1)
- Enhanced Privacy ProtectionSynthetic data eliminates the risk of exposing sensitive student information, ensuring compliance with data protection regulations [20].
- (2)
- Mitigation of Data ScarcityMany educational datasets suffer from limited sample sizes. Synthetic data can augment datasets, improving model generalizability [21].
- (3)
- Bias reduction and Fairness ImprovementReal-world educational data often reflects systemic biases. Synthetic data can be strategically generated to balance underrepresented classes, leading to fairer predictive models [22].
- (4)
- Controlled Experimentation and Scenario TestingResearchers can simulate hypothetical educational scenarios to test predictive models without needing real-world trials [23].
- (5)
- Accelerated Research and Open CollaborationSynthetic datasets can be shared freely among researchers, enabling reproducibility and collaboration without legal or ethical restrictions [24].
- (6)
- Robustness against OverfittingBy introducing controlled variations, synthetic data can help train models that generalize better to unseen real-world data, reducing overfitting risks [25].
- (7)
- Cost and Time EfficiencyCollecting real educational data is often time-consuming and expensive. Synthetic data generation provides a scalable alternative [26].
2.3. Fairness Considerations in EDM
ML fairness is an emerging area that studies how to ensure that the outputs of a model do not depend on sensitive attributes in a way that is considered unfair. For example, in a model that predicts student performance based on previous school records, this could mean ensuring that the decisions do not depend on gender. However, as EDM systems become more integrated into decision-making processes, concerns regarding fairness and equity have intensified. Fairness in EDM refers to the absence of bias and discrimination in data collection, algorithmic processing, and interpretation, particularly concerning sensitive attributes such as race, gender, socio-economic status, and disability [27].
A major challenge in ensuring fairness arises from historical biases embedded in educational datasets. These biases can be inadvertently perpetuated or amplified by ML models, leading to unfair outcomes such as unequal access to resources or incorrect at-risk predictions [28]. For example, predictive models trained on imbalanced data may overidentify students from marginalized groups as underperforming, triggering disproportionate interventions or stigmatization. Hence, rigorous bias detection and mitigation strategies, such as fairness-aware learning algorithms or preprocessing techniques, are essential in EDM [22]. Furthermore, fairness is context-dependent and multidimensional. It is not only a technical issue but also an ethical and social one. For instance, ensuring fairness might involve balancing multiple trade-offs between accuracy and equity or between group fairness and individual fairness [29]. Stakeholder engagement, including input from educators, students, and policymakers, is critical to defining what constitutes fairness in a given educational context and to guiding the design of just and inclusive systems.
While prior work has extensively explored SSL methods and fairness-aware machine learning separately, few prior studies exist that thoroughly consider the combination of generative data augmentation with SSL for addressing accuracy and fairness simultaneously in low-label scenarios. Most SSL methods were assumed to receive relatively balanced or clean labeled datasets as input and therefore limited their robustness when they actually encountered real-world scenarios where the labeled datasets are scarce and possibly biased. Similarly, generative models have been applied to synthetic data generation but with performance improvement as the primary focus and fairness as a secondary concern. The novel TVAE-SSL model bridges the gap by leveraging Tabular Variational Autoencoders (TVAEs) to generate realistic synthetic samples whose adoption not only improves classification performance but also encompasses a method of fairness control and measurement. By combining these two research streams, our solution offers a different perspective regarding how synthetic data generation can help SSL address both predictive accuracy and fairness, thereby addressing an essential gap in the existing literature.
3. Research Methodology
This section provides a detailed description of the datasets used, the synthetic data generation process, and the SSL algorithms employed, along with the performance and fairness metrics considered.
3.1. Datasets
The experimental procedure utilizes four (4) classification datasets from the field of EDM. The key characteristics of these datasets are summarized in Table 1, including the number of instances, the number of attributes, the sensitive attributes, the number of output classes, and the corresponding prediction task.

Table 1.
Dataset structure.
In the datasets under consideration, the majority employ gender as the sensitive attribute, with the exception of the cert dataset, where the sensitive feature is employment status. This distinction highlights the relevance of different demographic and socio-economic factors in fairness-aware machine learning applications. In the case of gender, the female group is regarded as the protected class, reflecting the need to ensure that predictive outcomes do not disadvantage women in educational or admission-related tasks. Conversely, for the cert dataset, individuals categorized as not employed constitute the protected group, since their employment status could introduce bias in certification predictions. The analysis ensures that fairness interventions can be appropriately targeted to mitigate discrimination in each predictive setting.
The first two datasets pertain to students enrolled in the twelve-course “Computer Science” module offered by the Hellenic Open University. Each course module, such as “Introduction to Informatics”, requires the submission of four written assignments, attendance at five optional contact sessions, and participation in a final examination. To successfully complete the course, students are required to submit a minimum of three written assignments with an average grade of at least five on a ten-point scale, and to achieve a minimum score of five in the final examination.
The first dataset comprises 344 instances described by twelve attributes (Table 2). The first seven attributes pertain to students’ demographic characteristics and general employment information, namely gender, age, marital status, number of children, employment status, computer knowledge, and job correlation with computer skill requirements. Several studies have demonstrated that these factors significantly influence student success in distance learning environments [30,31]. The next four attributes capture students’ performance on the first two written assignments , and their attendance in the first two optional contact sessions with their tutor , . These attributes become available progressively throughout the academic year. Attendance at contact sessions is recorded as binary values, with 1 indicating presence and 0 indicating absence. Assignment grades range from −1 to 10, where −1 indicates non-submission. The target attribute indicates whether a student dropped out of the course.
Table 2.
Description of the 1st dataset.
The second dataset comprises 445 instances described by six attributes (Table 3). The first attribute corresponds to the students’ gender, while the next four attributes capture students’ performance on the first four written assignments , , , . Assignment grades range from −1 to 10, where −1 indicates non-submission. The target attribute indicates course completion status as either pass or fail.
Table 3.
Description of the 2nd dataset.
The third dataset comprises data (Table 4) from a 11-week MOOC course in the context of the Erasmus+ Sector Skills Alliance project called “DevOps Competences for Smart Cities” [32]. The course was organized into 15 modules, with 1–2 modules released weekly. Each module contained 2–5 discrete learning units, and every learning unit concluded with an automatically graded multiple-choice quiz for assessment. The dataset consists of eleven attributes capturing various aspects of students’ personal information, ten attributes about students’ grades in quizzes (100-point scale) during the first two weeks of the course and overall grades in modules 1 and 2, and twelve numerical attributes concerning students’ activity in the online learning platform, such as number of views, posts, discussions and connections, as well as the total time devoted to the first two modules of the course. The target attribute specifies whether a student successfully obtained a certificate upon completion of the course.
Table 4.
Description of the 3rd dataset.
The fourth dataset was sourced from the Kaggle platform and pertains to students enrolled in the Wharton School’s Class of 2025 statistics course. It comprises 6194 instances described by nine attributes (Table 5). Six attributes represent the demographic characteristics of the applicants. In addition, one attribute captures the applicant’s Grade Point Average (GPA), and another attribute records their Graduate Management Admission Test (GMAT) score. The target attribute indicates the outcome of the admission process.
Table 5.
Description of the 4th dataset.
3.2. SSL Methods
The experimental process involved the application of several self-labeling methods proposed in the literature, which have been successfully employed in the educational domain to address a variety of prediction tasks [10].
Self-Training [33] is an iterative method used to assign labels to unlabeled data and is commonly regarded as a reference approach in the field of SSL. According to this method, a base classifier is initially trained on a small set of labeled examples (L). The trained model is then used to predict labels for the unlabeled instances and the most confidently predicted samples are added to the labeled set for subsequent retraining. This process is repeated iteratively until a convergence criterion is met or no further improvement is observed.
SetRed (Self-Training with Editing) is an SSL algorithm designed to improve the robustness of Self-Training by incorporating a noise-reduction mechanism that filters out unreliable pseudo-labels [34]. Unlike traditional Self-Training methods, which risk reinforcing errors by adding misclassified unlabeled instances to the training set, SetRed introduces an editing step to selectively remove mislabeled examples before retraining. This editing phase typically uses techniques such as k-nearest neighbors (k-NN) to assess the consistency of each pseudo-labeled instance with its local neighborhood, retaining only those that align with the majority of their neighbors. By doing so, SetRed reduces the propagation of labeling noise, leading to more accurate and stable classifiers. This makes it particularly useful in real-world applications like EDM, where labeled data may be limited and class distributions are often imbalanced or noisy.
Co-training is based on the assumption that each example in a dataset can be represented by two distinct and conditionally independent sets of attributes, referred to as views [35]. Two classifiers are trained separately on each view using a small set of labeled examples (L) and the most confident predictions of each classifier on the set of unlabeled examples (U) augment the training set of the other until some stopping criterion is met. Co-training is a characteristic paradigm of disagreement-based SSL methods [36].
Co-Forest (Co-training Random Forest) is a semi-supervised ensemble algorithm that extends the traditional Random Forest by incorporating the co-training paradigm to leverage both labeled and unlabeled data for improved classification performance [37]. Co-Forest trains multiple decision tree learners on different data subsets, allowing each learner to iteratively label and augment the training set of the others with high-confidence predictions from unlabeled instances. This collaboration enhances generalization, especially when labeled data are scarce, a common scenario in EDM. The algorithm preserves the diversity and robustness benefits of RF while exploiting the complementary information present in multiple learners to reduce error rates.
Co-training by Committee (CoBC) is another SSL algorithm that combines the principles of co-training and ensemble learning to improve classification performance using both labeled and unlabeled data [38]. CoBC employs a committee of diverse classifiers trained on randomly sampled subsets of the feature space and labeled data. During the iterative training process, each classifier predicts labels for a portion of the unlabeled data, and only high-confidence predictions that achieve consensus among the committee members are added to the labeled set. This collaborative strategy minimizes the propagation of errors common in self-labeling methods while enhancing model robustness through ensemble diversity.
Two multi-view methods that leverage the advantages of random subspace techniques and ensemble learning are Rasco and Rel-Rasco. Rasco (Random Subspace for Co-training) [39] is an extension of the co-training algorithm that operates on multiple randomly generated subspaces of the features. These subspaces can be interpreted as distinct views of the feature space. Separate classifiers are each trained on a small set of labeled examples within each subspace, and their predictions on an unlabeled instance are aggregated to determine its label. In this manner, the classifiers complement one another by identifying different patterns within the dataset, based on the assumption that they are typically sensitive to distinct subsets of features. The labeled subsets are incrementally augmented, and the classifiers are re-trained through an iterative learning process. Rel-Rasco (Relevant Random Subspace Co-training) [40] is an improved variant of Rasco. Instead of relying on random subspace generation, this approach systematically constructs feature subspaces by leveraging relevance scores, computed through the mutual information between each feature and the class labels.
Tri-Training is a widely used single-view multiple-classifier SSL method [41]. It employs three classifiers in an iterative learning process to label the unlabeled data. Specifically, if the two classifiers agree on the label of an unlabeled example, that example is then labeled by the third classifier and incorporated into the labeled dataset (L).
In addition, three widely recognized ensemble algorithms, namely Random Forests (RFs), Extreme Gradient Boosting (XGB) and Histogram-based Gradient Boosting (HGB), were chosen as base classifiers due to their established effectiveness and frequent use in SSL research studies:
- (1)
- RF is a well-known bagging tree-based method [42]. It relies on bootstrap aggregation (bagging) to construct random ensembles of decision trees, while a voting strategy is employed to predict the class label for new data.
- (2)
- XGB [43] is a highly efficient and fast-to-execute classification algorithm, a representative paradigm of gradient tree boosting, commonly referred to as gradient boosting.
- (3)
- HGB [44] is another high-performance gradient boosting algorithm. In contrast to RF, where tree models are trained in parallel, HGB builds and adds trees sequentially by discretizing continuous feature values to binary for constructing feature histograms during the training phase.
3.3. Performance Measures
The performance of the SSL methods was evaluated in terms of accuracy and F1-score results. Accuracy measures the effectiveness of a classifier in correctly predicting the label of a previously unseen instance. The F1-score is a widely adopted metric for evaluating the performance of binary and multiclass classifiers, especially in scenarios involving imbalanced datasets [44]. It is the harmonic mean of precision (p) and recall (r).
In addition, two fairness metrics, which are commonly recognized as prevalent threshold-dependent measures in the relevant literature, were employed. Demographic Parity Difference (DPdiff) is a group fairness metric that quantifies the degree to which the outcomes of a predictive model are independent of a sensitive attribute, such as gender, race, or socio-economic status. Formally, it measures the absolute difference in the probability of receiving a positive outcome between groups defined by the sensitive attribute [45]. Equalized Odds Difference (EOdiff) is a group fairness metric that assesses whether a predictive model achieves equal error rates across groups defined by a sensitive attribute, such as gender and race [46]. Specifically, it requires that the model’s true positive rate (TPR) and false positive rate (FPR) be the same across all groups and is defined as the average of the absolute differences in TPR and FPR between groups [47].
4. Experimental Framework
In the current body of research on predictive modeling within the field of EDM, the evaluation of SSL algorithms is commonly conducted using datasets derived from existing labeled data. This is typically achieved by removing the class labels from a subset of an existing labeled dataset (D), thus creating a subset of unlabeled data (U) and a subset of labeled data (L), such that U ∪ D = L. The proportion of labeled data (L) to the original data (D) is referred to as the labeled ratio (r).
4.1. Implementation of TVAE for Synthetic Data Generation
TVAE is a deep generative model that is particularly employed to create synthetic tabular data, typically including both continuous and categorical variables. Unlike standard variational autoencoders, TVAE has specific preprocessing procedures such as one-hot encoding for categorical variables and normalization for continuous variables to handle the mixed data types commonly encountered in tabular datasets. It learns a probabilistic latent representation of the data using an encoder, and samples are reconstructed using a decoder, with a loss function that trades off reconstruction quality against regularization of the latent space using the Kullback–Leibler divergence. Trained, TVAE can generate new synthetic data samples by sampling from the learned latent space, which is a valuable ingredient in data privacy, augmentation, and benchmarking in machine learning workflows.
TVAE is implemented as part of the open-source Synthetic Data Vault (SDV) library [47]. The SDV library’s TVAE is designed to generate synthetic tabular data from learning the target dataset’s latent representation. It follows an encoder–decoder architecture, where the encoder transforms input features into a lower-dimensional space and the decoder reconstructs data from the lower space. In this setup, latent embedding size is 128 and both compression and decompression networks have two hidden layers of 128 units. Regularization is taken care of by an L2 penalty of 0.00001 to prevent overfitting, and training proceeds with a batch size of 500 for 6 epochs. The model employs a loss factor of 2 for balancing reconstruction and regularization loss, and training is made to avail of GPU speedup if cuda = True. For maintaining data fidelity, the synthesizer imposes minimum–maximum value constraints on numerical features and rounding policies as needed. SingleTableMetadata is used to extract the metadata from the original dataset, with categorical and numerical features explicitly defined; e.g., the label column is treated as categorical. This structured metadata ensures the synthetic data respects the statistical characteristics and semantic meaning of the original table and facilitates TVAE in generating realistic and varied synthetic samples.
4.2. Description of the Proposed Algorithm
The preprocessing phase involves the normalization of continuous features and the transformation of categorical features using one-hot encoding. This step is critical for optimizing model performance and ensuring the stability of the training process.
Subsequently, the TVAE is trained on the labeled dataset, capturing the statistical distribution of the input data to later sample from it. The trained TVAE is employed to generate a synthetic dataset comprising N new labeled instances. To align with the SSL paradigm, the TVAE synthetic samples are treated as unlabeled by discarding their associated output labels. This transformation allows the synthetic data to augment the pool of unlabeled examples, thereby supporting the training of semi-supervised models without introducing label noise or bias. Next, the synthetic unlabeled dataset augments the original unlabeled dataset, and an SSL algorithm is trained for building a predictive model.
Algorithm 1 presents the pseudo-code of the proposed algorithm, while Figure 1 illustrates the overall workflow. Within each ratio, the evaluation proceeds as follows:
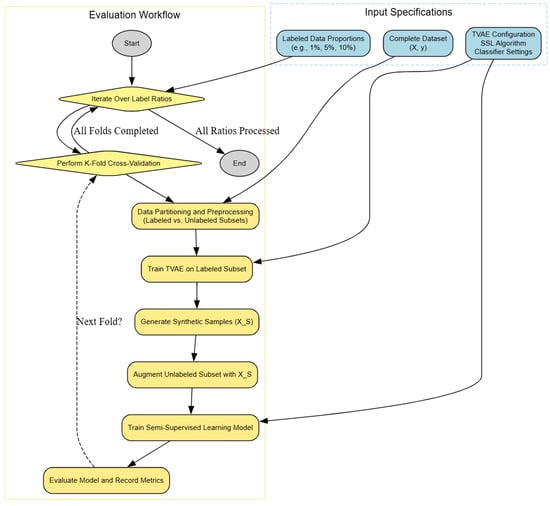
Figure 1.
Workflow of the proposed SSL framework with TVAE augmentation.
- For each labeled data proportion, the system enters an outer loop (Iterate Over Labeled Ratios).
- Within each ratio, (=10)-fold cross-validation is performed. The dataset is partitioned into labeled and unlabeled subsets and preprocessed.
- The TVAE model is trained on the labeled subset to learn a generative representation. Synthetic samples are generated from the trained TVAE. The unlabeled subset is augmented with the TVAE synthetic data.
- An SSL model is trained on the augmented dataset. The trained model is evaluated and performance metrics are recorded.
- The loop continues until all folds and all label ratios are processed.
| Algorithm 1: TVAE SSL. |
|
Input: LabeledData ← small labeled dataset UnlabeledData ← large unlabeled dataset TVAEParameters ← configuration parameters for the TVAE SSLAlgorithm ← SSL algorithm (e.g., Self-Training) Classifier ← base classifier (e.g., RandomForest) Output: FinalModel ← trained semi-supervised model
|
Our choice to synthesize artificial samples at half the dataset size was motivated by the need to balance augmentation and fidelity: synthesizing too many artificial samples relative to the real data risks overwhelming the SSL algorithms with lower-quality artificial data, while synthesizing too few has no appreciable effect on the training signal. The 50% ratio was therefore chosen as a compromise from early pilot experiments where larger ratios of synthetic data were not found to provide consistent improvements.
For training TVAE, we used a six-epoch setting. We did this for two reasons: (1) to prevent overfitting the generative model to small labeled subsets (especially in the lowest labeled ratio experiments), and (2) to keep computation feasible across a number of datasets, classifiers, and SSL methods. Interestingly, we observed empirically that training beyond six epochs did not yield a significant difference in downstream SSL performance, which suggested that even with relatively limited training the generated samples provided useful additional structure for the learners.
5. Results
This section presents the performance and fairness results obtained from the experimental process, along with a corresponding discussion and analysis.
The experimental results across the four datasets demonstrate the competitive performance of SSL techniques compared to the fully supervised baseline (RF). Accuracy results listed in Table 6 show several significant trends across datasets and labeled ratios. In general, semi-supervised approaches provide significant improvements over fully supervised baseline (RF), particularly when significantly less than half of the data are labeled (e.g., ratios of 0.01 and 0.05). For the cert dataset, Tri-Training and Setred always perform better than others with best performance, especially at the lowest ratio where Tri-Training achieves an accuracy of 0.8717. On the contrary, on eap2024, performance is relatively poor at a ratio of 0.01 but methods such as Rel-Rasco and CoBC show comparable gains with an increasing ratio, though CoBC does a slightly better job than others at a ratio of 0.3. The MBA dataset exhibits overall high and consistent accuracies for all semi-supervised methods, though CoBC and Self-Training showed the best consistent results, outperforming 0.83 even at very low ratios. On the harder student dataset, noticeable improvement in performance is observed when moving from 0.01 to higher ratios, and Rel-Rasco and CoBC are high performers at a ratio above 0.1, with accuracy measures over 0.85. The final Wins row also confirms these observations, where CoBC and Rel-Rasco dominate in the majority, followed by Self-Training and Rasco.
Table 6.
Accuracy results (RF). Bold values indicate the highest value per row.
The F1-score figures in Table 7 provide a closer look at the performance of the models than accuracy, particularly in alleviating class imbalance. In the cert dataset, ensemble methods such as Tri-Training and Setred achieve top performance with the lowest ratio (0.01) F1-scores, whereas the performance is stabilized above 0.90 in nearly all the methods when more labeled data is available (≥0.05). In the eap2024 dataset, performances are worse for very low ratios, but Rasco and Rel-Rasco stand out, consistently outperforming other approaches, especially for the ratios 0.1 and 0.2, where they reach above 0.76. The MBA dataset shows an interesting contrast between accuracy and F1-scores: whereas accuracy was high and stable, F1-scores were generally low (ranging from 0.31–0.41), reflecting extreme class imbalance, with Rasco and Rel-Rasco again achieving the highest values. On the student dataset, improvements are most marked as the ratio increases, with Rel-Rasco achieving the highest overall F1-scores above 0.83 at 0.2 and 0.3, with other ensemble methods like Tri-Training and CoBC also faring well. The Wins row corroborates this trend, with Rel-Rasco (6) and Rasco (5) well ahead by a large margin across datasets, indicating their stability in balancing precision and recall. These results highlight that while accuracy may reflect overall good performance, F1-scores reveal the merits of Rasco-based methods in being able to deal successfully with imbalanced or noisy scenarios.
Table 7.
F1-Score results (RF). Bold values indicate the highest value per row.
The Demographic Parity Difference (DPD) values in Table 8 put the focus on vast discrepancies among datasets, methods, and labeled ratios. Lower DPD values are usually desirable because they represent more balanced models with less discrepancy in sensitive classes. In the cert dataset, all semi-supervised methods produce relatively low and similar values (mostly less than 0.10), while Co-Forest and CoBC tend to be closest to the lowest disparities, especially at smaller ratios. On the other hand, the eap2024 data shows higher variability, where methods such as Rel-Rasco yield much higher DPD (e.g., 0.2149 at the ratio 0.01), reflecting fairness problems, while Co-Forest and CoBC show smaller discrepancies. For MBA, values are all low across methods, where again Co-Forest and CoBC yield virtually zero values at small ratios, which is strong support for fairness robustness. The student set, however, exhibits much larger differences overall, with several methods (e.g., Setred, Co-Training) providing values above 0.20, whereas Self-Training sometimes provides very low DPD (even 0.0000 at the ratio 0.01), although not all the time. The last row win numbers confirm this pattern, where Self-Training is the overall winner most of the time (eight wins), followed by Co-Forest (four wins) and CoBC (three wins). Such results show that fairness performance is highly dataset-sensitive, with Self-Training being one of the best overall performers in minimizing demographic disparity, while some ensemble methods can achieve competitive performance for specific settings.
Table 8.
Demographic Parity Difference results (RF). Bold values indicate the lowest value per row.
The Equalized Odds Difference (EOD) values in Table 9 indicate that fairness disparities are extremely dataset-specific and typically larger than those of Demographic Parity. For the cert dataset, a majority of algorithms exhibit relatively small disparities (frequently smaller than 0.12), with Rasco, Tri-Training, and Co-Training frequently possessing the smallest ones, especially at low labeled ratios. On the other hand, the eap2024 dataset shows the largest disparities uniformly across methods with values often above 0.20–0.30, indicating that it is significantly more difficult to enforce fairness in the Equalized Odds sense in this setting. The MBA dataset produces the best outcome, where Self-Training, Co-Forest, and CoBC show very small disparities (almost zero for low ratios), which is indicative of their capability to enforce fairness. The student set, however, demonstrates the strongest challenges, where high imbalances in almost all methods (typically above 0.25–0.35) reflect difficulty in balancing false positive and false negative rates among groups. The win counts reflect this pattern: Self-Training takes the top with eight wins, with Co-Training and CoBC each tied with three wins. This means that although there is no method guaranteeing low disparities on every dataset, Self-Training always produces more balanced outcomes under Equalized Odds, though its efficiency might vary significantly depending on the data complexity.
Table 9.
Equalized Odds Difference results (RF). Bold values indicate the lowest value per row.
As shown in Figure 2, certain semi-supervised methods outperform others when Random Forest is used as the base classifier, indicating differences in their adaptability to the datasets.
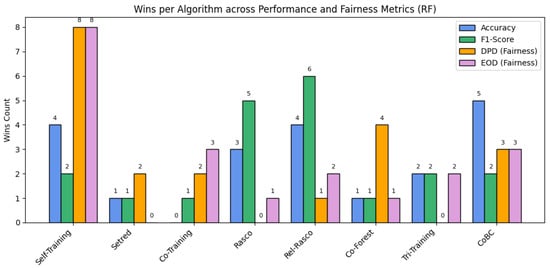
Figure 2.
Summary of performance across SSL algorithms using RF as the base classifier.
Similarly, the experimental results across the four datasets demonstrate the competitive performance of SSL techniques compared to the fully supervised baseline (HGB).
The accuracy results in Table 10 reveal several interesting trends for the performance of different SSL methods on the four datasets and varying labeled ratios. For the cert dataset, the majority of the methods display a clear improvement with the increasing labeled ratio, with Rel-Rasco and CoBC always performing best at small ratios, and the performance of methods converges with more available labeled instances. In comparison, the eap2024 dataset is more challenging to work with, with all techniques achieving only baseline-level accuracy at 0.01 and 0.05 ratios but significant improvements at >0.1, where ensemble-based algorithms such as Rasco and Co-Forest become dominant. The MBA dataset is relatively consistent and shows high performance by all techniques even at very low labeled ratios, with CoBC being slightly better than the rest in most cases. Finally, in the student dataset, accuracies start quite low for low ratios but rapidly catch up, and Rel-Rasco and CoBC clearly outperform others with higher labeled ratios.
Table 10.
Accuracy results (HGB). Bold values indicate the highest value per row.
The F1-score results in Table 11 provide further insight into the performance of the SSL methods under different levels of labeled data availability. On the cert dataset, Rel-Rasco and Rasco achieve the highest scores, particularly at low labeled ratios, reflecting their effectiveness in situations where there is limited supervision. The more challenging eap2024 dataset exhibits extremely poor performance at the lowest ratios across all methods, with just those from 0.1 onwards registering discernible gains. Rasco and Rel-Rasco shine here again, with competitive F1-scores and superior performance at higher ratios compared to the rest. The MBA dataset, on the other hand, shows a different trend: F1-scores are generally low throughout all ratios, with only minor increases when increasing amounts of labeled data are added, indicating that this dataset is intrinsically harder for semi-supervised methods. The student dataset, lastly, exhibits a significant increase in F1-score for larger labeled ratios, where Rel-Rasco and CoBC convincingly lead, recording the highest values and proving themselves well adaptable to more informative labeled subsets. Overall, Rel-Rasco is the most consistent top performer across datasets, achieving the most wins, followed by Rasco and then CoBC, confirming the usefulness of ensemble-based solutions to semi-supervised learning.
Table 11.
F1-Score results (HGB). Bold values indicate the highest value per row.
The Demographic Parity Difference (DPD) values in Table 12 have high variation across datasets, methods, and labeled ratios. At extremely low ratios (0.01), all methods achieve perfect demographic parity (DPD = 0), particularly in the eap2024 and student datasets, whereas methods such as CoBC at times display minor deviations. As the labeled ratio increases, disparities generally grow, with student and eap2024 recording the highest DPD values (with most exceeding 0.15 at ratios (0.2)), indicating greater bias amplification in the low-supervision scenario. By contrast, the MBA dataset consistently shows relatively low DPD across methods (with most below 0.07), suggesting that fairness is less susceptible in this domain. Methodologically, Self-Training and Rel-Rasco tend to generate the lowest DPD scores, reflected in their highest number of wins, while ensemble-based approaches like Co-Training and Rasco sometimes bring in greater differences.
Table 12.
Demographic Parity Difference results (HGB). Bold values indicate the lowest value per row.
Equalized Odds Difference (EOD) measures in Table 13 reveal larger fairness problems than Demographic Parity Difference. At extremely low labeling rates (0.01 and 0.05), most techniques have almost perfect fairness (EOD = 0) for the eap2024 and student data, though some techniques (e.g., CoBC) already exhibit non-trivial differences. As the ratio increases, however, differences suddenly increase, especially in eap2024 and student, where many methods have over 0.25, indicating rather large differences across groups in false positive and false negative rates. The MBA dataset, in contrast, consistently reports lower EOD values (largely below 0.15), whereas cert has moderate differences between methods. From the viewpoint of method performance, Self-Training achieves the optimum count of wins, tending to register smaller differences across datasets, while ensemble methods such as Co-Training, Rasco, and Tri-Training tend to register larger values of EOD. Overall, these results suggest that ensuring fairness with respect to equalized odds is significantly more challenging compared to demographic parity, with both dataset type and choice of method playing crucial roles in the level of bias observed.
Table 13.
Equalized Odds Difference results (HGB). Bold values indicate the lowest value per row.
As shown in Figure 3, certain semi-supervised methods outperform others when HGB is used as the base classifier, indicating differences in their adaptability to the datasets.
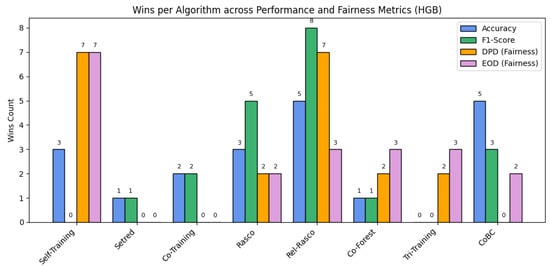
Figure 3.
Summary of performance across SSL algorithms using HGB as the base classifier.
Similarly, the experimental results across the four datasets demonstrate the competitive performance of SSL techniques compared to the fully supervised baseline (XGB).
The accuracy results in Table 14 indicate that performance varies significantly across datasets, labeled ratios, and semi-supervised methods. For very low ratios (0.01), accuracy is generally low, especially in eap2024 and student, where models remain close to random guessing, while cert and MBA have good baseline performance even with minimal supervision. As the ratio increases, there are substantial improvements on all datasets, with cert achieving the highest overall accuracies (well above 0.93 for several methods at ratios (≥0.1)), closely followed by MBA and student, with eap2024 consistently lagging behind. Method-wise, ensemble-based techniques such as Tri-Training and CoBC consistently achieve the best accuracy, as evident from their high wins count, whereas Self-Training and Setred have more variable benefits. Rasco and Rel-Rasco are competitive across a number of datasets, particularly for cert and student. These findings collectively imply that while semi-supervised learning can greatly boost predictive accuracy compared to very low-label regimes, relative improvements are dataset-dependent, and ensemble approaches will generally yield the highest accuracy.
Table 14.
Accuracy results (XGB). Bold values indicate the highest value per row.
The F1-score values in Table 15 provide a more even view of model performance, indicating precision–recall trade-off across datasets and labeling proportions. F1-scores in the cert dataset are strong at medium labeling proportions (≥0.1) where all approaches consistently rate > 0.90, with CoBC and Rasco often having the best result. At very low supervision (0.01), however, F1-scores drop dramatically (0.47–0.55), with no stable predictions. The eap2024 dataset gets better with the rising ratio, with values increasing from 0.34 at low labeling to 0.77–0.79 at rising ratios, with Rasco and Rel-Rasco being predominantly the top performers. MBA performance is comparatively low with F1-scores remaining at 0.37–0.43 even at rising ratios, suggesting that this dataset has slightly more difficulty in achieving balanced precision–recall performance. The student set shows one of the largest improvements, jumping from 0.34 at 0.01 to >0.82–0.85 at (≥0.1) ratios, with Rel-Rasco and CoBC faring best. Overall, ensemble methods (Rasco and Rel-Rasco specifically) are the most competitive across sets, with the most wins, while simpler methods such as Self-Training and Setred are more dataset dependent.
Table 15.
F1-Score results (XGB). Bold values indicate the highest value per row.
The Demographic Parality Difference (DPD) values in Table 16 indicate major trends regarding fairness between datasets, labeled ratios, and learning methods. For the cert dataset, the values are consistently low (0.01–0.11), indicating that all approaches make relatively balanced predictions within protected groups, whereas CoBC at times yields higher imbalances. In eap2024, fairness outcomes range extremely widely: no imbalance is observed at the lowest ratio (0.01), but values rise dramatically at higher ratios, usually far above 0.16, displaying rising bias with the addition of more labeled data. The MBA dataset shows the most uniform and weak disparities overall (0.02–0.07), suggesting low sensitivity to semi-supervised learning methods. On the other hand, the student dataset exhibits the most variability and the highest disparities, and values of DPD up to 0.23 at a ratio of 0.2 reflect more fairness problems. Method-wise, there is no single method that minimizes DPD for all datasets at once, though Co-Forest and Rasco show lower disparities in most cases, and sometimes CoBC and Co-Training bring in greater differences.
Table 16.
Demographic Parity Difference results (XGB). Bold values indicate the lowest value per row.
Equalized Odds Difference (EOD) figures in Table 17 reveal significant differences among datasets, suggesting that semi-supervised approaches can exaggerate or reduce fairness differences based on the properties of the data and labeling proportions. For cert data, EOD values are relatively small (0.05–0.14), and Co-Forest and Co-Training tend to produce lower differences, but variability increases with larger amounts of labeled data. In eap2024, the differences are small at 0.01 but increase rapidly with higher ratios, typically over 0.25–0.32, which implies that increased supervision can reinforce unfair treatment between groups; Rasco, Rel-Rasco, and Co-Training are likely to record the largest differences. The MBA dataset is more robust with values typically below 0.13 and less labeled ratio sensitivity, implying a relatively balanced group treatment across techniques. On the other hand, the student set displays the most challenging fairness profile: while no disparity exists for 0.01, it leaps to 0.25–0.37 at higher ratios, where Co-Training particularly reaches the peak disparities. From a methodological perspective, Self-Training and Rasco win the most (five for each), but none of the methods reduce EOD across all datasets uniformly.
Table 17.
Equalized Odds Difference results (XGB). Bold values indicate the lowest value per row.
As shown in Figure 4, certain semi-supervised methods outperform others when XGB is used as the base classifier, indicating differences in their adaptability to the datasets.
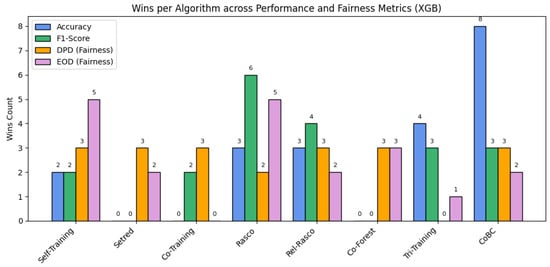
Figure 4.
Summary of performance across SSL algorithms using XGB as the base classifier.
6. Discussion
The experimental results on four diverse datasets demonstrate the competitive advantage of SSL methods over fully supervised baselines, particularly in low-label regimes. Comparisons of accuracy and F1-score consistently demonstrate that methods like CoBC, Rasco, and Rel-Rasco are superior or on par with fully supervised methods like RF, HGB, or XGB even with only 1–5% of the labeled examples. CoBC tends to be the top in accuracy, while Rel-Rasco is top in F1-score rankings on noisy or imbalanced datasets like eap2024 and student. Simpler methods like Self-Training are also effective across settings, especially for MBA, and thus show their practicability. As the labeled ratio increases, all the methods move towards comparable performance, suggesting that SSL methods are most beneficial when data is limited. Notably, baselines under 100% supervision seldom outperform top SSL methods, even at 100% labeling, as well, underlining the value of SSL under real-world scenarios where labeled data is expensive or scarce.
Ensemble and multi-view algorithms like Rasco and CoBC perform better in accuracy compared to less complex methods like Self-Training due to their ability to exploit diversity in learners and feature representations. By having several classifiers trained on various subspaces or views of the data, these algorithms minimize overfitting risk and counter labeling error propagation, a typical drawback of single-view self-labeling. In the SSL settings with limited labeled data, this heterogeneity causes resilience so that the model will be capable of unveiling complementary patterns across views that could be obscured to an individual classifier. Hence, ensemble and multi-view methods capitalize on the structure of the data and the redundancy among the sets of features, rendering the predictions more stable and accurate, especially with complex or imbalanced data.
Apart from predictive performance, fairness metrics exhibit extreme differences across SSL methods, on both Demographic Parity Difference (DPD) and Equalized Odds Difference (EOD). Self-Training and Rel-Rasco always produce the smallest disparities, suggesting that these methods better minimize bias across demographic groups.
Notably, Self-Training achieves high performance on fairness metrics in spite of its overall lower accuracy. A likely explanation is that the less complex process of its mechanism, which consists of adding the most confidently predicted labels iteratively, is less damaging in making use of weak correlations in the data that could represent demographic bias. More sophisticated methods, while better at extracting predictive signal, may indeed also capture and amplify spurious correlations with sensitive features. Lower complexity and more cautious labeling of Self-Training, however, may disavow reinforcing its bias patterns from the small labeled set disproportionately. This lines up with the idea that fairness and accuracy do not always go hand in hand and that, sometimes, less sophisticated methods produce more fair results.
CoBC is also well-ranked on many fairness metrics, whereas ensemble-based methods like Co-Forest, Co-Training, and Tri-Training are more likely to generate more disparities, particularly on sensitive datasets such as eap2024 and student. Surprisingly, fairness is not necessarily improved by more abundant labeled data; occasionally DPD and EOD values increase with label richness, potentially through extrapolation of inherent bias in training data. Fully supervised baselines such as HGB and XGB also fail to achieve competitive fairness, especially on more challenging datasets, proving that label sufficiency alone cannot guarantee fairness. This suggests that optimal performance for accuracy does not necessarily equal optimal performance for fairness, and in some cases, the introduction of more labeled data actually made fairness worse by scaling up built-in bias in the data. In education, where predictive models can influence interventions and resource allocation, these results serve to emphasize the need to balance predictive performance with fairness, as well as to be cognizant of fairness-aware variants of SSL methods. These findings justify fairness-aware SSL design for fair and effective machine learning in real-world, imbalanced settings.
It can be contributed to the bias amplification problem of SSL that fairness metrics sometimes get worse as more labeled data are added. At low data availability of labels, SSL algorithms rely a lot on the geometry of unlabeled data and synthetic augmentation, which assists in countering some biases in the sparse training set to a certain extent. But with more labeled data, models come to rely more on the labels, so that any initial demographic or systemic bias in the labeled set becomes amplified. This results in worse disparities in demographic parity and equalized odds measures. In essence, more labels make the model more certain to replicate biased patterns, which appears as deteriorating fairness scores, even with improvement in predictive performance.
These observations highlight the trade-offs between fairness and accuracy in SSL. Methods such as Rasco and CoBC generally perform very well on accuracy but are likely to show variation in fairness measures, especially on sensitive datasets such as student and eap2024. Methods such as Self-Training are less accurate but tend to produce fairer outcomes, mainly in terms of demographic parity. This suggests that the most accurate method is not the best in practice if fairness is also a key concern. The compromise reflects the value of hybrid methods or fairness-aware tweaks that weigh predictive ability against equity, so that improving performance is not achieved by systematically discriminating against some student groups. Figure 5 illustrates how the relative success of each semi-supervised algorithm varies across evaluation metrics and base classifiers.
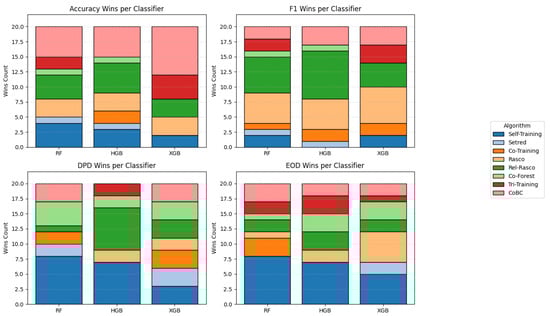
Figure 5.
Stacked wins per evaluation metric across base classifiers.
We performed a direct comparison between baseline SSL methods and their TVAE-SSL augmented counterparts (Table 18). The results demonstrate that the method proposed was indeed tested and, while the size of improvement varied by dataset and method, TVAE augmentation consistently demonstrated large gains in many cases. For example, Rasco (TVAE-SSL) performs better than base Rasco on cert (0.9154 vs. 0.9027), eap2024 (0.6903 vs. 0.6817), and student (0.7220 vs. 0.7086). Similarly, Rel-Rasco (TVAE-SSL) performs better on cert (0.9179 vs. 0.8985) and maintains as well as ever on student. Co-Training also benefits from TVAE augmentation on cert (0.9032 vs. 0.9000) and student (0.6895 vs. 0.6769). While in certain cases the differences are marginal or level (e.g., Setred, Co-Forest), the general trend seems to be that TVAE-SSL offers consistent or superior performance without degradation. We chose to report on HistGradientBoosting (HGB) compared to XGBoost (XGB) or Random Forests (RFs) as HGB always provided a reasonable trade-off between accuracy, justice, and computation cost across datasets. While RF overall produced a good solid baseline, in most cases its performance was surpassed by boosting-based methods, and XGB, although very accurate, tended to inflate fairness gaps and was computationally more expensive, especially in iterated semi-supervised runs with synthetic growth. HGB, on the other hand, posted results that were both consistent and robust across measures, thus serving as a representative option for illustrating the strengths of our TVAE-SSL framework without burdening the reader with duplicate comparisons.
Table 18.
Average accuracy across all labeled ratios (HGB).
While overall improvements were brought about by SSL with TVAE augmentation, anomalies and shortcomings were observed. For some datasets, primarily eap2024 and student, performance gains were restricted or fairness scores deteriorated at higher labeled ratios, indicating that data quality and inherent bias may constrain SSL benefits. Similarly, MBA provided strong accuracy but persistently poor F1-scores, which indicated extreme class unbalance that SSL could not fully mitigate. These anomalies underscore the dependence of SSL methods on dataset properties like label distribution and sensitive attribute interdependencies. The second limitation is that fairness outcomes were highly context-sensitive; certain methods that bridged demographic gaps did not generalize under equalized odds, illustrating the multifaceted nature of fairness. Hybrid approaches integrating generative augmentation with fairness-aware objectives must thus be explored in future, and studies need to be carried out on more varied and realistic educational settings.
7. Conclusions
In this paper, we introduced TVAE-SSL, a novel framework that exploits both the generative capabilities of the Tabular Variational Autoencoder (TVAE) and the flexibility of SSL methods to boost model performance under low-data regimes. By integrating the unlabeled dataset with realistic, label-free synthetic samples generated using TVAE, the method augments the quantity as well as the diversity of the training data without introducing label noise. This generative augmentation technique enables traditional SSL algorithms, e.g., Self-Training, Co-Training, and ensemble methods, to generalize more effectively even when the number of labeled examples is extremely low.
Our extensive empirical evaluation on four diverse tabular datasets demonstrates that TVAE-SSL improves predictive accuracy and F1-score, even under low-label scenarios (1–10% labeled data). Among the methods tried, Rasco-based versions and CoBC worked best, and our proposed augmentation method improved their performance even further. Notably, the results also show that TVAE-SSL improves fairness metrics such as Demographic Parity and Equalized Odds, indicating that synthetic data can help not only accuracy but also fair model conduct. These findings justify the broader use of generative models as a valuable component of semi-supervised pipelines for tabular data, where data annotation is costly or impossible.
One of the primary constraints of this study is its scope, which is confined to four chosen educational datasets, a narrow set of base classifiers (RF, HGB, and XGB), and a single generative model, the Tabular Variational Autoencoder (TVAE). While such choices allow controlled and systematic analysis, they restrict the generalizability of the results. Different datasets, particularly those with other domains or distributions of sensitive features, can lead to different performance and fairness. Likewise, other generative approaches such as GAN-based or diffusion-based can have potentially more effective synthetic augmentation impacts, and other base classifiers can react differently to SSL algorithms.
Looking ahead, TVAE-SSL suggests several directions. First, the integration of uncertainty-aware sample filtering or confidence weighted synthetic instance selection has the potential to further improve performance. Second, generalizing the framework to multiclass or multilabel problems, as well as exploring its integration with other fairness-aware learning objectives, can increase its applicability. Finally, applying TVAE-SSL to real-world applications such as healthcare, finance, and cybersecurity, where labeled data are limited and fairness is critical, can validate its real-world efficacy. Overall, this work illustrates the potential of a union between generative modeling and SSL as a path towards more effective, data efficient, and fairer machine learning systems.
Author Contributions
Conceptualization, S.K.; methodology, N.F.; validation, N.F.; writing—original draft preparation, G.K.; writing—review and editing, S.K. and Y.D. All authors have read and agreed to the published version of the manuscript.
Funding
This work was supported in part by the European Union through the Competitiveness Programme (ESPA 2021–2027) under the project easyHPC@eco.plastics.industry (MIS: 6001593).
Data Availability Statement
The “MBA Admission Dataset” (Class 2025) on Kaggle provides a publicly accessible (https://www.kaggle.com/datasets/taweilo/mba-admission-dataset, accessed on 20 September 2025) and well-structured collection of application-related data. The Hellenic Open University Learning Analytics Datasets analyzed during the current study is available from the corresponding author upon reasonable request.
Conflicts of Interest
The authors declare no conflicts of interest.
References
- Mikre, F. The roles of information communication technologies in education: Review article with emphasis to the computer and internet. Ethiop. J. Educ. Sci. 2011, 6, 109–126. [Google Scholar]
- Romero, C.; Ventura, S. Educational data mining: A review of the state of the art. IEEE Trans. Syst. Man Cybern. Part C Appl. Rev. 2010, 40, 601–618. [Google Scholar] [CrossRef]
- Romero, C.; Ventura, S. Data mining in education. Wiley Interdiscip. Rev. Data Min. Knowl. Discov. 2013, 3, 12–27. [Google Scholar] [CrossRef]
- Romero, C.; Ventura, S. Educational data mining and learning analytics: An updated survey. Wiley Interdiscip. Rev. Data Min. Knowl. Discov. 2020, 10, e1355. [Google Scholar] [CrossRef]
- Siemens, G.; Baker, R.S.J.d. Learning analytics and educational data mining: Towards communication and collaboration. In Proceedings of the 2nd International Conference on Learning Analytics and Knowledge, Vancouver, BC, Canada, 29 April–2 May 2012; pp. 252–254. [Google Scholar]
- Zhu, X.; Goldberg, A. Introduction to Semi-Supervised Learning; Morgan & Claypool Publishers: San Rafael, CA, USA, 2009. [Google Scholar]
- Zhou, Z.-H. A brief introduction to weakly supervised learning. Natl. Sci. Rev. 2018, 5, 44–53. [Google Scholar] [CrossRef]
- Chapelle, O.; Scholkopf, B.; Zien, A. Semi-supervised learning. IEEE Trans. Neural Netw. 2009, 20, 542. [Google Scholar] [CrossRef]
- Kostopoulos, G.; Karlos, S.; Kotsiantis, S. Multiview learning for early prognosis of academic performance: A case study. IEEE Trans. Learn. Technol. 2019, 12, 212–224. [Google Scholar] [CrossRef]
- Kostopoulos, G.; Kotsiantis, S. Exploiting semi-supervised learning in the education field: A critical survey. In Advances in Machine Learning/Deep Learning-Based Technologies; Springer: Cham, Switzerland, 2021; Volume 2, pp. 79–94. [Google Scholar]
- Kitto, K.; Knight, S. Practical ethics for building learning analytics. Br. J. Educ. Technol. 2019, 50, 2855–2870. [Google Scholar] [CrossRef]
- Moreno-Marcos, P.M.; Alario-Hoyos, C.; Muñoz-Merino, P.J.M.; Kloos, C.D. Prediction in MOOCs: A review and future research directions. IEEE Trans. Learn. Technol. 2018, 12, 384–401. [Google Scholar] [CrossRef]
- Kostopoulos, G.; Kotsiantis, S.; Pintelas, P. Predicting student performance in distance higher education using semi-supervised techniques. In Proceedings of the Model and Data Engineering: 5th International Conference, MEDI 2015, Rhodes, Greece, 26–28 September 2015; pp. 259–270. [Google Scholar]
- Kostopoulos, G.; Livieris, I.E.; Kotsiantis, S.; Tampakas, V. Enhancing high school students’ performance based on semi-supervised methods. In Proceedings of the 2017 8th International Conference on Information, Intelligence, Systems & Applications (IISA), Larnaca, Cyprus, 28–30 August 2017; pp. 1–6. [Google Scholar]
- Kostopoulos, G.; Kotsiantis, S.; Pintelas, P. Estimating student dropout in distance higher education using semi-supervised techniques. In Proceedings of the 19th Panhellenic Conference on Informatics, Athens, Greece, 1–3 October 2015; pp. 38–43. [Google Scholar]
- Li, W.; Gao, M.; Li, H.; Xiong, Q.; Wen, J.; Wu, Z. Dropout prediction in MOOCs using behavior features and multi-view semi-supervised learning. In Proceedings of the 2016 International Joint Conference on Neural Networks (IJCNN), Vancouver, BC, Canada, 24–29 July 2016; pp. 3130–3137. [Google Scholar]
- Kostopoulos, G.; Kotsiantis, S.; Fazakis, N.; Koutsonikos, G.; Pierrakeas, C. A semi-supervised regression algorithm for grade prediction of students in distance learning courses. Int. J. Artif. Intell. Tools 2019, 28, 1940001. [Google Scholar] [CrossRef]
- Karlos, S.; Kostopoulos, G.; Kotsiantis, S. Predicting and interpreting students’ grades in distance higher education through a semi-regression method. Appl. Sci. 2020, 10, 8413. [Google Scholar] [CrossRef]
- Lu, Y.; Shen, M.; Wang, H.; Wang, X.; van Rechem, C.; Fu, T.; Wei, W. Machine learning for synthetic data generation: A review. arXiv 2023, arXiv:2302.04062. [Google Scholar]
- Emam, K.E.; Mosquera, L.; Hoptroff, R. Practical Synthetic Data Generation: Balancing Privacy and the Broad Availability of Data; O’Reilly Media: Sebastopol, UK, 2020. [Google Scholar]
- Nikolenko, S.I. Synthetic Data for Deep Learning; Springer: Berlin/Heidelberg, Germany, 2021. [Google Scholar]
- Mehrabi, N.; Morstatter, F.; Saxena, N.; Lerman, K.; Galstyan, A. A survey on bias and fairness in machine learning. ACM Comput. Surv. CSUR 2021, 54, 115. [Google Scholar] [CrossRef]
- James, S.; Harbron, C.; Branson, J.; Sundler, M. Synthetic data use: Exploring use cases to optimise data utility. Discov. Artif. Intell. 2021, 1, 15. [Google Scholar] [CrossRef]
- Flanagan, B.; Majumdar, R.; Ogata, H. Fine grain synthetic educational data: Challenges and limitations of collaborative learning analytics. IEEE Access 2022, 10, 26230–26241. [Google Scholar] [CrossRef]
- Hu, Q.; Yuille, A.; Zhou, Z. Synthetic data as validation. arXiv 2023, arXiv:2310.16052. [Google Scholar] [CrossRef]
- Chan, Y.; Pu, G.; Shanker, A.; Suresh, P.; Jenks, P.; Heyer, J.; Denton, S. Balancing cost and effectiveness of synthetic data generation strategies for llms. arXiv 2024, arXiv:2409.19759. [Google Scholar] [CrossRef]
- Binns, R. Fairness in machine learning: Lessons from political philosophy. In Proceedings of the Conference on Fairness, Accountability and Transparency, New York, NY, USA, 23–24 February 2018; pp. 149–159. [Google Scholar]
- Holstein, K.; Vaughan, J.W.; Daumé, H., III; Dudik, M.; Wallach, H. Improving fairness in machine learning systems: What do industry practitioners need? In Proceedings of the 2019 CHI Conference on Human Factors in Computing Systems, Glasgow, UK, 4–9 May 2019; pp. 1–16. [Google Scholar]
- Friedler, S.A.; Scheidegger, C.; Venkatasubramanian, S.; Choudhary, S.; Hamilton, E.P.; Roth, D. A comparative study of fairness-enhancing interventions in machine learning. In Proceedings of the Conference on Fairness, Accountability, and Transparency, Atlanta, GA, USA, 29–31 January 2019; pp. 329–338. [Google Scholar]
- Rahmani, A.M.; Groot, W.; Rahmani, H. Dropout in online higher education: A systematic literature review. Int. J. Educ. Technol. High. Educ. 2024, 21, 19. [Google Scholar] [CrossRef]
- Ghasempour, S.; Esmaeeli, M.; Abbasi, A.; Hosseinzadeh, A.; Ebrahimi, H. Relationship between academic success, distance education learning environments, and its related factors among medical sciences students: A cross-sectional study. BMC Med. Educ. 2023, 23, 847. [Google Scholar] [CrossRef]
- Kostopoulos, G.; Panagiotakopoulos, T.; Kotsiantis, S.; Pierrakeas, C.; Kameas, A. Interpretable models for early prediction of certification in MOOCs: A case study on a MOOC for smart city professionals. IEEE Access 2021, 9, 165881–165891. [Google Scholar] [CrossRef]
- Triguero, I.; García, S.; Herrera, F. Self-labeled techniques for semi-supervised learning: Taxonomy, software and empirical study. Knowl. Inf. Syst. 2015, 42, 245–284. [Google Scholar] [CrossRef]
- Li, M.; Zhou, Z.-H. SETRED: Self-training with editing. In Proceedings of the Pacific-Asia Conference on Knowledge Discovery and Data Mining, Hanoi, Vietnam, 18–20 May 2005; pp. 611–621. [Google Scholar]
- Blum, A.; Mitchell, T. Combining labeled and unlabeled data with co-training. In Proceedings of the Eleventh Annual Conference on Computational Learning Theory, Madison, WI, USA, 24–26 July 1998; pp. 92–100. [Google Scholar]
- Zhou, Z.-H.; Li, M. Semi-supervised learning by disagreement. Knowl. Inf. Syst. 2010, 24, 415–439. [Google Scholar] [CrossRef]
- Li, M.; Zhou, Z.-H. Improve computer-aided diagnosis with machine learning techniques using undiagnosed samples. IEEE Trans. Syst. Man, Cybern.-Part A Syst. Hum. 2007, 37, 1088–1098. [Google Scholar] [CrossRef]
- Hady, M.F.A.; Schwenker, F. Co-training by committee: A new semi-supervised learning framework. In Proceedings of the 2008 IEEE International Conference on Data Mining Workshops, Pisa, Italy, 15–19 December 2008; pp. 563–572. [Google Scholar]
- Wang, J.; Luo, S.; Zeng, X.-H. A random subspace method for co-training. In Proceedings of the 2008 IEEE International Joint Conference on Neural Networks (IEEE World Congress on Computational Intelligence), Hong Kong, China, 1–6 June 2008; pp. 195–200. [Google Scholar]
- Yaslan, Y.; Cataltepe, Z. Co-training with relevant random subspaces. Neurocomputing 2010, 73, 1652–1661. [Google Scholar] [CrossRef]
- Zhou, Z.-H.; Li, M. Tri-training: Exploiting unlabeled data using three classifiers. IEEE Trans. Knowl. Data Eng. 2005, 17, 1529–1541. [Google Scholar] [CrossRef]
- Breiman, L. Random forests. Mach. Learn. 2001, 45, 5–32. [Google Scholar] [CrossRef]
- Chen, T.; Guestrin, C. Xgboost: A scalable tree boosting system. In Proceedings of the 22nd ACM SIGKDD International Conference on Knowledge Discovery and Data Mining, San Francisco, CA, USA, 13–17 August 2016; pp. 785–794. [Google Scholar]
- Ke, G.; Meng, Q.; Finley, T.; Wang, T.; Chen, W.; Ma, W.; Ye, Q.; Liu, T.-Y. Lightgbm: A highly efficient gradient boosting decision tree. Adv. Neural Inf. Process. Syst. 2017, 30, 1–9. [Google Scholar]
- Dwork, C.; Hardt, M.; Pitassi, T.; Reingold, O.; Zemel, R. Fairness through awareness. In Proceedings of the 3rd Innovations in Theoretical Computer Science Conference, Cambridge, MA, USA, 8–10 January 2012; pp. 214–226. [Google Scholar]
- Hardt, M.; Price, E.; Srebro, N. Equality of opportunity in supervised learning. Adv. Neural Inf. Process. Syst. 2016, 29, 1–22. [Google Scholar]
- Xu, L.; Skoularidou, M.; Cuesta-Infante, A.; Veeramachaneni, K. Modeling tabular data using conditional gan. Adv. Neural Inf. Process. Syst. 2019, 32, 1–15. [Google Scholar]
Disclaimer/Publisher’s Note: The statements, opinions and data contained in all publications are solely those of the individual author(s) and contributor(s) and not of MDPI and/or the editor(s). MDPI and/or the editor(s) disclaim responsibility for any injury to people or property resulting from any ideas, methods, instructions or products referred to in the content. |
© 2025 by the authors. Licensee MDPI, Basel, Switzerland. This article is an open access article distributed under the terms and conditions of the Creative Commons Attribution (CC BY) license (https://creativecommons.org/licenses/by/4.0/).