Abstract
Most network attacks occur at the application layer, where many application layer protocols exist. These protocols have different structures and functionalities, posing feature extraction challenges and resulting in low identification accuracy. This significantly affects application layer protocol recognition, analysis, and detection. We propose a data protocol identification method based on a Residual Network (ResNet) to address this issue. The method involves the following steps: (1) utilizing a delimiter determination algorithm based on information entropy proposed in this paper to determine an optimal set of delimiters; (2) segmenting the original data using the optimal set of delimiters and constructing a feature data block frequency table based on the frequency of segmented data blocks; (3) employing a composite-feature-based RGB image generation algorithm proposed in this paper to generate feature images by combining feature data blocks and original data; and (4) training the ResNet model with the generated feature images to automatically learn protocol features and achieve classification recognition of application layer protocols. Experimental results demonstrate that this method achieves over 98% accuracy, precision, recall, and F1 score across these four metrics.
1. Introduction
Network protocols form the cornerstone of Internet communication, dictating the transmission methods, formats, and rules for data exchange across networks, enabling communication and information exchange among different devices and applications. However, with the rapid growth of the Internet and the emergence of new technologies, traditional network protocols can no longer meet the increasing communication demands. The integration of a large number of Internet of Things (IoT) devices into the Internet ecosystem has led to the widespread application of network protocols in various fields, such as smartphones, smart homes [1], connected vehicles [2], smart cities [3], industrial control [4], and remote healthcare [5], facilitating communication and data exchange between devices. These IoT devices utilize various application layer protocols, such as HTTP, MQTT, DDS, AMQP, etc., to adapt to different requirements and application scenarios.
In order to adapt to the needs of emerging applications and services, new protocols are continuously introduced and developed. Once registered by the Internet Assigned Numbers Authority (IANA) [6], these protocols become publicly available. Attackers can leverage this public information to gain insight into the workings of protocols and potential vulnerabilities, potentially launching attacks against these protocols. Therefore, research on application layer protocol recognition technology is of the utmost importance. Currently, mainstream methods include Deep Packet Inspection (DPI) [7], statistical methods based on feature extraction [8], machine learning methods [9], deep learning methods [10], and protocol fingerprinting methods [11]. These methods effectively identify application layer protocols, enhancing network security and ensuring the reliability of network communication.
As the most used protocol recognition technology, DPI requires thoroughly examining packet headers, payload, and other information. However, this method faces challenges such as low efficiency, poor accuracy, and inability to handle encrypted traffic when processing large amounts of data streams. The protocol feature matching method involves establishing a protocol feature library to match network traffic with feature fingerprints for protocol identification. The workflow includes constructing a protocol fingerprint library, extracting traffic features, matching fingerprints, and identifying protocols. However, this method may be susceptible to influences such as encryption, compression, obfuscation, or variations in traffic, leading to reduced matching accuracy. Deep learning offers the advantage of automatically learning features, making it particularly effective for identifying network communication protocol data with distinct features. However, deep learning models typically require a large amount of computational resources. Training these models involves extensive matrix operations and floating-point calculations, which place high demands on hardware, especially for image or video datasets. The large number of parameters and computations significantly increase processing time.
Therefore, by combining traffic features with deep learning methods, we improved protocol recognition speed and accuracy by enhancing data features, without modifying the model architecture. Our main contributions are as follows:
- Proposed an entropy-based delimiter determination algorithm: This algorithm utilizes information entropy and frequency to determine an optimal set of delimiters in application layer protocols. These delimiters are used to segment the original data, extract feature data blocks, and generate a feature table.
- Introduced a composite-feature-based RGB image generation algorithm: This algorithm refines the original data using the feature table to obtain purified data with positional information. Subsequently, the original and purified data are merged to generate composite feature images. This approach comprehensively represents the data features and provides more distinct features for training tasks.
- Utilized the composite feature images for training and testing on the ResNet pre-processing model: Results demonstrate that after adopting the proposed method, the accuracy, precision, and recall of application layer protocol recognition all exceed 98%, affirming the effectiveness of this method.
The reason for choosing ResNet in this paper is its greater flexibility and adaptability, especially when dealing with unknown or complex patterns. While rule-based approaches perform well in known scenarios, they often struggle to cover all possible variations when handling a large number of changing network behaviors. Heuristic methods, through self-learning and data-driven approaches, can perform better across a broader range of scenarios, and are particularly more robust when dealing with novel attacks and network anomalies.
The structure of this paper is as follows: Section 1 provides an introduction to protocol recognition and outlines the main contributions of this paper. Section 2 reviews related research in the field. Section 3 describes the specific implementation steps of the proposed method. Section 4 introduces the software and hardware environment used for experimentation, along with the experimental results and analysis. Finally, Section 5 concludes the paper and suggests avenues for future research.
2. Related Work
Protocol recognition is a crucial technology in network security, as it identifies the protocol types used in network traffic, thereby enhancing network security and management efficiency. With the advancement of the network era, protocol recognition methods have been continuously evolving and currently primarily include the following three approaches.
2.1. DPI
Cheng [12] proposed a DPI method integrating machine learning techniques for protocol recognition in Software Defined Networks (SDN). This method comprises two stages, early detection and deep inspection, for detecting both encrypted and unencrypted traffic. For unencrypted traffic, a logistic regression binary classifier and an adaptive packet sampling mechanism are utilized for detection. Significant features are extracted for encrypted traffic to train a decision tree classifier. Experimental results demonstrate that this method significantly improves recognition accuracy at an acceptable cost.
Sun [13] presents an improved method for Deep Packet Inspection (DPI) based on regular expressions. The method effectively reduces the number of transition edges by using character ranges to represent multiple consecutive characters. The specific optimizations are as follows: (1) replacing multiple consecutive characters with character ranges significantly reduces the number of transition edges. (2) Range searching: to address the issue of discontinuous character ranges, we propose methods for merging adjacent character ranges and querying character ranges. (3) By constructing a range tree, we can quickly find the corresponding character range for each input character with a time complexity of O(log(m)). (4) Overlapping range segmentation: to handle the scenario in NFA where multiple valid transition edges point to different states, we propose an algorithm for splitting overlapping ranges, ensuring that the target state set for each new range is correct.
From the above two papers, it can be seen that the main directions for optimizing DPI technology are feature selection, computational efficiency, and resource usage. The accuracy of recognition is particularly influenced by the features.
2.2. Protocol Feature Matching-Based Approach
To enhance accuracy, Ma [14] proposed the GramMatch method, which improves the accuracy of feature extraction by enhancing the n-gram feature word extraction method. This method provides features for the protocol feature library and utilizes fingerprint library matching to achieve protocol identification. Additionally, research in the literature [15,16,17] has proposed methods for protocol feature word filtering, including improved FP feature extraction algorithms, fusion algorithms combining pattern matching and clustering, and LDA feature word inference algorithms, to improve the accuracy of feature words. Furthermore, Zhu [18] introduced the use of the EPS-neighborhood hit algorithm to extract more accurate feature words.
Wang [19] proposed a new method for feature recognition and classification clustering of unknown network protocols. First, a protocol feature library is constructed. Then, the features of the protocols to be detected are vectorized, generating a 0–1 matrix. The PCA algorithm is applied to perform dimensionality reduction on the vectorized protocol features. Combined with the CPFV algorithm, clustering optimization is performed. Based on the clustering results, new protocol formats are generated, and unknown network protocols are classified and identified. However, this method can be affected by the number of types, the choice of cluster centers, and data loss during dimensionality reduction, which may lead to a decrease in protocol recognition accuracy.
Liu [20] proposed a method for feature extraction of unknown wireless network protocols based on sequence associations. This method mainly consists of two steps: inter-frame feature extraction and intra-frame feature extraction. Specifically, it extracts protocol frame-related feature information by comparing and analyzing the relative positions of different protocol frames; it extracts protocol function-related feature information by analyzing the positional relationships of various fields within the protocol frame. Different protocols may have varying characteristics and complexities, so this method cannot determine whether it is applicable to all known and unknown types of wireless network protocols.
2.3. Deep Learning
Wei [21] proposed a novel method that utilizes natural language processing (NLP) techniques for semantic analysis of network data packets to extract protocol features. Additionally, transforming data into images for learning and identification is also a viable approach.
Xue [22] converted data into grayscale images and employed convolutional neural networks (CNNs) for feature extraction. Garshasbi [23] introduced a protocol reverse engineering method based on convolutional neural networks, termed CNNPRE. This method utilizes a pre-trained DenseNet-169 model to extract features from network traffic data and employs UMAP for dimensionality reduction and traffic feature calculation. Finally, it combines the HDBSCAN clustering algorithm to identify message types. Experimental results demonstrate that the CNNPRE method achieves high uniformity and V-Measure scores in identifying message types across multiple datasets. Fu [24] combined multiple packet header data during communication into grayscale images. They utilized a dual-path autoencoder model to extract and aggregate payload features and statistical features. Further, they employed a correlation-adjusted clustering module to identify the fused features.
Wu [25] proposed a method that combines deep neural networks and clustering algorithms. First, an autoencoder (based on Network-in-Network, Channel Attention, and Spatial Attention) is used to reduce the dimensionality of protocol data. Then, improved clustering techniques, such as the K-Means algorithm, are applied for clustering to identify unknown protocols.
Huang [26] proposed the Complex Application Recognition (CAR) method, and then to address the issue of low protocol recognition accuracy in large-scale network environments, he proposed the SAIMM method based on a MinMax principle classifier ensemble to effectively improve the accuracy of CAR technology in large-scale network environments.
However, the methods proposed in the above deep-learning-based papers do not strike a balance between recognition efficiency and accuracy. Therefore, the aim of this study is to find a method that balances real-time recognition efficiency and resource consumption and can be applied in real-time network interactions, namely, the compound feature-based RGB image generation algorithm.
2.4. Protocol Format
2.4.1. BGP Protocol
BGP is a protocol used for exchanging routing information between Autonomous Systems (ASs). Its message structure is mainly used for establishing connections, exchanging routing information, and error notifications. It includes OPEN and NOTIFICATION messages.
OPEN Message: Used to initialize the BGP connection, containing information such as the BGP version, Autonomous System Number (ASN), and Hold Time. Through the OPEN message, BGP peers can confirm each other’s protocol version and capabilities.
NOTIFICATION Message: Used to report errors or exceptional situations. For example, the “Cease” error code indicates that the connection was rejected, usually due to some configuration issue or connection incompatibility.
2.4.2. SMB Protocol
SMB is a protocol used for sharing files and printers in a network, commonly found in Windows systems. It allows applications to share files, printers, and other resources between computers. The SMB protocol message consists of requests and responses. The request message typically includes operation codes (such as file read, write, query, etc.), while the response message returns the operation results. The SMB protocol allows remote procedure calls (RPCs) between different computers, enabling communication through mailslots and named pipes.
2.4.3. HTTP Protocol
HTTP is a stateless request–response protocol widely used for data exchange between web browsers and web servers. It is used to transfer web pages, images, videos, and other resources.
HTTP Request: Consists of a request line, request headers, and a request body. The request line includes the request method (such as GET, POST), the target URL, and the protocol version (such as HTTP/1.1).
HTTP Response: Consists of a status line, response headers, and a response body. The status line contains a status code (such as 200 OK), the protocol version (such as HTTP/1.1), and the response status description. The response headers provide metadata such as cache control, content type, and server information.
3. Materials and Methods
This paper proposes a novel method for network protocol recognition, which comprises the following four sections:
- Truncating and processing network traffic data.
- Utilizing a delimiter determination algorithm based on information entropy to determine an optimal set of delimiters. This set is then used to extract features from the application layer data, generating a feature table.
- Employing a composite-feature-based RGB image generation algorithm to generate images required for model training.
- Fine-tuning and protocol type recognition using a pre-trained ResNet model.
Unlike traditional methods, the proposed approach ensures both the accuracy of protocol recognition and eliminates the need for manual feature selection. The processing workflow of this method is illustrated in Figure 1.
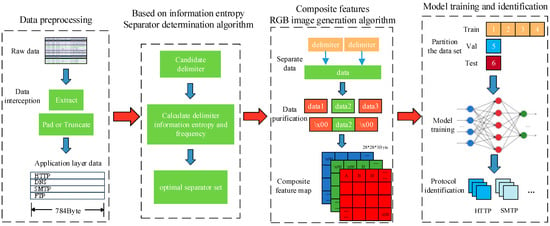
Figure 1.
This image introduces the data preprocessing phase, feature separator algorithm, image generation algorithm, and overall structure of the training in this paper.
3.1. Data Truncation
Data truncation aims to extract network traffic data from PCAP format files and filter out packets transmitted using the TCP and UDP protocols. We utilize the Scapy library in Python to achieve this objective. Initially, the headers of the packets are removed, retaining only the payload data from the transport layer. Subsequently, following the method outlined in the reference [27], the length of the payload data is uniformly adjusted to 784 bytes, serving as the core for identification. If the payload data length exceeds 784 bytes, the first 784 bytes are extracted. Conversely, if the payload data length is less than 784 bytes, it is padded with “\x00”.
3.2. Algorithm for Determining Delimiters Based on Information Entropy
The key to this section is to select a suitable set of delimiters so that the segmented data blocks have the maximum information content, thereby providing effective features for model learning and training. Reference [28] provides 20 meaningful delimiters for the HTTP protocol:
CR LF TAB SPACE , . : / \ & ? = ( ) [ ] “ ; < >
However, these delimiters may not be suitable for other protocols. Therefore, we select 38 symbols from the ASCII table, excluding letters and numbers as candidate delimiters:
SPACE CR LF TAB FF NUL + - */ \ ~ |
, . : ; ! ? ‘ “ ` _ ^ # $ % & = ( ) < > [ ] { } @
We propose an algorithm for determining delimiters based on information entropy. The algorithm traverses the 38 candidate delimiters, records the position and frequency of each delimiter in each network packet, and uses a map to store the frequency of occurrence of delimiters at a certain position. Then, the algorithm calculates the information entropy of delimiters based on their frequencies and retains the highest frequency of occurrence of delimiters at the same position. Finally, delimiters are judged on whether they can be considered optimal delimiters based on a threshold. The pseudocode of the algorithm is shown in Figure 2, where the threshold for information entropy is set to 2.5 according to reference [29], and the threshold for frequency is empirically set to 0.3.
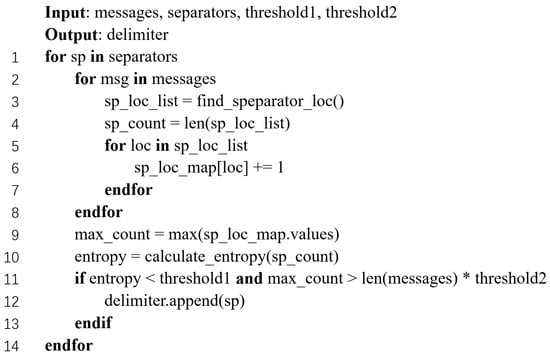
Figure 2.
This image introduces the pseudo-logic of the separator determination algorithm based on information entropy.
3.3. Composite Feature RGB Image Generation Algorithm
In this section, the feature table generated in the previous step will be used to purify and transform the original data, producing a composite feature RGB image as an input for the model. We call this process the composite feature RGB image generation algorithm, and the algorithm flowchart is shown in Figure 3. The algorithm consists of the following two steps: data purification and data transformation with composition.
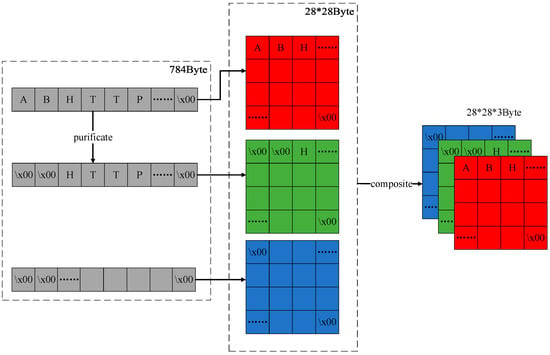
Figure 3.
This image primarily illustrates the implementation principle of the composite feature RGB image generation algorithm.
3.3.1. Data Purification
Data purification involves performing XOR operations on the original data based on the generated feature frequency table, retaining only the data blocks and position information present in the table. For example, given a feature data block “HTTP” and original data “ABCHTTPabc”, after purification, the resulting data would be “\x00\x00\x00HTTP\x00\x00\x00”. This operation yields a purified data stream.
3.3.2. Data Transformation and Composition
Data transformation and composition entail converting each character to its corresponding numerical value in ASCII (ranging from 0x00 to 0xFF). The extracted 784 bytes of data are then transformed into a 28 × 28 × 1 matrix with an 8-bit depth. Subsequently, the original data matrix serves as an RGB image’s red (R) channel, while the purified data matrix serves as the green (G) channel. Finally, a 28 × 28 matrix consisting of “\x00”s is used as the blue (B) channel. As the valid data only exist in the red and green channels, the original data portion appears as an 8-bit depth red color, while the composite data portion exhibits an 8-bit depth red-green composite color, with the absence of data represented in black. The generated image is shown in Figure 4.

Figure 4.
These three images primarily showcase the pictures generated using the RGB image generation algorithm, where (a) represents the DNS protocol, (b) represents the SMTP protocol, and (c) represents the HTTP protocol.
3.4. Model Training and Protocol Recognition
We utilize the pre-trained model of ResNet for protocol feature training and target classification recognition. ResNet is proposed by He [30] in 2015. It is a deep convolutional neural network architecture. It addresses the issue of gradient vanishing that commonly occurs in traditional deep neural networks when increasing the network depth, leading to training difficulties or suboptimal performance. The ResNet18 network model is illustrated in Figure 5.
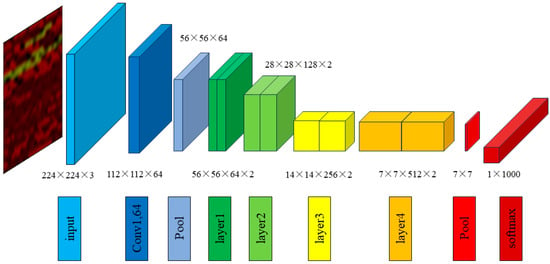
Figure 5.
This image primarily introduces the ResNet18 network model.
The core idea of ResNet is to introduce the concept of residual blocks. Residual blocks enable the network to learn the difference between the residual function F and the identity mapping and add it to the input feature map, forming a skip connection. This aids in gradient propagation, making the network easier to train.
Due to the input size of ResNet being an RGB image of 224 × 224 while our input data is a composite feature map of 28 × 28, we need to resize the input data to meet the requirements of the model. We use the transform.Compose function in PyTorch to create an image preprocessing pipeline and the transforms.Resize ((224, 224)) method to resize the 28 × 28 composite feature map to a 224 × 224 RGB image.
4. Experimental Results and Discussion
This section presents testing and evaluation of the proposed method. Firstly, the datasets, software, and hardware environments used in the experiments are introduced. Then, the testing metrics of this method are presented, followed by an analysis of the experimental results and an evaluation of the proposed method.
4.1. Datasets
The experimental dataset comprises two datasets: the CIC-IDS2017 network communication dataset and an application layer protocol dataset obtained from the Shodan search engine. The CIC dataset accounts for 55%, while the Shodan dataset accounts for 45% of the experimental dataset.
Due to the significant structural differences between character protocols and binary protocols, 20 common application layer protocols are selected from the dataset for experimentation. These protocols include BGP, DNS, FTP, HTTP, IMAP, LDAP, MQTT, MYSQL, NBNS, NTP, OCSP, POP3, SIP, SMB, SMB2, SMTP, SNMP, SSH, TELNET, and TLS.
To ensure data balance, each protocol’s dataset is divided into training, validation, and testing sets, with 800 samples in the training set, 200 samples in the validation set, and 200 samples in the testing set for each protocol.
4.1.1. CIC-IDS2017 Dataset
CIC-IDS2017 [31] is a network dataset for evaluating and researching intrusion detection systems. It consists of real Canadian internet traffic data, encompassing various types of network traffic. This dataset contains multiple network traffic features, such as source IP address, destination IP address, source port, destination port, protocol type, packet size, etc. Additionally, network traffic is labeled to indicate whether it is normal or malicious, and the dataset provides classification information for attack types.
A portion of the CIC-IDS2017 dataset with a file size of 7.73 GB is selected for this study, containing network traffic of various protocols. See Figure 6a for details.
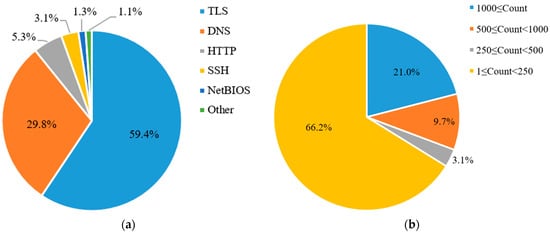
Figure 6.
This image mainly displays the dataset used in this paper’s experiments and the data distribution ratios, where (a) represents the CIC-IDS2017 dataset and (b) represents the Shodan dataset.
4.1.2. Shodan Dataset
Shodan is a search engine designed to search and identify internet-connected devices and systems. Unlike traditional search engines like Google, it does not search web page content; instead, it searches devices across the entire internet, such as servers, routers, cameras, IoT devices, etc. Users can use various filters and keywords to precisely search for specific types of devices or obtain specific information. The search results typically include public information about devices, such as IP addresses, open ports, protocol types, etc.
We developed a Python program using Shodan’s open API to search for application layer protocol names on Shodan and save the results locally. Leveraging the list of assigned port numbers maintained by IANA, application layer protocol names were filtered and deduplicated, resulting in a set of 2204 application layer protocol names. The protocols were categorized based on the volume of data for each protocol, as shown in Figure 6b. Among these, there are 463 protocols with data volumes exceeding 1000 samples each, with 1200 samples captured for each protocol, totaling 555,600 samples.
The CIC-IDS2017 dataset is based on real network interaction packet capture data, while the Shodan dataset consists of packet capture data from network scanning processes. By processing and training on these two mixed datasets, the proposed method in this paper can effectively reflect its performance in both real-world and specialized environments.
The data for the three protocols obtained from the dataset are shown in Table 1. From the table, we can see that the BGP protocol contains distinct characteristic data blocks, such as “BGP”, “Messages”, “ASN”, and other feature identifiers. Similarly, the HTTP header also contains numerous characteristic data blocks, such as “HTTP” “200” “OK”. For the SMB protocol, which consists of both character and binary data, it is easy to visually identify characteristic data blocks like “MAILSLOT”, “BROWSE”, and Samba. However, there are also some garbled data that cannot be directly attributed to specific attributes.

Table 1.
Table displaying the BGP, SMB, and HTTP protocols from the dataset.
4.2. Software and Hardware Environment
The software and hardware experimental environment in this study are presented in Table 2.

Table 2.
Experimental environment information table.
4.3. Evaluation Metrics
For the specific application protocol being analyzed, we have selected the following three indicators for further analysis:
(1) True Positives (TP): Each packet is identified as the corresponding protocol, and the identification result matches the label result.
(2) False Positives (FP): Each packet is identified as the corresponding protocol but does not actually belong to that protocol.
(3) False Negatives (FN): Each packet is identified as not belonging to the application protocol but belongs to that protocol.
(4) True Negatives (TN): The situation where each packet identified as not belonging to the application protocol does not belong to that type.
Based on these data, we selected four indicators: accuracy, accuracy, recall, and F1 score, to evaluate the performance of the algorithm.
4.4. Experimental Results and Analysis
This section tests and evaluates the proposed method based on the evaluation metrics in Section 4.3. It is divided into four parts: (1) determination of optimal de-limiters, (2) generation of frequency tables for feature data blocks, (3) training performance under different deep learning models, and (4) testing the test set using a unified model and hyperparameters and analyzing the test results.
4.4.1. Determination of Optimal Delimiters
We used 38 candidate delimiters that do not include letters and numbers as input. The delimiter determination algorithm based on information entropy obtained the information entropy and frequency of each delimiter in different protocols. Table 3 shows partial delimiter information entropy and frequency.

Table 3.
Partial symbol information entropy and frequency table.
Information entropy reflects the uncertainty of symbols in the protocol. The higher the entropy, the more difficult it is to predict the symbol, indicating that it is unsuitable as a delimiter. Conversely, lower entropy indicates greater symbol stability, making it suitable as a delimiter. For example, in BGP packets, SPACE, CR, LF, and “:” all appear 792 times in the same position, indicating that these four symbols have high positional certainty and stability in BGP packets and can be used as delimiters for BGP packets. Similarly, in HTTP packets, “/” has the highest frequency, while LF, CR, SPACE, and “.” have relatively low frequencies but similar results, indicating the high certainty of these four symbols in the HTTP protocol. Therefore, these five symbols can also be used as delimiters for HTTP packets.
Based on the comprehensive experimental results, we have selected the following eight delimiters as the optimal set of delimiters:
CR LF SPACE NUL , . : /
Additionally, three other groups are chosen as control groups to compare the impact of different delimiters on recognition accuracy. Group A consists of the 20 delimiters proposed in [28], Group B is composed of a random selection of 17 symbols from the ASCII table’s 38 symbols, and Group C is composed of six symbols that appear together in Group A and Group B, and the optimal separator set we have selected. The specific selected delimiters are shown in Table 4.

Table 4.
Contrasting experiment delimiters.
In summary, we designed five sets of experiments, namely the original data group, Group A, Group B, Group C, and the separator group we selected.
4.4.2. Generation of Feature Data Block Frequency Table
We separate 784 bytes of data using the optimal delimiter set and generate a feature frequency table based on the frequency of feature data blocks, which serves as the protocol feature. The characteristic frequencies of some protocols are shown in Table 5, which presents the result of the optimal delimiter set we have selected.

Table 5.
Partial frequency table of protocol features.
The data in the table indicate that in the BGP protocol, the fields “21”, “NOTIFICATION”, “Code”, and “Subcode” have high frequencies of occurrence across the four groups. Upon verification, “21” represents the value of length in the protocol and is not a feature of the BGP protocol; however, all other data are indeed features of the BGP protocol. In the SMB protocol, the more delimiters used, the better the segmentation effect. By comparing Group A with Group C, it can be inferred that all data in Group A are feature data. When comparing Group A with our group, the segmentation results are similar, but because our group has fewer delimiters, the program runs faster and takes less time. In the HTTP protocol, only “Connection” belongs to the HTTP feature in the data blocks segmented by Group B and Group C, as time-related fields such as “GMT” and “2017” occur frequently due to time fields in the HTTP message header. In contrast, Group A’s and our group’s data features are more accurate.
From a temporal perspective, Group B contains many delimiters that do not exist in the original data, so during program execution, these delimiters are only searched but not used for segmentation operations, resulting in a shorter runtime. Group C has the fewest delimiters, resulting in the shortest runtime. However, Group A has the longest runtime because it has the most delimiters, and these delimiters occur frequently in the original data, leading to more segmentation operations. Although our group has significantly fewer delimiters than Group A, these symbols are selected based on information entropy and frequency, resulting in more occurrences in the original data and, therefore, a longer runtime.
This suggests that, taking into account both runtime and feature block accuracy, the delimiter obtained by our proposed algorithm is the optimal solution.
4.4.3. Training Performance
To compare the impact of different models and input data on training performance, we selected three pre-trained models: ResNet18, ResNet34, and ResNet50. These models were trained and tested using five different input datasets. The “origin” group consists of grayscale images generated from the original data. The “composite” group consists of original and clean data RGB images. Additionally, RGB images were generated using separators A, B, and C, selected earlier in the text as a control group, while the “our” group used the RGB images generated by the optimal separator set we selected, as illustrated in Figure 7.
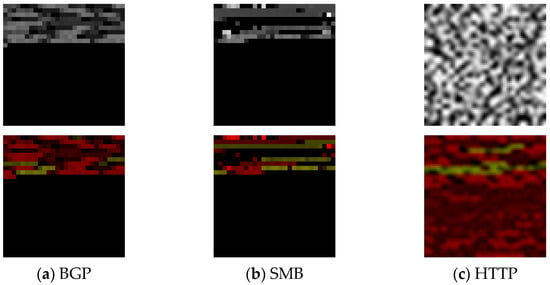
Figure 7.
These six images show pictures generated from the same protocol using different algorithms. The first row displays images generated directly from the raw data, while the second row uses the algorithm proposed in this paper. (a) represents the BGP protocol, (b) represents SMB, and (c) represents HTTP.
Under fixed hyperparameters (epoch = 30, batch size = 212, learning rate = 0.001), the three models were trained using the five input datasets. Figure 8a–c depict the comparison of loss values and validation accuracy for each dataset during each training epoch.
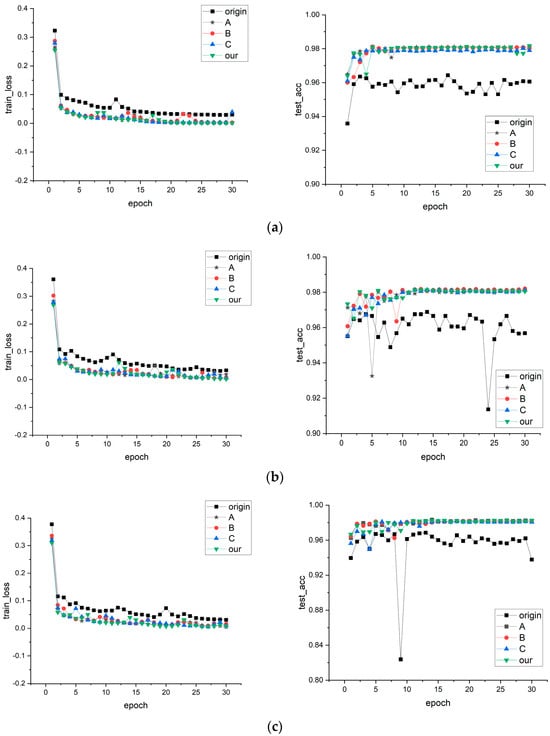
Figure 8.
These images show the loss values and accuracy of five datasets in ResNet models with different depths, where (a) uses ResNet18, (b) uses ResNet34, and (c) uses ResNet50.
ResNet18: According to the data, the loss values show a stable decreasing trend during the first five training epochs. However, the validation accuracy of groups A, B, C, and “our” fluctuates noticeably, while the “origin” group also exhibits some fluctuations. This may be because the model is initially learning the data’s basic features, resulting in accuracy fluctuations. However, as training progresses, the model gradually learns more data features that stabilize the accuracy. The “origin” group shows fluctuations in accuracy throughout training, with a stable decrease in loss values. The fluctuations in accuracy are only around 1%, which is considered normal in the absence of significant external influences. Eventually, groups A, B, C, and “our” stabilize at around 98%, while “origin” stabilizes at around 96%. Thus, it can be concluded that the model training is normal.
ResNet34: According to the data, the “origin” group exhibits a continuous decrease in loss values throughout the entire training process, but the accuracy fluctuates continuously with fluctuations of around 5%. Even at the end of training, the validation accuracy remains in a fluctuating state. This may be due to the increased complexity of the model, causing a poorer generalization ability as obvious features lead to overfitting, especially in the “origin” group, where the data features are more prone to causing overfitting. The other four groups are also affected by the complexity of the model, exhibiting larger fluctuations in the early stages of training compared to the ResNet18 model. However, they gradually stabilized, indicating that groups A, B, C, and “our” did not experience overfitting.
ResNet50: From the data, it can be observed that the fluctuations in the accuracy of the “origin” group decrease significantly compared to ResNet34 as the model depth increases. This is likely because ResNet50 has more layers than ResNet34, resulting in a larger model capacity to better learn and adapt to complex data patterns, achieving higher accuracy early in training. However, during the ninth training epoch, there is a significant decrease in validation accuracy followed by recovery, indicating that the model is approaching optimal parameters, but the subsequent training process is unstable due to the increased number of training iterations. Groups A, B, C, and “our” exhibit smaller fluctuations in the early stages of training compared to ResNet18 and maintain stability throughout subsequent training epochs, demonstrating better stability.
In summary, based on the experimental results, it is clear that using composite feature RGB images as a model input leads to significant improvements in all metrics. The fundamental reason is that composite feature data reduce much of the noise and redundant information, allowing the model to more easily identify relevant features at the lower layers of the network. At the same time, they stabilize gradient updates at deeper layers, reducing the risk of gradient vanishing, which in turn accelerates convergence and improves accuracy.
4.4.4. Test Results
Testing was conducted using the optimal model parameters obtained during training. As shown in Table 6, it is evident that the method of using composite RGB images significantly outperforms the “origin” group method in all metrics. According to the data in the table, we can conclude that using our proposed method, when the hyperparameters are the same, the accuracy, precision, recall, and F1 score of protocol recognition for all three models improved by more than 2%, reaching over 98%.

Table 6.
Comparison of test results.
The data in the table show that using the composite RGB image method significantly outperforms the origin group method in all metrics, with group A consistently achieving the highest scores. According to the data in the table, it can be concluded that using our proposed method, with the same hyperparameters, the accuracy, precision, recall, and F1 score for protocol recognition of all three models improved by more than 2%, reaching over 98%.
We selected the confusion matrix generated from the “our” group when tested on the ResNet50 model, as shown in Figure 9. From the data in the figure, it can be inferred that the primary factor affecting recognition accuracy currently is that some labels of HTTP protocol (label 5) are being identified as TLS (label 19).
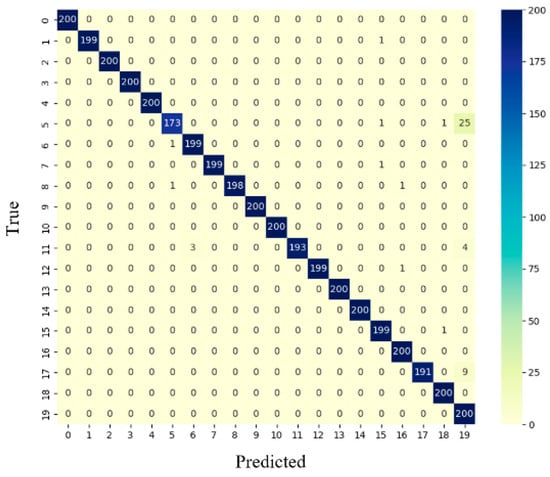
Figure 9.
This image displays the confusion matrix of the test set on ResNet50.
To address this issue, we sampled the dataset and observed the feature data blocks for HTTP and TLS protocols obtained from different sets of separators. Table 7 compares the feature data blocks.

Table 7.
Comparison of feature data blocks for HTTP and TLS.
From the data in the table, it can be observed that the TLS feature data blocks are not prominent, with the highest frequency being only 165 occurrences. The confusion matrix shows a recognition accuracy of 100% for the TLS protocol. Therefore, we conclude that some HTTP data packets are relatively long and are split into multiple packets for transmission. Only the first packet contains the HTTP header information, while the subsequent packets contain only data. These data packets, lacking header information, resemble TLS packets. The model may misclassify these packets as TLS, when they are in fact HTTP packets.
4.4.5. Test Summary
From the data acquired from training and testing the five datasets with the models, it can be concluded that Group A achieves the highest scores in various metrics during training and testing due to more accurate separators. However, upon calculation, it was found that Group A’s metrics were only 0.218% higher on average compared to the “our” group, indicating a minimal difference in performance. Additionally, in Section 4.4.2, the feature extraction results of Groups A and “our” were almost identical, with the “our” group demonstrating a 3.06% reduction in extraction time compared to Group A.
In conclusion, the separators and application-layer protocol recognition method proposed in this paper are deemed the optimal solution under acceptable model performance loss.
5. Conclusions
This paper first underlined the importance of protocol recognition technology. It then elaborated on three main methods in the field of protocol recognition: DPI, protocol feature matching recognition, and deep learning recognition, comparing the advantages and disadvantages of each method. It highlighted the key issue of correctly and efficiently extracting protocol features. Two preprocessing algorithms were detailed: the separator determination algorithm based on information entropy and the RGB image generation algorithm based on composite features. Subsequently, a protocol recognition algorithm based on ResNet was proposed. Finally, the hardware and software information of the test environment, the datasets used, and the deep learning models were introduced.
In this environment, experiments were conducted first on the separator determination algorithm based on information entropy, analyzing the separation effects of different separators. Subsequently, a comparative experiment was set up with three groups of different separators, and three models were trained and tested using five different input datasets. The experimental results showed that all four metrics improved by more than 2%, exceeding 98%, demonstrating the effectiveness and accuracy of this method. Furthermore, comparing the training process with grayscale images under the same conditions proved that this method reduced the risk of overfitting during training. Under acceptable model performance loss, the proposed method in this paper is deemed the optimal solution.
Our method demonstrates high accuracy in recognizing application-layer protocols, which is significant for network security and traffic management. However, there are still limitations and room for improvement in our method. For example, in the recognition of encrypted data in application-layer protocol recognition, the feature separation may not be accurate enough. We plan to further optimize the delimiter determination algorithm and feature extraction process, prepare to apply the method proposed in this article to encryption protocols, improve the recognition process of encrypted data, improve the accuracy and speed of encrypted data feature extraction, and use more pre-trained models and datasets for verification. Additionally, we can consider using more advanced deep learning models or other machine learning methods to improve recognition performance further.
Author Contributions
Conceptualization, H.Z.; funding acquisition, Z.F., H.Z., and Q.G.; methodology, H.Z.; software, X.G.; validation, X.G.; writing—original draft, X.G.; writing—review and editing, Z.F., X.G., H.Z., J.T. and Q.G. All authors have read and agreed to the published version of the manuscript.
Funding
This study was supported by the Zhejiang Provincial Department of Science and Technology’s “Elite” R&D Program Project (2024C01019), the Key Research and Development Program of Zhejiang Province under Grant (2024C01108), and the Zhejiang Provincial Natural Science Foundation of China (LQ20F020003).
Data Availability Statement
CIC-IDS2017 data set: https://www.unb.ca/cic/datasets/ids-2017.html, accessed on 23 December 2024; Shodan data set: www.shodan.io, accessed on 23 December 2024.
Conflicts of Interest
The authors declare no conflict of interest.
References
- Marksteiner, S.; Jimenez, V.J.E.; Valiant, H.; Zeiner, H. An overview of wireless IoT protocol security in the smart home domain. In Proceedings of the 2017 Internet of Things Business Models, Users, and Networks, Copenhagen, Denmark, 23–24 November 2017; pp. 1–8. [Google Scholar]
- Contreras-Castillo, J.; Zeadally, S.; Guerrero-Ibañez, J.A. Internet of vehicles: Architecture, protocols, and security. IEEE Internet Things J. 2017, 5, 3701–3709. [Google Scholar] [CrossRef]
- Zhang, K.; Ni, J.; Yang, K.; Liang, X.; Ren, J.; Shen, X.S. Security and privacy in smart city applications: Challenges and solutions. IEEE Commun. Mag. 2017, 55, 122–129. [Google Scholar] [CrossRef]
- Drias, Z.; Serhrouchni, A.; Vogel, O. Analysis of cyber security for industrial control systems. In Proceedings of the 2015 International Conference on Cyber Security of Smart Cities, Industrial Control System and Communications (SSIC), Shanghai, China, 5–7 August 2015; IEEE: Piscataway, NJ, USA, 2015; pp. 1–8. [Google Scholar]
- Tarigan, I.J.; Alamsyah, B.; Aryza, S.; Siahaan AP, U.; Isa Indrawan, M. Crime aspect of telemedicine on health technology. Int. J. Civ. Eng. Technol. 2018, 9, 480–490. [Google Scholar]
- Pohle, J.; Voelsen, D. Centrality and power. The struggle over the techno-political configuration of the Internet and the global digital order. Policy Internet 2022, 14, 13–27. [Google Scholar] [CrossRef]
- Deri, L.; Fusco, F. Using deep packet inspection in cybertraffic analysis. In Proceedings of the 2021 IEEE International Conference on Cyber Security and Resilience(CSR), Virtual, 26–28 July 2021; IEEE: Piscataway, NJ, USA, 2021; pp. 89–94. [Google Scholar]
- Liu, Z.; Zha, X.; Song, G.; Yao, Q. Unknown wireless protocol feature extraction method based on sequence statistics. Comput. Eng. 2021, 47, 192–197. [Google Scholar]
- Wang, W.; Bai, B.; Wang, Y.; Hei, X.; Zhang, L. Bitstream protocol classification mechanism based on feature extraction. In Proceedings of the 2019 International Conference on Networking and Network Applications(NaNA), Daegu, Republic of Korea, 10–13 October 2019; IEEE: Piscataway, NJ, USA, 2019; pp. 241–246. [Google Scholar]
- Ma, R.; Qin, S. Identification of unknown protocol traffic based on deep learning. In Proceedings of the 2017 3rd IEEE International Conference on Computer and Communications(ICCC), Chengdu, China, 13–16 December 2017; IEEE: Piscataway, NJ, USA, 2017; pp. 1195–1198. [Google Scholar]
- Afandi, W.; Bukhari, S.M.A.H.; Khan, M.U.; Maqsood, T.; Khan, S.U. Fingerprinting technique for youtube videos identification in network traffic. IEEE Access 2022, 10, 76731–76741. [Google Scholar] [CrossRef]
- Cheng, Q.; Wu, C.; Zhou, H.; Kong, D.; Zhang, D.; Xing, J.; Ruan, W. Machine learning based malicious payload identification in software-defined networking. J. Netw. Comput. Appl. 2021, 192, 103186. [Google Scholar] [CrossRef]
- Sun, R.; Shi, L.; Yin, C.; Wang, J. An improved method in deep packet inspection based on regular expression. J. Supercomput. 2019, 75, 3317–3333. [Google Scholar] [CrossRef]
- Ma, B.; Yang, C.; Chen, M.; Ma, J. Grammatch: An automatic protocol feature extraction and identification system. Comput. Netw. 2021, 201, 108528. [Google Scholar] [CrossRef]
- Wang, S.; Guo, F.; Fan, Y.; Wu, J. Association analysis and identification of unknown bitstream protocols based on composite feature sets. IEEE Access 2021, 9, 164454–164465. [Google Scholar] [CrossRef]
- Shi, J.; Yu, X.; Liu, Z. Nowhere to hide: A novel private protocol identification algorithm. Secur. Commun. Netw. 2021, 2021, 672911. [Google Scholar] [CrossRef]
- Yun, X.; Wang, Y.; Zhang, Y.; Zhou, Y. A semantics-aware approach to the automated network protocol identification. IEEE/ACM Trans. Netw. 2015, 24, 583–595. [Google Scholar] [CrossRef]
- Zhu, X.; Jiang, Z.; Zhang, Q.; Zhao, S.; Zhang, Z. An Unknown Protocol Identification Method for Industrial Internet. Wirel. Commun. Mob. Comput. 2022, 2022, 3792205. [Google Scholar] [CrossRef]
- Wang, Y.C.; Bai, B.B.; Hei, X.H.; Ren, J.; Ji, W.J. Classification and Recognition of Unknown Network Protocol Characteristics. J. Inf. Sci. Eng. 2020, 36, 765. [Google Scholar]
- Liu, Z.; Zha, X.; Song, G.; Yao, Q. Unknown wireless network protocol feature extraction method based on sequence association. In Proceedings of the 2020 5th International Conference on Mechanical, Control and Computer Engineering (ICMCCE), Harbin, China, 25–27 December 2020; IEEE: Piscataway, NJ, USA, 2020; pp. 1916–1922. [Google Scholar]
- Wei, H. Research on Reverse Analysis Method for State Characteristics of Unknown Network Protocol; Xi’an University of Technology: Xi’an, China, 2023. [Google Scholar]
- Xue, J.; Chen, Y.; Li, O.; Li, F. Classification and identification of unknown network protocols based on CNN and T-SNE. J. Phys. Conf. Ser. IOP Publ. 2020, 1617, 012071. [Google Scholar] [CrossRef]
- Garshasbi, J.; Teimouri, M. CNNPRE: A CNN-Based Protocol Reverse Engineering Method. IEEE Access 2023, 11, 116255–116268. [Google Scholar] [CrossRef]
- Fu, Y.; Li, X.; Li, X.; Zhao, S.; Wang, F. Clustering unknown network traffic with dual-path autoencoder. Neural Comput. Appl. 2023, 35, 8955–8966. [Google Scholar] [CrossRef]
- Wu, J.; Hong, Z.; Ma, T.; Si, J. Unknown application layer protocol recognition method based on deep clustering. China Commun. 2024, 21, 275–296. [Google Scholar]
- Huang, C.; Zhu, Z. Complex communication application identification and private network mining technology under a large-scale network. Neural Comput. Appl. 2021, 33, 3871–3879. [Google Scholar] [CrossRef]
- Feng, W.; Hong, Z.; Wu, L.; Li, Y.; Lin, P. Application layer protocol recognition method based on convolutional neural networks. Comput. Appl. 2019, 39, 3615–3621. [Google Scholar]
- Mrdovic, S.; Drazenovic, B. KIDS–Keyed Intrusion Detection System. In Proceedings of the Detection of Intrusions and Malware, and Vulnerability Assessment: 7th International Conference, DIMVA 2010, Bonn, Germany, 8–9 July 2010; Proceedings 7. Springer: Berlin/Heidelberg, Germany, 2010; pp. 173–182. [Google Scholar]
- Goo, Y.-H.; Shim, K.-S.; Lee, M.-S.; Kim, M.-S. A message keyword extraction approach by accurate identification of field boundaries. Int. J. Netw. Manag. 2021, 31, e2140. [Google Scholar] [CrossRef]
- He, K.; Zhang, X.; Ren, S.; Sun, J. Deep residual learning for image recognition. In Proceedings of the IEEE Conference on Computer Vision and Pattern Recognition, Las Vegas, NV, USA, 27–30 June 2016; pp. 770–778. [Google Scholar]
- Rosay, A.; Cheval, E.; Carlier, F.; Leroux, P. Network intrusion detection: A comprehensive analysis of CIC-IDS2017. In Proceedings of the 8th International Conference on Information Systems Security and Privacy, Online, 9–11 February 2022; SCITEPRESS-Science and Technology Publications. pp. 25–36. [Google Scholar]
Disclaimer/Publisher’s Note: The statements, opinions and data contained in all publications are solely those of the individual author(s) and contributor(s) and not of MDPI and/or the editor(s). MDPI and/or the editor(s) disclaim responsibility for any injury to people or property resulting from any ideas, methods, instructions or products referred to in the content. |
© 2025 by the authors. Licensee MDPI, Basel, Switzerland. This article is an open access article distributed under the terms and conditions of the Creative Commons Attribution (CC BY) license (https://creativecommons.org/licenses/by/4.0/).