Abstract
High-quality processes, characterized by low defect rates, typically exhibit an exponential distribution for time-between-events (TBE) data. To effectively monitor TBE data, one-sided exponential Adaptive Exponentially Weighted Moving Average (AEWMA) schemes are introduced. However, the run length (RL) distribution varies with the magnitude of the process mean shift, rendering the median run length (MRL) a more pertinent performance metric. This paper investigates the RL properties of one-sided exponential AEWMA schemes using a Markov chain method. An optimal design procedure based on MRL is developed to enhance the one-sided exponential AEWMA scheme. Comparative analyses reveal that the one-sided exponential AEWMA scheme provides better balanced protection against both minor and major shifts in the process mean compared to EWMA-type and Shewhart schemes. Finally, two practical case studies illustrate the application of AEWMA schemes in manufacturing.
1. Introduction
Quality control is essential for manufacturing and service industries to ensure product qualify and enhance operational efficiency [1]. Statistical process control (SPC) serves as a critical tool in ensuring product quality by monitoring and controlling the state of processes [2]. Among various SPC tools, monitoring schemes are extensively used to identify shifts in process parameters. Conventional monitoring schemes, like the Shewhart-type scheme, are efficient at detecting large shifts but are typically less sensitive to small or moderate shifts. To address this limitation, advanced memory-type monitoring schemes such as the Exponentially Weighted Moving Average (EWMA) [3] and the Cumulative Sum (CUSUM) [4] schemes, which incorporate historical information from previous observations, have been developed. The EWMA scheme is especially adept at identifying minor to moderate changes in process parameters, owing to its method of integrating historical data with a focus on more recent measurements. The EWMA statistic calculates a weighted average of previous data values, giving higher weight to the most recent observations. The effectiveness of the EWMA scheme largely depends on the selection of the smoothing parameter, , which is often fine-tuned for optimal detection of a particular magnitude of shift [5,6,7]. However, when the actual shift size differs from the expected one, the performance of the EWMA scheme can be significantly impacted.
To overcome this limitation, adaptive EWMA (AEWMA) schemes have been proposed. AEWMA schemes adjust the smoothing parameter dynamically based on the observed data, thereby providing better performance across a range of shift sizes. This adaptability makes AEWMA schemes more robust and versatile in various industrial settings. For example, Capizzi and Masarotto (see [8]) introduced the concept of adaptive EWMA schemes, demonstrating their enhanced capability to identify various magnitudes of shifts. Shu (see [9]) introduced an AEWMA scheme to surveil the shift in process variance, showing its effectiveness in various scenarios. Tang et al. (see [10]) developed a variable sampling interval (VSI) AEWMA scheme, which further improved the detection performance by adjusting the sampling intervals dynamically. Ugaz et al. (see [11]) presented an AEWMA-S2 scheme with an adaptive smoothing parameter, aimed at overcoming the inefficiency of traditional schemes in detecting various shifts. Zaman et al. (see [12]) developed an AEWMA scheme based on the Hampel function, providing a robust approach to detect changes in the process location.
High-quality processes are distinguished by minimal defect rates, often measured in parts per million (ppm) or as low as parts per billion (ppb) [13]. These processes are prevalent in industries such as semiconductor manufacturing, healthcare, and earthquake monitoring [14]. Traditional monitoring schemes, which assume a normal distribution, are not well-suited for monitoring processes with strictly positive variables due to issues such as high false alarm rates and the appearance of negative lower control limits (LCL). These issues can lead to misleading assessments of process stability and performance [15]. To address these challenges, specialized monitoring schemes have been developed. One common approach is to employ time-between-events (TBE) monitoring schemes, which focus on the time intervals between consecutive events, such as defects or failures. TBE data are typically modeled using a skewed distribution, such as the exponential distribution [16,17], which is a natural fit for the inter-arrival times of a homogeneous Poisson process [18]. Gan (see [19,20]) proposed the one- and two-sided exponential EWMA schemes. Pehlivan and Testik (see [21]) investigated the robustness of the exponential EWMA scheme when the TBE data deviate from an exponential distribution. Hu et al. (see [22]) proposed an AEWMA scheme for monitoring the TBE based on the Gamma distribution. They found that the proposed scheme exhibited a superior average run length (ARL) compared to existing monitoring schemes across various shift sizes.
Most studies on exponential schemes focus on the ARL as the primary performance metric. However, the ARL alone can be misleading because the shape of run length (RL) distribution alters depending on the size of the shift. Notably, the RL distribution for the exponential EWMA scheme tends to be skewed, particularly under in-control conditions [23]. This skewness can affect the interpretation of the scheme’s performance, making it important to consider additional metrics or the entire distribution of RL when evaluating monitoring scheme effectiveness. In such cases, the median run length (MRL) offers a more insightful measure of scheme performance [24]. The optimization of monitoring schemes involves selecting the best parameters to achieve desired performance metrics. For traditional monitoring schemes, this often involves minimizing the ARL for a specific shift size. However, as discussed earlier, the ARL alone may not provide a complete picture of scheme performance, especially for skewed RL distributions. Therefore, optimizing monitoring schemes based on MRL has gained increasing attention in recent years. Maravelakis et al. (see [25]) studied the RL properties of run rules EWMA schemes by employing integral equations, providing a theoretical foundation for optimizing these schemes. Tang et al. (see [26]) proposed an optimal design procedure for the AEWMA scheme based on MRL, showing that the resulting schemes performed uniformly better than traditional EWMA schemes.
Motivated by the fact that AEWMA schemes can provide more balanced monitoring performance compared to traditional EWMA schemes [22], and that MRL is a more reasonable performance metric for exponential monitoring schemes [24], this paper aims to develop an optimized design for one-sided exponential AEWMA schemes using MRL as the performance metric. The RL properties are investigated using a Markov chain approach, in considering the two cases of upper-sided and lower-sided schemes. The optimal design procedures, in terms of MRL, are proposed for a range of mean parameter shift. The performance of the proposed schemes is assessed and compared to existing monitoring schemes using MRL.
The remainder of this paper is structured as follows: In Section 2, the proposed one-sided exponential AEWMA scheme is introduced. The Markov chain models are used to investigate the RL properties of the proposed schemes in Section 3. The optimal design procedures for the MRL-based one-sided exponential AEWMA schemes are presented in Section 4. In Section 5, the performance of the proposed schemes with existing ones is compared. Two practical case studies are shown in Section 6. Finally, the conclusion and the suggested directions for future study are given in Section 7.
2. Exponential Monitoring Schemes for TBE Data
2.1. Exponential Distribution
Suppose the t-th sample of TBE variable is . Each is independent and exponentially distributed, characterized by a mean of , denoted as . The probability density function (p.d.f.) and cumulative distribution function (c.d.f.) of the random variable are, respectively,
When the process is in-control, . For convenience of study, the random variable is standardized using to obtain ,
where , . According to [27], , and its c.d.f. is given by:
In this study, our primary objective is to detect any deviation in the parameter from its in-control value, denoted as . When the process shifts out-of-control, an increase in is signaled by a coefficient , whereas a decrease is indicated by . It is assumed that is known a priori. However, if this parameter is unknown, it must be estimated using in-control samples gathered during Phase II of the process. Future studies should delve into the influence of parameter estimation on the efficacy and reliability of the monitoring schemes.
2.2. One-Sided Exponential EWMA Schemes for TBE Data
In the context of the exponential EWMA scheme, the implementation of two independent one-sided control charts is recommended, detailed below:
- To detect an increase in the process parameter , the upper-sided exponential EWMA schemes monitoring statistic for the tth sample iswhere the smoothing parameter is a fixed value. The reflecting boundary and starting value are suggested to be set to and 1, respectively [24].
- To detect a decrease in the process parameter , the lower-sided exponential EWMA schemes monitoring statistic for the tth sample iswhere the smoothing parameter is a fixed value. The reflecting boundary and starting value are suggested to be set and 1, respectively [24].
An out-of-control signal is alarmed when , where is the upper (lower) control limit of the scheme. When the smoothing parameter is larger, it indicates that the current sample is given more weight. In particular, when , the scheme simplifies to a Shewhart-type scheme.
2.3. One-Sided Exponential AEWMA Schemes for TBE Data
For one-sided exponential EWMA schemes, using a small smoothing parameter can quickly detect small process shifts, whereas a larger is necessary for sudden large shifts to increase the weight of the current sample statistic and enhance the scheme’s detection capability for large shifts. According to Capizzi and Masarotto (see [8]), a fixed-parameter EWMA scheme cannot simultaneously ensure optimal performance for different sizes of process shifts. Therefore, the AEWMA scheme is recommended to monitor various shifts in the process by adapting the parameter as a function of the prediction error, thereby providing a more balanced detection performance. Similar to the one-sided exponential EWMA scheme, two separated one-sided exponential AEWMA schemes are suggested as follows:
- An upper-sided exponential AEWMA scheme is suggested to detect an increase in the process parameter ,where is the tth statistic (the starting value ), and where is a score function. For simplicity, Huber’s score function is used, as suggested by Capizzi and Masarotto (see [8])where the threshold parameter .
- A lower-sided exponential AEWMA scheme is suggested to detect a decrease in the process parameter (),where is the tth statistic (the starting value ), and where is a score functionwhere the threshold parameter .
As k approaches infinity (), the AEWMA scheme reduces to the EWMA-type scheme. Conversely, as k approaches zero (), the AEWMA scheme reduces to the Shewhart-type scheme.
3. RL Properties of the One-Sided Exponential AEWMA Schemes
3.1. A Markov Chain Method to RL Properties
The performance of a monitoring scheme is typically evaluated by RL measures, such as ARL, MRL, and standard deviation of RL (SDRL), etc. In general, evaluating the RL properties of EWMA-type schemes can be accomplished through three primary methods: integral equations [25], which provide exact solutions but can be mathematically complex; Markov chain methods [28,29,30], which offer a flexible and computationally efficient approach; and Monte Carlo simulations [31,32], which are useful for obtaining empirical results and handling more complex scenarios. In this paper, a Markov chain model is developed to assess the RL and MRL performance of the proposed one-sided exponential AEWMA schemes. Without loss of generality, the in-control region is divided into N subintervals, labeled as . Each state of the Markov chain is defined by these subintervals, and the value of the corresponding one-sided exponential AEWMA statistic is approximated using the midpoint of each subinterval. The scheme statistic is considered to be in transient-state i if it falls within the i-th subinterval. If falls outside the control limits, it is considered to be in the absorbing-state, indicating that the process is out-of-control. Based on the above state space partition, a one-step transition probability matrix can be constructed as follows:
where is an identity matrix, and is a column vector of ones. The transient transition probability matrix contains the probabilities of transitioning from state i to state j.
For the upper-sided exponential AEWMA scheme, the in-control interval is divided into N subintervals, each subinterval , with a width of , where represents the center value of the ith subinterval:
The transient transition probability matrix is given by:
From Equation (8), it is known that is invertible, and its inverse function is invertible given by:
Since , its c.d.f. is given by Equation (4), and we have:
For the lower-sided exponential AEWMA scheme, the in-control interval is divided into N subintervals, each subinterval with a width of , where represents the center value of the ith subinterval:
Similarly, the transient transition probability matrix for the lower-sided exponential AEWMA scheme can be obtained, where
Assume the initial probability vector for the process is , where
As discussed in [33,34], the steps required for a Markov chain to reach the absorbing-state can be modeled as a Discrete Phase random variable, characterized by . The probability mass function (p.m.f.) and the c.d.f. of the RL distribution for the one-sided exponential AEWMA schemes are given by:
Finally, the ARL and MRL values of the proposed one-sided exponential AEWMA scheme can be computed as follows:
However, the Markov chain method can be computationally intensive due to the complexity involved in calculating the transient transition probability matrix . To address this issue, it is recommended to set the number of states N in to 300. This adjustment significantly enhances computational speed while incurring only a minimal loss in precision. Empirical studies have demonstrated that an N value of 300 provides a good balance between accuracy and efficiency, making it suitable for practical applications [35,36]. Furthermore, when calculating the MRL, it is suggested to employ the bisection method to improve computational efficiency.
3.2. Interpretation Problems of ARL
The RL of the one-sided exponential AEWMA scheme is distributed skewly. Figure 1 shows the p.d.f. curves for the RL distribution of the lower-sided exponential AEWMA scheme, where meets the in-control ARL () of 370, and the process mean shift . From Figure 1, it is evident that the RL distributions of the lower-sided exponential AEWMA scheme are significantly skewed under both in-control and out-of-control conditions.
Figure 1.
Several p.m.f. plots of the RL distribution of the lower-sided exponential AEWMA scheme when , .
In the in-control state, the discrepancy between and the in-control MRL () is large. However, the difference between the out-of-control ARL () and out-of-control MRL () decreases as the process mean shift increases. This suggests that the shape of the RL distribution for the lower-sided exponential AEWMA scheme evolves with the magnitude of the process mean shift, becoming increasingly symmetric as the shift grows larger.
Therefore, in the design of the one-sided exponential AEWMA scheme, using ARL as the sole indicator of the monitoring scheme’s statistical performance lacks consideration of the bias in the RL distribution. The interpretation based on ARL differs for the two cases where the RL distribution is either symmetric or highly biased. Using MRL as the statistical performance indicator for the one-sided exponential AEWMA scheme is more intuitive and reasonable.
4. Design Procedures of the One-Sided Exponential AEWMA Scheme
4.1. The Joint Effect of Parameter and k
To investigate the performance of the one-sided exponential AEWMA scheme, it is necessary to select the parameters or . This paper will use the MRL as the performance metric to study the effects of parameters and k on the performance of the scheme. When and , Figure 2 provides the contour plot of values for the lower-sided exponential AEWMA scheme. From Figure 2, it can be observed that near the optimal parameter value of the scheme, the value is also smaller. When monitoring smaller process mean shifts (e.g., ), the value tends to increase as k decreases; on the other hand, when monitoring larger process mean shifts (e.g., ), the value decreases as k decreases.
Figure 2.
Contour plot of values for the lower-sided exponential AEWMA scheme when .
When and , Figure 3 provides the contour plot of values for the upper-sided exponential AEWMA scheme. Similarly, near the optimal parameter value of the upper-sided exponential AEWMA scheme, the value of the scheme is also smaller, and the value generally increases as k decreases.
Figure 3.
Contour plot of values for the upper-sided exponential AEWMA scheme when .
4.2. Optimal Design Procedures
Capizzi and Masarotto (see [8]) transformed the multi-objective optimization problem into a progressive optimization problem for two different shift sizes using a hierarchical and weighted approach, providing an optimization algorithm for the AEWMA scheme based on ARL. However, this algorithm is complex and computationally intensive. Shu (see [9]) introduced a sequential search method to determine the approximate optimal parameters for the AEWMA scheme, which is both simpler and requires less computational effort. In this study, we also employ this sequential search method for the one-sided exponential AEWMA scheme. The optimization design procedures are outlined as follows:
- Determine the required , the small process mean shift , and the large process mean shift .
- For the given small shift , under the constraint of , determine the corresponding smoothing parameter for the optimal one-sided exponential AEWMA scheme.
- Select a small constant to constrain the performance loss that might result from introducing the threshold parameter k at the shift .
- Set the smoothing parameter obtained in step 2 for the one-sided exponential AEWMA scheme.
- Given the constraint that the percentage increase in for the one-sided exponential AEWMA scheme monitoring the small shift is less than , find the threshold parameter k and that minimize the value for the large shift .
The optimal design procedures, though computationally demanding, can be effectively employed in industrial production by pre-optimizing parameters for specified , , and . This facilitates the pre-determination of optimal parameters, which can then be directly integrated into production monitoring systems. With these parameters in place, computational efficiency is greatly enhanced, ensuring the approach is well-suited for real-time monitoring in industries with critical timing constraints.
5. Comparisons of the Performance
This section employs MRL as the performance metric to evaluate and compare the effectiveness of one-sided exponential AEWMA, EWMA, and Shewhart schemes. Table 1 and Table 2 provide the optimized parameters and corresponding for lower-sided exponential monitoring schemes designed to monitor downward shifts, with set at . For the lower-sided exponential AEWMA scheme, the parameters are optimized for the shift range , where smaller process mean shifts and larger shifts . Similarly, the parameters for the lower-sided exponential EWMA scheme are optimized for the shift size , while the parameter for the lower-sided exponential Shewhart scheme is constrained to achieve the desired . For instance, in Table 2, when , , and , the optimized parameters for the lower-sided exponential AEWMA scheme are derived using the optimization procedure outlined in Section 4.
Table 1.
The optimal parameters and for the lower-sided exponential AEWMA, EWMA, Shewhart scheme when .
Table 2.
The optimal parameters and for the lower-sided exponential AEWMA, EWMA, Shewhart scheme when .
The tables demonstrate that the lower-sided exponential AEWMA scheme consistently delivers robust performance across various shift sizes. For smaller mean shifts in the production process, the lower-sided exponential AEWMA scheme performs comparably to the EWMA scheme but significantly outperforms the Shewhart scheme. For example, in Table 1, when , , and , if the current process mean shift , the of the lower-sided exponential Shewhart scheme is 160, while the for the lower-sided exponential AEWMA and EWMA schemes are both 43. This indicates that both exponential EWMA-type schemes can detect process mean shifts much more rapidly than the Shewhart scheme. In contrast, for moderate shifts such as , the of the lower-sided exponential AEWMA and EWMA schemes are 17 and 23, respectively, highlighting the AEWMA scheme’s superior effectiveness over the EWMA scheme. Only for substantial shifts () does the exponential Shewhart scheme marginally outperform the AEWMA and EWMA schemes in detecting downward shifts. The robustness of the AEWMA scheme is particularly notable, as it maintains consistent performance across a wide range of shift sizes. Unlike the Shewhart scheme, which performs better only for very large shifts, the AEWMA scheme exhibits superior sensitivity for both small and moderate shifts, making it a more dependable choice for practical applications. Additionally, Table 3 and Table 4 provide analogous comparisons for upper-sided exponential monitoring schemes, further emphasizing the AEWMA scheme’s robust performance in detecting upward shifts.
Table 3.
The optimal parameters and for the upper-sided exponential AEWMA, EWMA, Shewhart scheme when .
Table 4.
The optimal parameters and for the upper-sided exponential AEWMA, EWMA, Shewhart scheme when .
6. Two Illustrative Examples
To showcase the practical application of the monitoring scheme proposed in this paper, we employ two diverse datasets. The first dataset originates from OLED production, where precise monitoring is crucial for maintaining high-quality standards in advanced display technology [37]. The second dataset comprises data from mining accidents, highlighting the importance of effective monitoring in safety-critical environments to promptly detect anomalies and prevent potential disasters [38].
6.1. Example 1
Using the example from the study by Qu et al. (see [37]), consider a production process for OLED components to illustrate the application of the optimized lower-sided exponential AEWMA scheme based on MRL. The dataset consists of 30 intervals of failure times from accelerated life tests in the OLED production process. Assuming an exponential distribution but with unknown parameters, the bootstrap method was employed to estimate the process mean using the first 10 data points (see Table 5). The remaining 20 data points (see Table 6) were reserved for testing purposes.
Table 5.
Phase I samples (in minutes) of the intervals of failure times from accelerated life tests in the OLED production line.
Table 6.
Phase II samples (in minutes) and corresponding monitoring statistics , and of the optimal lower-sided exponential schemes for the OLED production process.
To achieve a robust estimation of the process mean, the initial 10 data points were used to compute the maximum likelihood estimate (MLE) of the process mean . Subsequently, the bootstrap method [39,40] was utilized to generate multiple resamples from these 10 data points. For each resample, the MLE of was calculated, thereby constructing a distribution of estimates. Based on this distribution, the confidence interval for was determined as . This approach allowed for a more accurate and reliable estimation of the process mean while accounting for the variability inherent in the data.
The factory employs an optimal lower-sided exponential AEWMA scheme to monitor downward shifts in the process mean. Suppose the process mean shift to be monitored is within , and the acceptable is 300. The parameters for the optimal lower-sided exponential AEWMA scheme can be obtained through the design steps in Section 4. Then, multiplying , k, and by yields the reflection boundary , threshold parameter , and lower control limit for the optimal lower-sided exponential AEWMA scheme:
The monitoring statistic for the optimal lower-sided exponential AEWMA scheme in the OLED production process can be calculated using Equation (9) (see Table 6).
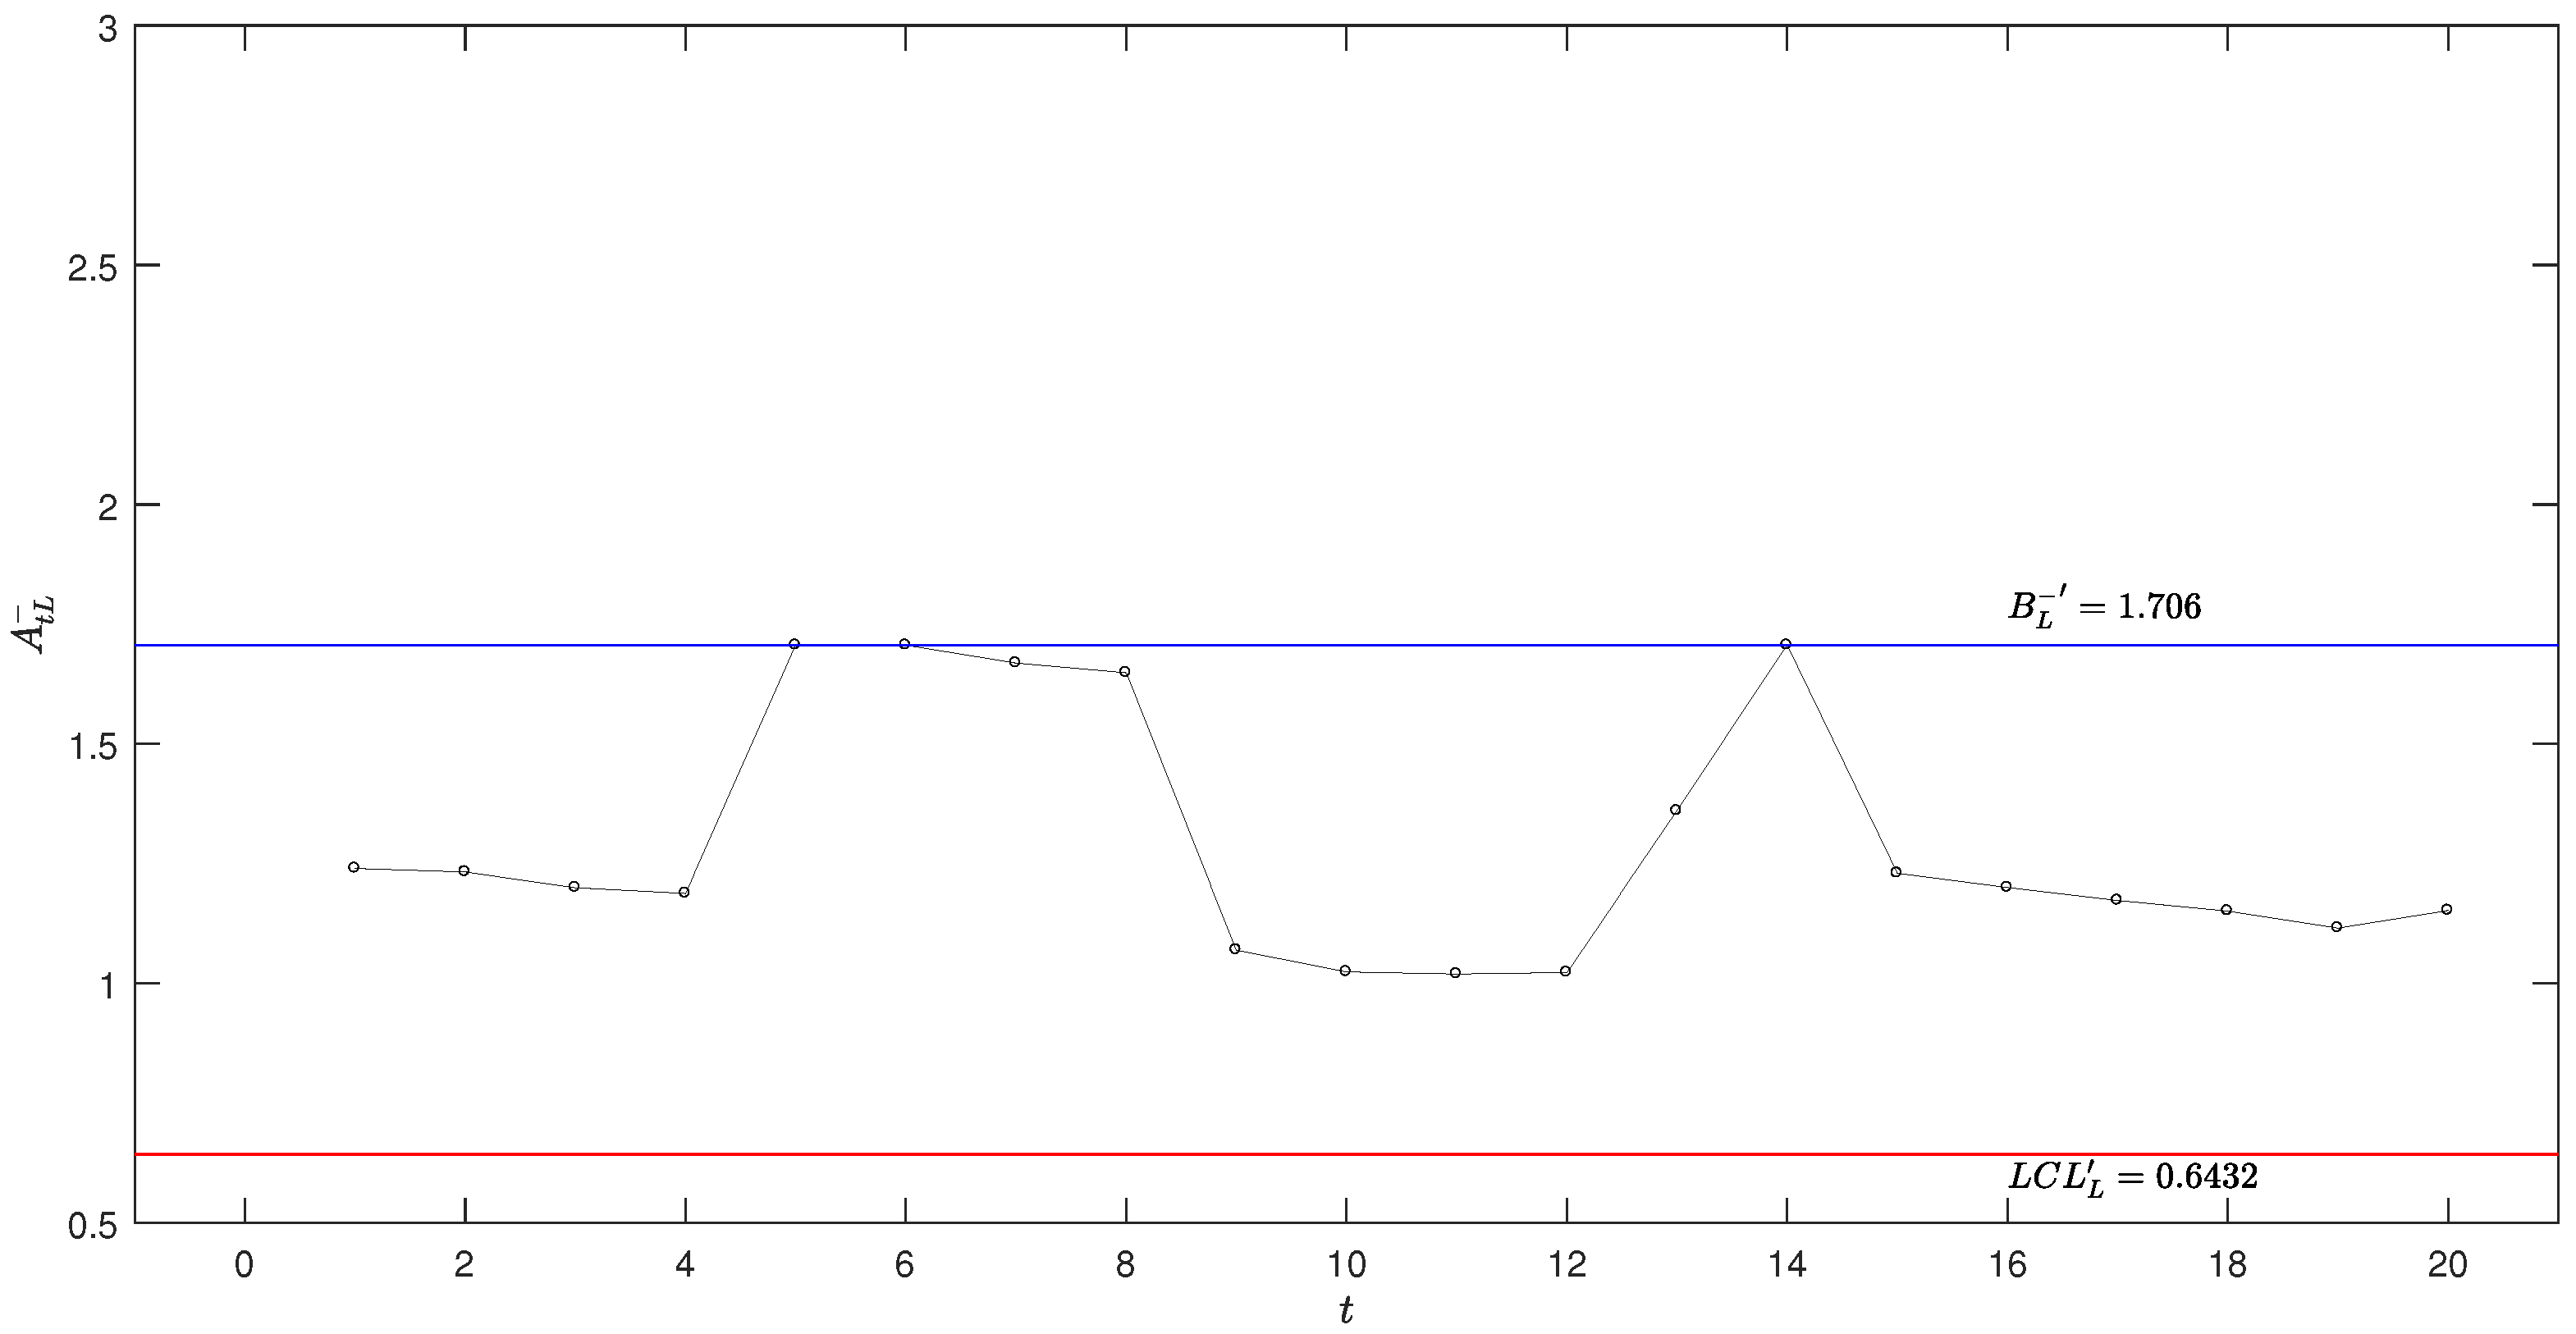
To enhance the robustness of the monitoring scheme and address the uncertainty in estimating the process mean, the low bound of the bootstrap confidence interval, , was used to recalculate the adjusted parameters , , and . These adjusted parameters offer a more cautious estimation of the control limits, ensuring that the monitoring scheme remains effective if the true process mean exceeds initial estimates. The recalculated parameters are as follows:
The AEWMA statistic is then calculated using Equation (9), with the updated parameters (refer to Table 6 for details).
Furthermore, to facilitate a comparative analysis with the existing EWMA-type and Shewhart-type schemes in practical applications, we consider the case where and . The optimal parameters for the EWMA-type scheme were obtained from Table 1, which are . Subsequently, and were multiplied by the scaling factor , resulting in and . The corresponding optimal EWMA scheme statistic can be computed using the Equation (6) (see Table 6).
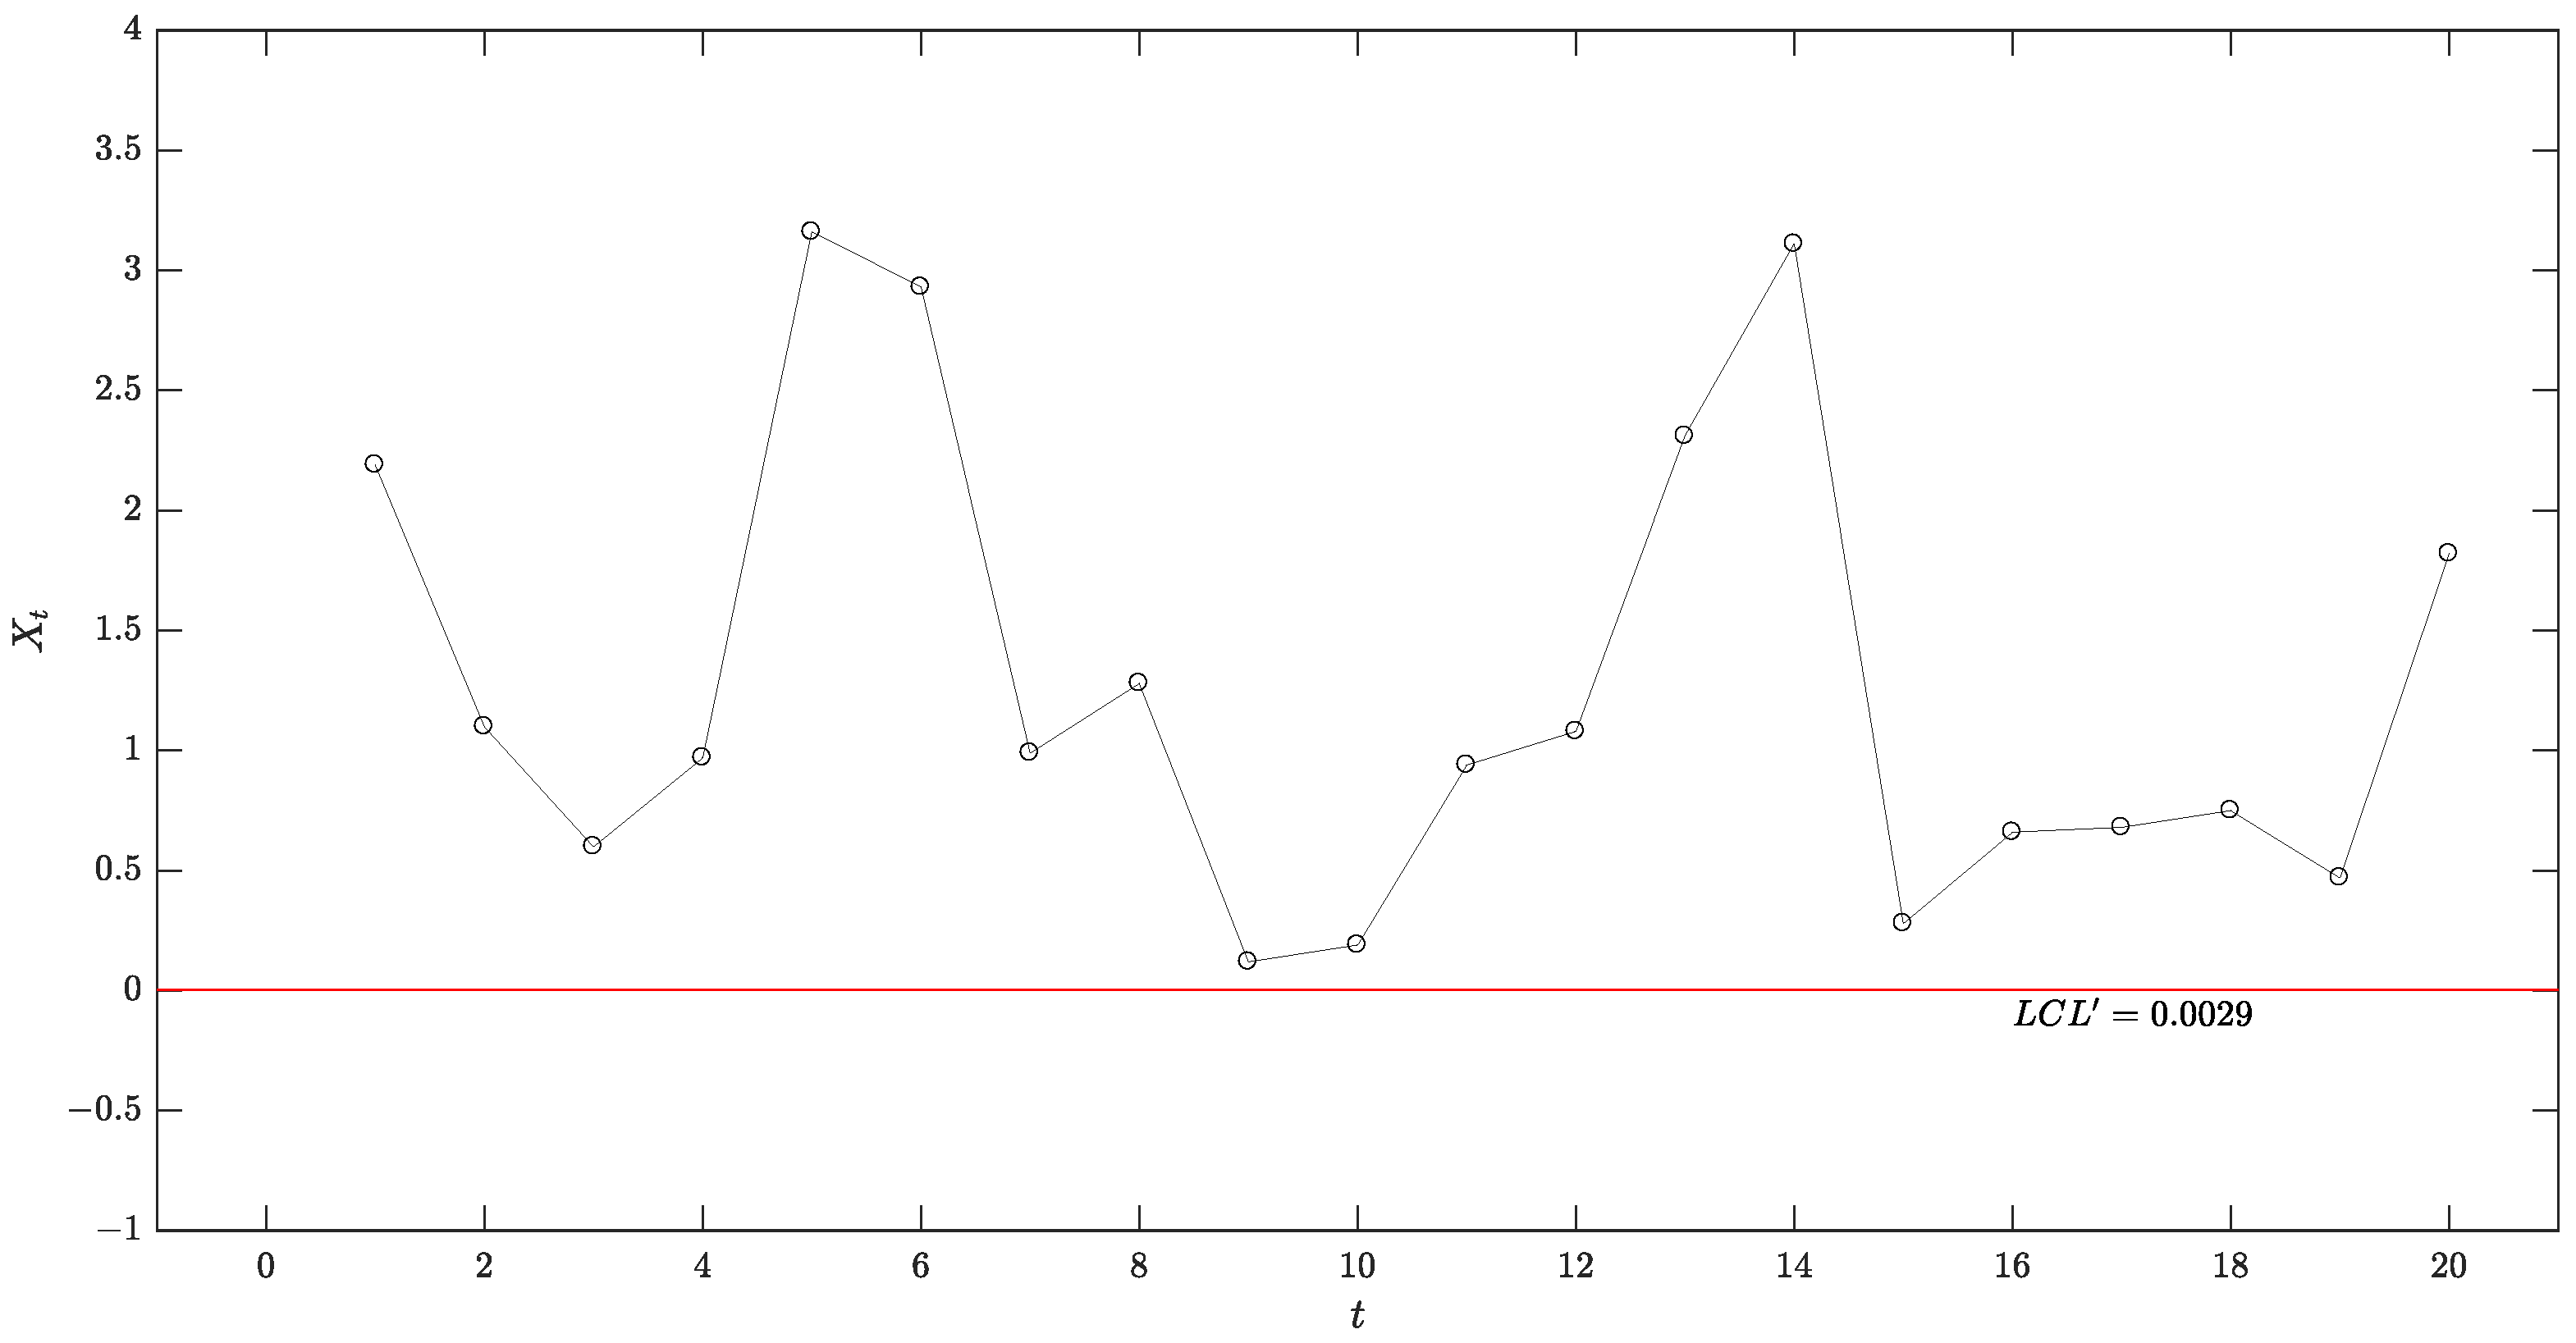
For the Shewhart-type scheme, the control limit was set at to satisfy . After multiplying this value by the scaling factor , the adjusted lower control limit is calculated as .
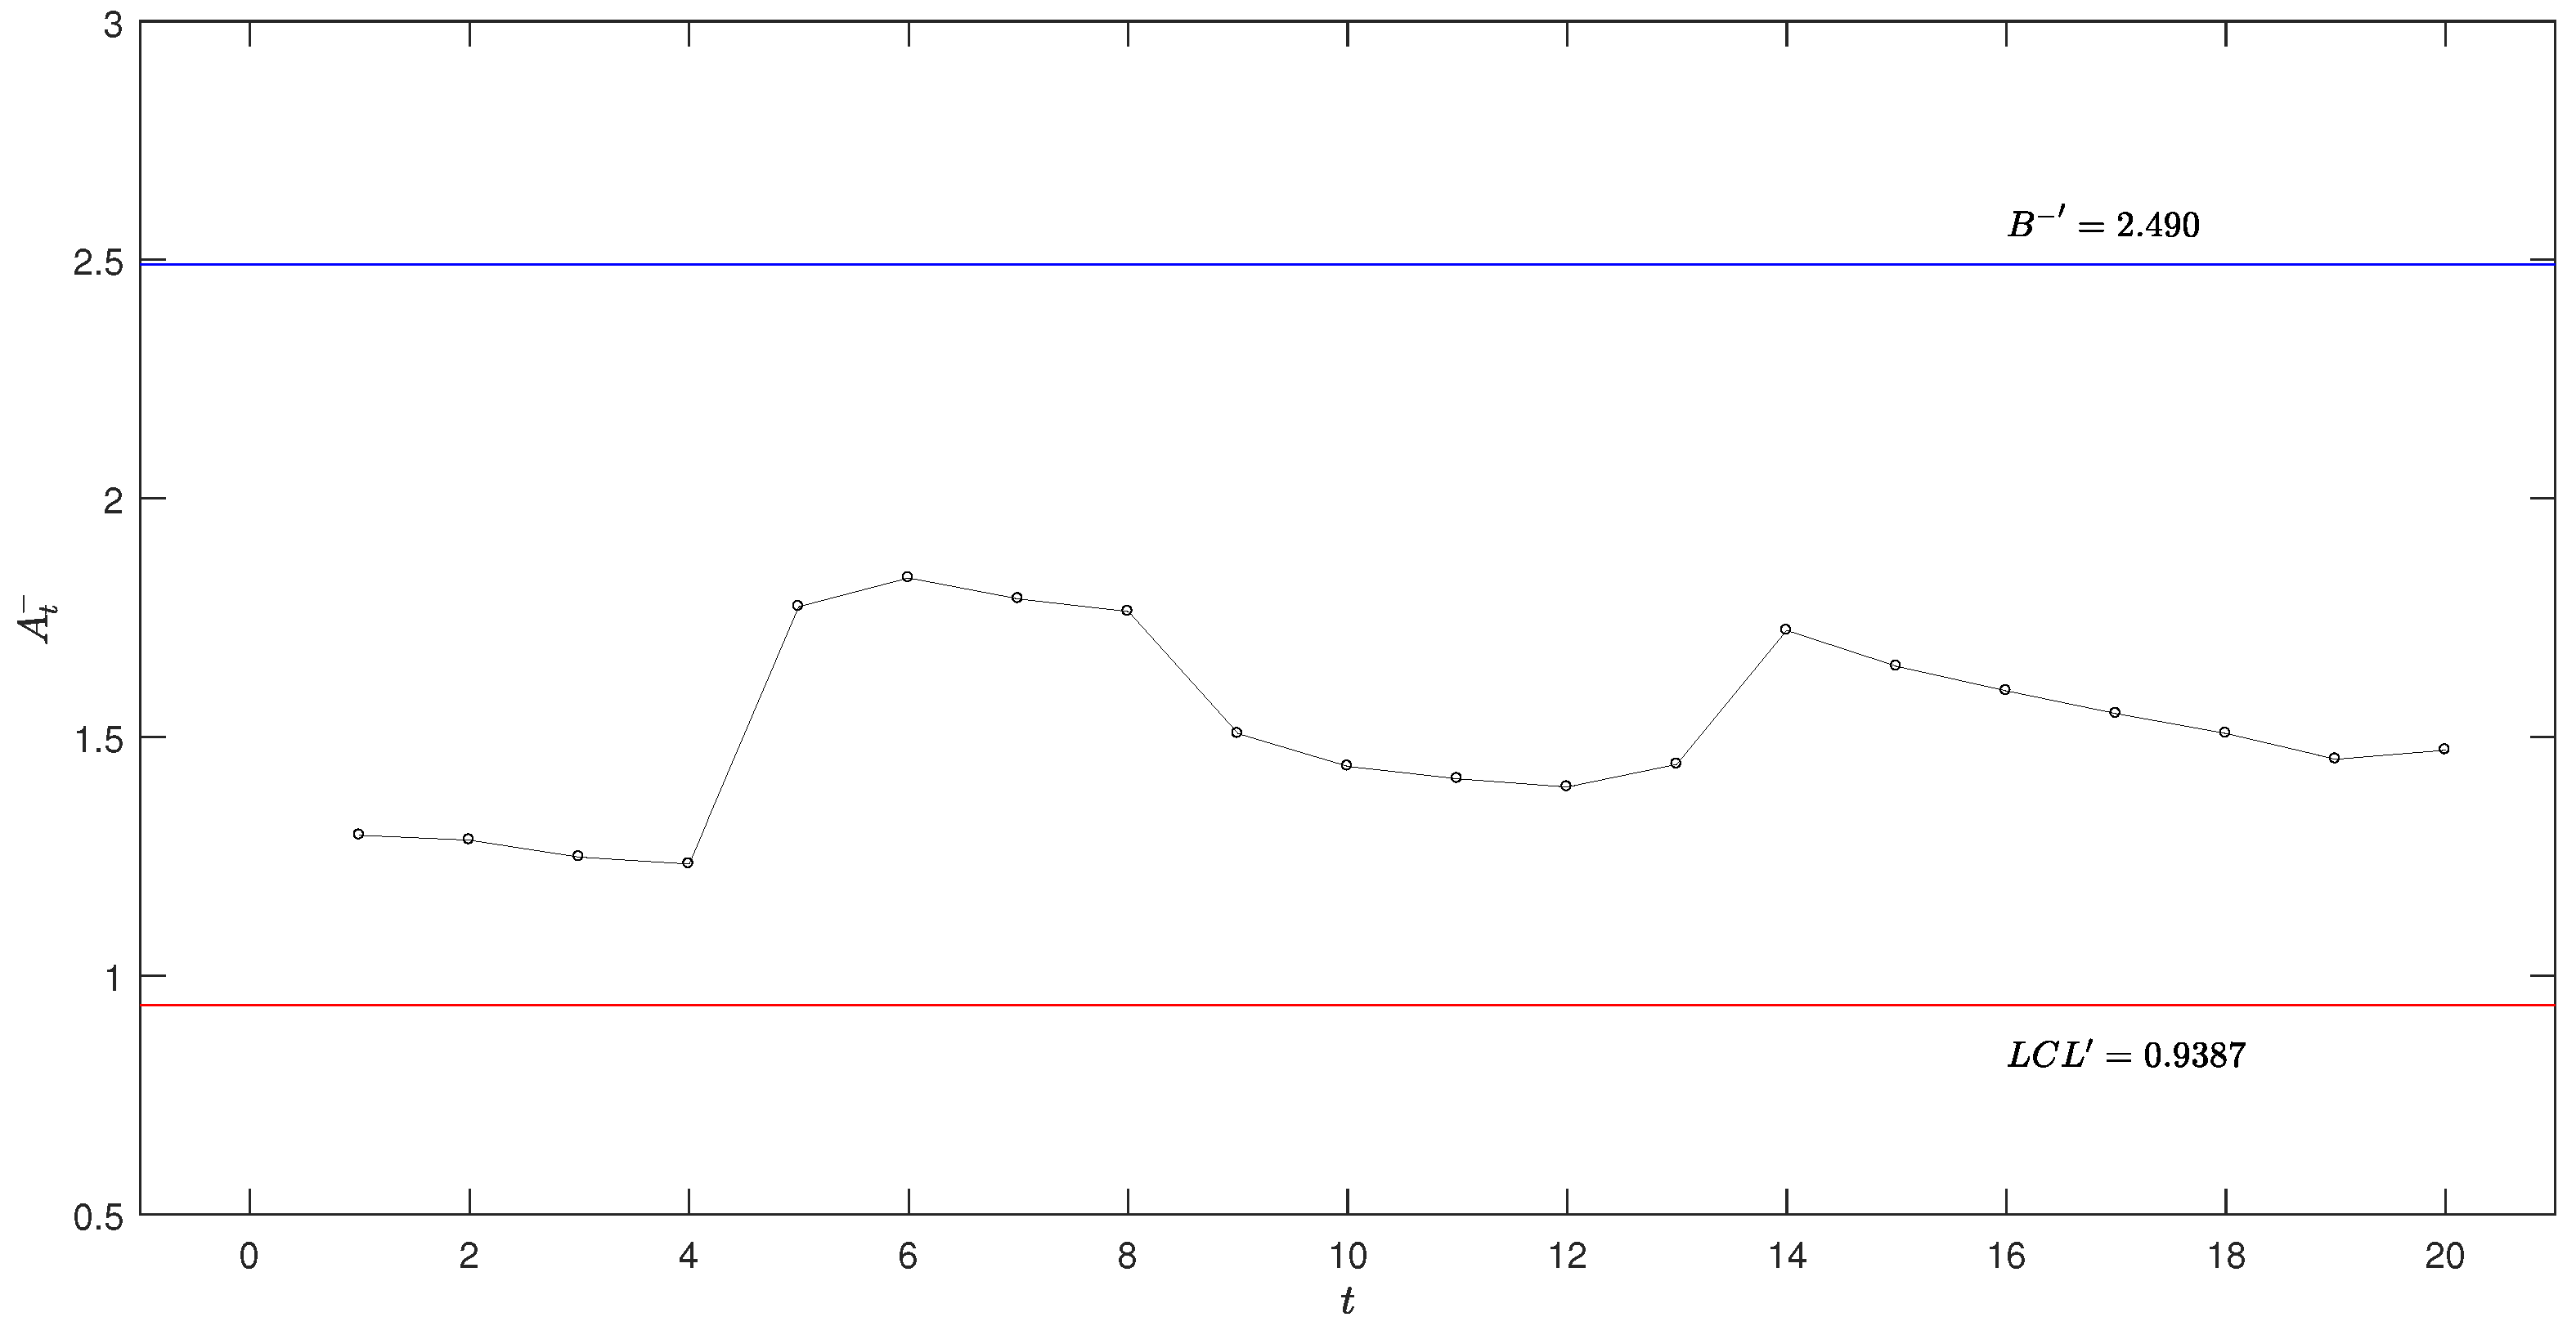
Observations from the data indicate that until , , suggesting that the prediction error is relatively small during this period, and the performance of the AEWMA scheme closely resembles that of the EWMA scheme. After , the prediction error increases, leading to . This suggests that the AEWMA scheme may better accommodate larger shifts in the process mean after this point.
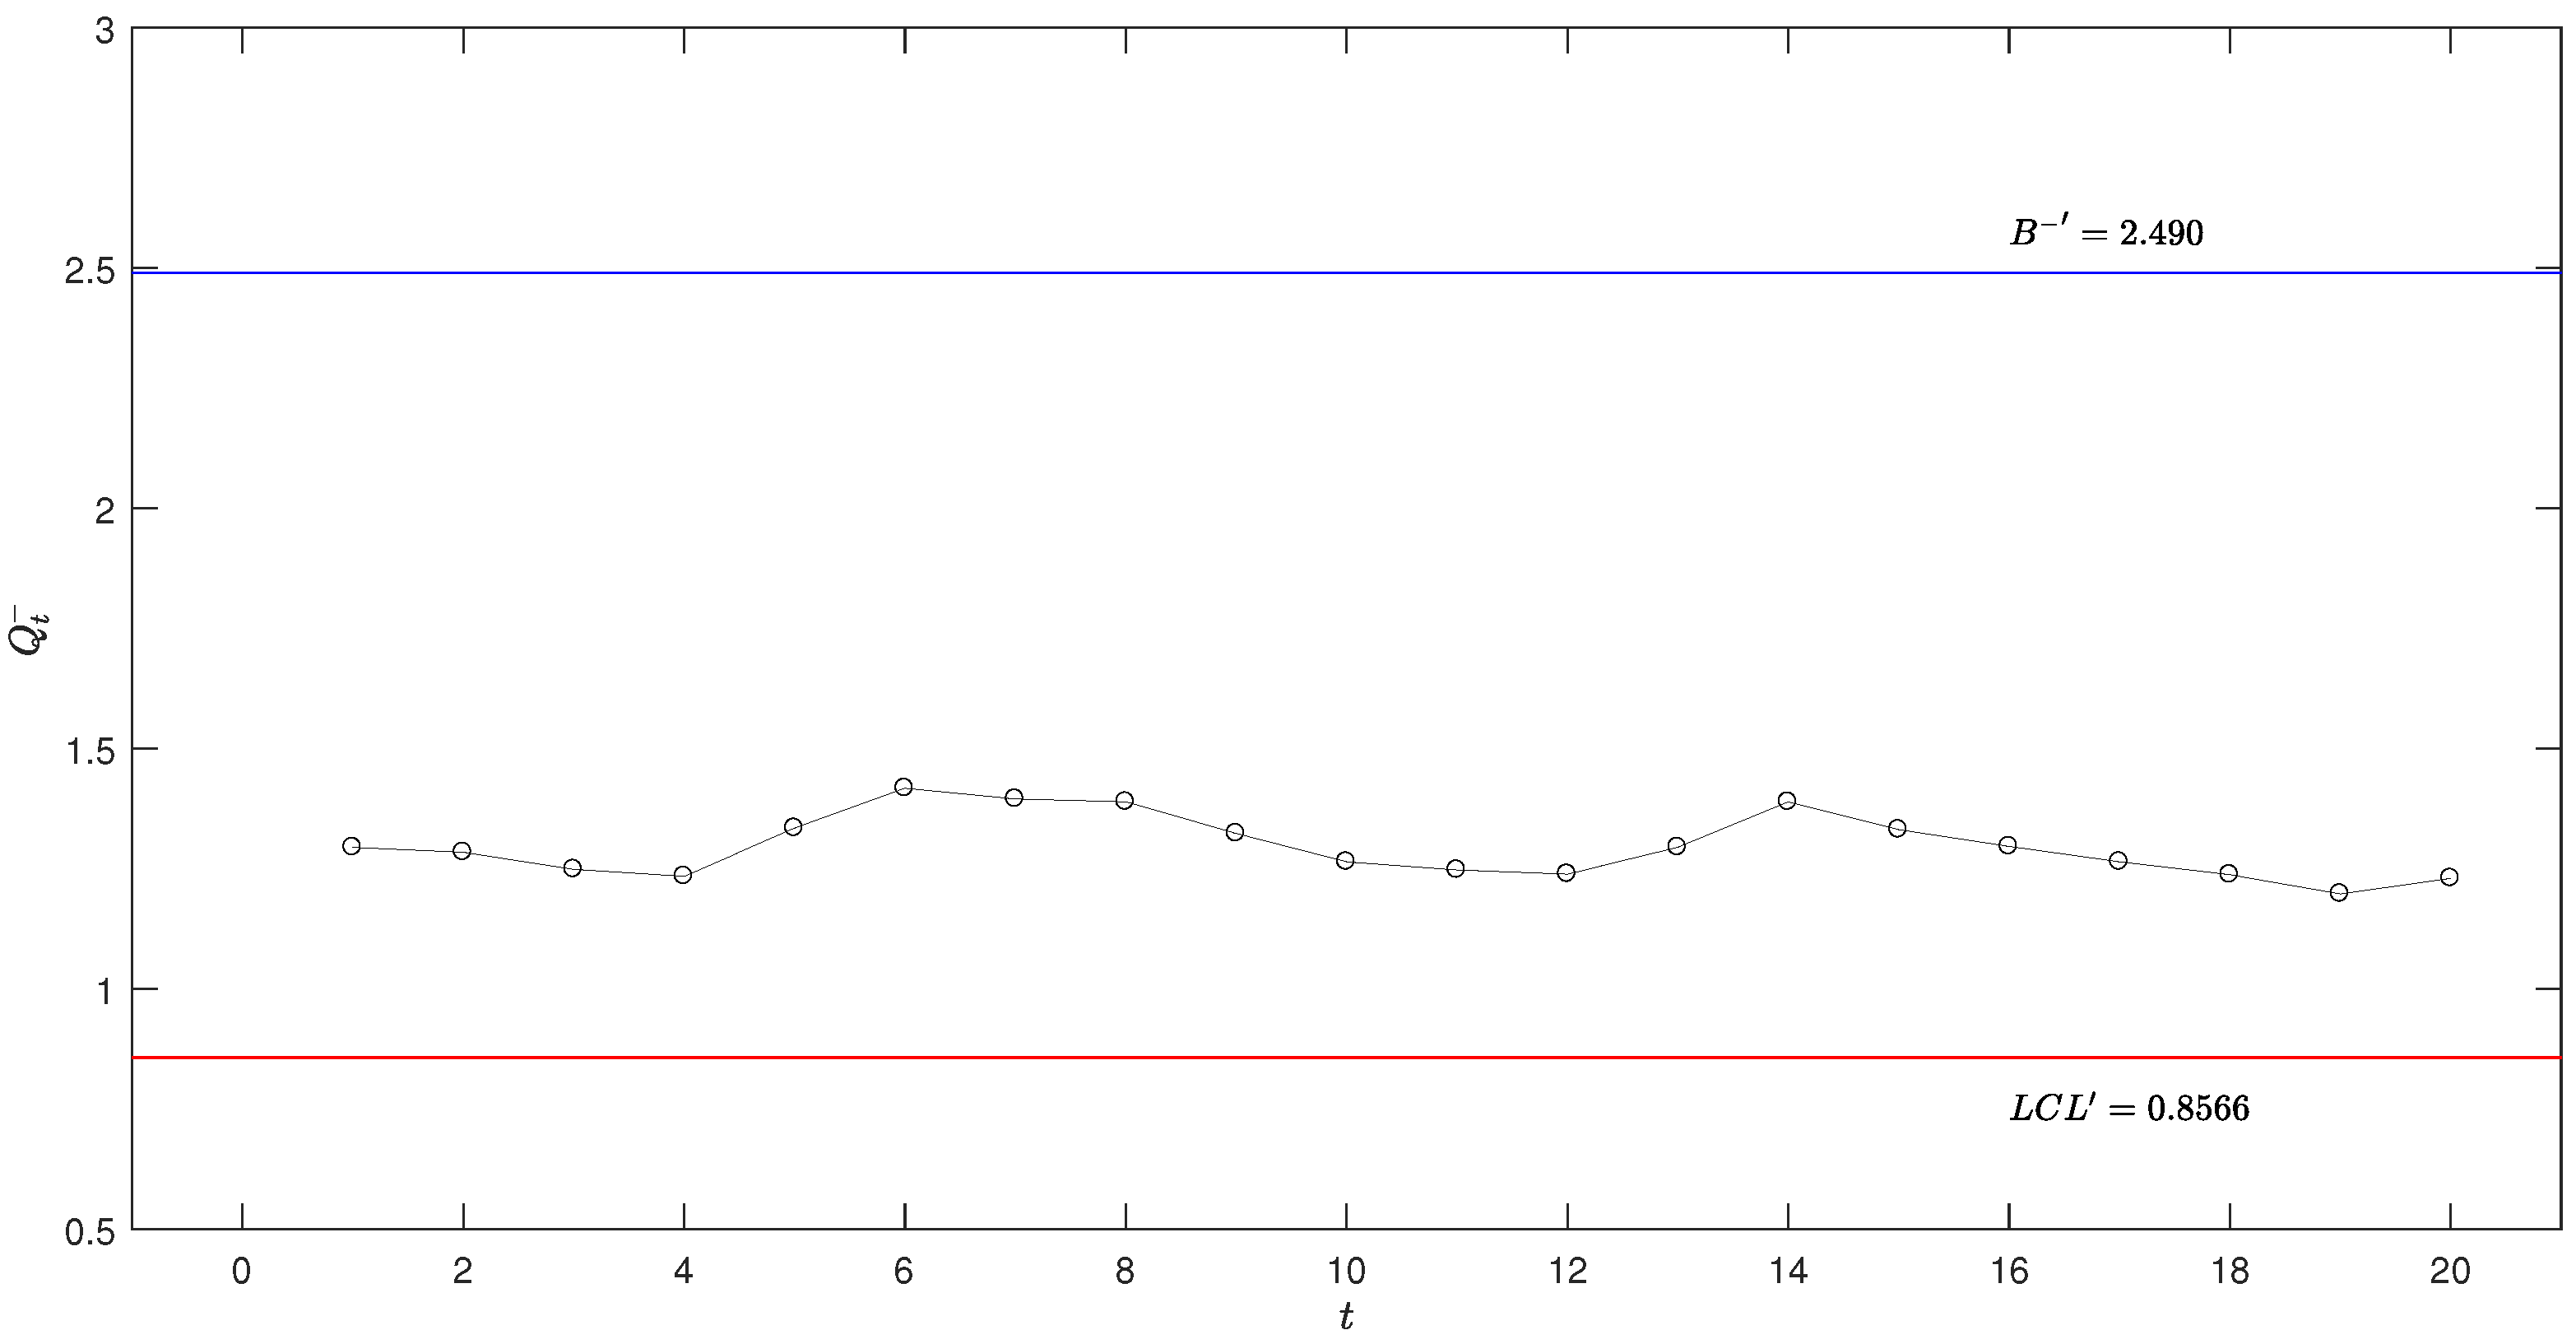
Figure 4, Figure 5, Figure 6 and Figure 7 illustrate the application of these schemes in the OLED production process monitoring, respectively. As shown in these figures, no alarm signals are generated across all three schemes, indicating that the process remains in-control throughout the monitoring period. As depicted in Figure 5, some sample statistics fall within the reflection boundaries , suggesting that the probability of the system’s estimated parameters reaching is relatively low.
Figure 4.
Optimal lower-sided exponential AEWMA scheme in the OLED production process.
Figure 5.
Adjusted optimal lower-sided exponential AEWMA scheme in the OLED production process.
Figure 6.
Optimal lower-sided exponential EWMA scheme in the OLED production process.
Figure 7.
Lower-sided exponential Shewhart scheme in the OLED production process.
6.2. Example 2
The dataset introduced by Jarrett includes the time intervals between coal mine explosions occurring from 15 March 1851, to 22 March 1962, measured in days [38]. Assuming an exponential distribution with unknown parameters, the bootstrap method was used to estimate the process mean using the first 160 data points (see Table 7). The remaining 30 data points (see Table 8) were reserved for testing purposes. To obtain a robust estimate of the process mean, the initial 160 data points were employed to compute the MLE, yielding . Subsequently, the bootstrap method generated multiple resamples from these data points. For each resample, the MLE of was recalculated, thereby forming a distribution of estimates. Based on this distribution, the confidence interval for was determined as .
Table 7.
Phase I samples (in days) of explosions in mines from 15 March 1851 to 22 March 1962.
Table 8.
Phase II samples (in days) and corresponding monitoring statistics , and of the optimal upper-sided exponential schemes for the explosions in mines.
To effectively monitor and promptly detect upward shifts in the process mean, an optimally designed upper-sided AEWMA scheme is implemented, utilizing MRL as the performance metric. This approach enhances the sensitivity of the monitoring scheme in identifying potential increases in event frequency, thereby facilitating timely intervention and improving safety monitoring in critical environments.
The current monitoring objective focuses on detecting shifts in the process mean within the range , with an in-control MRL () of 200. Following the optimization procedure detailed in Section 4, the optimal parameters for the upper-sided monitoring scheme are determined to be . For practical implementation, these parameters are scaled by , yielding the adjusted parameters , , and . Specifically, the adjusted parameters are computed as:
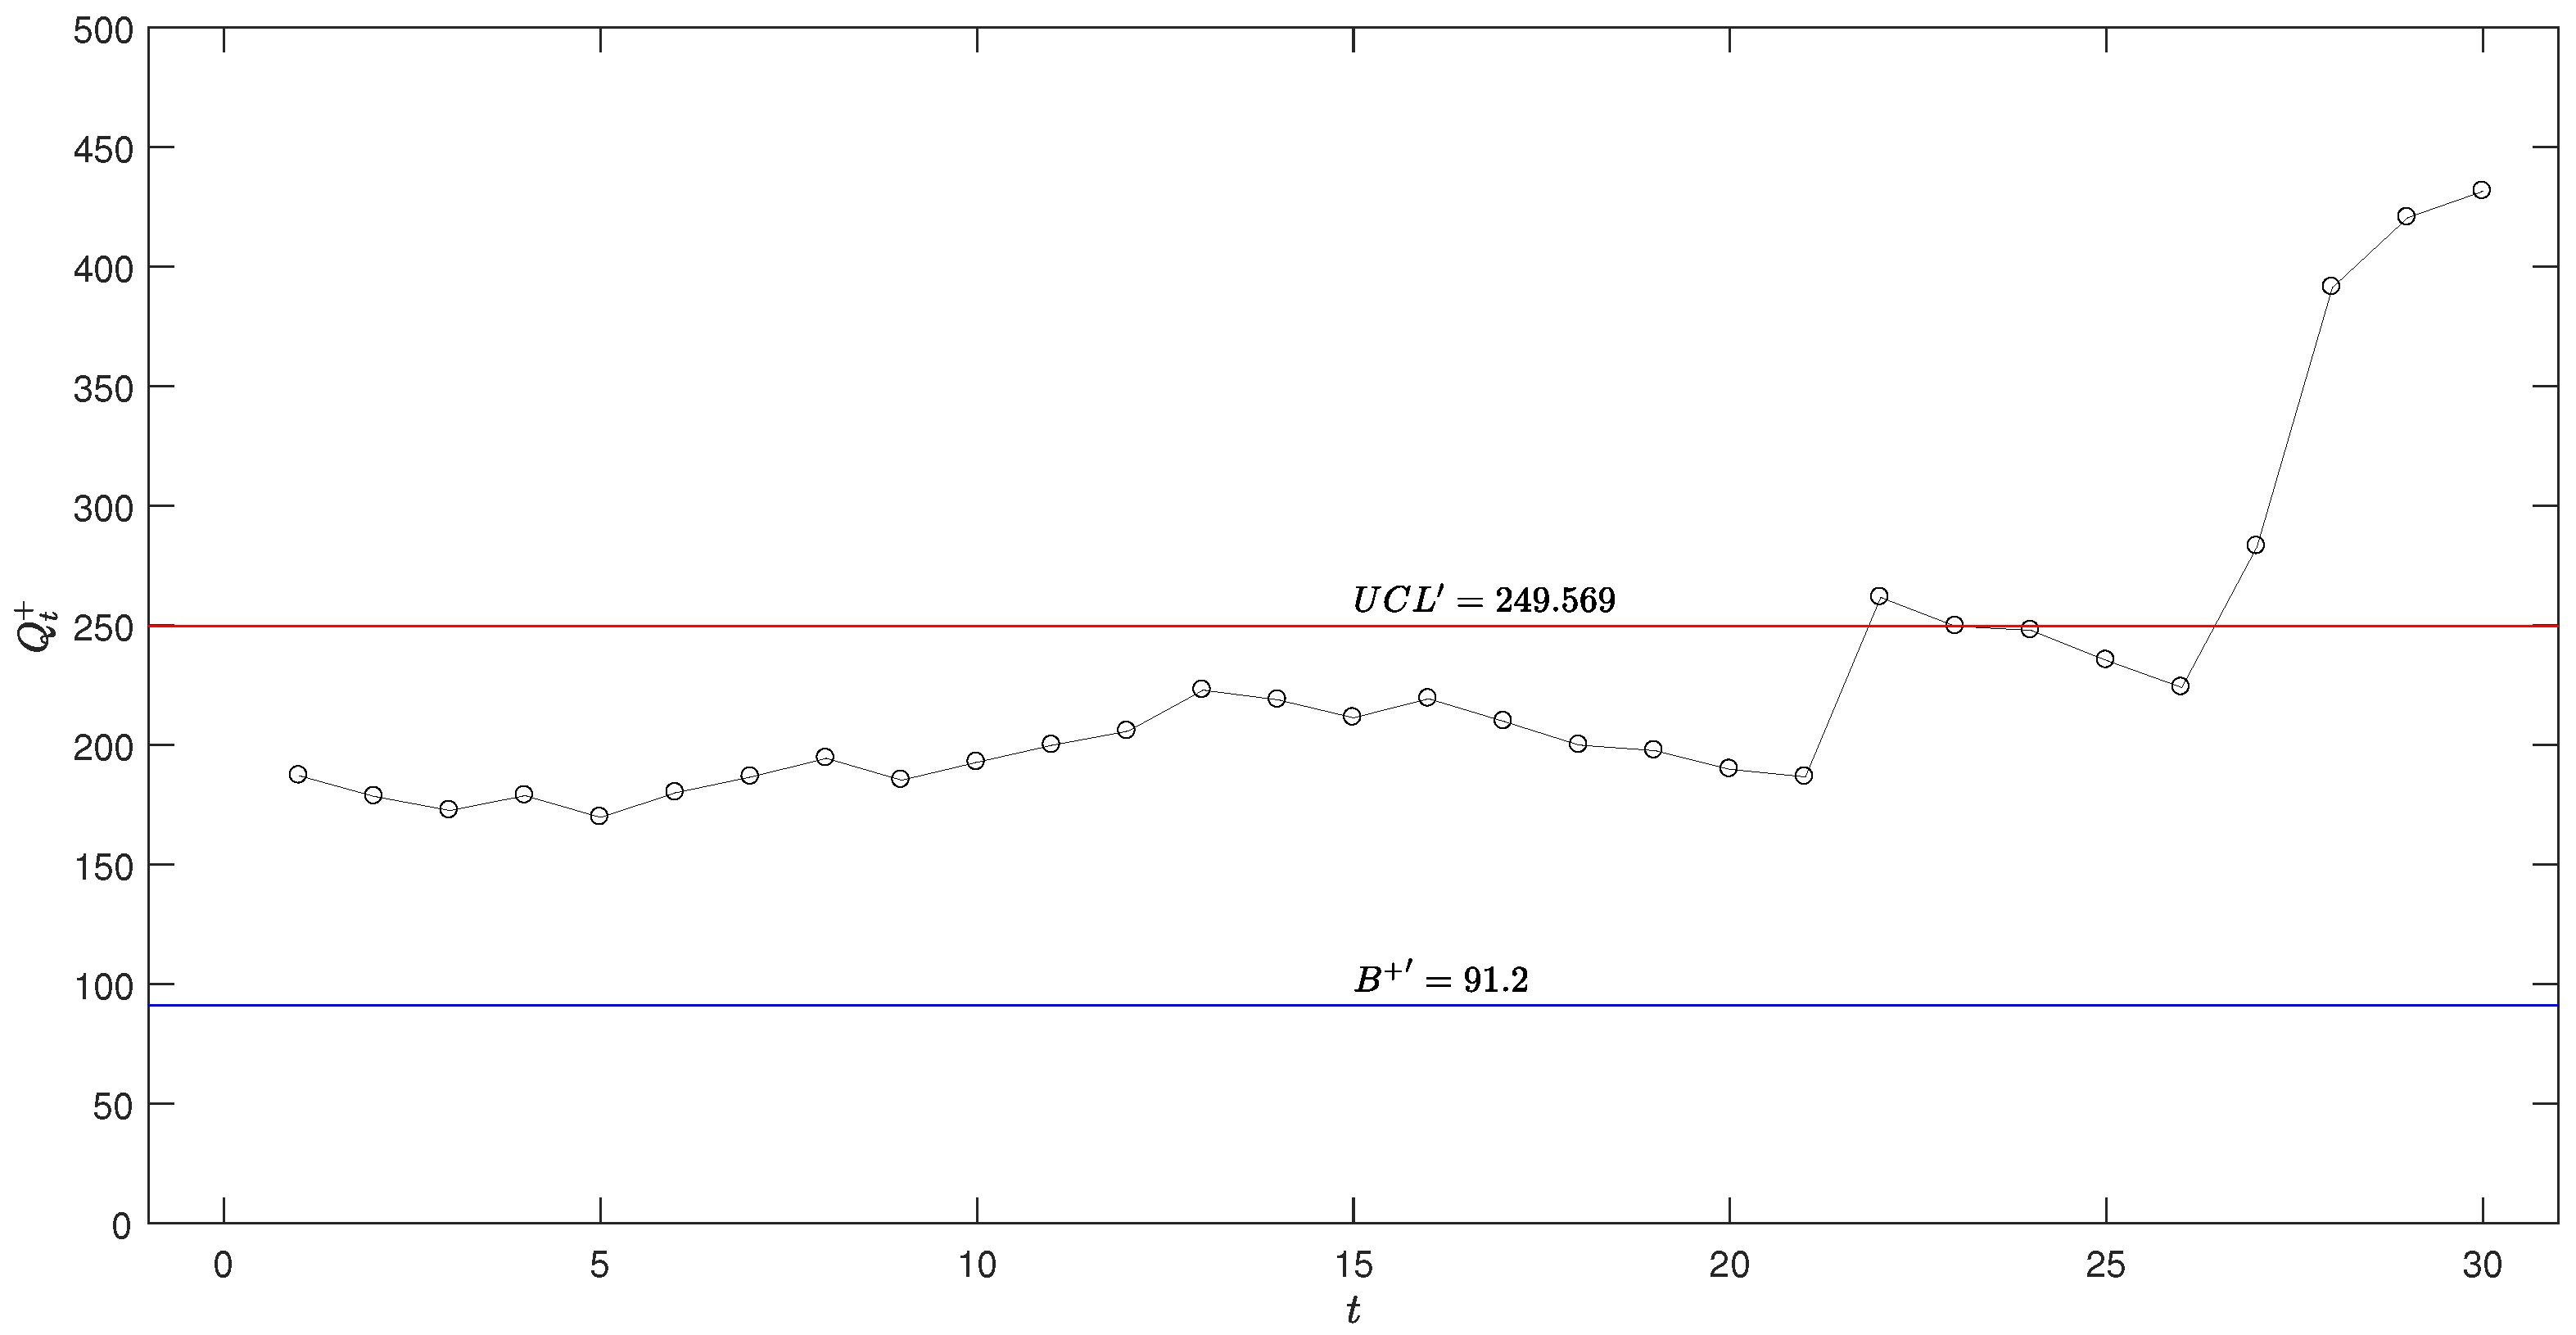
The optimal upper-sided AEWMA scheme statistic is calculated using Equation (7) (refer to 
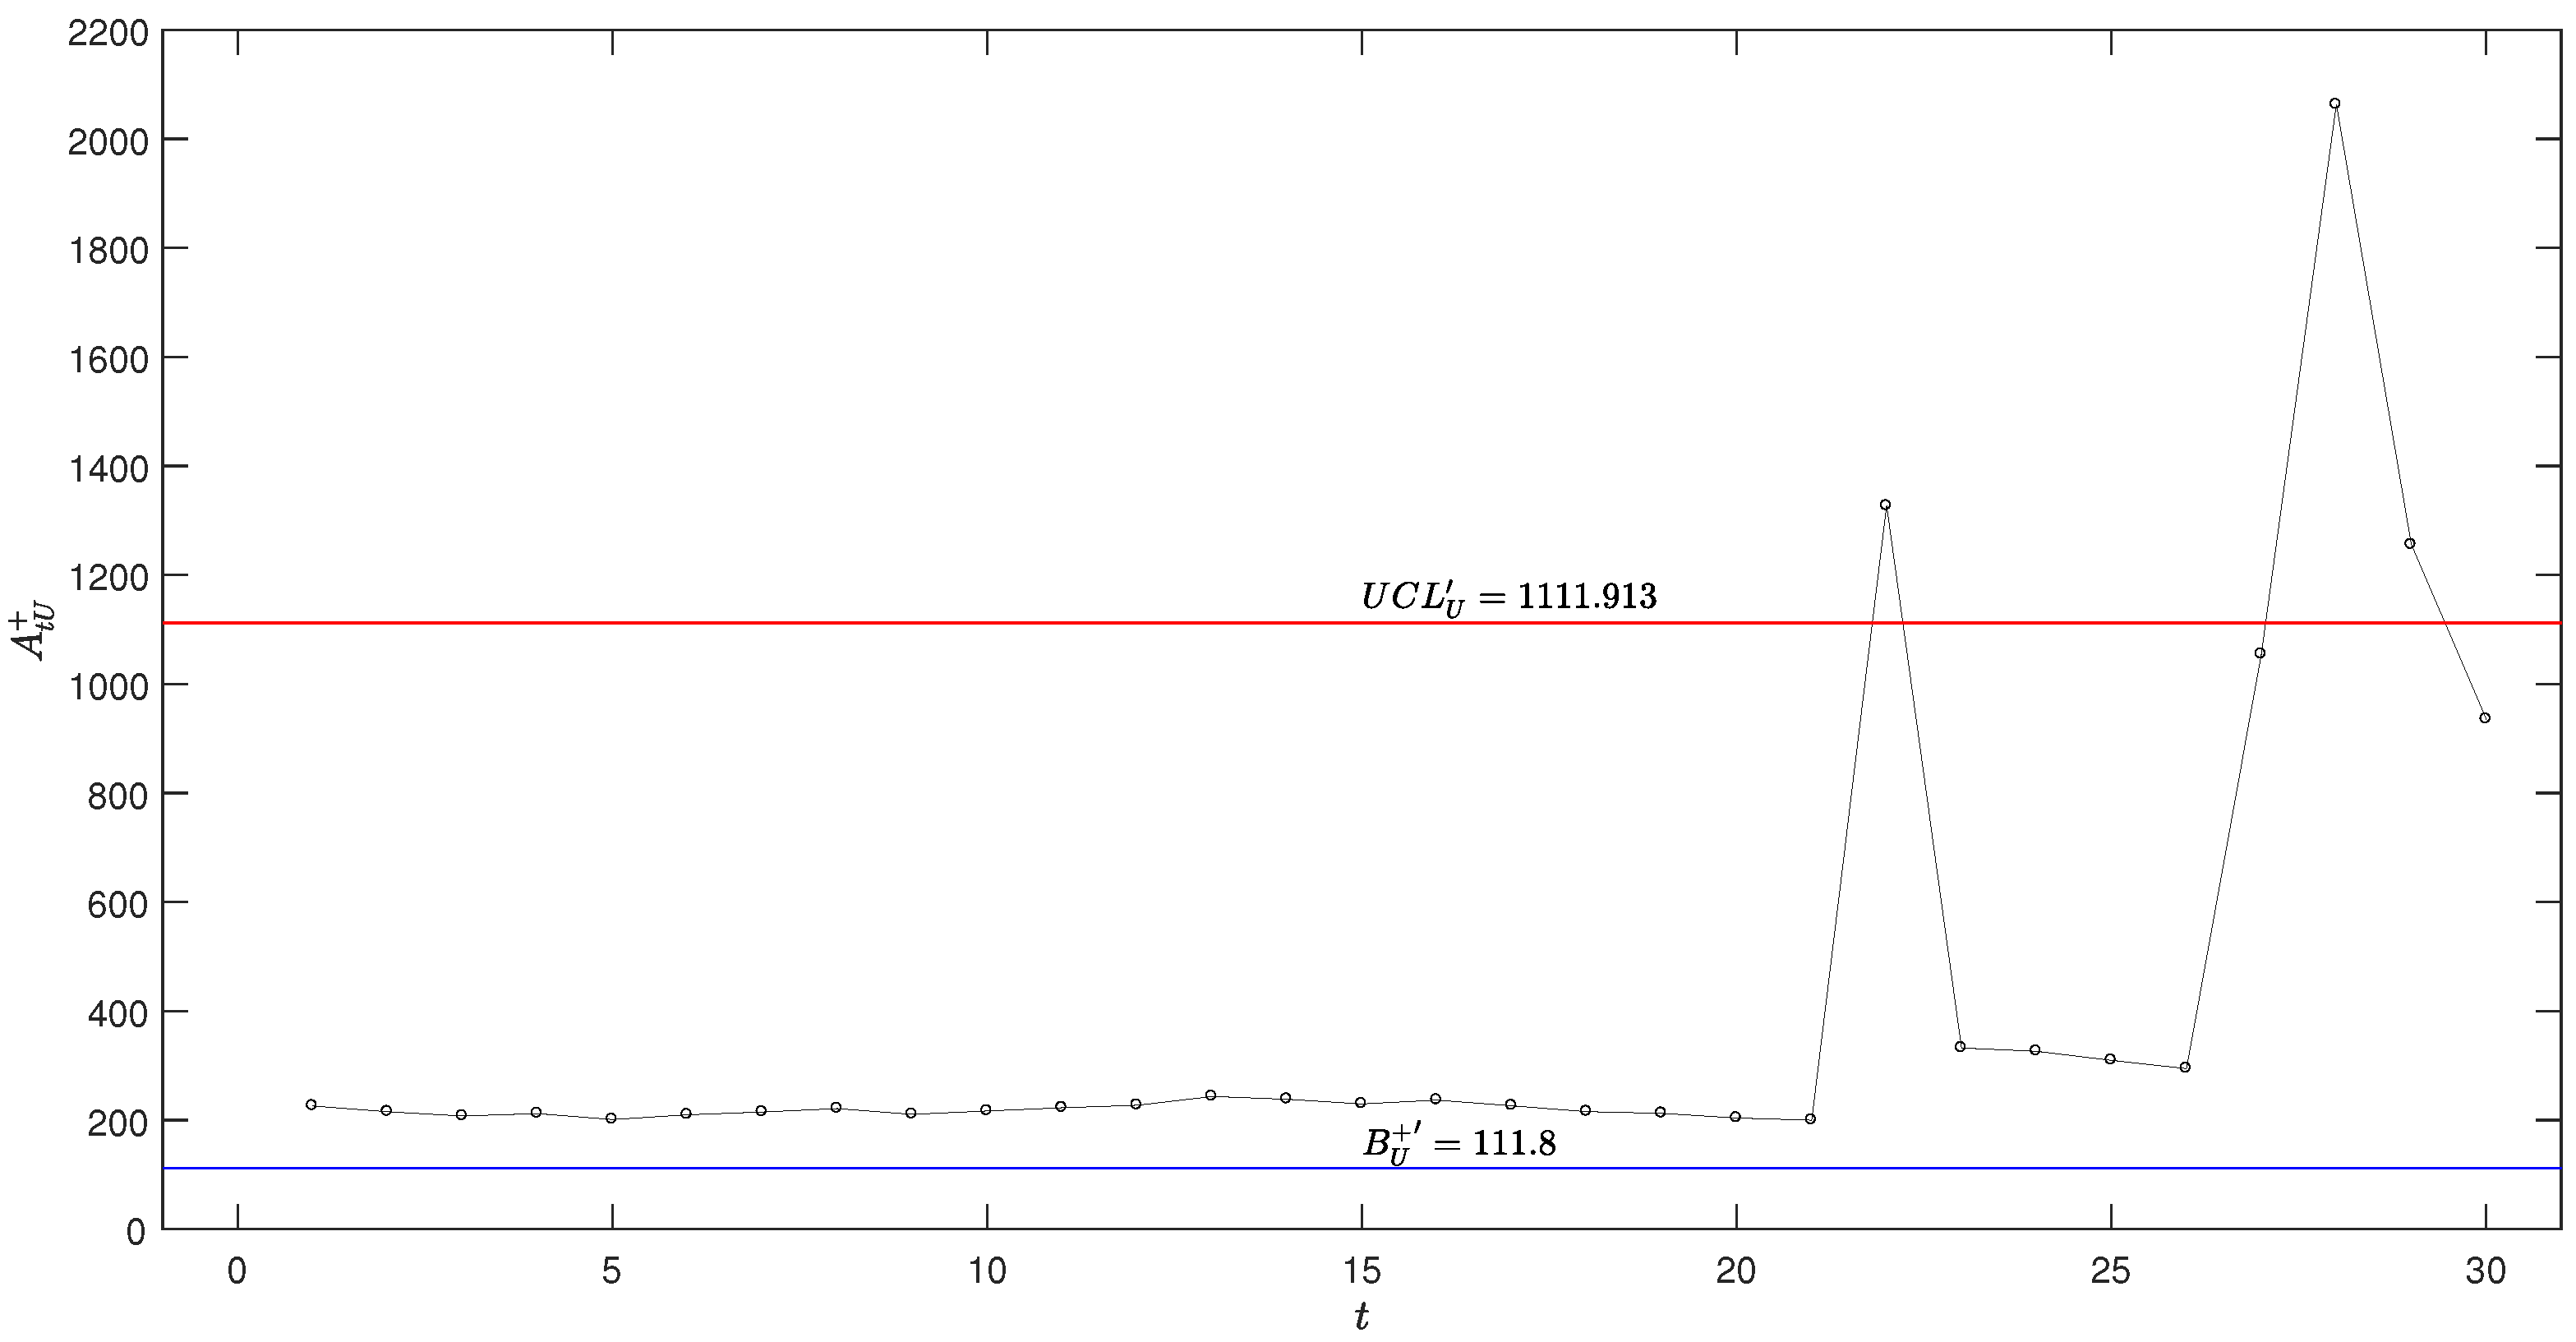
Table 8 for details). To refine the monitoring scheme and account for the uncertainty in the estimation of the process mean, we consider the upper-bound of the bootstrap confidence interval, , to recalculate the adjusted parameters , , and . These adjusted parameters provide a more conservative estimate of the control limits, ensuring the monitoring scheme’s effectiveness even under conditions where the true process mean might be higher than initially estimated. The recalculated parameters are as follows:
The AEWMA statistic is then calculated using Equation (7), with the updated parameters (refer to Table 8 for details).
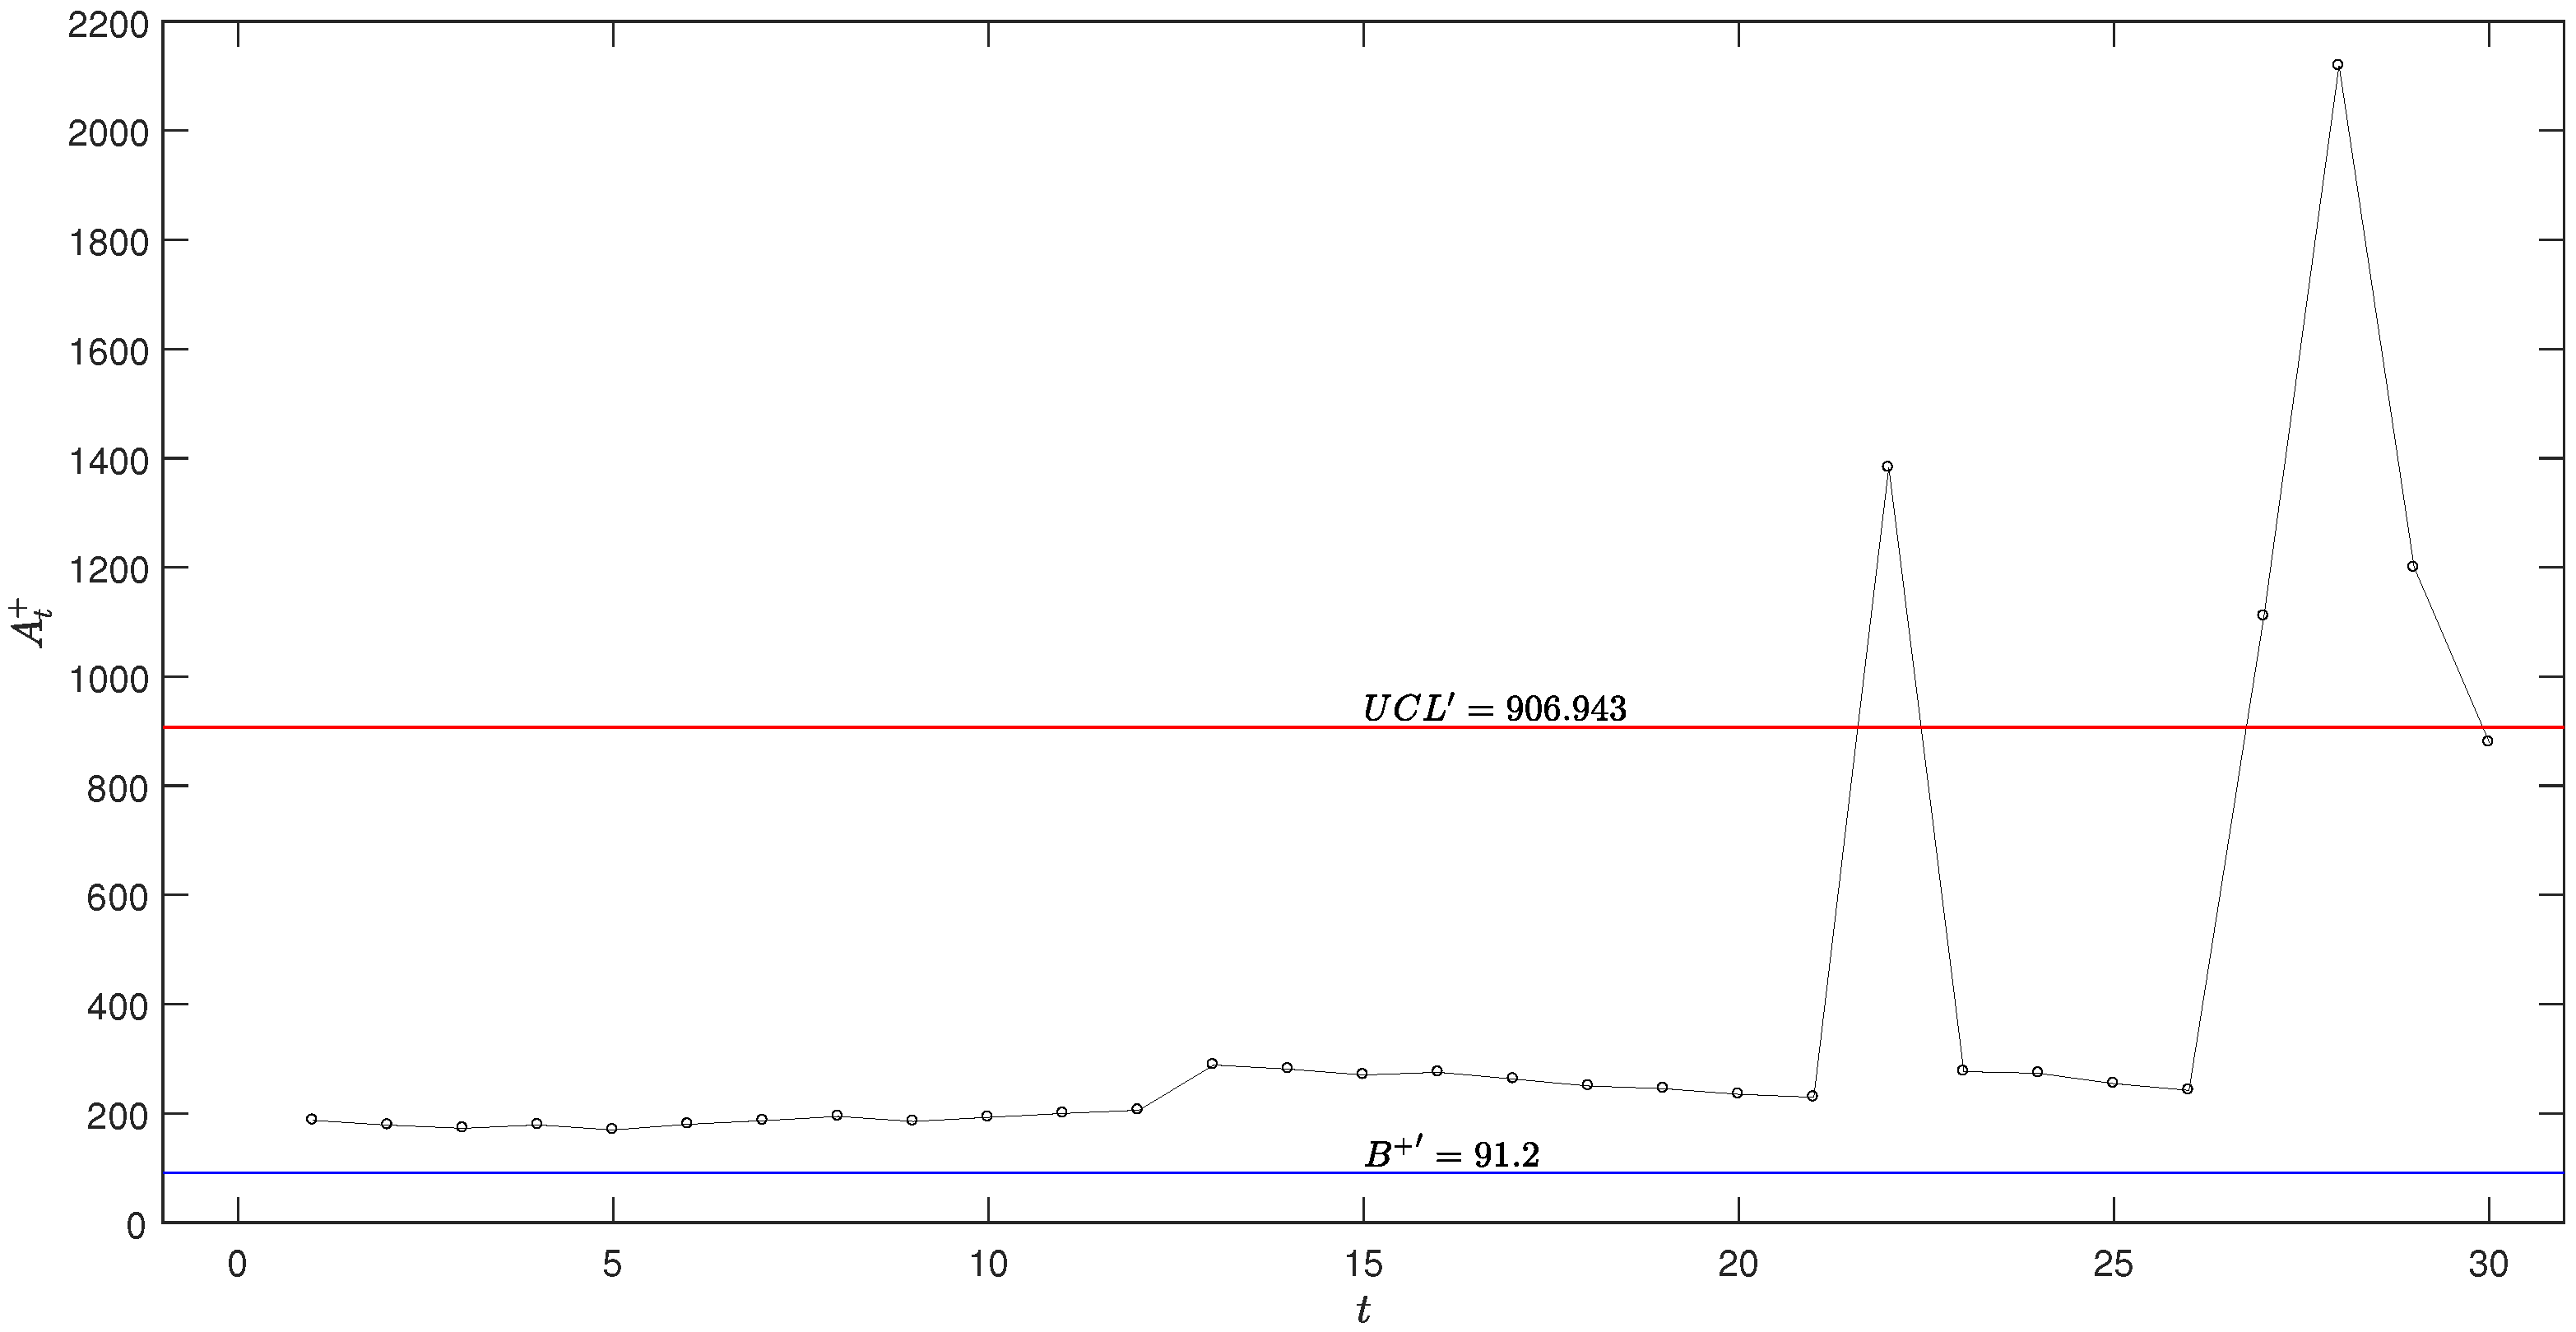
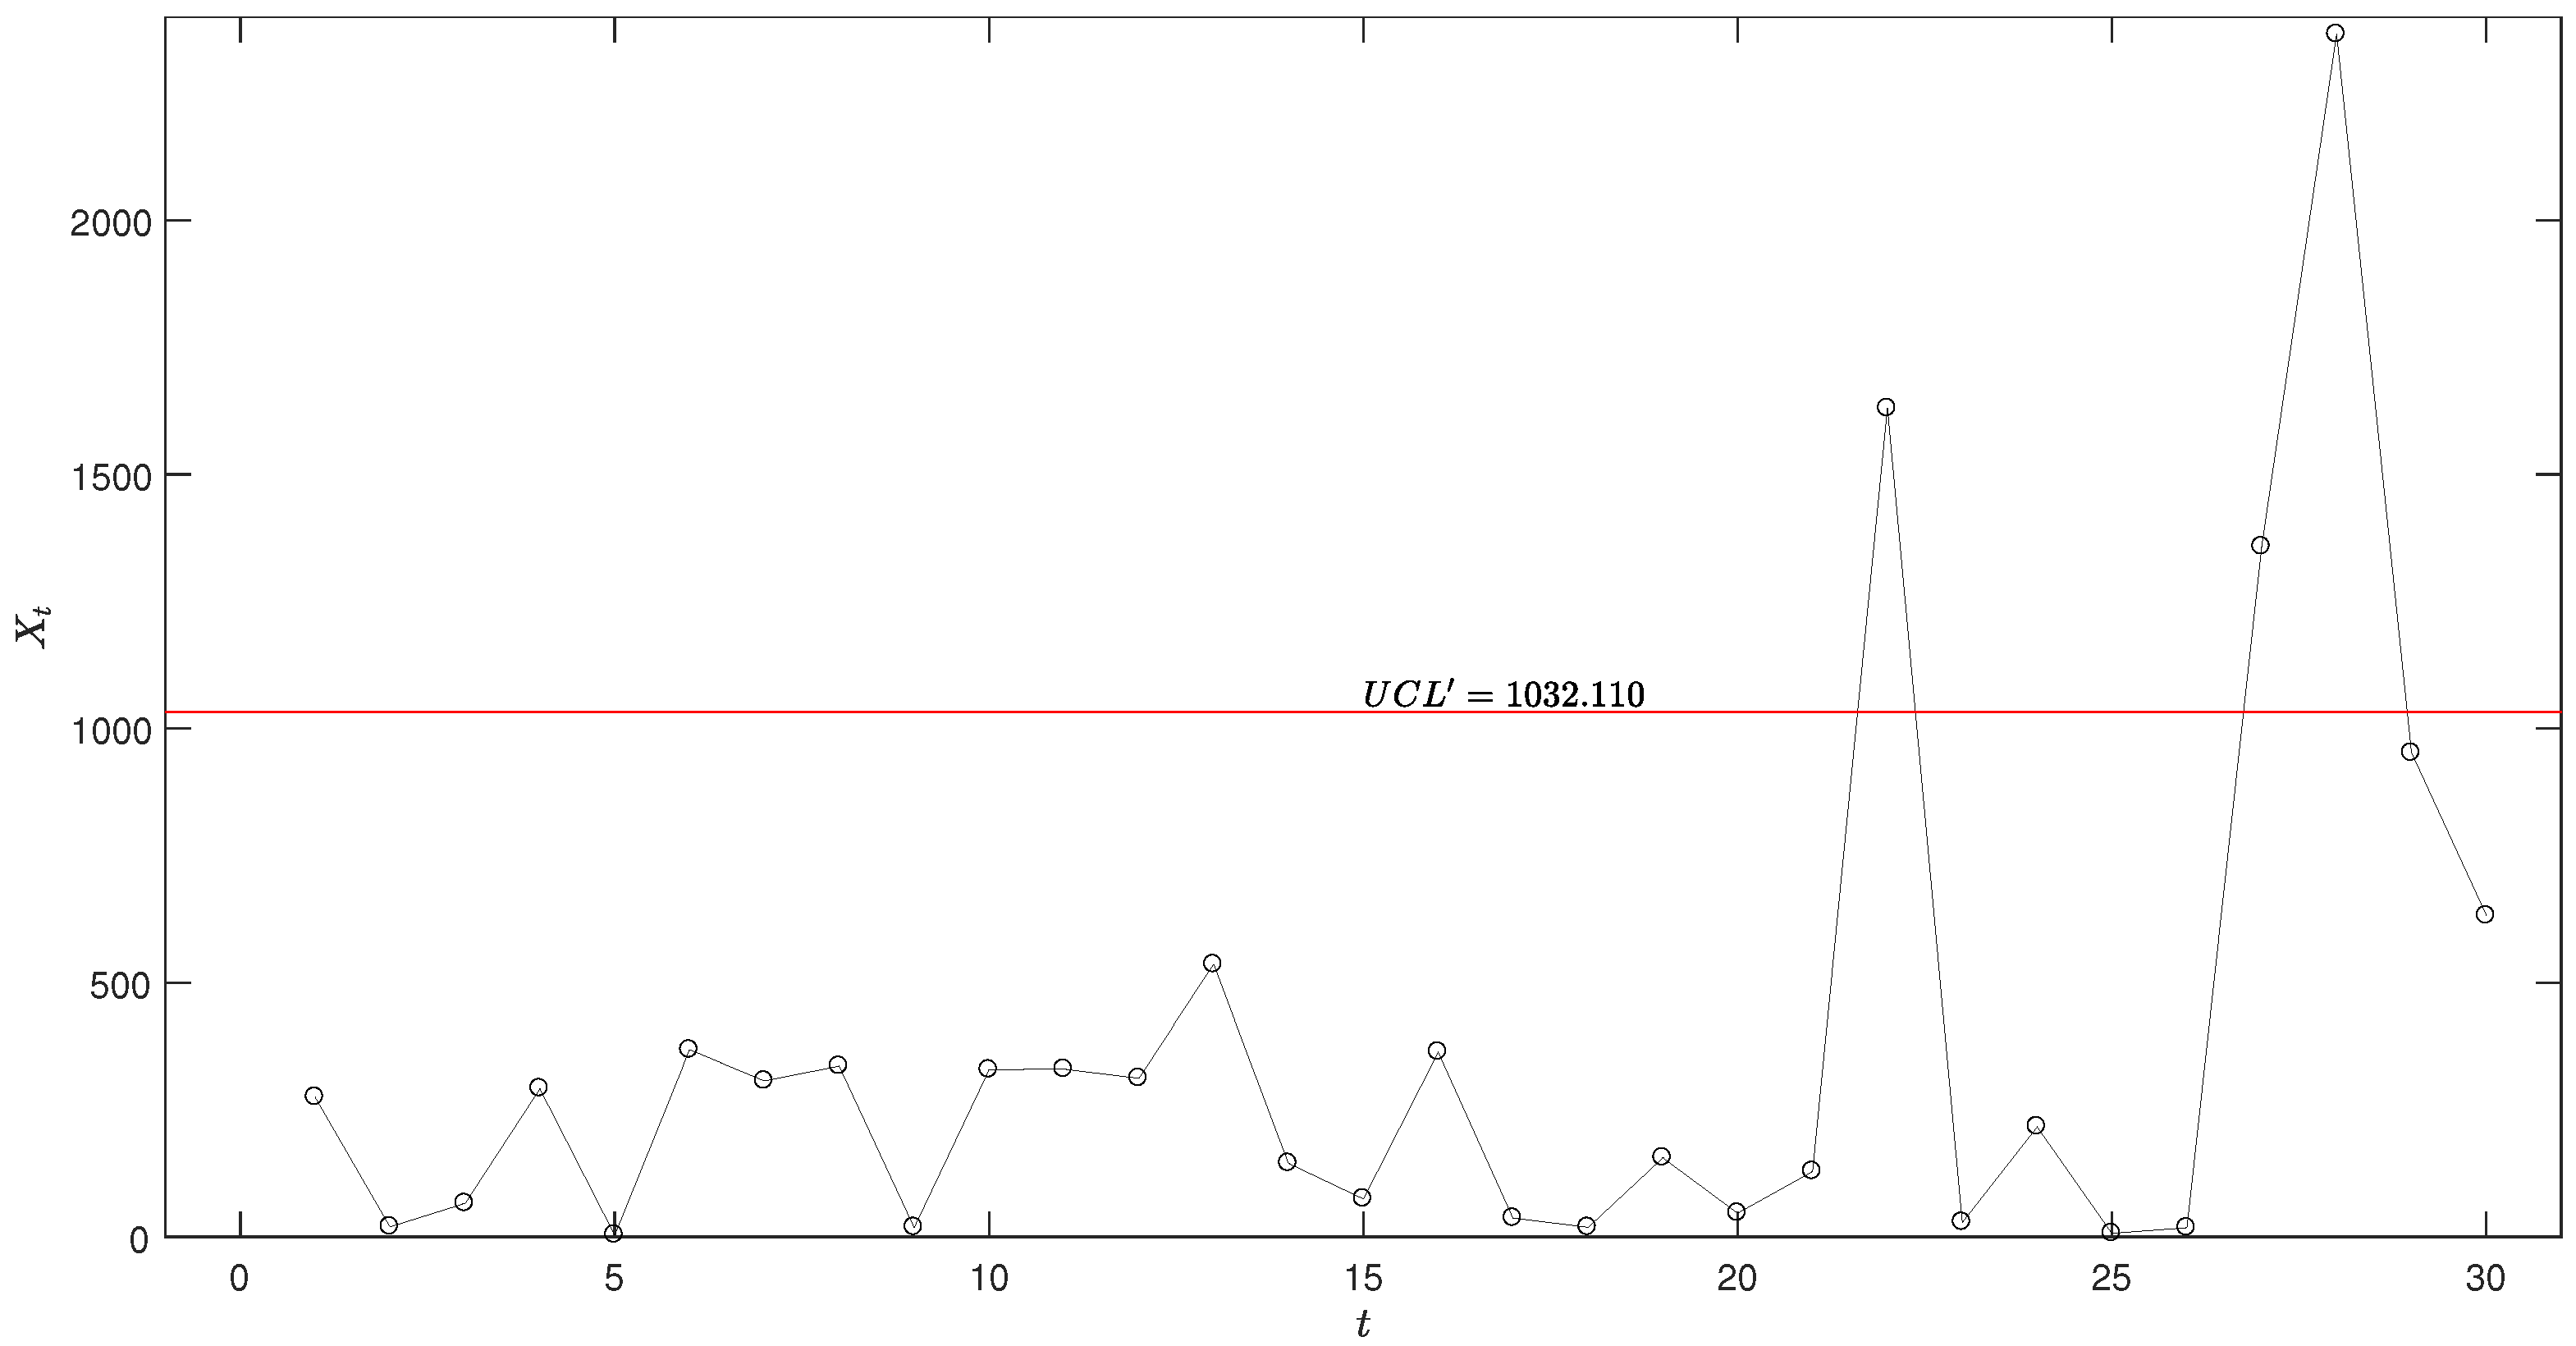
As shown in the table, at , reaches a value of , and reaches a value of , both exceeding their respective control limit and , as highlighted in bold. Additionally, it is noteworthy that at , the AEWMA statistic exceeds its control limit , signaling a potential out-of-control condition. In contrast, the adjusted AEWMA statistic remains below its respective control limit at this time point. This discrepancy highlights the sensitivity of the AEWMA scheme to upward shifts in the process mean, while the adjusted scheme, which incorporates the upper bound of the bootstrap confidence interval, provides a more conservative estimate. This observation underscores the importance of considering parameter uncertainty in the design of monitoring schemes to ensure robust performance under varying conditions.
To promote a comparative analysis in practical applications, we also evaluate the setting where and . For the EWMA-type scheme, the optimal parameters derived from Table 3, which are . These parameters were then scaled by the factor , resulting in and . The corresponding optimal statistic for the EWMA scheme, , can be computed using Equation (5) (see Table 8). For the Shewhart-type scheme, the control limit was set at to satisfy . After scaling this value by , the adjusted upper control limit is calculated as .
According to the data presented in Table 8, at time points , when undergoes a sudden increase, shows a more significant increment compared to . This observation indicates that, under such conditions, the monitoring performance of the AEWMA scheme aligns more closely with that of the Shewhart scheme.
Figure 8, Figure 9, Figure 10 and Figure 11 visually illustrates these monitoring schemes, clearly showing that at , the schemes emit an out-of-control signal, suggesting a notable shift in the process mean. Furthermore, it can be observed that when (at ) experiences a sudden decrease, the EWMA-type scheme continues to emit an out-of-control signal. In contrast, the AEWMA and Shewhart schemes quickly adapt to the new data, returning to the in-control region and thereby reducing unnecessary alarms. This behavior underscores the importance of selecting a monitoring scheme that balances sensitivity to shifts with the ability to avoid false alarms, making the AEWMA scheme particularly suitable for scenarios requiring rapid detection of changes while minimizing false alerts.
Figure 8.
Optimal upper-sided exponential AEWMA scheme with for the coal mine explosions.
Figure 9.
Adjusted optimal upper-sided exponential AEWMA scheme with for the coal mine explosions.
Figure 10.
Optimal upper-sided exponential EWMA scheme with for the coal mine explosions.
Figure 11.
Upper-sided exponential Shewhart scheme with for the coal mine explosions.
7. Discussion
This paper addresses the limitation of the one-sided exponential AEWMA scheme in simultaneously monitoring different magnitudes of process shifts. Through an analysis of the RL distribution for both upper- and lower-sided schemes, we observed that the RL distribution is skewed. To mitigate this bias, we proposed using the MRL as a statistical performance indicator for the monitoring scheme.
An optimal design procedure based on MRL was developed to enhance the performance of the one-sided exponential AEWMA scheme. This procedure ensures more balanced and robust detection of both small and large shifts, thereby improving overall scheme sensitivity. Additionally, the performance of the one-sided exponential AEWMA scheme, one-sided exponential EWMA scheme, and one-sided exponential Shewhart scheme, all based on MRL, is compared. Finally, the proposed one-sided exponential AEWMA scheme based on MRL is illustrated through two case studies: monitoring failure intervals in OLED production and detecting increases in coal mine explosion frequencies.
In conclusion, the proposed one-sided exponential AEWMA scheme based on MRL provides a robust solution for monitoring process shifts of varying magnitudes, outperforming traditional monitoring schemes in many scenarios. Future research could extend this approach to other types of processes and distributions, focusing on the robustness of the AEWMA scheme across different distributions. Investigating its performance under non-exponential distributions and exploring its applicability in diverse industries would further validate its effectiveness and broaden its utility.
Author Contributions
Conceptualization, Y.Q. and Q.X.; methodology, Y.Q.; software, Z.W.; validation, Z.W. and Q.Z.; resources, Y.Q.; writing—original draft preparation, Y.Q.; writing—review and editing, Q.X.; Visualization, G.J.; supervision, Q.Z.; project administration, Z.W.; funding acquisition, Y.Q., Q.Z., Z.W. and G.J. All authors have read and agreed to the published version of the manuscript.
Funding
This research was funded by the Natural Science Foundation of the Jiangsu Higher Education Institutions of China grant number 22KJB110012, 23KJD120002, 24KJB520005.
Data Availability Statement
Data is contained within the article.
Conflicts of Interest
The authors declare no conflicts of interest.
References
- Qiu, P.; Li, W.; Li, J. A new process control chart for monitoring short-range serially correlated data. Technometrics 2020, 62, 71–83. [Google Scholar] [CrossRef]
- Colosimo, B.M.; Jones-Farmer, L.A.; Megahed, F.M.; Paynabar, K.; Ranjan, C.; Woodall, W.H. Statistical Process Monitoring from Industry 2.0 to Industry 4.0: Insights into Research and Practice. Technometrics 2024, 66, 507–530. [Google Scholar] [CrossRef]
- Roberts, S.W. Control chart tests based on geometric moving averages. Technometrics 1959, 42, 97–101. [Google Scholar] [CrossRef]
- Page, E.S. Continuous inspection schemes. Biometrika 1954, 41, 100–115. [Google Scholar] [CrossRef]
- Abbas, N.; Riaz, M.; Does, R.J. Enhancing the performance of EWMA charts. Qual. Reliab. Eng. Int. 2011, 27, 821–833. [Google Scholar] [CrossRef]
- Castagliola, P.; Celano, G.; Psarakis, S. Monitoring the coefficient of variation using EWMA charts. J. Qual. Technol. 2011, 43, 249–265. [Google Scholar] [CrossRef]
- Baranwal, A.; Kumar, N.; Chatterjee, K.; Koukouvinos, C. A new EWMA chart for simultaneously monitoring the parameters of a shifted exponential distribution. J. Appl. Stat. 2024, 1–32. [Google Scholar] [CrossRef]
- Capizzi, G.; Masarotto, G. An adaptive exponentially weighted moving average control chart. Technometrics 2003, 45, 199–207. [Google Scholar] [CrossRef]
- Shu, L. An adaptive exponentially weighted moving average control chart for monitoring process variances. J. Stat. Comput. Simul. 2008, 78, 367–384. [Google Scholar] [CrossRef]
- Tang, A.; Castagliola, P.; Sun, J.; Hu, X. An adaptive exponentially weighted moving average chart for the mean with variable sampling intervals. Qual. Reliab. Eng. Int. 2017, 33, 2023–2034. [Google Scholar] [CrossRef]
- Ugaz, W.; Alonso, A.M.; Sánchez, I. Adaptive EWMA-S2 control charts with adaptive smoothing parameter. Qual. Eng. 2020, 33, 100–112. [Google Scholar] [CrossRef]
- Zaman, B.; Mahfooz, S.Z.; Mehmood, R.; Khan, N.; Imran, T. An adaptive EWMA control chart based on Hampel function to monitor the process location parameter. Qual. Reliab. Eng. Int. 2023, 39, 1277–1298. [Google Scholar] [CrossRef]
- Ali, S.; Pievatolo, A.; Göb, R. An overview of control charts for high-quality processes. Qual. Reliab. Eng. Int. 2016, 32, 2171–2189. [Google Scholar] [CrossRef]
- Kumar, N.; Baranwal, A. Design and implementation of q th quantile-unbiased tr-chart for monitoring times between events. Qual. Reliab. Eng. Int. 2019, 35, 1061–1080. [Google Scholar] [CrossRef]
- Xie, F.; Castagliola, P.; Qiao, Y.; Hu, X.; Sun, J. A one-sided exponentially weighted moving average control chart for time between events. J. Appl. Stat. 2022, 49, 3928–3957. [Google Scholar] [CrossRef]
- Zhang, C.W.; Xie, M.; Goh, T.N. Economic design of exponential charts for time between events monitoring. Int. J. Prod. Res. 2005, 43, 5019–5032. [Google Scholar] [CrossRef]
- Rizzo, C.; Chin, S.T.; van den Heuvel, E.; Di Bucchianico, A. Performance measures of discrete and continuous time-between-events control charts. Qual. Reliab. Eng. Int. 2020, 36, 2754–2768. [Google Scholar] [CrossRef]
- Pascual, F.G.; Akhundjanov, S.B. Copula-based control charts for monitoring multivariate Poisson processes with application to hepatitis C counts. J. Qual. Technol. 2020, 52, 128–144. [Google Scholar] [CrossRef]
- Gan, F.F. Designs of one- and two-sided exponential EWMA charts. J. Qual. Technol. 1998, 30, 55–69. [Google Scholar] [CrossRef]
- Gan, F.F.; Chang, T.C. Computing average run lengths of exponential EWMA charts. J. Qual. Technol. 2000, 32, 183–187. [Google Scholar] [CrossRef]
- Pehlivan, C.; Testik, M.C. Impact of model misspecification on the exponential EWMA charts: A robustness study when the time-between-events are not exponential. Qual. Reliab. Eng. Int. 2010, 26, 177–190. [Google Scholar] [CrossRef]
- Hu, X.; Castagliola, P.; Zhong, J.; Tang, A.; Qiao, Y. On the performance of the adaptive EWMA chart for monitoring time between events. J. Stat. Comput. Simul. 2021, 91, 1175–1211. [Google Scholar] [CrossRef]
- Golosnoy, V.; Schmid, W. EWMA control charts for monitoring optimal portfolio weights. Seq. Anal. 2007, 26, 195–224. [Google Scholar] [CrossRef]
- Qiao, Y.; Sun, J.; Castagliola, P.; Hu, X. Optimal design of one-sided exponential EWMA charts based on median run length and expected median run length. Commun. Stat.-Theory Methods 2022, 51, 2887–2907. [Google Scholar] [CrossRef]
- Maravelakis, P.E.; Castagliola, P.; Khoo, M.B.C. Run length properties of run rules EWMA chart using integral equations. Qual. Technol. Quant. Manag. 2019, 16, 129–139. [Google Scholar] [CrossRef]
- Tang, A.A.; Castagliola, P.; Sun, J.S.; Hu, X.L. Optimal design of the adaptive EWMA chart for the mean based on median run length and expected median run length. Qual. Technol. Quant. Manag. 2019, 16, 439–458. [Google Scholar] [CrossRef]
- Johnson, N.L.; Kotz, S.; Balakrishnan, N. Continuous Univariate Distributions, 2nd ed.; Wiley: New York, NY, USA, 1994; Volume 1. [Google Scholar]
- Chew, X.; Khaw, K.W.; Yeong, W.C. The efficiency of run rules schemes for the multivariate coefficient of variation: A Markov chain approach. J. Appl. Stat. 2020, 47, 460–480. [Google Scholar] [CrossRef]
- Sabahno, H.; Amiri, A.; Castagliola, P. A new adaptive control chart for the simultaneous monitoring of the mean and variability of multivariate normal processes. Comput. Ind. Eng. 2021, 151, 106524. [Google Scholar] [CrossRef]
- da Silva, L.A.; Ho, L.L.; da Costa Quinino, R. Markov Chain approach to get control limits for a Shewhart Control Chart to monitor the mean of a Discrete Weibull distribution. J. Process Control 2024, 134, 103149. [Google Scholar] [CrossRef]
- Sales, L.O.; Pinho, A.L.; Vivacqua, C.A.; Ho, L.L. Shewhart control chart for monitoring the mean of Poisson mixed integer autoregressive processes via Monte Carlo simulation. Comput. Ind. Eng. 2020, 140, 106245. [Google Scholar] [CrossRef]
- Iqbal, J.; Noor-ul Amin, M.; Khan, I.; AlQahtani, S.A.; Yasmeen, U.; Ahmad, B. A novel Bayesian Max-EWMA control chart for jointly monitoring the process mean and variance: An application to hard bake process. Sci. Rep. 2023, 13, 21224. [Google Scholar] [CrossRef]
- Neuts, M.F. Matrix-Geometric Solutions in Stochastic Models: An Algorithmic Approach; Dover Publications Inc.: New York, NY, USA, 1981. [Google Scholar]
- Latouche, G.; Ramaswami, V. Introduction to Matrix Analytic Methods in Stochastic Modeling; ASA-SIAM: Philadelphia, PA, USA, 1999. [Google Scholar]
- Wu, S.; Castagliola, P.; Celano, G. A distribution-free EWMA control chart for monitoring time-between-events-and-amplitude data. J. Appl. Stat. 2021, 48, 434–454. [Google Scholar] [CrossRef] [PubMed]
- Aly, A.A.; Saleh, N.A.; Mahmoud, M.A. An adaptive exponentially weighted moving average control chart for poisson processes. Qual. Eng. 2021, 33, 627–640. [Google Scholar] [CrossRef]
- Qu, L.; Khoo, M.B.C.; Castagliola, P.; He, Z. Exponential cumulative sums chart for detecting shifts in time-between-events. Int. J. Prod. Res. 2018, 56, 3683–3698. [Google Scholar] [CrossRef]
- Jarrett, R.G. A note on the intervals between coal-mining disasters. Biometrika 1979, 66, 191–193. [Google Scholar] [CrossRef]
- Sheu, S.H.; Ouyoung, C.W.; Hsu, T.S. Phase II statistical process control for functional data. J. Stat. Comput. Simul. 2013, 83, 2144–2159. [Google Scholar] [CrossRef]
- Khusna, H.; Mashuri, M.; Ahsan, M.; Suhartono, S.; Prastyo, D.D. Bootstrap-based maximum multivariate CUSUM control chart. Qual. Technol. Quant. Manag. 2020, 17, 52–74. [Google Scholar] [CrossRef]
Disclaimer/Publisher’s Note: The statements, opinions and data contained in all publications are solely those of the individual author(s) and contributor(s) and not of MDPI and/or the editor(s). MDPI and/or the editor(s) disclaim responsibility for any injury to people or property resulting from any ideas, methods, instructions or products referred to in the content. |
© 2024 by the authors. Licensee MDPI, Basel, Switzerland. This article is an open access article distributed under the terms and conditions of the Creative Commons Attribution (CC BY) license (https://creativecommons.org/licenses/by/4.0/).