
Optimized Workflow Framework in Construction Projects to Control the Environmental Properties of Soil


Abstract
1. Introduction
2. Materials and Methods
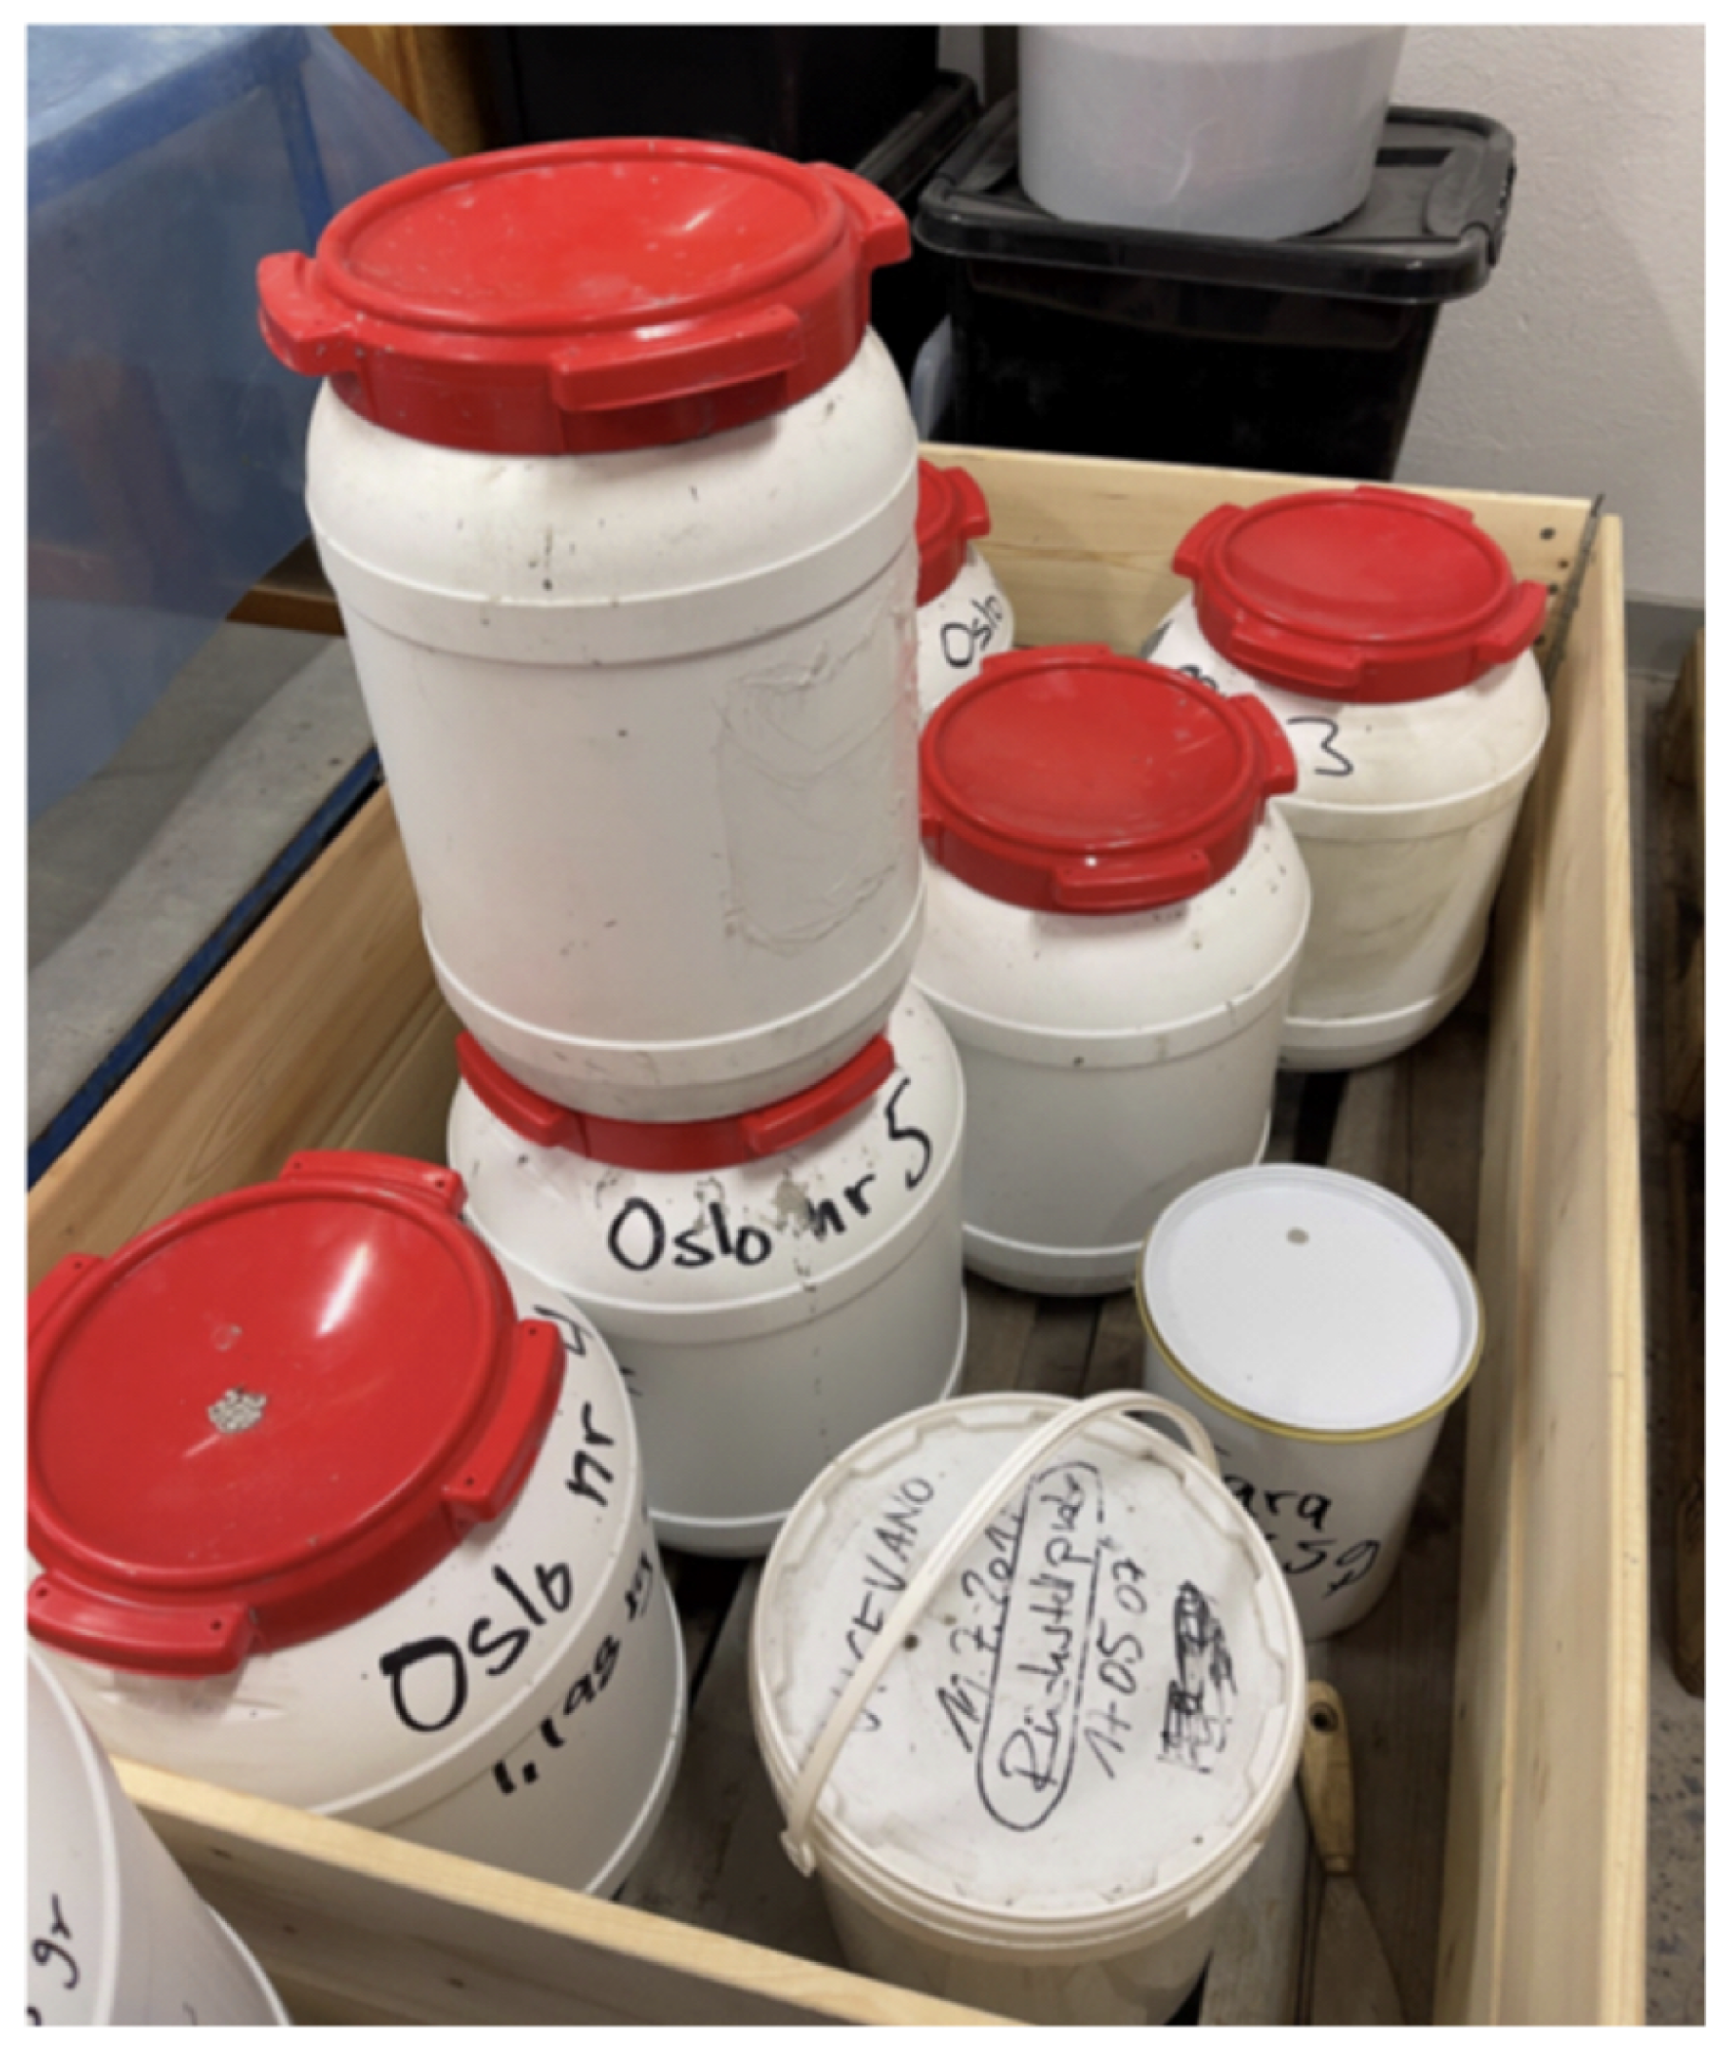
2.1. Sampling and Transportation
2.2. Soil Stabilization
2.3. Permeability Tests
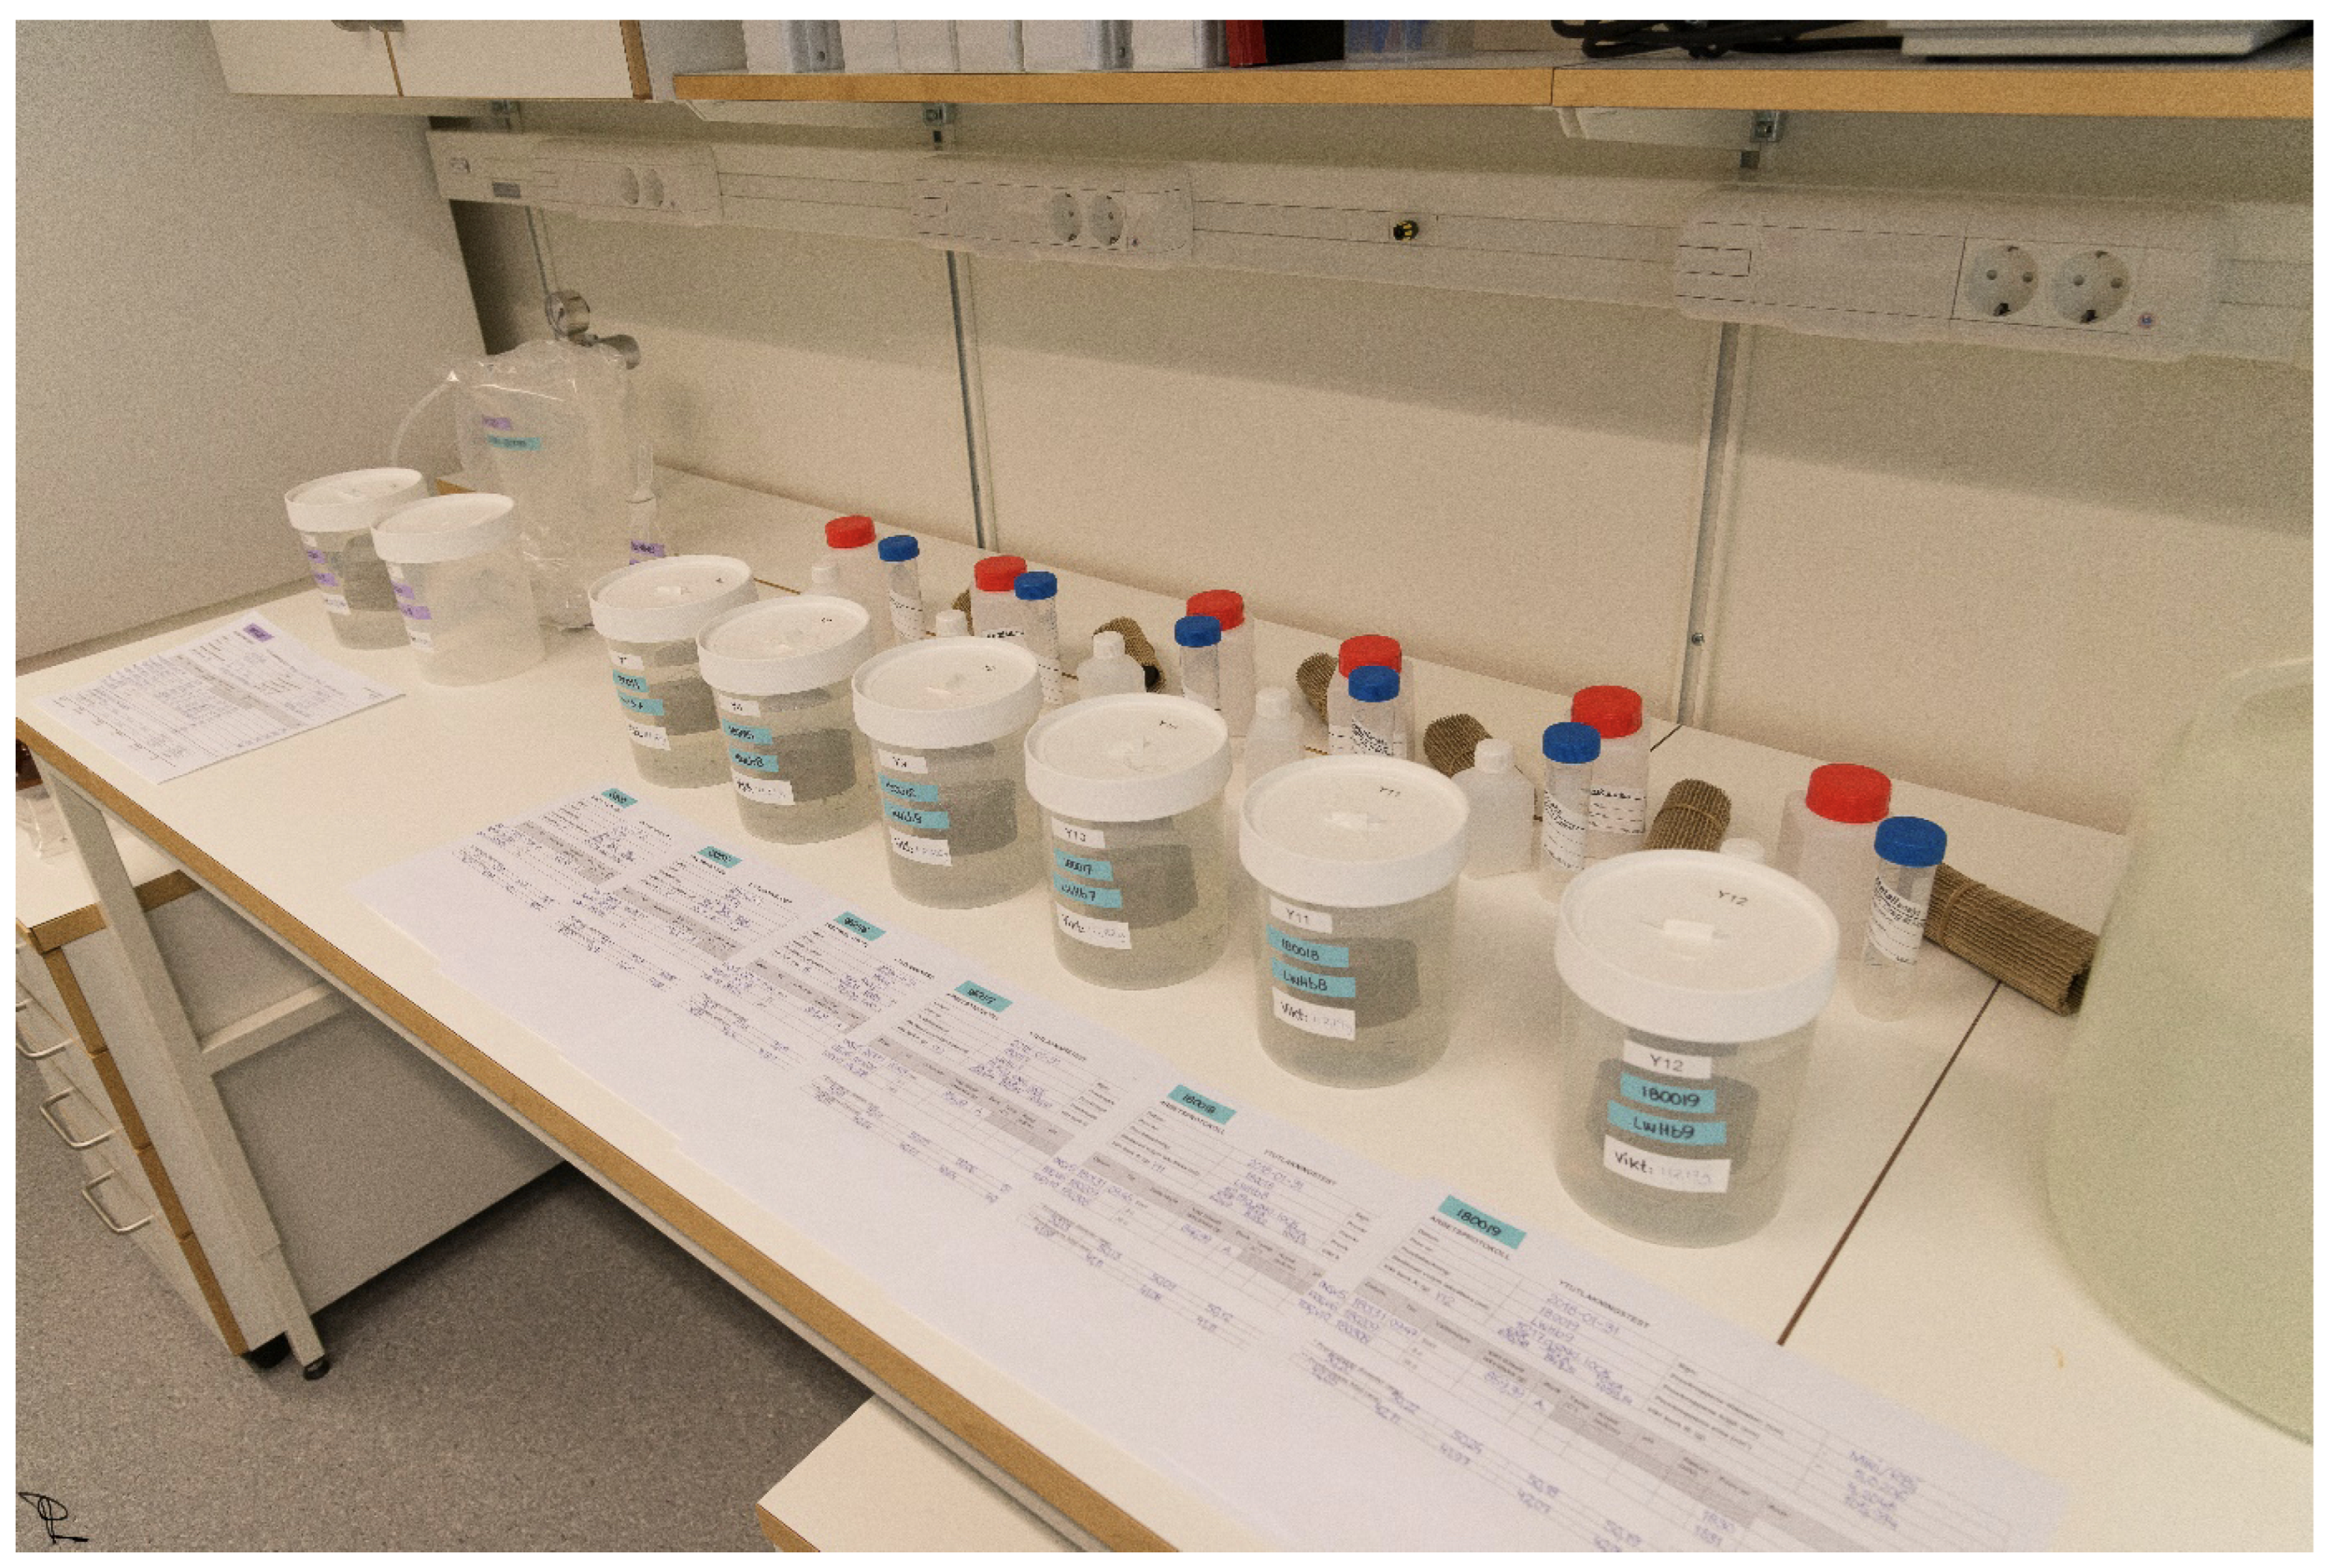
2.4. Surface Leaching Tests
3. Results and Discussion
- The soil samples were collected from the Kongshavn Harbour, Port of Oslo; the representative soil specimens were excavated from different locations (test sites) and placed in containers for further soil treating in a batchwise mode.
- The soil was homogenised using a surface mixer and stabilised with various combination of binders (cement/slag) tested experimentally. The soil samples were cropped and trimmed in leach piles to a defined height of specimen to minimise the workflow; unnecessary parts were subtracted from the samples using piles.
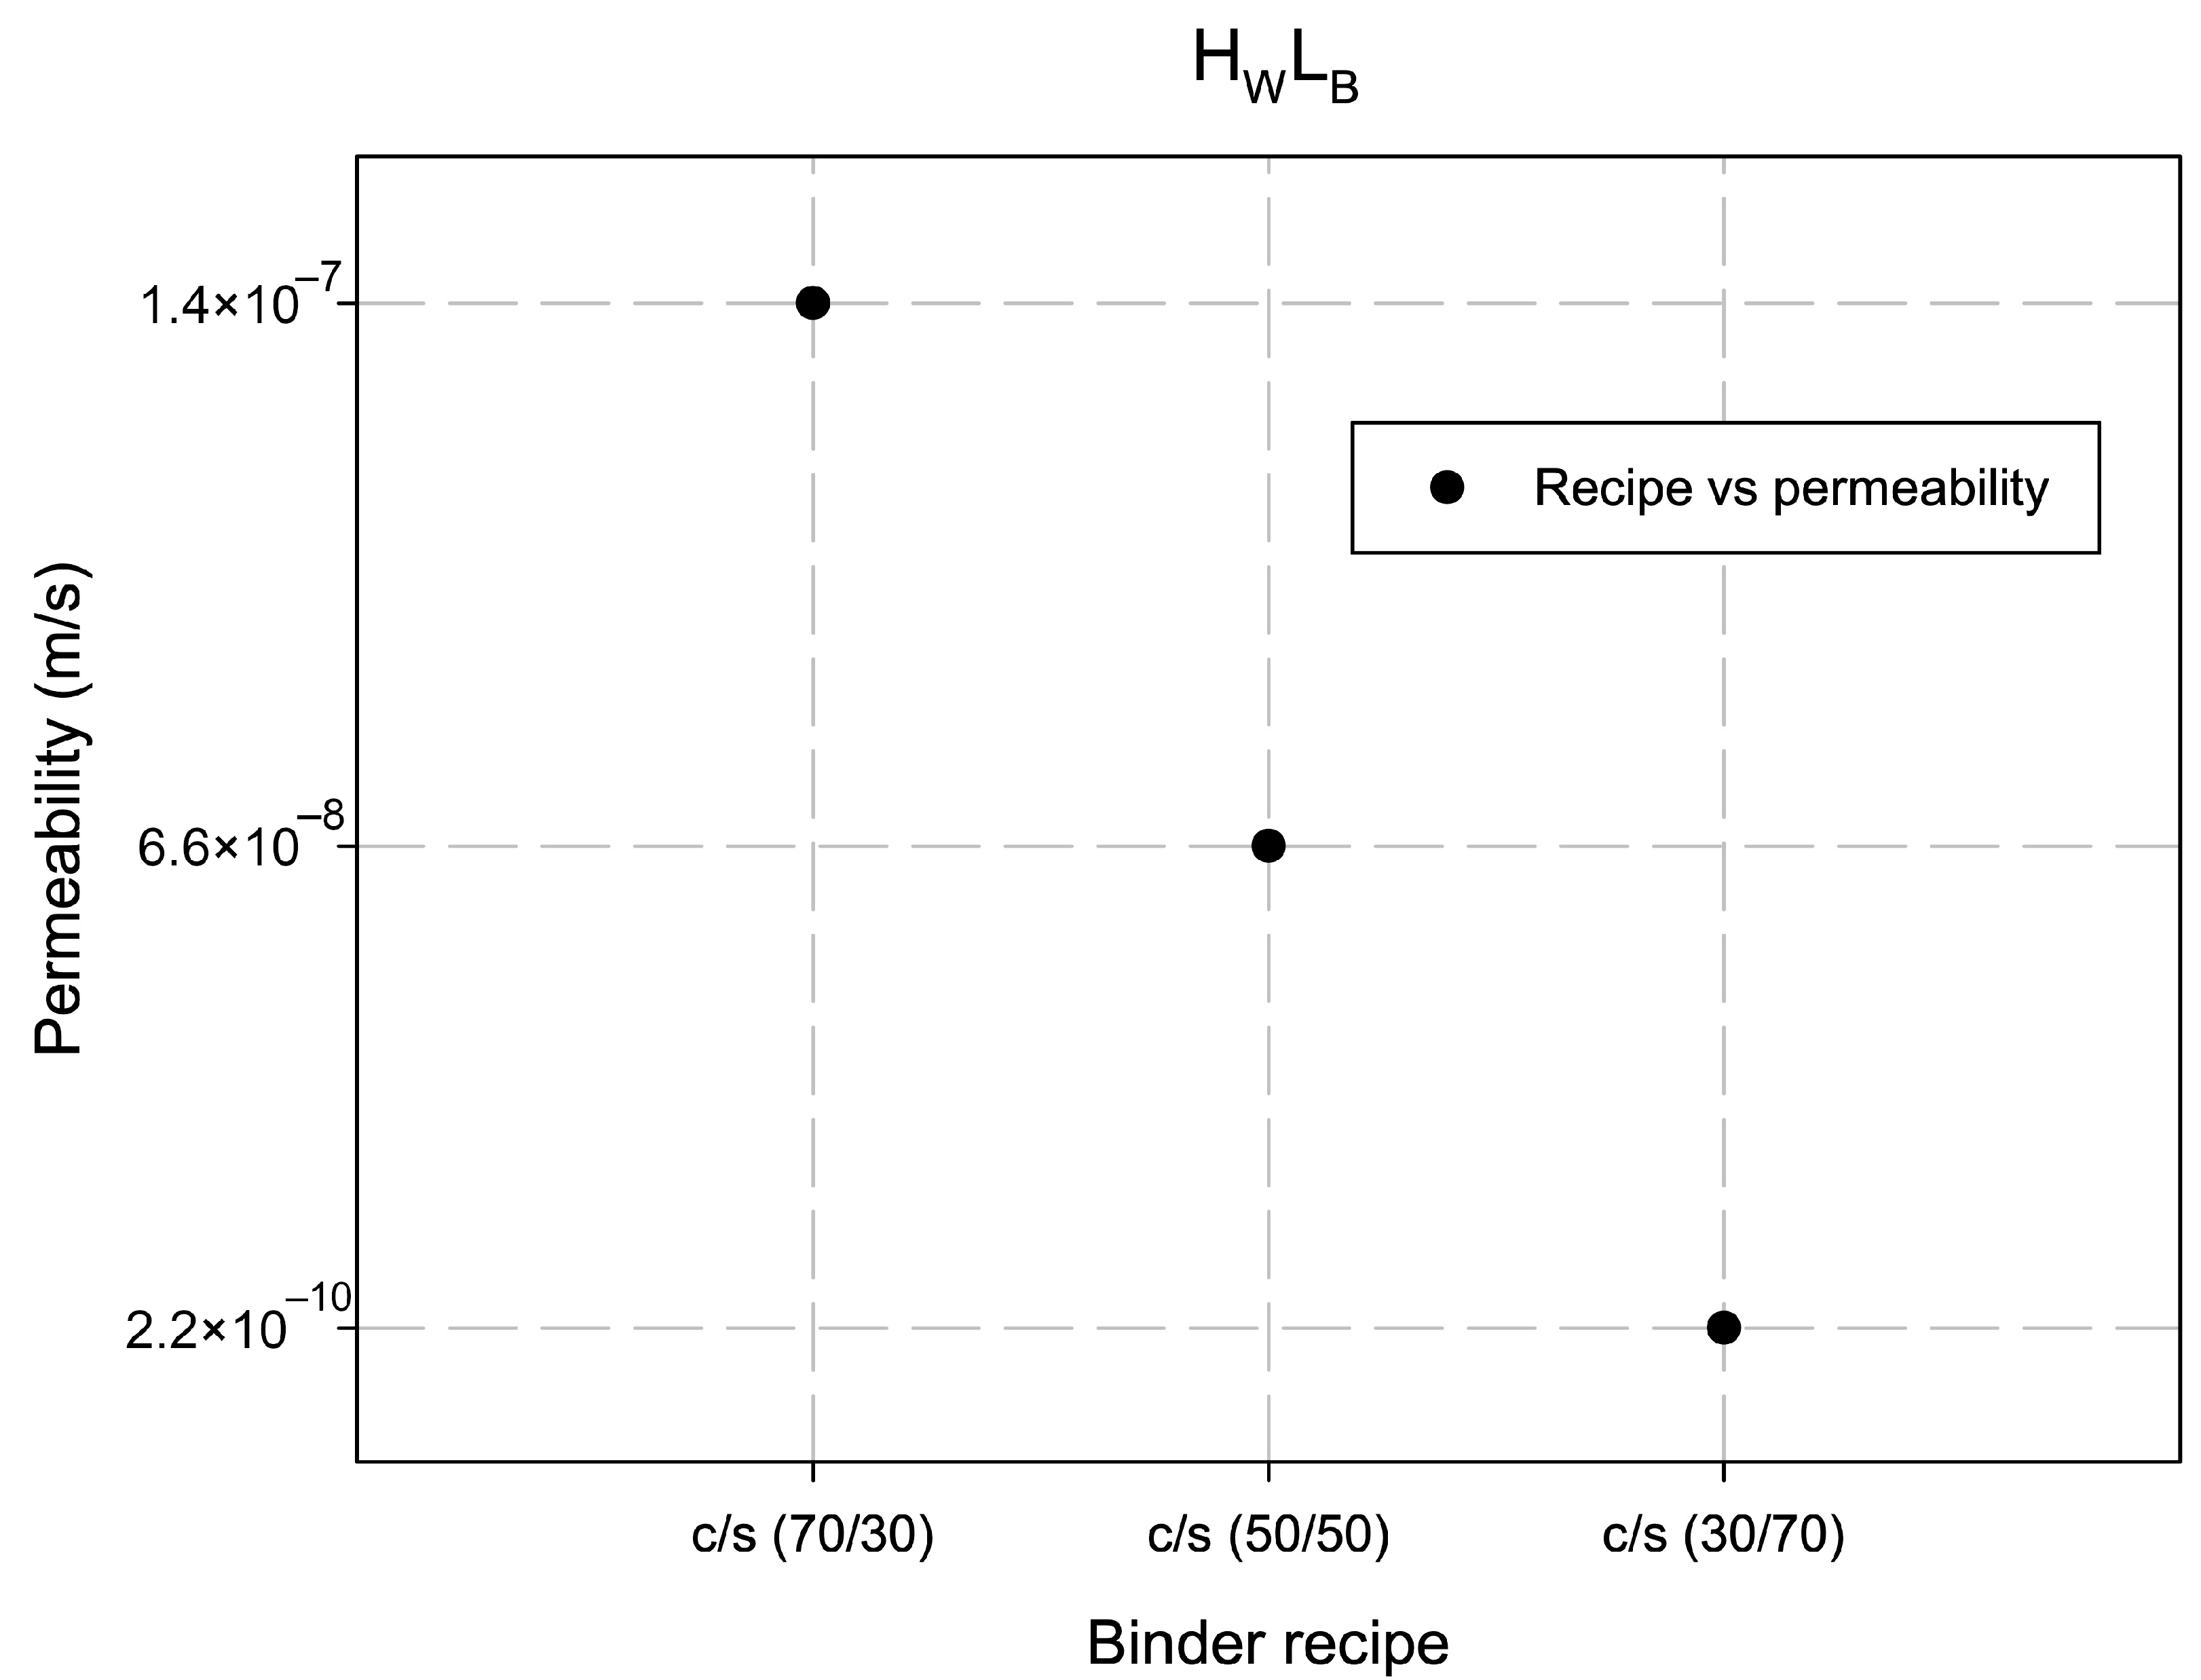
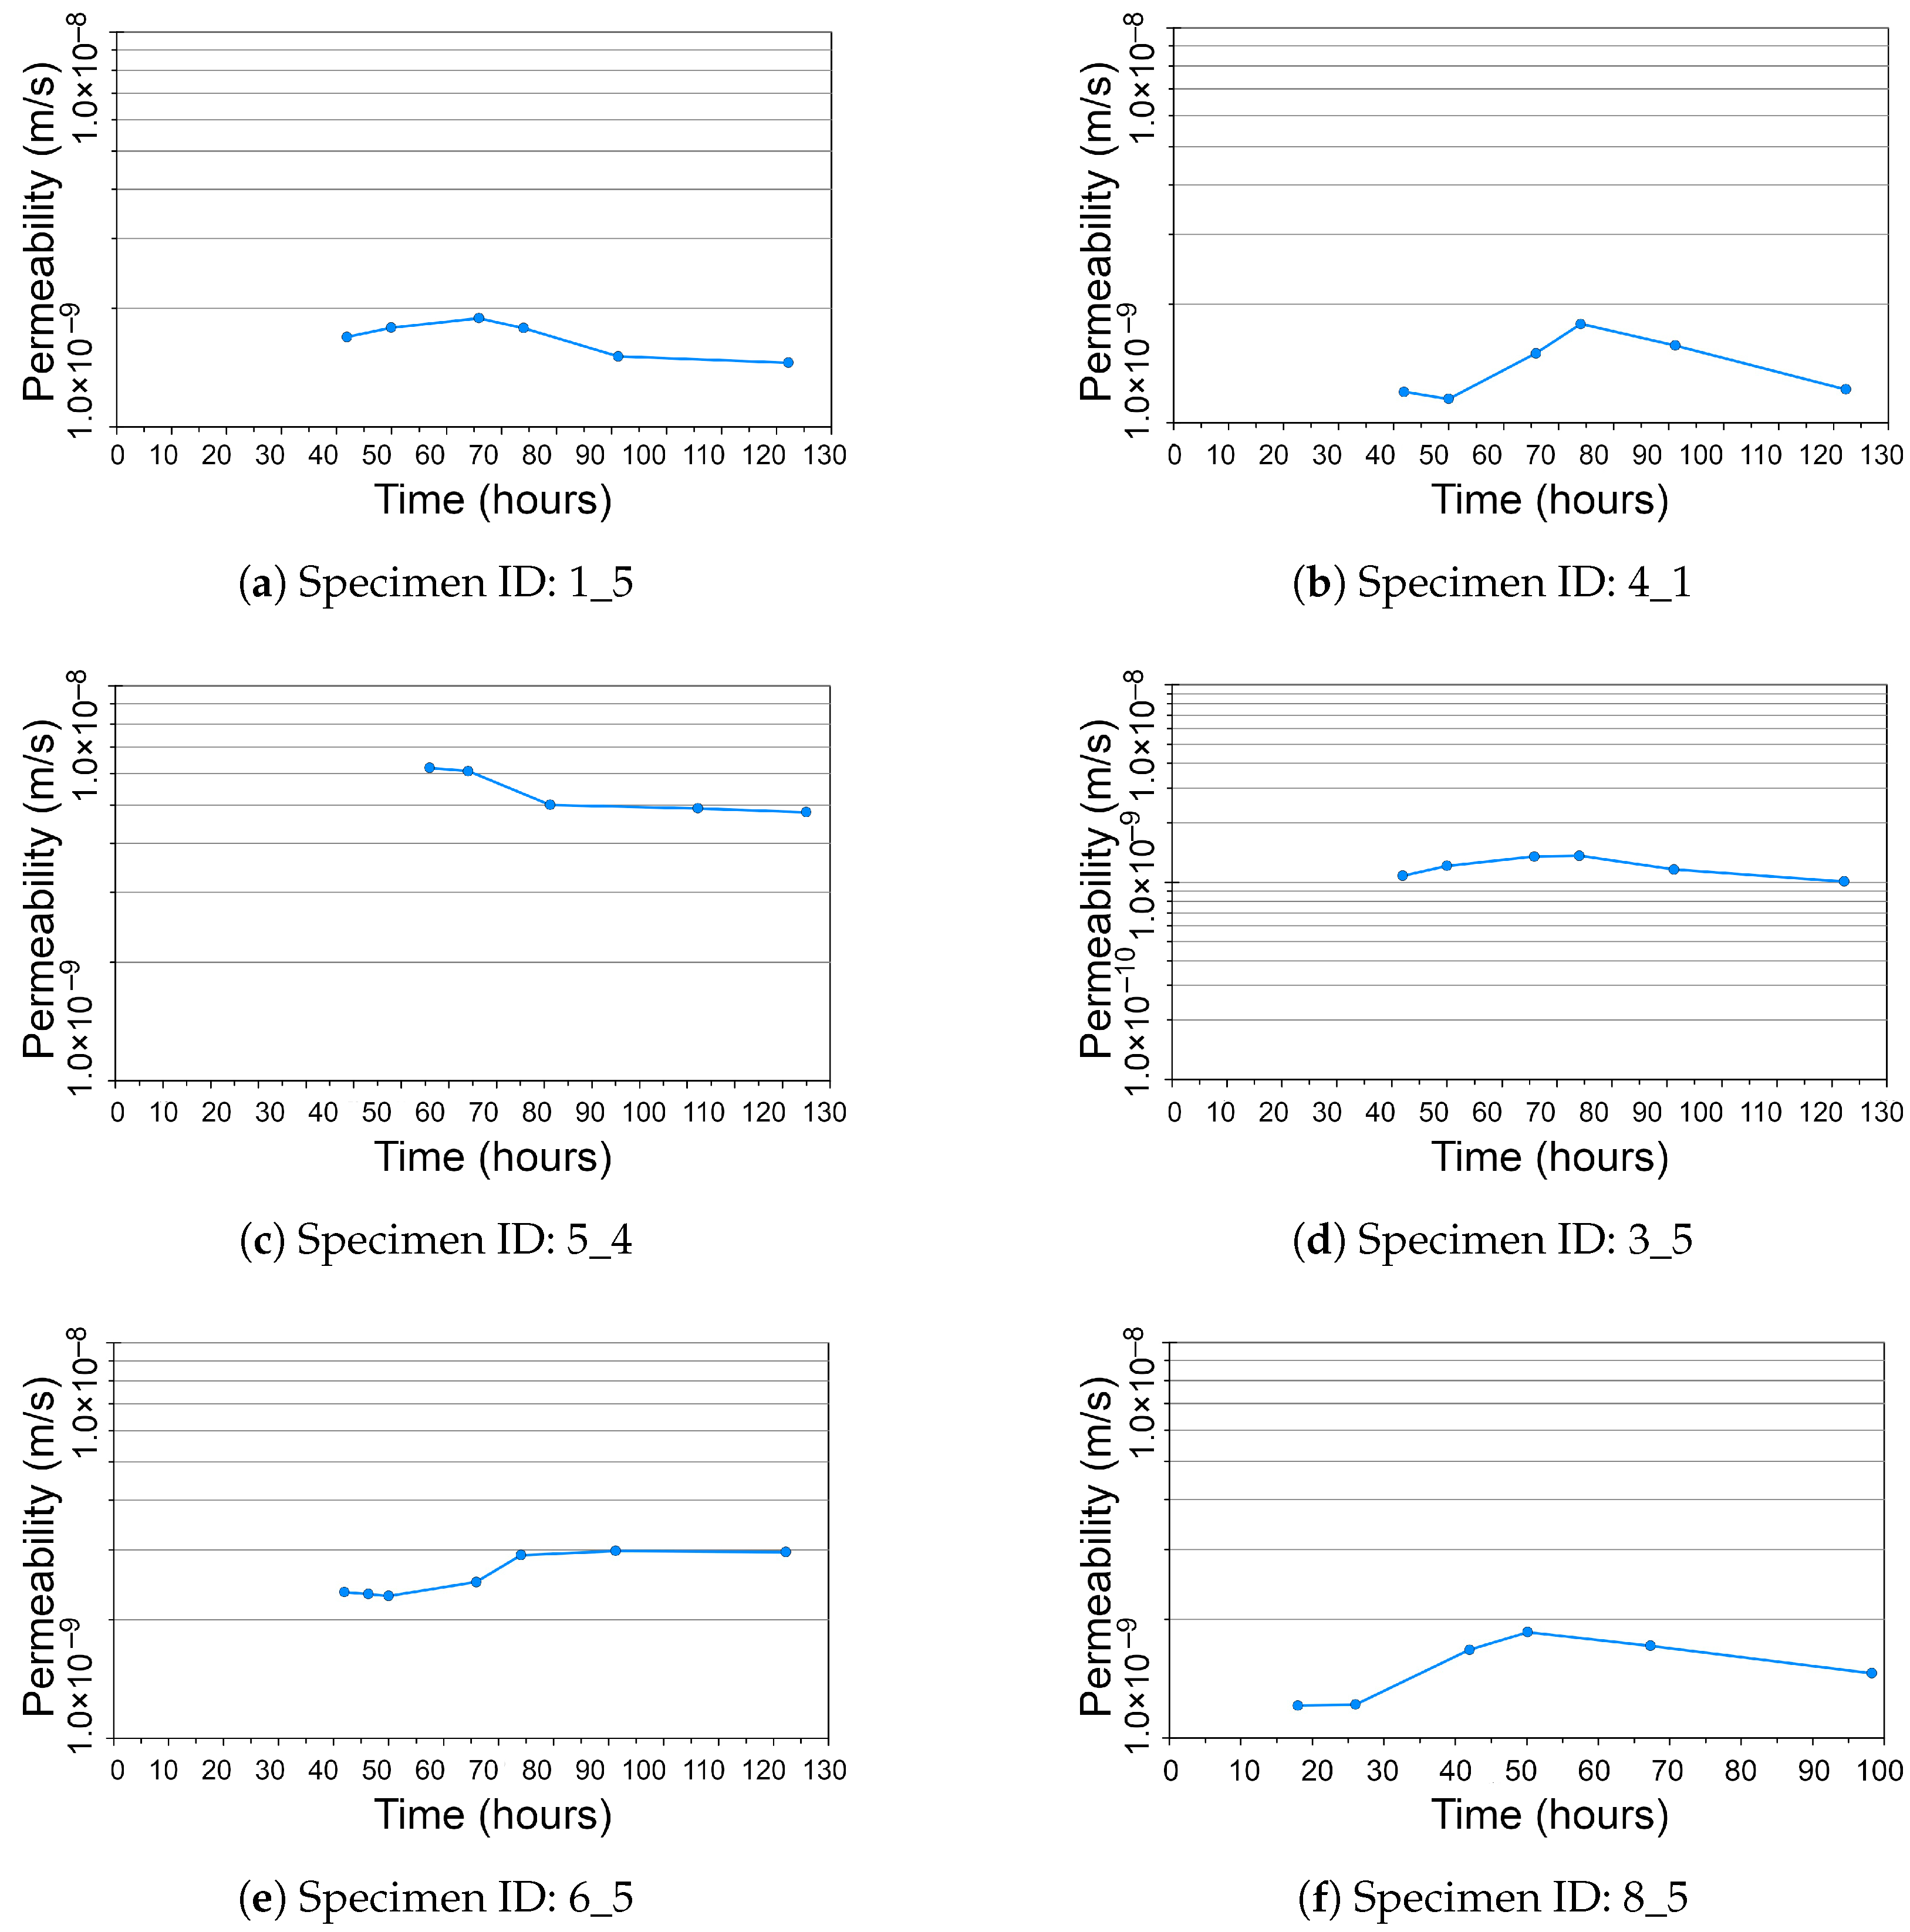
- The permeability of soil was analysed using a permeameter device according to the method SGI No. 15, and compared with optimal parameters for several specimens; the temperature and humidity conditions were maintained in the laboratory.
- The immobilisation of the environmentally critical contaminants was performed through leaching with evaluated concentrations of seven types of heavy metals, PAH, PCB, and TNT. The dynamics of leaching speed and value was recorded and evaluated for 6 h to 64 days with labelling of soil leaching over the defined time intervals.
- The obtained data were recorded for statistical analysis and computer-based modelling. The dynamics of concentration of the contaminants in soil was modelled on the graphs. The behaviour of soil was evaluated using intervals through repetitive soil sampling in laboratory SGI.
- Statistical correction of the outliers caused by biased sampling was performed in the dataset to obtain statistically sound results.
- The prognosis of leaching behaviour was numerically modelled using the developed equations and statistical data analysis. The comparison of the achieved levels of pollution and leached contaminants were compared on the original (background) level to estimate the degree of contamination for environmental risk assessment.
3.1. Soil Permeability
3.2. Concentrations of Contaminants
3.3. Surface Leaching
4. Conclusions
Author Contributions
Funding
Data Availability Statement
Acknowledgments
Conflicts of Interest
Abbreviations
| BCSA | Belite Calcium Sulfoaluminate |
| BaP | Benz[a]pyrene |
| BghiP | Benz[g,h,i]perylene |
| DBT | Dibutyltin |
| DBahA | Dibenz[a,h]anthracene |
| DOT | Dioctyltin |
| DPhT | Diphenyltin |
| IP | Indeno[1,2,3-cd]pyrene |
| MBT | Monobutyltin |
| MOT | Monooctyltin |
| MPhT | Monophenyltin |
| PAH | Polycyclic Aromatic Hydrocarbon |
| PCB | Polychlorinated biphenyl |
| SGI | Swedish Geotechnical Institute |
| TBT | Tributyltin |
| TPhT | Triphenyltin |
| TCyT | Tricyclohexyltin |
| TTBT | Tetrabutyltin |
Appendix A. Leaching of Contaminants: Sampling 2317–2324
Appendix A.1. Surface Leaching of Contaminants

| Period | 6 h | 1 Days | 2.25 Days | 4 Days | 9 Days | 16 Days | 36 Days | 64 Days |
|---|---|---|---|---|---|---|---|---|
| Sample No | 2317 | 2318 | 2319 | 2320 | 2321 | 2322 | 2323 | 2324 |
| pH | 8.93 | 9.12 | 8.85 | 9.18 | 9.17 | 8.95 | 8.43 | 8.11 |
| Conductivity | 2510 | 2500 | 2980 | 2760 | 2740 | 2750 | 2770 | 2750 |
| Redox (mV) | 29 | 73 | 33 | 34 | 21 | 19 | 48 | 84 |
| Al | 2.08 | 1.69 | 1.49 | 1.29 | 0.755 | 0.751 | 0.585 | 0.531 |
| As | 0.0553 | 0.0736 | 0.084 | 0.0852 | 0.0807 | 0.35 | 0.0728 | 0.0669 |
| Ba | 6.31 | 7.02 | 8.4 | 7.5 | 13.1 | 13.3 | 21.6 | 22 |
| Ca | 15,500 | 17,000 | 19,600 | 19,300 | 24,300 | 25,300 | 34,600 | 38,200 |
| Cd | <0.004 | <0.004 | <0.004 | <0.004 | <0.004 | <0.004 | <0.004 | <0.004 |
| Co | 0.038 | 0.0306 | 0.0244 | 0.0202 | 0.0333 | 0.0244 | 0.0358 | 0.0508 |
| Cr | <0.04 | <0.04 | <0.04 | <0.04 | <0.04 | <0.04 | <0.04 | <0.04 |
| Cu | 1.58 | 1.03 | 0.744 | 0.532 | 0.653 | 0.5 | 0.86 | 0.634 |
| Fe | 0.898 | 0.739 | 0.664 | 0.486 | <0.3 | <0.3 | <0.3 | <0.3 |
| Hg | <0.002 | <0.002 | <0.002 | <0.002 | <0.002 | <0.002 | <0.002 | <0.002 |
| K | 15,900 | 15,600 | 17,300 | 16,200 | 15,700 | 15,700 | 16,300 | 15,400 |
| Mg | 39,000 | 38,700 | 43,100 | 40,000 | 33,100 | 34,300 | 26,200 | 25,400 |
| Mn | 1.2 | 0.944 | 0.566 | 0.661 | 0.218 | 0.321 | 0.0646 | 0.0921 |
| Mo | 0.807 | 0.709 | 0.807 | 0.727 | 0.91 | 0.776 | 1.13 | 1.18 |
| Na | 374,000 | 374,000 | 414,000 | 390,000 | 368,000 | 370,000 | 356,000 | 360,000 |
| Ni | 0.285 | 0.271 | 0.237 | 0.211 | 0.272 | 0.182 | 0.24 | 0.182 |
| Pb | <0.02 | <0.02 | <0.02 | <0.02 | <0.02 | <0.02 | <0.02 | <0.02 |
| V | 0.153 | 0.212 | 0.24 | 0.282 | 0.391 | 0.264 | 0.155 | 0.139 |
| Zn | 0.18 | <0.2 | <0.2 | 0.179 | <0.2 | <0.2 | <0.2 | <0.2 |
| B | 140 | 142 | 157 | 145 | 126 | 126 | 101 | 101 |
| Sb | 0.0467 | 0.0534 | 0.0496 | 0.0575 | 0.0822 | 0.0688 | 0.11 | 0.116 |
| Se | <0.2 | <0.2 | <0.2 | <0.2 | <0.2 | 7.2 | <0.2 | <0.2 |
| Naphthalene | <0.002 | <0.002 | <0.002 | <0.002 | <0.002 | <0.002 | <0.002 | <0.002 |
| Acy | <0.0008 | <0.0008 | <0.0008 | <0.0008 | <0.0008 | <0.0008 | <0.0008 | <0.0008 |
| Acenaphthene | <0.0008 | <0.0008 | <0.0008 | <0.0008 | 0.00099 | 0.00084 | <0.0008 | <0.0008 |
| Fluorine | <0.0008 | <0.0008 | <0.0008 | <0.0008 | <0.0008 | <0.0008 | <0.0008 | <0.0008 |
| Phenanthrene | <0.002 | <0.002 | <0.002 | <0.002 | <0.002 | <0.002 | <0.002 | <0.002 |
| Anthracene | <0.0008 | <0.0008 | <0.0008 | <0.0008 | <0.0008 | <0.0008 | <0.0008 | <0.0008 |
| Fluoranthene | <0.0008 | <0.0008 | <0.0008 | <0.00084 | 0.002 | 0.0014 | 0.0019 | <0.0008 |
| Pyrene | <0.0008 | 0.0013 | 0.002 | 0.0021 | 0.0037 | 0.004 | 0.0052 | 0.0028 |
| B[a]A | <0.0008 | <0.0008 | <0.0008 | <0.0008 | <0.0008 | <0.0008 | <0.0008 | <0.0008 |
| Chrysene | <0.0008 | <0.0008 | <0.0008 | <0.0008 | <0.0008 | <0.0008 | <0.0008 | <0.0008 |
| BjF | <0.0008 | <0.0008 | <0.0008 | <0.0008 | <0.0008 | <0.0008 | <0.0008 | <0.0008 |
| BkF | <0.0008 | <0.0008 | <0.0008 | <0.0008 | <0.0008 | <0.0008 | <0.0008 | <0.0008 |
| BaP | <0.0008 | <0.0008 | <0.0008 | <0.0008 | <0.0008 | <0.0008 | <0.0008 | <0.0008 |
| DBahA | <0.0008 | <0.0008 | <0.0008 | <0.0008 | <0.0008 | <0.0008 | <0.0008 | <0.0008 |
| BghiP | <0.0008 | <0.0008 | <0.0008 | <0.0008 | <0.0008 | <0.0008 | <0.0008 | <0.0008 |
| IP | <0.0008 | <0.0008 | <0.0008 | <0.0008 | <0.0008 | <0.0008 | <0.0008 | <0.0008 |
| Total PAH 16 | <0.0072 | 0.0013 | 0.002 | 0.0029 | 0.0062 | 0.006 | 0.0071 | 0.0028 |
| Total carc. PAH | <0.0027 | <0.0027 | <0.0027 | <0.0027 | <0.0027 | <0.0027 | <0.0027 | <0.0027 |
| Total oth. PAH | <0.005 | 0.0013 | 0.002 | 0.0029 | 0.0062 | 0.006 | 0.0071 | 0.0028 |
| Total PAH L | <0.0019 | <0.0019 | <0.0019 | <0.0019 | 0.00099 | 0.00084 | <0.0019 | <0.0019 |
| Total PAH M | <0.002 | 0.0013 | 0.002 | 0.0029 | 0.0052 | 0.0052 | 0.0071 | 0.0028 |
| Total PAH H | <0.003 | <0.003 | <0.003 | <0.003 | <0.003 | <0.003 | <0.003 | <0.003 |
| MBT | 0.000404 | 0.00326 | 0.00202 | 0.00223 | 0.00536 | 0.0055 | 0.0044 | 0.00711 |
| DBT | <0.00008 | <0.00008 | <0.00008 | <0.00008 | 0.000142 | 0.000112 | 0.000153 | 0.00024 |
| TBT | 0.0000807 | 0.0000951 | <0.00008 | 0.0000883 | 0.000101 | 0.000104 | 0.0000799 | 0.000133 |
| TTBT | <0.00008 | <0.00008 | <0.00008 | <0.00008 | <0.00008 | <0.00008 | <0.00008 | <0.00008 |
| MOT | <0.00008 | <0.00008 | <0.00008 | <0.00008 | <0.00008 | <0.00008 | <0.00008 | <0.00008 |
| DOT | <0.00008 | <0.00008 | <0.00008 | <0.00008 | <0.00008 | <0.00008 | <0.00008 | <0.00008 |
| TCyT | <0.00008 | <0.00008 | <0.00008 | <0.00008 | <0.00008 | <0.00008 | <0.00008 | <0.00008 |
| MPhT | <0.00008 | <0.00008 | <0.00008 | <0.00008 | <0.00008 | <0.00008 | <0.00008 | <0.00008 |
| DPhT | <0.00008 | <0.00008 | <0.00008 | <0.00008 | <0.00008 | <0.00008 | <0.00008 | <0.00008 |
| TPhT | <0.00008 | <0.00008 | <0.00008 | <0.00008 | <0.00008 | <0.00008 | <0.00008 | <0.00008 |
| PCB 28 | <0.000084 | <0.000084 | <0.000084 | <0.000084 | <0.000084 | <0.000084 | <0.000084 | <0.000084 |
| PCB 52 | <0.000084 | <0.000084 | <0.000084 | <0.000084 | <0.000084 | <0.000084 | <0.000084 | <0.000084 |
| PCB 101 | <0.000084 | <0.000084 | <0.000084 | <0.000084 | <0.000084 | <0.000084 | <0.000084 | <0.000084 |
| PCB 118 | <0.000084 | <0.000084 | <0.000084 | <0.000084 | <0.000084 | <0.000084 | <0.000084 | <0.000084 |
| PCB 138 | <0.000091 | <0.000091 | <0.000091 | <0.000091 | <0.000091 | <0.000091 | <0.000091 | <0.000091 |
| PCB 153 | <0.000084 | <0.000084 | <0.000084 | <0.000084 | <0.000084 | <0.000084 | <0.000084 | <0.000084 |
| PCB 180 | <0.000084 | <0.000084 | <0.000084 | <0.000084 | <0.000084 | <0.000084 | <0.000084 | <0.000084 |
| Total PCB 7 | <0.0003 | <0.0003 | <0.0003 | <0.0003 | <0.0003 | <0.0003 | <0.0003 | <0.0003 |
Appendix A.2. Cumulative Surface Leaching of Contaminants
- Standards SS-EN ISO 10523:2012 with measurement uncertainty of ±0.05 pH-enh;
- SS-EN 27888-1:1994 with measurement uncertainty ±2.9%;
- SGI-method with measurement uncertainty pf ± 25%.
| Period | 6 h | 1 Days | 2.25 Days | 4 Days | 9 Days | 16 Days | 36 Days | 64 Days |
|---|---|---|---|---|---|---|---|---|
| Sample No | 2317 | 2318 | 2319 | 2320 | 2321 | 2322 | 2323 | 2324 |
| Al | 2.08 | 3.77 | 5.26 | 6.55 | 7.3 | 8.05 | 8.64 | 9.17 |
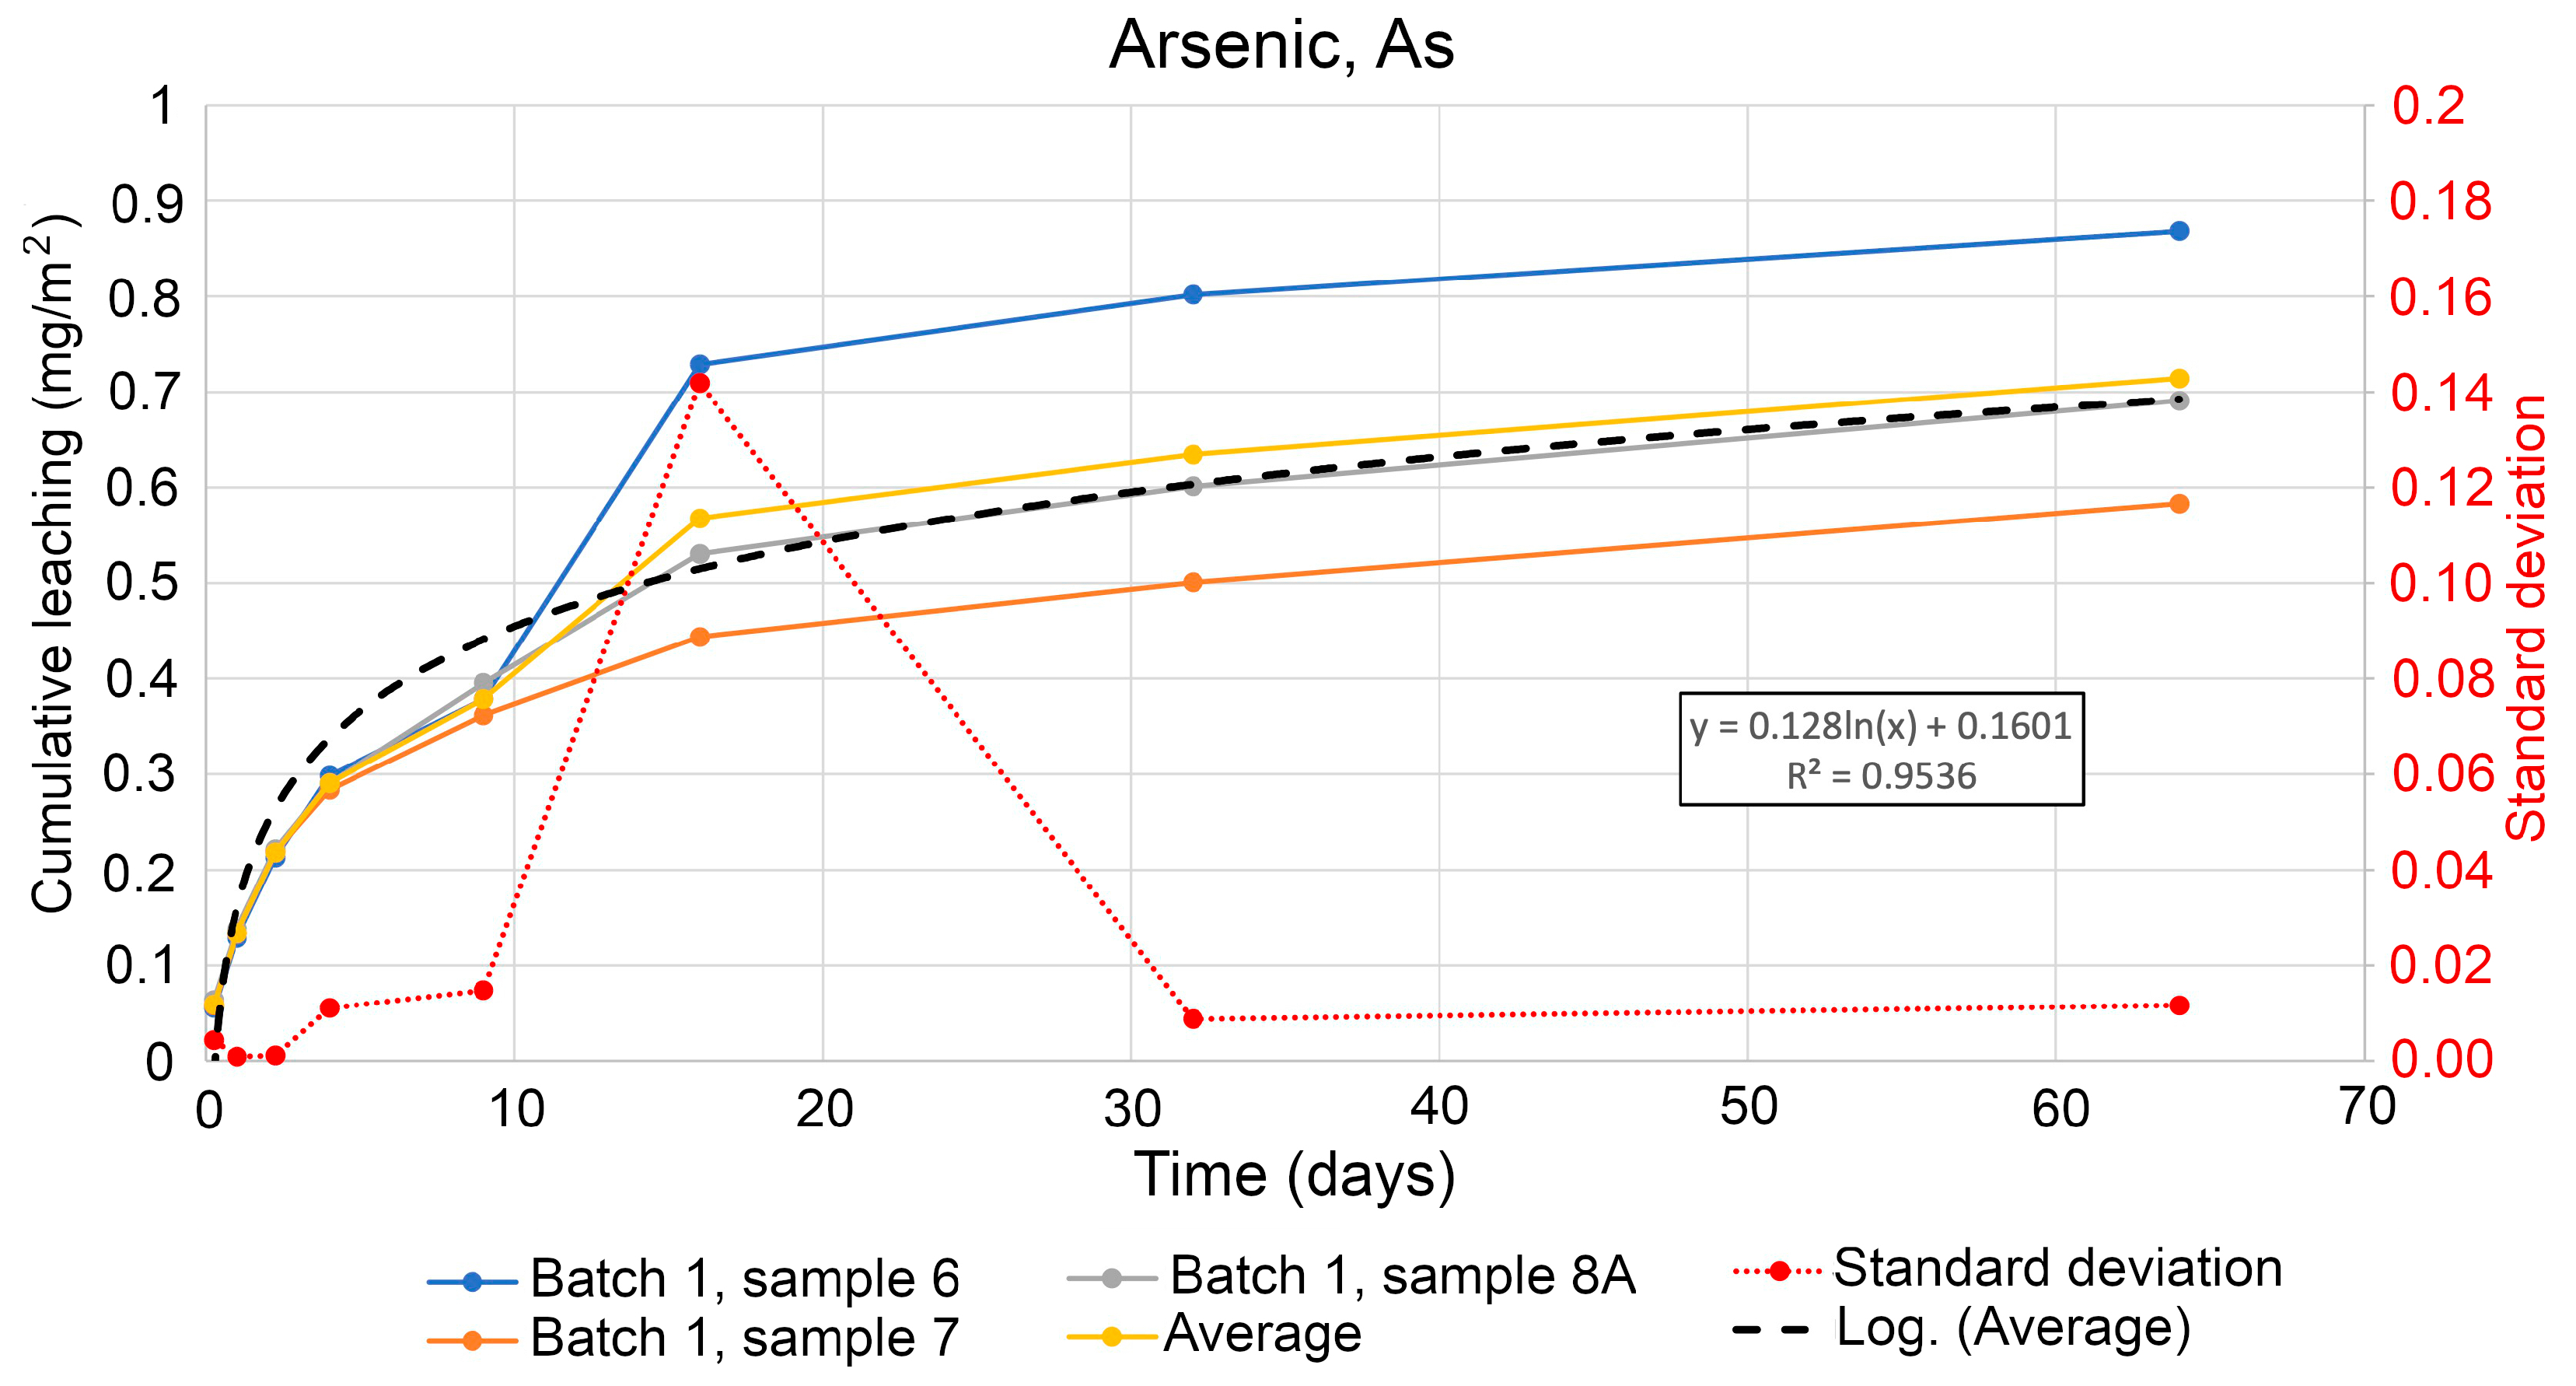
| As | 0.0553 | 0.129 | 0.21 | 0.298 | 0.379 | 0.73 | 0.802 | 0.868 |
| Ba | 6.31 | 13.3 | 22 | 29.2 | 42.3 | 55.6 | 77.2 | 99 |
| Ca | 15,500 | 32,000 | 51,900 | 71,200 | 95,500 | 121,000 | 155,000 | 194,000 |
| Cd | <0.004 | <0.008 | <0.01 | <0.02 | <0.02 | <0.02 | <0.03 | <0.03 |
| Co | 0.038 | 0.0686 | 0.093 | 0.113 | 0.147 | 0.171 | 0.207 | 0.258 |
| Cr | <0.04 | <0.08 | <0.1 | <0.2 | <0.1 | <0.1 | <0.3 | <0.3 |
| Cu | 1.58 | 2.6 | 3.35 | 3.88 | 4.53 | 5 | 5.89 | 6.53 |
| Fe | 0.898 | 1.64 | 2.3 | 2.79 | <3 | <3 | <4 | <4 |
| Hg | <0.002 | <0.003 | <0.005 | <0.006 | <0.008 | <0.009 | <0.01 | <0.01 |
| K | 15,900 | 31,500 | 48,800 | 65,000 | 80,700 | 96,400 | 113,000 | 128,000 |
| Mg | 39,000 | 77,500 | 121,000 | 161,000 | 194,000 | 228,000 | 254,000 | 280,000 |
| Mn | 1.2 | 2.16 | 2.73 | 3.39 | 3.61 | 3.93 | 3.99 | 4.08 |
| Mo | 0.807 | 1.52 | 2.32 | 3.05 | 4 | 4.74 | 5.87 | 7.05 |
| Na | 374,000 | 748,000 | 1,160,000 | 1,550,000 | 1,920,000 | 2,290,000 | 2,650,000 | 3,000,000 |
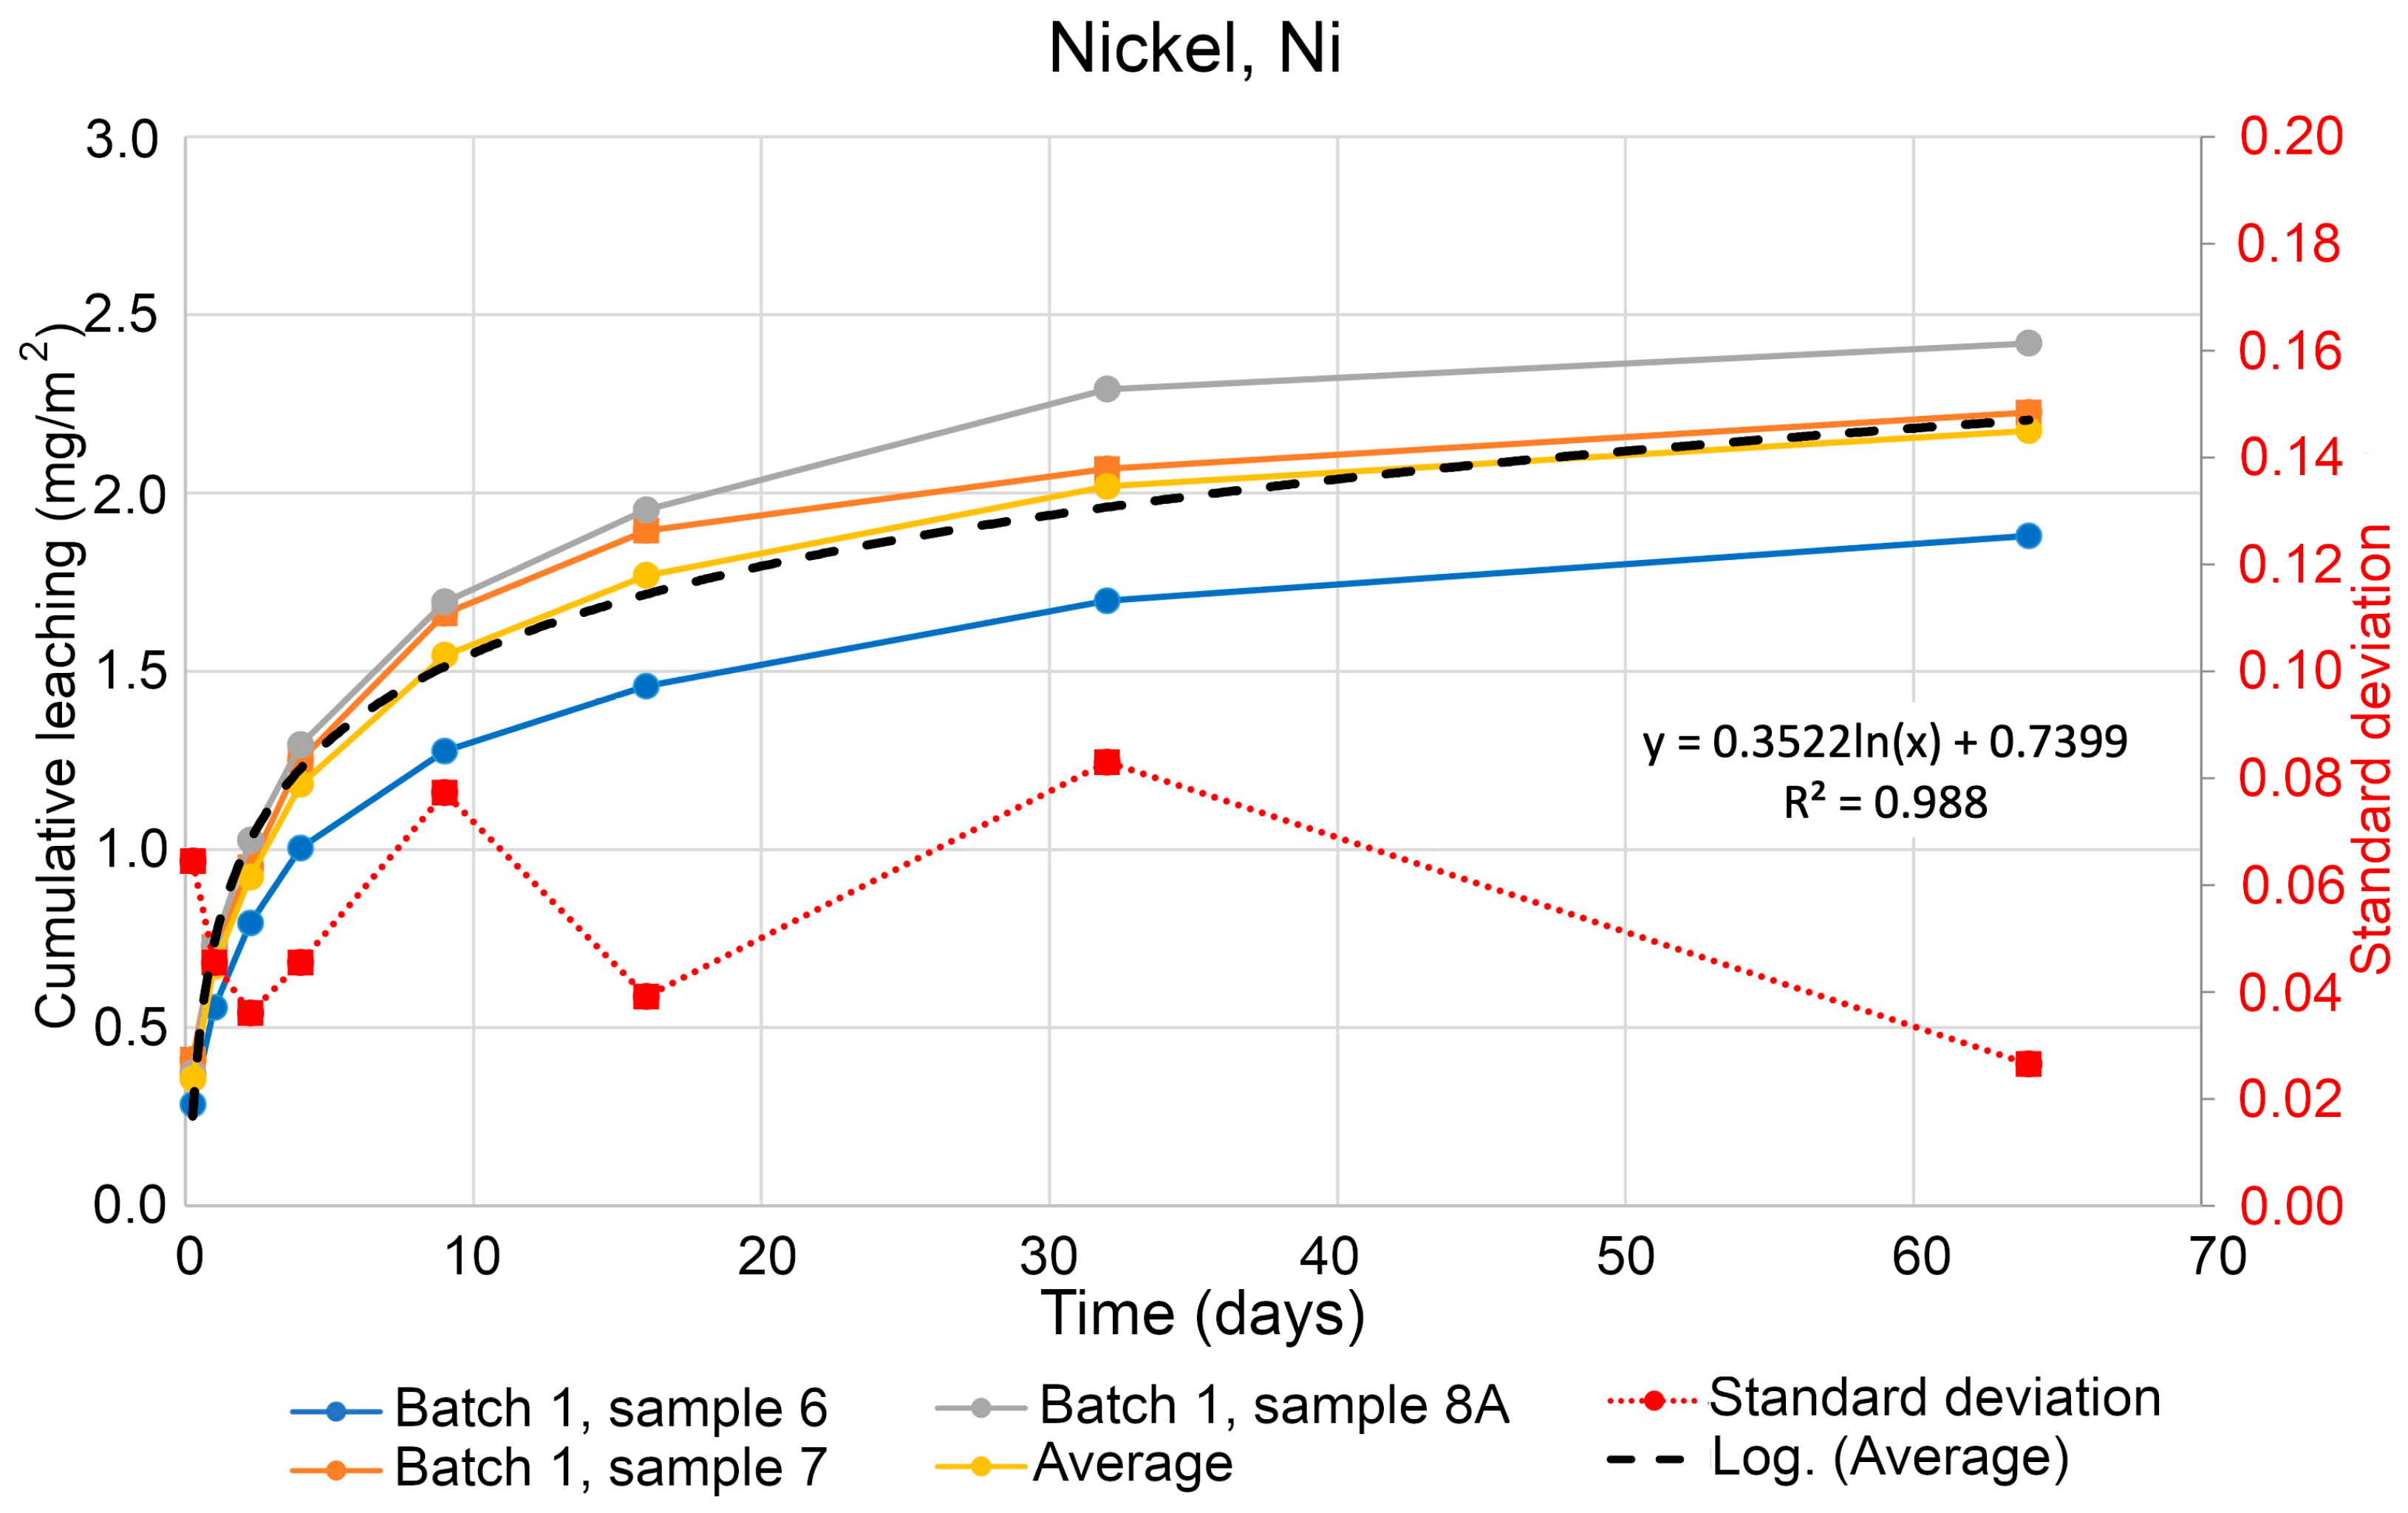
| Ni | 0.285 | 0.556 | 0.793 | 1 | 1.28 | 1.46 | 1.7 | 1.88 |
| Pb | <0.02 | <0.03 | <0.05 | <0.06 | <0.08 | <0.09 | <0.1 | <0.1 |
| V | 0.153 | 0.365 | 0.605 | 0.887 | 1.28 | 1.54 | 1.7 | 1.84 |
| Zn | 0.18 | <0.3 | <0.5 | 0.666 | <0.8 | <1 | <1 | <1 |
| B | 140 | 282 | 438 | 584 | 710 | 836 | 937 | 1040 |
| Sb | 0.0467 | 0.1 | 0.15 | 0.207 | 0.289 | 0.358 | 0.468 | 0.584 |
| Se | <0.2 | <0.5 | <0.7 | <0.9 | <1 | 8.34 | <9 | <9 |
| Naphthalene | <0.002 | <0.005 | <0.007 | <0.009 | <0.01 | <0.01 | <0.02 | <0.02 |
| Acy | <0.0008 | <0.002 | <0.002 | <0.003 | <0.004 | <0.005 | <0.005 | <0.006 |
| Acenaphthene | <0.0008 | <0.002 | <0.002 | <0.003 | <0.004 | 0.0049 | <0.006 | <0.006 |
| Fluorine | <0.0008 | <0.002 | <0.002 | <0.003 | <0.004 | <0.005 | <0.005 | <0.006 |
| Phenanthrene | <0.002 | <0.003 | <0.005 | <0.006 | <0.008 | <0.009 | <0.01 | <0.01 |
| Anthracene | <0.0008 | <0.002 | <0.002 | <0.003 | <0.004 | <0.005 | <0.002 | <0.006 |
| Fluoranthene | <0.0008 | <0.002 | <0.002 | 0.0031 | 0.005 | 0.006 | 0.0079 | <0.009 |
| Pyrene | <0.0008 | 0.0021 | 0.004 | 0.0056 | 0.0093 | 0.01 | 0.018 | 0.021 |
| B[a]A | <0.0008 | <0.002 | <0.002 | <0.003 | <0.004 | <0.005 | <0.005 | <0.006 |
| Chrysene | <0.0008 | <0.002 | <0.002 | <0.003 | <0.004 | <0.005 | <0.005 | <0.006 |
| BjF | <0.0008 | <0.002 | <0.002 | <0.003 | <0.004 | <0.005 | <0.005 | <0.006 |
| BkF | <0.0008 | <0.002 | <0.002 | <0.003 | <0.004 | <0.005 | <0.005 | <0.006 |
| BaP | <0.0008 | <0.002 | <0.002 | <0.003 | <0.004 | <0.005 | <0.005 | <0.006 |
| DBahA | <0.0008 | <0.002 | <0.002 | <0.003 | <0.004 | <0.005 | <0.005 | <0.006 |
| BghiP | <0.0008 | <0.002 | <0.002 | <0.003 | <0.004 | <0.005 | <0.005 | <0.006 |
| IP | <0.0008 | <0.002 | <0.002 | <0.003 | <0.004 | <0.005 | <0.005 | <0.006 |
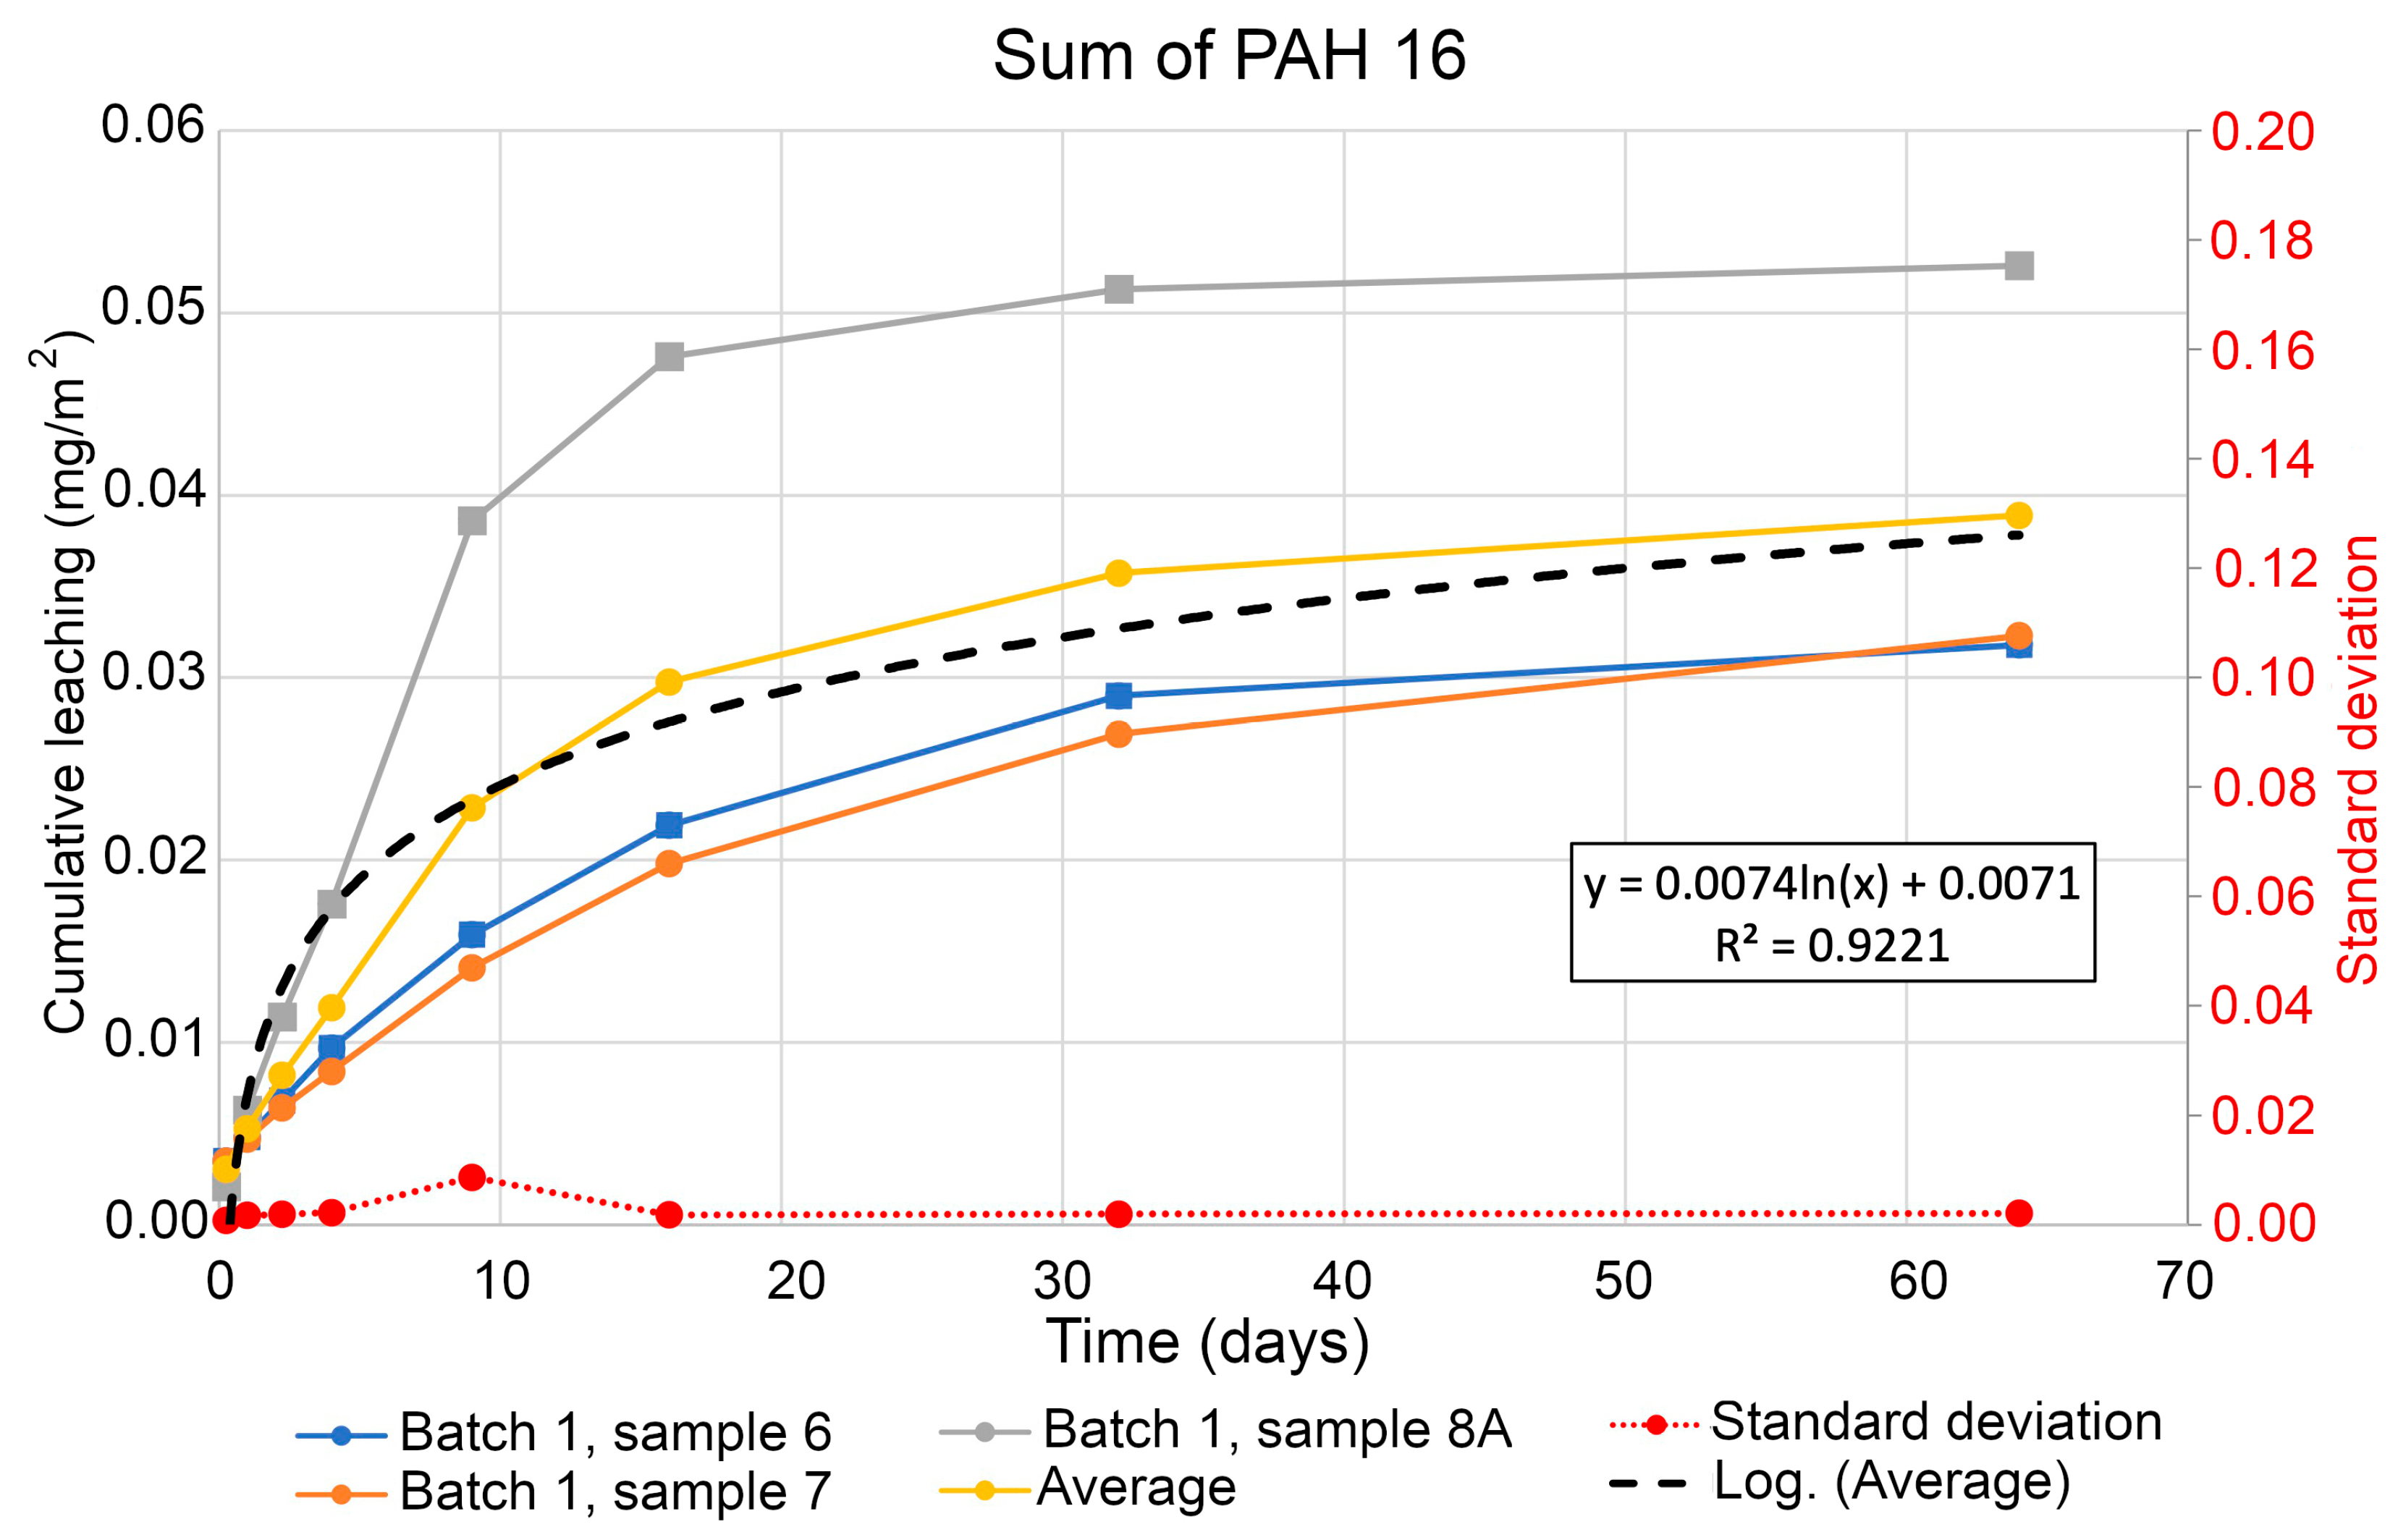
| Total PAH 16 | <0.0072 | 0.0085 | 0.01 | 0.013 | 0.019 | 0.025 | 0.032 | 0.035 |
| Total carc. PAH | <0.0027 | <0.0053 | <0.008 | <0.011 | <0.013 | <0.016 | <0.019 | <0.021 |
| Total oth. PAH | <0.005 | 0.0059 | 0.007 | 0.01 | 0.016 | 0.022 | 0.03 | 0.032 |
| Total PAH L | <0.0019 | <0.0038 | <0.0057 | <0.0076 | 0.0086 | 0.0094 | <0.011 | <0.013 |
| Total PAH M | <0.002 | 0.0036 | 0.005 | 0.008 | 0.013 | 0.018 | 0.025 | 0.028 |
| Total PAH H | <0.003 | <0.006 | <0.009 | <0.01 | <0.02 | <0.02 | <0.02 | <0.02 |
| MBT | 0.000404 | 0.00366 | 0.00569 | 0.00792 | 0.0133 | 0.0188 | 0.0232 | 0.0303 |
| DBT | <0.00008 | <0.0002 | <0.0002 | <0.0003 | 0.000446 | 0.000558 | 0.000711 | 0.00095 |
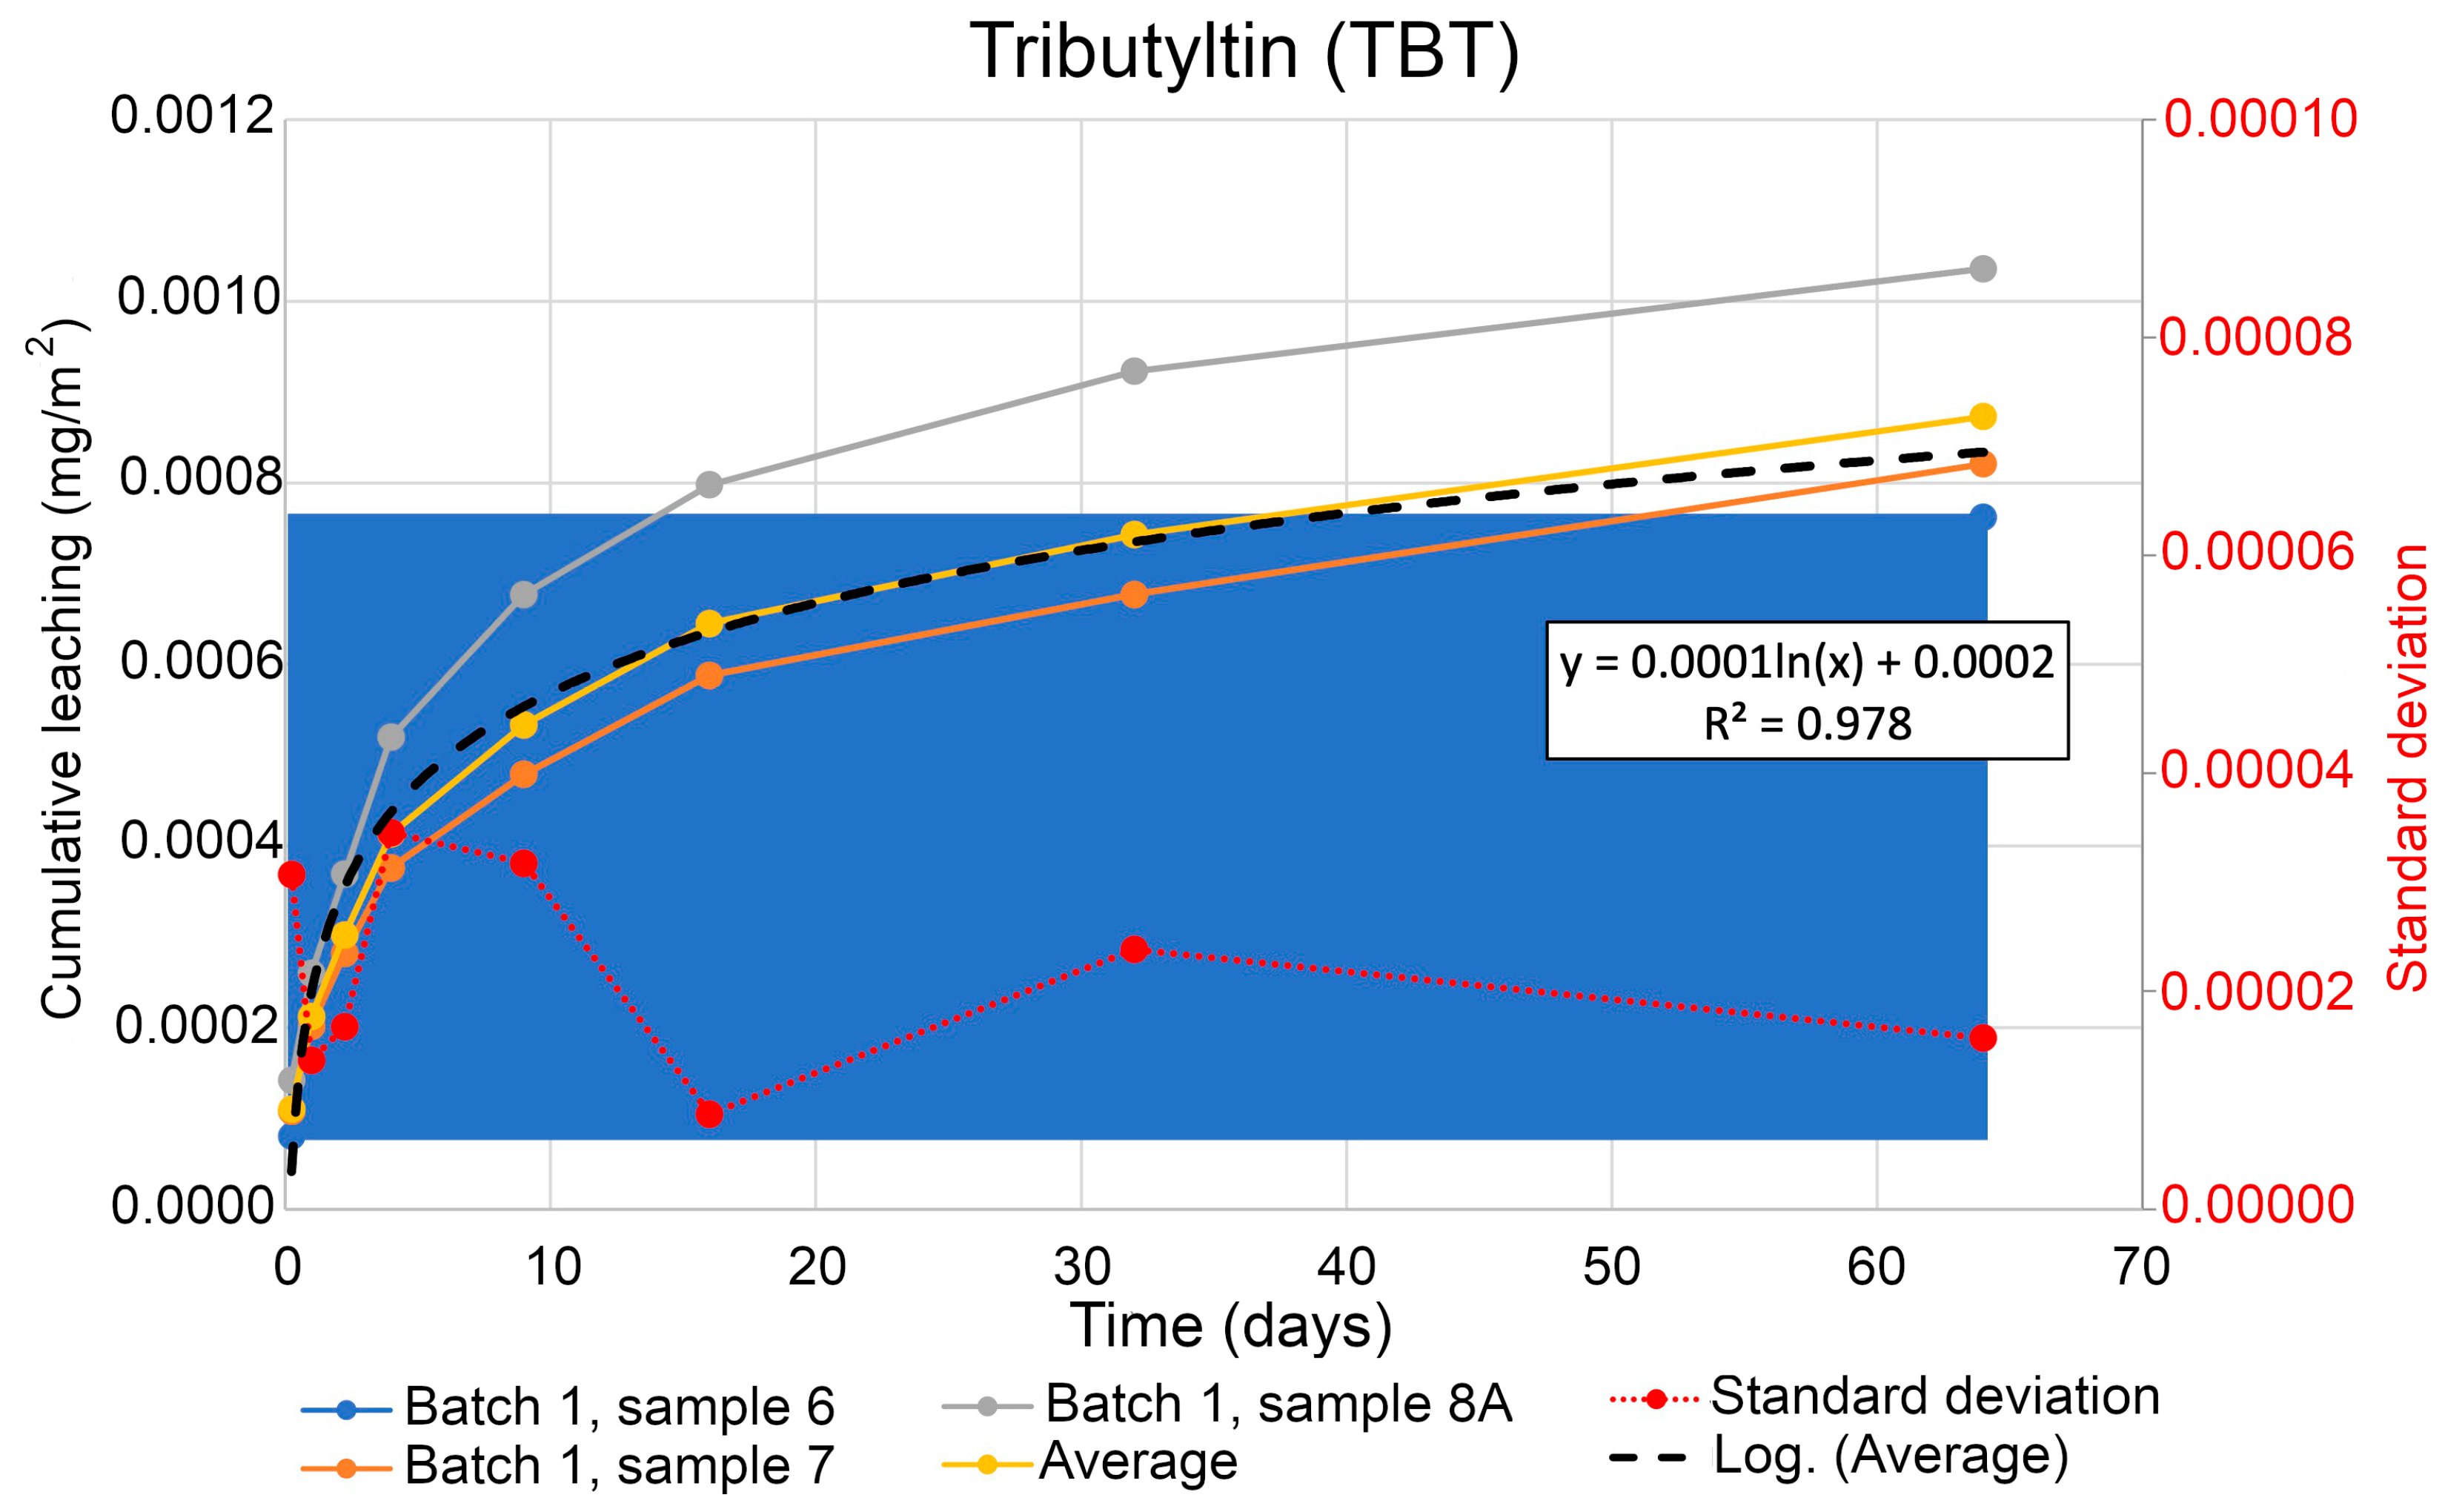
| TBT | 0.0000807 | 0.000176 | <0.0003 | 0.00034 | 0.000441 | 0.000545 | 0.000625 | 0.000758 |
| TTBT | <0.00008 | <0.0002 | <0.0002 | <0.0003 | <0.0004 | <0.0005 | <0.0005 | <0.0006 |
| MOT | <0.00008 | <0.0002 | <0.0002 | <0.0003 | <0.0004 | <0.0005 | <0.0005 | <0.0006 |
| DOT | <0.00008 | <0.0002 | <0.0002 | <0.0003 | <0.0004 | <0.0005 | <0.0005 | <0.0006 |
| TCyT | <0.00008 | <0.0002 | <0.0002 | <0.0003 | <0.0004 | <0.0005 | <0.0005 | <0.0006 |
| MPhT | <0.00008 | <0.0002 | <0.0002 | <0.0003 | <0.0004 | <0.0005 | <0.0005 | <0.0006 |
| DPhT | <0.00008 | <0.0002 | <0.0002 | <0.0003 | <0.0004 | <0.0005 | <0.0005 | <0.0006 |
| TPhT | <0.00008 | <0.0002 | <0.0002 | <0.0003 | <0.0004 | <0.0005 | <0.0005 | <0.0006 |
| PCB 28 | <0.000084 | <0.00017 | <0.00025 | <0.00033 | <0.00042 | <0.0005 | <0.00059 | <0.00067 |
| PCB 52 | <0.000084 | <0.00017 | <0.00025 | <0.00033 | <0.00042 | <0.0005 | <0.00059 | <0.00067 |
| PCB 101 | <0.000084 | <0.00017 | <0.00025 | <0.00033 | <0.00042 | <0.0005 | <0.00059 | <0.00067 |
| PCB 118 | <0.000084 | <0.00017 | <0.00025 | <0.00033 | <0.00042 | <0.0005 | <0.00059 | <0.00067 |
| PCB 138 | <0.000091 | <0.00018 | <0.00027 | <0.00037 | <0.00046 | <0.00055 | <0.00064 | <0.00073 |
| PCB 153 | <0.000084 | <0.00017 | <0.00025 | <0.00033 | <0.00042 | <0.0005 | <0.00059 | <0.00067 |
| PCB 180 | <0.000084 | <0.00017 | <0.00025 | <0.00033 | <0.00042 | <0.0005 | <0.00059 | <0.00067 |
| Total PCB 7 | <0.0003 | <0.00059 | <0.00089 | <0.0012 | <0.0015 | <0.0018 | <0.0021 | <0.0024 |
Appendix B. Leaching of Contaminants: Sampling 2325–2332
Appendix B.1. Surface Leaching of Contaminants
| Period | 6 h | 1 Days | 2.25 Days | 4 Days | 9 Days | 16 Days | 36 Days | 64 Days |
|---|---|---|---|---|---|---|---|---|
| Sample No | 2325 | 2326 | 2327 | 2328 | 2329 | 2330 | 2331 | 2332 |
| pH | 8.94 | 9.21 | 9.1 | 9.2 | 9.22 | 9.06 | 8.42 | 8.21 |
| Conductivity | 2530 | 2510 | 2840 | 2860 | 2600 | 2760 | 2730 | 2740 |
| Redox (mV) | 36 | 70 | 36 | 39 | 30 | 27 | 58 | 87 |
| Al | 1.86 | 1.73 | 1.4 | 1.34 | 0.68 | 0.61 | 0.417 | 0.387 |
| As | 0.0581 | 0.0753 | 0.0859 | 0.0642 | 0.0782 | 0.0821 | 0.0569 | 0.0828 |
| Ba | 6.04 | 6.89 | 7.66 | 6.65 | 13.1 | 13.4 | 21 | 20.1 |
| Ca | 15,900 | 17,400 | 19,600 | 19,000 | 24,200 | 24,300 | 32,300 | 35,000 |
| Cd | 0.0042 | 0.00505 | <0.004 | <0.004 | <0.004 | <0.004 | <0.004 | 0.00431 |
| Co | 0.037 | 0.0295 | 0.0239 | 0.0266 | 0.0419 | 0.0271 | 0.0292 | 0.0413 |
| Cr | <0.04 | <0.04 | <0.04 | <0.04 | <0.04 | <0.04 | <0.04 | <0.04 |
| Cu | 1.3 | 0.936 | 0.674 | 0.539 | 0.599 | 0.594 | 0.89 | 0.967 |
| Fe | 0.859 | 0.66 | 0.59 | 0.463 | <0.3 | <0.3 | <0.3 | <0.3 |
| Hg | <0.002 | <0.002 | <0.002 | <0002 | <0.002 | <0.002 | <0.002 | <0.002 |
| K | 16,000 | 15,600 | 17,500 | 16,300 | 16,000 | 15,400 | 16,200 | 15,500 |
| Mg | 39,400 | 39,400 | 43,600 | 40,700 | 34,000 | 34,300 | 26,700 | 27,200 |
| Mn | 1.33 | 1.03 | 0.542 | 0.561 | 0.196 | 0.271 | 0.0798 | 0.0427 |
| Mo | 0.782 | 0.72 | 0.782 | 0.68 | 0.898 | 0.798 | 1.1 | 1.17 |
| Na | 380,000 | 371,000 | 418,000 | 394,000 | 371,000 | 364,000 | 350,000 | 359,000 |
| Ni | 0.411 | 0.315 | 0.224 | 0.301 | 0.411 | 0.233 | 0.173 | 0.158 |
| Pb | <0.02 | <0.02 | <0.02 | <0.02 | <0.02 | <0.02 | <0.02 | <0.02 |
| V | 0.141 | 0.21 | 0.243 | 0.242 | 0.351 | 0.24 | 0.15 | 0.116 |
| Zn | 0.278 | <0.2 | <0.2 | <0.2 | <0.2 | <0.2 | <0.2 | <0.2 |
| B | 144 | 144 | 157 | 149 | 128 | 124 | 101 | 104 |
| Sb | 0.044 | 0.0485 | 0.0501 | 0.0511 | 0.0882 | 0.0725 | 0.114 | 0.11 |
| Se | <0.2 | <0.2 | <0.2 | <0.2 | <0.2 | 4.2 | <0.2 | <0.2 |
| Naphthalene | <0.002 | <0.002 | <0.002 | <0.002 | <0.002 | <0.002 | <0.002 | <0.002 |
| Acy | <0.0008 | <0.0008 | <0.0008 | <0.0008 | <0.0008 | <0.0008 | <0.0008 | <0.0008 |
| Acenaphthene | <0.0008 | <0.0008 | <0.0008 | <0.0008 | 0.00092 | 0.0008 | <0.0008 | <0.0008 |
| Fluorine | <0.0008 | <0.0008 | <0.0008 | <0.0008 | <0.0008 | <0.0008 | <0.0008 | <0.0008 |
| Phenanthrene | <0.002 | <0.002 | <0.002 | <0.002 | <0.002 | <0.002 | <0.002 | <0.002 |
| Anthracene | <0.0008 | <0.0008 | <0.0008 | <0.0008 | <0.0008 | <0.0008 | <0.0008 | <0.0008 |
| Fluoranthene | <0.0008 | <0.0008 | <0.0008 | <0.0008 | 0.0012 | 0.0012 | 0.0018 | 0.001 |
| Pyrene | <0.0008 | 0.0012 | 0.0017 | 0.002 | 0.0035 | 0.0037 | 0.0053 | 0.0044 |
| B[a]A | <0.0008 | <0.0008 | <0.0008 | <0.0008 | <0.0008 | <0.0008 | <0.0008 | <0.0008 |
| Chrysene | <0.0008 | <0.0008 | <0.0008 | <0.0008 | <0.0008 | <0.0008 | <0.0008 | <0.0008 |
| BjF | <0.0008 | <0.0008 | <0.0008 | <0.0008 | <0.0008 | <0.0008 | <0.0008 | <0.0008 |
| BkF | <0.0008 | <0.0008 | <0.0008 | <0.0008 | <0.0008 | <0.0008 | <0.0008 | <0.0008 |
| BaP | <0.0008 | <0.0008 | <0.0008 | <0.0008 | <0.0008 | <0.0008 | <0.0008 | <0.0008 |
| DBahA | <0.0008 | <0.0008 | <0.0008 | <0.0008 | <0.0008 | <0.0008 | <0.0008 | <0.0008 |
| BghiP | <0.0008 | <0.0008 | <0.0008 | <0.0008 | <0.0008 | <0.0008 | <0.0008 | <0.0008 |
| IP | <0.0008 | <0.0008 | <0.0008 | <0.0008 | <0.0008 | <0.0008 | <0.0008 | <0.0008 |
| Total PAH 16 | <0.0073 | 0.0012 | 0.0017 | 0.002 | 0.0057 | 0.0057 | 0.0071 | 0.0054 |
| Total carc. PAH | <0.0027 | <0.0027 | <0.0027 | <0.0027 | <0.0027 | <0.0027 | <0.0027 | <0.0027 |
| Total oth. PAH | <0.005 | 0.0012 | 0.0017 | 0.002 | 0.0057 | 0.0057 | 0.0071 | 0.0054 |
| Total PAH L | <0.0019 | <0.0019 | <0.0019 | <0.0019 | 0.00092 | 0.0008 | <0.0019 | <0.0019 |
| Total PAH M | <0.002 | 0.0012 | 0.0017 | 0.002 | 0.0048 | 0.0049 | 0.0071 | 0.0054 |
| Total PAH H | <0.003 | <0.003 | <0.003 | <0.003 | <0.003 | <0.003 | <0.003 | <0.003 |
| MBT | 0.000333 | 0.0027 | 0.00229 | 0.00335 | 0.00398 | 0.0153 | 0.00515 | 0.0174 |
| DBT | <0.00008 | <0.00008 | <0.00008 | <0.00008 | 0.00013 | 0.000108 | 0.000132 | 0.000272 |
| TBT | 0.000108 | 0.0000936 | <0.00008 | 0.0000944 | 0.000103 | 0.000109 | 0.000089 | 0.000144 |
| TTBT | <0.00008 | <0.00008 | <0.00008 | <0.00008 | <0.00008 | <0.00008 | <0.00008 | <0.00008 |
| MOT | <0.00008 | <0.00008 | <0.00008 | <0.00008 | <0.00008 | <0.00008 | <0.00008 | <0.00008 |
| DOT | <0.00008 | <0.00008 | <0.00008 | <0.00008 | <0.00008 | <0.00008 | <0.00008 | <0.00008 |
| TCyT | <0.00008 | <0.00008 | <0.00008 | <0.00008 | <0.00008 | <0.00008 | <0.00008 | <0.00008 |
| MPhT | <0.00008 | <0.00008 | <0.00008 | <0.00008 | <0.00008 | <0.00008 | <0.00008 | <0.00008 |
| DPhT | <0.00008 | <0.00008 | <0.00008 | <0.00008 | <0.00008 | <0.00008 | <0.00008 | <0.00008 |
| TPhT | <0.00008 | <0.00008 | <0.00008 | <0.00008 | <0.00008 | <0.00008 | <0.00008 | <0.00008 |
| PCB 28 | <0.000084 | <0.000084 | <0.000084 | <0.000084 | <0.000084 | <0.000084 | <0.000084 | <0.000084 |
| PCB 52 | <0.000084 | <0.000084 | <0.000084 | <0.000084 | <0.000084 | <0.000084 | <0.000084 | <0.000084 |
| PCB 101 | <0.000084 | <0.000084 | <0.000084 | <0.000084 | <0.000084 | <0.000084 | <0.000084 | <0.000084 |
| PCB 118 | <0.000084 | <0.000084 | <0.000084 | <0.000084 | <0.000084 | <0.000084 | <0.000084 | <0.000084 |
| PCB 138 | <0.000092 | <0.000092 | <0.000092 | <0.000092 | <0.000092 | <0.000092 | <0.000092 | <0.000092 |
| PCB 153 | <0.000084 | <0.000084 | <0.000084 | <0.000084 | <0.000084 | <0.000084 | <0.000084 | <0.000084 |
| PCB 180 | <0.000084 | <0.000084 | <0.000084 | <0.000084 | <0.000084 | <0.000084 | <0.000084 | <0.000084 |
| Total PCB 7 | <0.0003 | <0.0003 | <0.0003 | <0.0003 | <0.0003 | <0.0003 | <0.0003 | <0.0003 |
Appendix B.2. Cumulative Surface Leaching of Contaminants
- Standards SS-EN ISO 10523:2012 with measurement uncertainty of ±0.05 pH-enh;
- SS-EN 27888-1:1994 with measurement uncertainty ±2.9%;
- SGI-method with measurement uncertainty pf ± 25%.
| Period | 6 h | 1 Days | 2.25 Days | 4 Days | 9 Days | 16 Days | 36 Days | 64 Days |
|---|---|---|---|---|---|---|---|---|
| Sample No | 2325 | 2326 | 2327 | 2328 | 2329 | 2330 | 2331 | 2332 |
| Al | 1.86 | 3.6 | 5 | 6.32 | 7 | 7.6 | 8.02 | 8.41 |
| As | 0.0581 | 0.133 | 0.219 | 0.284 | 0.362 | 0.444 | 0.501 | 0.584 |
| Ba | 6.04 | 12.9 | 20.6 | 27.2 | 40.3 | 53.8 | 74 | 94.6 |
| Ca | 15,900 | 33,300 | 52,900 | 72,000 | 96,300 | 121,000 | 15,300 | 190,000 |
| Cd | 0.0042 | 0.00927 | <0.01 | <0.02 | <0.02 | <0.02 | <0.03 | 0.0328 |
| Co | 0.037 | 0.0663 | 0.0902 | 0.117 | 0.159 | 0.186 | 0.215 | 0.256 |
| Cr | <0.04 | <0.08 | <0.1 | <0.2 | <0.2 | <0.2 | <0.3 | <0.3 |
| Cu | 1.3 | 2.23 | 2.91 | 3.45 | 4.04 | 4.64 | 5.53 | 6.5 |
| Fe | 0.859 | 1.52 | 2.1 | 2.57 | <3 | <3 | <3 | <4 |
| Hg | <0.002 | <0.003 | <0.005 | <0.006 | <0.008 | <0.009 | <0.01 | <0.01 |
| K | 16,000 | 31,600 | 49,100 | 65,400 | 81,300 | 96,700 | 113,000 | 128,000 |
| Mg | 39,400 | 78,800 | 122,000 | 163,000 | 197,000 | 231,000 | 258,000 | 285,000 |
| Mn | 1.33 | 2.35 | 2.9 | 3.46 | 3.65 | 3.92 | 4 | 4.05 |
| Mo | 0.782 | 1.5 | 2.29 | 3 | 3.87 | 4.66 | 5.7 | 6.9 |
| Na | 380,000 | 747,000 | 1,170,000 | 1,560,000 | 1,930,000 | 2,290,000 | 2,600,000 | 3,010,000 |
| Ni | 0.411 | 0.726 | 0.95 | 1.25 | 1.66 | 1.9 | 2.07 | 2.23 |
| Pb | <0.02 | <0.03 | <0.05 | <0.06 | <0.08 | <0.09 | <0.1 | <0.1 |
| V | 0.141 | 0.35 | 0.591 | 0.833 | 1.18 | 1.4 | 1.57 | 1.69 |
| Zn | 0.278 | <0.4 | <0.6 | <0.7 | <0.9 | <1 | <1 | <1 |
| B | 144 | 288 | 445 | 594 | 722 | 846 | 947 | 1050 |
| Sb | 0.044 | 0.0924 | 0.143 | 0.194 | 0.282 | 0.354 | 0.469 | 0.579 |
| Se | <0.2 | <0.5 | <0.7 | <0.9 | <1 | 5.35 | <6 | <6 |
| Naphthalene | <0.002 | <0.005 | <0.007 | <0.009 | <0.01 | <0.01 | <0.02 | <0.02 |
| Acy | <0.0008 | <0.002 | <0.002 | <0.003 | <0.004 | <0.005 | <0.005 | <0.006 |
| Acenaphthene | <0.0008 | <0.002 | <0.002 | <0.003 | 0.004 | 0.005 | <0.006 | <0.006 |
| Fluorine | <0.0008 | <0.002 | <0.002 | <0.003 | 0.004 | 0.005 | <0.005 | <0.006 |
| Phenanthrene | <0.0008 | <0.002 | <0.002 | <0.003 | 0.004 | 0.005 | <0.005 | <0.006 |
| Anthracene | <0.0008 | <0.002 | <0.002 | <0.003 | 0.004 | 0.005 | <0.005 | <0.006 |
| Fluoranthene | <0.0008 | <0.002 | <0.002 | <0.003 | 0.0043 | 0.0055 | <0.0074 | <0.0084 |
| Pyrene | <0.0008 | 0.0019 | 0.0036 | 0.0056 | 0.0091 | 0.013 | 0.018 | 0.023 |
| B[a]A | <0.0008 | <0.002 | <0.002 | <0.003 | <0.004 | <0.005 | <0.005 | <0.006 |
| Chrysene | <0.0008 | <0.002 | <0.002 | <0.003 | <0.004 | <0.005 | <0.005 | <0.006 |
| BjF | <0.0008 | <0.002 | <0.002 | <0.003 | <0.004 | <0.005 | <0.005 | <0.006 |
| BkF | <0.0008 | <0.002 | <0.002 | <0.003 | <0.004 | <0.005 | <0.005 | <0.006 |
| BaP | <0.0008 | <0.002 | <0.002 | <0.003 | <0.004 | <0.005 | <0.005 | <0.006 |
| DBahA | <0.0008 | <0.002 | <0.002 | <0.003 | <0.004 | <0.005 | <0.005 | <0.006 |
| BghiP | <0.0008 | <0.002 | <0.002 | <0.003 | <0.004 | <0.005 | <0.005 | <0.006 |
| IP | <0.0008 | <0.002 | <0.002 | <0.003 | <0.004 | <0.005 | <0.005 | <0.006 |
| Total PAH 16 | <0.0073 | 0.0084 | 0.01 | 0.012 | 0.018 | 0.023 | 0.031 | 0.036 |
| Total carc. PAH | <0.0027 | <0.0054 | <0.0081 | <0.011 | <0.013 | <0.016 | <0.019 | <0.021 |
| Total oth. PAH | <0.005 | 0.0058 | 0.0074 | 0.0094 | 0.015 | 0.021 | 0.028 | 0.033 |
| Total PAH L | <0.0019 | <0.0038 | <0.0058 | <0.0077 | 0.0086 | 0.009 | <0.011 | <0.013 |
| Total PAH M | <0.002 | 0.0035 | 0.0051 | 0.0071 | 0.012 | 0.017 | 0.024 | 0.029 |
| Total PAH H | <0.003 | <0.006 | <0.009 | <0.01 | <0.02 | <0.02 | <0.02 | <0.02 |
| MBT | 0.000333 | 0.003 | 0.00531 | 0.00866 | 0.0126 | 0.0279 | 0.0331 | 0.0505 |
| DBT | <0.00008 | <0.0002 | <0.0002 | <0.0003 | 0.000436 | 0.000545 | 0.000677 | 0.000948 |
| TBT | 0.000108 | 0.000202 | <0.0003 | 0.000373 | 0.000476 | 0.000585 | 0.000674 | 0.000818 |
| TTBT | <0.00008 | <0.0002 | <0.0002 | <0.0003 | <0.0004 | <0.0005 | <0.0005 | <0.0006 |
| MOT | <0.00008 | <0.0002 | <0.0002 | <0.0003 | <0.0004 | <0.0005 | <0.0005 | <0.0006 |
| DOT | <0.00008 | <0.0002 | <0.0002 | <0.0003 | <0.0004 | <0.0005 | <0.0005 | <0.0006 |
| TCyT | <0.00008 | <0.0002 | <0.0002 | <0.0003 | <0.0004 | <0.0005 | <0.0005 | <0.0006 |
| MPhT | <0.00008 | <0.0002 | <0.0002 | <0.0003 | <0.0004 | <0.0005 | <0.0005 | <0.0006 |
| DPhT | <0.00008 | <0.0002 | <0.0002 | <0.0003 | <0.0004 | <0.0005 | <0.0005 | <0.0006 |
| TPhT | <0.00008 | <0.0002 | <0.0002 | <0.0003 | <0.0004 | <0.0005 | <0.0005 | <0.0006 |
| PCB 28 | <0.000084 | <0.00017 | <0.00025 | <0.00034 | <0.00042 | <0.00051 | <0.00059 | <0.00068 |
| PCB 52 | <0.000084 | <0.00017 | <0.00025 | <0.00034 | <0.00042 | <0.00051 | <0.00059 | <0.00068 |
| PCB 101 | <0.000084 | <0.00017 | <0.00025 | <0.00034 | <0.00042 | <0.00051 | <0.00059 | <0.00068 |
| PCB 118 | <0.000084 | <0.00017 | <0.00025 | <0.00034 | <0.00042 | <0.00051 | <0.00059 | <0.00068 |
| PCB 138 | <0.000092 | <0.00018 | <0.00028 | <0.00037 | <0.00046 | <0.00055 | <0.00064 | <0.00074 |
| PCB 153 | <0.000084 | <0.00017 | <0.00025 | <0.00034 | <0.00042 | <0.00051 | <0.00059 | <0.00068 |
| PCB 180 | <0.000084 | <0.00017 | <0.00025 | <0.00034 | <0.00042 | <0.00051 | <0.00059 | <0.00068 |
| Total PCB 7 | <0.0003 | <0.0006 | <0.0009 | <0.0012 | <0.0015 | <0.0018 | <0.0021 | <0.0024 |
Appendix C. Leaching of Contaminants: Sampling 2333–2340
Appendix C.1. Surface Leaching of Contaminants
| Period | 6 h | 1 Days | 2.25 Days | 4 Days | 9 Days | 16 Days | 36 Days | 64 Days |
|---|---|---|---|---|---|---|---|---|
| Sample No | 2333 | 2334 | 2335 | 2336 | 2337 | 2338 | 2339 | 2340 |
| pH | 8.75 | 8.68 | 8.57 | 8.72 | 8.8 | 8.49 | 8.15 | 7.87 |
| Conductivity | 2520 | 2510 | 2660 | 2860 | 2750 | 2760 | 2740 | 2760 |
| Redox (mV) | 46 | 84 | 74 | 57 | 45 | 42 | 74 | 75 |
| Al | 2.25 | 2.03 | 1.75 | 1.6 | 0.749 | 0.78 | 0.624 | 0.646 |
| As | 0.0637 | 0.074 | 0.084 | 0.0687 | 0.105 | 0.135 | 0.071 | 0.0895 |
| Ba | 8.11 | 9.25 | 11.3 | 10.4 | 19.4 | 20.5 | 30.3 | 26.8 |
| Ca | 16,700 | 18,100 | 22,000 | 22,000 | 30,100 | 31,500 | 50,000 | 47,000 |
| Cd | 0.0056 | 0.00637 | <0.004 | <0.004 | <0.004 | <0.004 | <0.004 | 0.00499 |
| Co | 0.0414 | 0.036 | 0.033 | 0.0226 | 0.042 | 0.028 | 0.0486 | 0.0499 |
| Cr | 0.0414 | 0.036 | 0.033 | 0.0226 | 0.042 | 0.028 | 0.0486 | 0.0499 |
| Cu | 1.46 | 1.13 | 0.803 | 0.722 | 0.739 | 0.741 | 0.941 | 0.941 |
| Fe | 0.902 | 0.84 | 0.556 | 0.593 | <0.3 | <0.3 | <0.3 | <0.3 |
| Hg | <0.002 | <0.002 | <0.002 | <0.002 | <0.002 | <0.002 | <0.002 | <0.002 |
| K | 16,000 | 15,800 | 17,500 | 16,200 | 15,900 | 15,600 | 16,400 | 20,000 |
| Mg | 38,800 | 37,900 | 41,800 | 38,400 | 29,500 | 29,900 | 20,000 | 20,500 |
| Mn | 1.28 | 1.1 | 0.612 | 0.772 | 0.135 | 0.0856 | 0.0263 | 0.0247 |
| Mo | 0.811 | 0.772 | 0.895 | 0.772 | 1.04 | 0.948 | 1.19 | 1.29 |
| Na | 375,000 | 370,000 | 415,000 | 389,000 | 370,000 | 366,000 | 360,000 | 364,000 |
| Ni | 0.372 | 0.362 | 0.292 | 0.268 | 0.4 | 0.259 | 0.338 | 0.129 |
| Pb | <0.02 | <0.02 | <0.02 | <0.02 | <0.02 | <0.02 | <0.02 | <0.02 |
| V | 0.172 | 0.284 | 0.353 | 0.364 | 0.45 | 0.295 | 0.154 | 0.122 |
| Zn | 0.294 | 0.183 | 0.216 | 0.2 | <0.2 | <0.2 | <0.2 | <0.2 |
| B | 139 | 139 | 151 | 141 | 116 | 110 | 88.7 | 91.8 |
| Sb | 0.0561 | 0.0664 | 0.0699 | 0.0724 | 0.108 | 0.0971 | 0.135 | 0.135 |
| Se | <0.2 | <0.2 | <0.2 | <0.2 | 0.55 | 4.47 | <0.2 | <0.2 |
| Naphthalene | <0.002 | <0.002 | <0.002 | <0.002 | 0.004 | <0.002 | <0.002 | <0.002 |
| Acy | <0.0008 | <0.0008 | <0.0008 | <0.0008 | <0.0008 | <0.0008 | <0.0008 | <0.0008 |
| Acenaphthene | <0.0008 | <0.0008 | <0.0008 | <0.0008 | 0.0017 | <0.0008 | <0.0008 | <0.0008 |
| Fluorine | <0.0008 | <0.0008 | <0.0008 | <0.0008 | 0.00099 | <0.0008 | <0.0008 | <0.0008 |
| Phenanthrene | <0.002 | <0.002 | <0.002 | <0.002 | 0.0041 | <0.002 | <0.002 | <0.002 |
| Anthracene | <0.0008 | <0.0008 | <0.0008 | <0.0008 | <0.0008 | <0.0008 | <0.0008 | <0.0008 |
| Fluoranthene | 0.00099 | 0.002 | 0.0022 | 0.0028 | 0.0043 | 0.0036 | <0.0008 | <0.0008 |
| Pyrene | 0.0011 | 0.0022 | 0.0029 | 0.0034 | 0.0057 | 0.0057 | 0.0037 | 0.0013 |
| B[a]A | <0.0008 | <0.0008 | <0.0008 | <0.0008 | <0.0008 | <0.0008 | <0.0008 | <0.0008 |
| Chrysene | <0.0008 | <0.0008 | <0.0008 | <0.0008 | <0.0008 | <0.0008 | <0.0008 | <0.0008 |
| BjF | <0.0008 | <0.0008 | <0.0008 | <0.0008 | <0.0008 | <0.0008 | <0.0008 | <0.0008 |
| BkF | <0.0008 | <0.0008 | <0.0008 | <0.0008 | <0.0008 | <0.0008 | <0.0008 | <0.0008 |
| BaP | <0.0008 | <0.0008 | <0.0008 | <0.0008 | <0.0008 | <0.0008 | <0.0008 | <0.0008 |
| DBahA | <0.0008 | <0.0008 | <0.0008 | <0.0008 | <0.0008 | <0.0008 | <0.0008 | <0.0008 |
| BghiP | <0.0008 | <0.0008 | <0.0008 | <0.0008 | <0.0008 | <0.0008 | <0.0008 | <0.0008 |
| IP | <0.0008 | <0.0008 | <0.0008 | <0.0008 | <0.0008 | <0.0008 | <0.0008 | <0.0008 |
| Total PAH 16 | 0.0021 | 0.0042 | 0.0051 | 0.0062 | 0.021 | 0.00933 | 0.0037 | 0.0013 |
| Total carc. PAH | <0.0027 | <0.0027 | <0.0027 | <0.0027 | <0.0027 | <0.0027 | <0.0027 | <0.0027 |
| Total oth. PAH | 0.0021 | 0.0042 | 0.0051 | 0.0062 | 0.021 | 0.00933 | 0.0037 | 0.0013 |
| Total PAH L | <0.0019 | <0.0019 | <0.0019 | <0.0019 | 0.0057 | <0.0019 | <0.0019 | <0.0019 |
| Total PAH M | 0.0021 | 0.0042 | 0.0051 | 0.0062 | 0.015 | 0.00933 | 0.0037 | 0.0013 |
| Total PAH H | <0.003 | <0.003 | <0.003 | <0.003 | <0.003 | <0.003 | <0.003 | <0.003 |
| MBT | 0.00142 | 0.00255 | 0.00189 | 0.00262 | 0.00453 | 0.00902 | 0.00554 | 0.00661 |
| DBT | 0.000091 | 0.00011 | 0.0000849 | 0.00011 | 0.000211 | 0.000248 | 0.000236 | 0.000593 |
| TBT | 0.000142 | 0.000118 | 0.000109 | 0.000151 | 0.000157 | 0.000121 | 0.000125 | 0.000113 |
| TTBT | <0.00008 | <0.00008 | <0.00008 | <0.00008 | <0.00008 | <0.00008 | <0.00008 | <0.00008 |
| MOT | <0.00008 | <0.00008 | <0.00008 | <0.00008 | <0.00008 | <0.00008 | <0.00008 | <0.00008 |
| DOT | <0.00008 | <0.00008 | <0.00008 | <0.00008 | <0.00008 | <0.00008 | <0.00008 | <0.00008 |
| TCyT | <0.00008 | <0.00008 | <0.00008 | <0.00008 | <0.00008 | <0.00008 | <0.00008 | <0.00008 |
| MPhT | <0.00008 | <0.00008 | <0.00008 | <0.00008 | <0.00008 | <0.00008 | <0.00008 | <0.00008 |
| DPhT | <0.00008 | <0.00008 | <0.00008 | <0.00008 | <0.00008 | <0.00008 | <0.00008 | <0.00008 |
| TPhT | <0.00008 | <0.00008 | <0.00008 | <0.00008 | <0.00008 | <0.00008 | <0.00008 | <0.00008 |
| PCB 28 | <0.000084 | <0.000084 | <0.000084 | <0.000084 | <0.000084 | <0.000084 | <0.000084 | <0.000084 |
| PCB 52 | <0.000084 | <0.000084 | <0.000084 | <0.000084 | <0.000084 | <0.000084 | <0.000084 | <0.000084 |
| PCB 101 | <0.000084 | <0.000084 | <0.000084 | <0.000084 | <0.000084 | <0.000084 | <0.000084 | <0.000084 |
| PCB 118 | <0.000084 | <0.000084 | <0.000084 | <0.000084 | <0.000084 | <0.000084 | <0.000084 | <0.000084 |
| PCB 138 | <0.000092 | <0.000092 | <0.000092 | <0.000092 | <0.000092 | <0.000092 | <0.000092 | <0.000092 |
| PCB 153 | <0.000084 | <0.000084 | <0.000084 | <0.000084 | <0.000084 | <0.000084 | <0.000084 | <0.000084 |
| PCB 180 | <0.000084 | <0.000084 | <0.000084 | <0.000084 | <0.000084 | <0.000084 | <0.000084 | <0.000084 |
| Total PCB 7 | <0.0003 | <0.0003 | <0.0003 | <0.0003 | <0.0003 | <0.0003 | <0.0003 | <0.0003 |
Appendix C.2. Cumulative Surface Leaching of Contaminants
| Period | 6 h | 1 Days | 2.25 Days | 4 Days | 9 Days | 16 Days | 36 Days | 64 Days |
|---|---|---|---|---|---|---|---|---|
| Sample No | 2333 | 2334 | 2335 | 2336 | 2337 | 2338 | 2339 | 2340 |
| Al | 2.25 | 4.28 | 6.03 | 7.63 | 8.38 | 9.16 | 9.78 | 10.4 |
| As | 0.0637 | 0.138 | 0.22 | 0.29 | 0.395 | 0.53 | 0.6 | 0.69 |
| Ba | 8.11 | 17.4 | 28.7 | 39.1 | 58.5 | 79 | 109 | 136 |
| Ca | 16,700 | 34,800 | 57,000 | 79,000 | 109,000 | 141,000 | 200,000 | 230,000 |
| Cd | 0.0056 | 0.012 | <0.02 | <0.02 | <0.02 | <0.03 | <0.03 | 0.0361 |
| Co | 0.0414 | 0.0775 | 0.11 | 0.133 | 0.18 | 0.2 | 0.251 | 0.301 |
| Cr | <0.04 | <0.08 | <0.1 | <0.2 | <0.2 | <0.2 | <0.3 | <0.3 |
| Cu | 1.46 | 2.59 | 3.4 | 4.12 | 4.86 | 5.6 | 6.54 | 7.48 |
| Fe | 0.902 | 1.7 | 2.3 | 2.89 | <3 | <4 | <4 | <4 |
| Hg | <0.002 | <0.003 | <0.005 | <0.006 | <0.008 | <0.009 | <0.01 | <0.01 |
| K | 16,000 | 31,800 | 49,300 | 65,500 | 81,400 | 97,000 | 113,000 | 100,000 |
| Mg | 38,800 | 76,800 | 119,000 | 157,000 | 186,000 | 216,000 | 236,000 | 257,000 |
| Mn | 1.28 | 2.39 | 3 | 3.77 | 3.91 | 3.99 | 4.02 | 4.04 |
| Mo | 0.811 | 1.58 | 2.48 | 3.25 | 4.29 | 5.24 | 6.43 | 7.72 |
| Na | 375,000 | 750,000 | 1,170,000 | 1,550,000 | 1,900,000 | 2,290,000 | 2,600,000 | 3,010,000 |
| Ni | 0.372 | 0.733 | 1.03 | 1.29 | 1.7 | 1.95 | 2.29 | 2.42 |
| Pb | <0.02 | <0.03 | <0.05 | <0.06 | <0.08 | <0.09 | <0.1 | <0.1 |
| V | 0.172 | 0.456 | 0.81 | 1.17 | 1.6 | 1.92 | 2.07 | 2.2 |
| Zn | 0.294 | 0.477 | 0.693 | 0.893 | <1 | <1 | <1 | <2 |
| B | 139 | 278 | 430 | 570 | 686 | 796 | 885 | 976 |
| Sb | 0.0561 | 0.123 | 0.192 | 0.265 | 0.373 | 0.47 | 0.604 | 0.74 |
| Se | <0.2 | <0.5 | <0.7 | <0.9 | 1.5 | 5.94 | <6 | <6 |
| Naphthalene | <0.002 | <0.005 | <0.007 | <0.009 | 0.013 | <0.02 | <0.02 | <0.02 |
| Acy | <0.0008 | <0.002 | <0.002 | <0.003 | <0.004 | <0.005 | <0.005 | <0.006 |
| Acenaphthene | <0.0008 | <0.002 | <0.002 | <0.003 | 0.0047 | <0.006 | <0.006 | <0.007 |
| Fluorine | <0.0008 | <0.002 | <0.002 | <0.003 | <0.0041 | <0.005 | <0.006 | <0.006 |
| Phenanthrene | <0.002 | <0.003 | <0.005 | <0.006 | 0.01 | <0.01 | <0.01 | <0.01 |
| Anthracene | <0.0008 | <0.002 | <0.002 | <0.003 | <0.004 | <0.005 | <0.005 | <0.006 |
| Fluoranthene | 0.00099 | 0.003 | 0.0052 | 0.008 | 0.012 | 0.016 | <0.02 | <0.02 |
| Pyrene | 0.0011 | 0.0033 | 0.0062 | 0.0096 | 0.015 | 0.021 | 0.025 | 0.026 |
| B[a]A | <0.0008 | <0.002 | <0.002 | <0.003 | <0.004 | <0.005 | <0.005 | <0.006 |
| Chrysene | <0.0008 | <0.002 | <0.002 | <0.003 | <0.004 | <0.005 | <0.005 | <0.006 |
| BjF | <0.0008 | <0.002 | <0.002 | <0.003 | <0.004 | <0.005 | <0.005 | <0.006 |
| BkF | <0.0008 | <0.002 | <0.002 | <0.003 | <0.004 | <0.005 | <0.005 | <0.006 |
| BaP | <0.0008 | <0.002 | <0.002 | <0.003 | <0.004 | <0.005 | <0.005 | <0.006 |
| DBahA | <0.0008 | <0.002 | <0.002 | <0.003 | <0.004 | <0.005 | <0.005 | <0.006 |
| BghiP | <0.0008 | <0.002 | <0.002 | <0.003 | <0.004 | <0.005 | <0.005 | <0.006 |
| IP | <0.0008 | <0.002 | <0.002 | <0.003 | <0.004 | <0.005 | <0.005 | <0.006 |
| Total PAH 16 | 0.0021 | 0.0063 | 0.011 | 0.018 | 0.038 | 0.0476 | 0.051 | 0.053 |
| Total carc. PAH | <0.0027 | <0.0054 | <0.008 | <0.011 | <0.013 | <0.016 | <0.019 | <0.021 |
| Total oth. PAH | 0.0021 | 0.0063 | 0.011 | 0.018 | 0.038 | 0.0476 | 0.051 | 0.053 |
| Total PAH L | <0.0019 | <0.0038 | <0.0057 | <0.0076 | 0.013 | <0.015 | <0.017 | <0.019 |
| Total PAH M | 0.0021 | 0.0063 | 0.011 | 0.018 | 0.0326 | 0.0419 | 0.046 | 0.047 |
| Total PAH H | <0.003 | <0.006 | <0.009 | <0.01 | <0.02 | <0.02 | <0.02 | <0.02 |
| MBT | 0.00142 | 0.00398 | 0.00586 | 0.00849 | 0.013 | 0.022 | 0.0276 | 0.0342 |
| DBT | 0.000091 | 0.0002 | 0.000283 | 0.00039 | 0.000601 | 0.000849 | 0.00108 | 0.00168 |
| TBT | 0.000142 | 0.00026 | 0.000369 | 0.000519 | 0.000676 | 0.000797 | 0.000922 | 0.00104 |
| TTBT | <0.00008 | <0.0002 | <0.0002 | <0.0003 | <0.0004 | <0.0005 | <0.0005 | <0.0006 |
| MOT | <0.00008 | <0.0002 | <0.0002 | <0.0003 | <0.0004 | <0.0005 | <0.0005 | <0.0006 |
| DOT | <0.00008 | <0.0002 | <0.0002 | <0.0003 | <0.0004 | <0.0005 | <0.0005 | <0.0006 |
| TCyT | <0.00008 | <0.0002 | <0.0002 | <0.0003 | <0.0004 | <0.0005 | <0.0005 | <0.0006 |
| MPhT | <0.00008 | <0.0002 | <0.0002 | <0.0003 | <0.0004 | <0.0005 | <0.0005 | <0.0006 |
| DPhT | <0.00008 | <0.0002 | <0.0002 | <0.0003 | <0.0004 | <0.0005 | <0.0005 | <0.0006 |
| TPhT | <0.00008 | <0.0002 | <0.0002 | <0.0003 | <0.0004 | <0.0005 | <0.0005 | <0.0006 |
| PCB 28 | <0.000084 | <0.00017 | <0.00025 | <0.00034 | <0.00042 | <0.0005 | <0.00059 | <0.00067 |
| PCB 52 | <0.000084 | <0.00017 | <0.00025 | <0.00034 | <0.00042 | <0.0005 | <0.00059 | <0.00067 |
| PCB 101 | <0.000084 | <0.00017 | <0.00025 | <0.00034 | <0.00042 | <0.0005 | <0.00059 | <0.00067 |
| PCB 118 | <0.000084 | <0.00017 | <0.00025 | <0.00034 | <0.00042 | <0.0005 | <0.00059 | <0.00067 |
| PCB 138 | <0.000092 | <0.00018 | <0.00028 | <0.00037 | <0.00046 | <0.00055 | <0.00064 | <0.00073 |
| PCB 153 | <0.000084 | <0.00017 | <0.00025 | <0.00034 | <0.00042 | <0.0005 | <0.00059 | <0.00067 |
| PCB 180 | <0.000084 | <0.00017 | <0.00025 | <0.00034 | <0.00042 | <0.0005 | <0.00059 | <0.00067 |
| Total PCB 7 | <0.0003 | <0.0006 | <0.00089 | <0.0012 | <0.0015 | <0.0018 | <0.0021 | <0.0024 |
References
- Chesworth, W. (Ed.) Soil stabilization. In Encyclopedia of Soil Science; Springer: Dordrecht, The Netherlands, 2008; p. 705. [Google Scholar] [CrossRef]
- Arias-Jaramillo, Y.P.; Gómez-Cano, D.; Carvajal, G.I.; Hidalgo, C.A.; Muñoz, F. Evaluation of the Effect of Binary Fly Ash-Lime Mixture on the Bearing Capacity of Natural Soils: A Comparison with Two Conventional Stabilizers Lime and Portland Cement. Materials 2023, 16, 3996. [Google Scholar] [CrossRef]
- Yi, Y.; Liska, M.; Al-Tabbaa, A. Properties of Two Model Soils Stabilized with Different Blends and Contents of GGBS, MgO, Lime, and PC. J. Mater. Civ. Eng. 2014, 26, 267–274. [Google Scholar] [CrossRef]
- Correia, A.A.S.; Figueiredo, D.; Rasteiro, M.G. An Experimental Design Methodology to Evaluate the Key Parameters on Dispersion of Carbon Nanotubes Applied in Soil Stabilization. Appl. Sci. 2023, 13, 4880. [Google Scholar] [CrossRef]
- Benschoten, J.E.V.; Matsumoto, M.R.; Young, W.H. Evaluation and Analysis of Soil Washing for Seven Lead-Contaminated Soils. J. Environ. Eng. 1997, 123, 217–224. [Google Scholar] [CrossRef]
- Chu, W. Remediation of Contaminated Soils by Surfactant-Aided Soil Washing. In Practice Periodical of Hazardous, Toxic, and Radioactive Waste Management; ASCE: Reston, VA, USA, 2003; Volume 7, pp. 19–24. [Google Scholar] [CrossRef]
- Bhandari, A.; Dove, D.C.; Novak, J.T. Soil Washing and Biotreatment of Petroleum-Contaminated Soils. J. Environ. Eng. 1994, 120, 1151–1169. [Google Scholar] [CrossRef]
- Rangeard, D.; Hicher, Y.P.; Zentar, R. Determining soil permeability from pressuremeter tests. Int. J. Numer. Anal. Methods Geomech. 2003, 27, 1–24. [Google Scholar] [CrossRef]
- Lindh, P.; Lemenkova, P. Permeability, compressive strength and Proctor parameters of silts stabilised by Portland cement and ground granulated blast furnace slag (GGBFS). Arch. Mech. Eng. 2022, 69, 667–692. [Google Scholar] [CrossRef]
- Schultz, C. Model estimates soil permeability using induced polarization. Eos Trans. Am. Geophys. Union 2012, 93, 150–151. [Google Scholar] [CrossRef]
- Mohammed, H.; Kennedy, J.B.; Smith, P. Improving the Response of Soil-Metal Structures during Construction. J. Bridge Eng. 2002, 7, 6–13. [Google Scholar] [CrossRef]
- Zayyat, M.M.; Jackson, A.W.; Tanaka, T.; Hino, T.; Matsuba, Y. Foundation Soil Improvement Using Vibro Compaction Combined with Geo Grids. In Innovations in Grouting and Soil Improvement; ASCE: Reston, VA, USA, 2005; pp. 1–10. [Google Scholar] [CrossRef]
- Sheob, M.; Sajid, M.; Asim Ansari, M.; Rais, I.; Sadique, M.; Ahmad, S. Using a blend of cement and waste glass powder to improve the properties of clayey soil. Mater. Today Proc. 2023. [Google Scholar] [CrossRef]
- Tiwari, B.; Ajmera, B.; Moubayed, S.; Lemmon, A.; Styler, K.; Martinez, J.G. Improving Geotechnical Behavior of Clayey Soils with Shredded Rubber Tires—Preliminary Study. In Geo-Congress 2014 Technical Papers; ASCE: Reston, VA, USA, 2014; pp. 3734–3743. [Google Scholar] [CrossRef]
- Dharini, V.; Balamaheswari, M.; Nevis Presentia, A. Enhancing the strength of expansive clayey soil using lime as soil stabilizing agent along with sodium silicate as grouting chemical. Mater. Today Proc. 2023. [Google Scholar] [CrossRef]
- El Hariri, A.; Elawad Eltayeb Ahmed, A.; Kiss, P. Review on soil shear strength with loam sand soil results using direct shear test. J. Terramechanics 2023, 107, 47–59. [Google Scholar] [CrossRef]
- Eissa, A.; Bassuoni, M.T.; Ghazy, A.; Alfaro, M. Improving the Properties of Soft Clay Using Cement, Slag, and Nanosilica: Experimental and Statistical Modeling. J. Mater. Civ. Eng. 2022, 34, 4022031. [Google Scholar] [CrossRef]
- Zhang, C.; Zhu, Z.; Liu, F.; Yang, Y.; Wan, Y.; Huo, W.; Yang, L. Efficient machine learning method for evaluating compressive strength of cement stabilized soft soil. Constr. Build. Mater. 2023, 392, 131887. [Google Scholar] [CrossRef]
- Hogentogler, C.A.; Willis, E.A. Essential Consideration in the Stabilization of Soil. Trans. Am. Soc. Civ. Eng. 1938, 103, 1163–1183. [Google Scholar] [CrossRef]
- Fristad, W.E. Case study: Using soil washing/leaching for the removal of heavy metal at the twin cities army ammunition plant. Remediat. J. 1995, 5, 61–72. [Google Scholar] [CrossRef]
- Finney, D.S.; Himmer, T.; Morris, J.J.; Coladonato, S. Demonstrating Leaching Reductions of NAPL-Impacted Soils Treated with Stabilization/Solidification Using Modified EPA Method 1315. J. Hazard. Toxic Radioact. Waste 2015, 19, C4014002. [Google Scholar] [CrossRef]
- Hanson, A.T.; Dwyer, B.; Samani, Z.A.; York, D. Remediation of Chromium-Containing Soils by Heap Leaching: Column Study. J. Environ. Eng. 1993, 119, 825–841. [Google Scholar] [CrossRef]
- He, L.; Zhou, X.; Cao, J.; Shen, L. Ultrasound-Assisted Soil Washing for Metals-Contaminated Soil Using Various Washing Solutions. Clean—Soil Air Water 2022, 50, 2100419. [Google Scholar] [CrossRef]
- Mizutani, S.; Ikegami, M.; Sakanakura, H.; Kanjo, Y. Test Methods for the Evaluation of Heavy Metals in Contaminated Soil. In Environmental Remediation Technologies for Metal-Contaminated Soils; Springer: Tokyo, Japan, 2016; pp. 67–97. [Google Scholar] [CrossRef]
- Hoang, T.; Alleman, J.; Cetin, B.; Choi, S.G. Engineering Properties of Biocementation Coarse- and Fine-Grained Sand Catalyzed By Bacterial Cells and Bacterial Enzyme. J. Mater. Civ. Eng. 2020, 32, 04020030. [Google Scholar] [CrossRef]
- Schaefers, K.; Nam, S. Improving the Shear Strength of Soils by Adding Agricultural By-Products. In IFCEE 2015; ASCE: Reston, VA, USA, 2015; pp. 2777–2786. [Google Scholar] [CrossRef]
- Krisdani, H.; Rahardjo, H.; Leong, E.C. Behaviour of Capillary Barrier System Constructed using Residual Soil. In Waste Containment and Remediation; ASCE: Reston, VA, USA, 2005; pp. 1–15. [Google Scholar] [CrossRef]
- Bache, B.K.F.; Wiersholm, P.; Paniagua, P.; Emdal, A. Effect of Temperature on the Strength of Lime-Cement Stabilized Norwegian Clays. J. Geotech. Geoenvironmental Eng. 2022, 148, 04021198. [Google Scholar] [CrossRef]
- Andersen, K.H.; Rosenbrand, W.F.; Brown, S.F.; Pool, J.H. Cyclic and Static Laboratory Tests on Drammen Clay. J. Geotech. Eng. Div. 1980, 106, 499–529. [Google Scholar] [CrossRef]
- Zhang, Y.; Andersen, K.H.; Jeanjean, P.; Karlsrud, K.; Haugen, T. Validation of Monotonic and Cyclic p-y Framework by Lateral Pile Load Tests in Stiff, Overconsolidated Clay at the Haga Site. J. Geotech. Geoenvironmental Eng. 2020, 146, 04020080. [Google Scholar] [CrossRef]
- Binner, R.; Homberg, U.; Prohaska, S.; Kalbe, U.; Witt, K.J. Identification of Descriptive Parameters of the Soil Pore Structure Using Experiments and CT Data. In Scour and Erosion, Proceedings of the Chapter International Conference on Scour and Erosion (ICSE-5), San Francisco, CA, USA, 7–10 November 2010; ASCE: Reston, VA, USA, 2010; pp. 397–407. [Google Scholar] [CrossRef]
- Kulkarni, K.; Basavaraj, P.; Babu, S. Effect of Grain Size Distribution of Soil on Immobilization of Cadmium and Nickel in Contaminated Soil Using Nano Zerovalent Iron: A Factorial Design and Response Surface Methodology Approach. J. Hazard. Toxic Radioact. Waste 2023, 27, 04023008. [Google Scholar] [CrossRef]
- Ibrahim, R.; Nissen, M. Emerging Technology to Model Dynamic Knowledge Creation and Flow among Construction Industry Stakeholders during the Critical Feasibility-Entitlements Phase. In Towards a Vision for Information Technology in Civil Engineering; ASCE: Reston, VA, USA, 2012; pp. 1–14. [Google Scholar] [CrossRef]
- Ninić, J.; Bui, H.G.; Koch, C.; Meschke, G. Computationally Efficient Simulation in Urban Mechanized Tunneling Based on Multilevel BIM Models. J. Comput. Civ. Eng. 2019, 33, 04019007. [Google Scholar] [CrossRef]
- Lindh, P.; Lemenkova, P. Simplex Lattice Design and X-ray Diffraction for Analysis of Soil Structure: A Case of Cement-Stabilised Compacted Tills Reinforced with Steel Slag and Slaked Lime. Electronics 2022, 11, 3726. [Google Scholar] [CrossRef]
- Zhang, L.; Wu, X.; Liu, W.; Skibniewski, M.J. Optimal Strategy to Mitigate Tunnel-Induced Settlement in Soft Soils: Simulation Approach. J. Perform. Constr. Facil. 2019, 33, 4019058. [Google Scholar] [CrossRef]
- Lindh, P.; Lemenkova, P. Utilising Pareto efficiency and RSM to adjust binder content in clay stabilisation for Yttre Ringvägen, Malmö. Acta Polytech. 2023, 63, 140–157. [Google Scholar] [CrossRef]
- Wei, W. Optimization of the Mixing in a Produced Water Storage Tank with CFD. In World Environmental and Water Resources Congress 2023; ASCE: Reston, VA, USA, 2023; pp. 1175–1184. [Google Scholar] [CrossRef]
- Mohammed, S.A.S.; Sanaulla, P.F.; Alnuaim, A.M.; Moghal, A.A.B. Role of Different Leaching Methods to Arrest the Transport of Ni2+ in Soil and Soil Amended with Nano Calcium Silicate. In Proceedings of the Geo-China 2016, Shandong, China, 25–27 July 2016; ASCE: Reston, VA, USA, 2016; pp. 49–56. [Google Scholar] [CrossRef]
- Simon, F.G.; Kalbe, U.; Berger, W. Waste Characterization by Leaching and Extraction Procedures. In Proceedings of the GeoCongress 2008, New Orleans, LA, USA, 9–12 March 2008; ASCE: Reston, VA, USA, 2008; pp. 676–683. [Google Scholar] [CrossRef]
- Naghipour, D.; Jaafari, J.; Ashrafi, S.D.; Mahvi, A.H. Remediation of Heavy Metals Contaminated Silty Clay Loam Soil by Column Extraction with Ethylenediaminetetraacetic Acid and Nitrilo Triacetic Acid. J. Environ. Eng. 2017, 143, 04017026. [Google Scholar] [CrossRef]
- Wang, F.; Al-Tabbaa, A. Leachability of 17-Year-Old Stabilized/Solidified Contaminated Site Soils. In Geo-Congress 2014 Technical Papers; ASCE: Reston, VA, USA, 2014; pp. 1612–1624. [Google Scholar] [CrossRef]
- Li, L.Y.; Li, F. Heavy Metal Sorption and Hydraulic Conductivity Studies Using Three Types of Bentonite Admixes. J. Environ. Eng. 2001, 127, 420–429. [Google Scholar] [CrossRef]
- Xia, W.Y.; Feng, Y.S.; Du, Y.J.; Reddy, K.R.; Wei, M.L. Solidification and Stabilization of Heavy Metal–Contaminated Industrial Site Soil Using KMP Binder. J. Mater. Civ. Eng. 2018, 30, 4018080. [Google Scholar] [CrossRef]
- Liang, Y. Biodegradation of Pyrene in Soil Microcosms: Identification of a Toxic Intermediate. In Impacts of Global Climate Change; ASCE: Reston, VA, USA, 2005; pp. 1–9. [Google Scholar] [CrossRef]
- Aydilek, A.H.; Edil, T.B. Solidification/Stabilization of PCB-Contaminated Wastewater Treatment Sludges. In Proceedings of the GeoCongress 2008, New Orleans, LA, USA, 9–12 March 2008; ASCE: Reston, VA, USA, 2008; pp. 724–731. [Google Scholar] [CrossRef]
- Kucharski, D.; Giebułtowicz, J.; Drobniewska, A.; Nałęcz-Jawecki, G.; Skowronek, A.; Strzelecka, A.; Mianowicz, K.; Drzewicz, P. The study on contamination of bottom sediments from the Odra River estuary (SW Baltic Sea) by tributyltin using environmetric methods. Chemosphere 2022, 308, 136133. [Google Scholar] [CrossRef] [PubMed]
- Lindh, P.; Lemenkova, P. Soil contamination from heavy metals and persistent organic pollutants (PAH, PCB and HCB) in the coastal area of Västernorrland, Sweden. Gospod. Surowcami Miner.—Miner. Resour. Manag. 2022, 38, 147–168. [Google Scholar] [CrossRef]
- Marcic, C.; Le Hecho, I.; Denaix, L.; Lespes, G. TBT and TPhT persistence in a sludged soil. Chemosphere 2006, 65, 2322–2332. [Google Scholar] [CrossRef]
- Lindh, P.; Lemenkova, P. Evaluation of Different Binder Combinations of Cement, Slag and CKD for S/S Treatment of TBT Contaminated Sediments. Acta Mech. Autom. 2021, 15, 236–248. [Google Scholar] [CrossRef]
- Chandler, A.J.; Eighmy, T.T.; Hartlén, J.; Hjelmar, O.; Kosson, D.S.; Sawell, S.E.; van der Sloot, H.A.; Vehlow, J. Chapter 14—Leaching tests. In Municipal Solid Waste Incinerator Residues; Studies in Environmental Science; Elsevier: Amsterdam, The Netherlands, 1997; Volume 67, pp. 579–606. [Google Scholar] [CrossRef]
- Lindh, P.; Lemenkova, P. Geochemical tests to study the effects of cement ratio on potassium and TBT leaching and the pH of the marine sediments from the Kattegat Strait, Port of Gothenburg, Sweden. Baltica 2022, 35, 47–59. [Google Scholar] [CrossRef]
- Chittoori, B.C.S.; Puppala, A.J.; Wejrungsikul, T.; Hoyos, L.R. Experimental Studies on Stabilized Clays at Various Leaching Cycles. J. Geotech. Geoenvironmental Eng. 2013, 139, 1665–1675. [Google Scholar] [CrossRef]
- Beauchesne, I.; Blais, J.F.; Mercier, G.; Ouarda, T.B. Multicriteria Optimization of a Chemical Leaching Process for Sewage Sludge Decontamination. In Practice Periodical of Hazardous, Toxic, and Radioactive Waste Management; ASCE: Reston, VA, USA, 2008; Volume 12, pp. 150–158. [Google Scholar] [CrossRef]
- Lindh, P.; Lemenkova, P. Leaching of Heavy Metals from Contaminated Soil Stabilised by Portland Cement and Slag Bremen. Ecol. Chem. Eng. S 2022, 29, 537–552. [Google Scholar] [CrossRef]
- Schreck, S.; Mahedi, M.; Cetin, B. Leaching Behavior of Metals and Sulfate from Taconite Tailings Used in Pavement Construction. In Proceedings of the Geo-Congress 2020, Minneapolis, MN, USA, 25–28 February 2020; ASCE: Reston, VA, USA, 2020; pp. 159–168. [Google Scholar] [CrossRef]
- Becker, J.; Aydilek, A.H.; Davis, A.P.; Seagren, E.A. Evaluation of Leaching Protocols for Testing of High-Carbon Coal Fly Ash-Soil Mixtures. J. Environ. Eng. 2013, 139, 642–653. [Google Scholar] [CrossRef]
- Fuessle, R.W.; Taylor, M.A. Long-Term Solidification/Stabilization and Toxicity Characteristic Leaching Procedure for an Electric Arc Furnace Dust. J. Environ. Eng. 2004, 130, 492–498. [Google Scholar] [CrossRef]
- Dayioglu, A.Y.; Aydilek, A.H.; Cimen, O.; Cimen, M. Trace Metal Leaching from Steel Slag Used in Structural Fills. J. Geotech. Geoenvironmental Eng. 2018, 144, 04018089. [Google Scholar] [CrossRef]
- Sauer, J.J.; Benson, C.H.; Aydilek, A.H.; Edil, T.B. Trace Elements Leaching from Organic Soils Stabilized with High Carbon Fly Ash. J. Geotech. Geoenvironmental Eng. 2012, 138, 968–980. [Google Scholar] [CrossRef]
- Yu, X.; Dan, H.C.; Xin, P. Method for Improving Leaching Efficiency of Coastal Subsurface Drainage Systems. J. Irrig. Drain. Eng. 2018, 144, 04018019. [Google Scholar] [CrossRef]
- Alpaslan, B.; Yukselen, M.A. Remediation of Lead Contaminated Soils by Stabilization/Solidification. Water Air Soil Pollut. 2002, 133, 253–263. [Google Scholar] [CrossRef]
- Liu, J.; Wu, D.; Tan, X.; Yu, P.; Xu, L. Review of the Interactions between Conventional Cementitious Materials and Heavy Metal Ions in Stabilization/Solidification Processing. Materials 2023, 16, 3444. [Google Scholar] [CrossRef]
- Huang, H.; Shi, L.; Chen, R.; Yuan, J. Effect of Modified Illite on Cd Immobilization and Fertility Enhancement of Acidic Soils. Sustainability 2023, 15, 4950. [Google Scholar] [CrossRef]
- Paniagua, P.; Ritter, S.; Moseid, M.; Okkenhaug, G. Bioashes and Steel Slag as Alternative Binders in Ground Improvement of Quick Clays. In Geo-Congress 2023: Soil Improvement, Geoenvironmental, and Sustainability; ASCE: Reston, VA, USA, 2023; pp. 25–34. [Google Scholar] [CrossRef]
- Tonini de Araújo, M.; Tonatto Ferrazzo, S.; Mansur Chaves, H.; Gravina da Rocha, C.; Cesar Consoli, N. Mechanical behavior, mineralogy, and microstructure of alkali-activated wastes-based binder for a clayey soil stabilization. Constr. Build. Mater. 2023, 362, 129757. [Google Scholar] [CrossRef]
- Filho, H.C.S.; Saldanha, R.B.; da Rocha, C.G.; Consoli, N.C. Sustainable Binders Stabilizing Dispersive Clay. J. Mater. Civ. Eng. 2021, 33, 06020026. [Google Scholar] [CrossRef]
- Kukko, H. Stabilization of Clay with Inorganic By-Products. J. Mater. Civ. Eng. 2000, 12, 307–309. [Google Scholar] [CrossRef]
- Lam, K.P.; lei Kou, H.; Xie, B.; Chu, J.; He, J. Use of a Waste-Based Binder for High Water Content Soil Treatment. J. Mater. Civ. Eng. 2018, 30, 06018009. [Google Scholar] [CrossRef]
- Ghavami, S.; Jahanbakhsh, H.; Saeedi Azizkandi, A.; Nejad, F.M. Influence of sodium chloride on cement kiln dust-treated clayey soil: Strength properties, cost analysis, and environmental impact. Environ. Dev. Sustain. 2021, 23, 683–702. [Google Scholar] [CrossRef]
- Mishra, S.; Sachdeva, S.N.; Manocha, R. Subgrade Soil Stabilization Using Stone Dust and Coarse Aggregate: A Cost Effective Approach. Int. J. Geosynth. Ground Eng. 2019, 5, 20. [Google Scholar] [CrossRef]
- Lu, S.F.; Wu, Y.L.; Chen, Z.; Li, T.; Shen, C.; Xuan, L.K.; Xu, L. Remediation of contaminated soil and groundwater using chemical reduction and solidification/stabilization method: A case study. Environ. Sci. Pollut. Res. 2021, 28, 12766–12779. [Google Scholar] [CrossRef]
- Agarwal, S.; Al-Abed, S.R.; Dionysiou, D.D. In Situ Technologies for Reclamation of PCB-Contaminated Sediments: Current Challenges and Research Thrust Areas. J. Environ. Eng. 2007, 133, 1075–1078. [Google Scholar] [CrossRef]
- Du, J.; Chadalavada, S.; Chen, Z.; Naidu, R. Environmental remediation techniques of tributyltin contamination in soil and water: A review. Chem. Eng. J. 2014, 235, 141–150. [Google Scholar] [CrossRef]
- Sarker, A.; Masud, M.A.A.; Deepo, D.M.; Das, K.; Nandi, R.; Ansary, M.W.R.; Islam, A.R.M.T.; Islam, T. Biological and green remediation of heavy metal contaminated water and soils: A state-of-the-art review. Chemosphere 2023, 332, 138861. [Google Scholar] [CrossRef]
- Lu, L.; Xie, Y.; Yang, Z.; Chen, B. Sustainable decontamination of heavy metal in wastewater and soil with novel rectangular wave asymmetrical alternative current electrochemistry. J. Hazard. Mater. 2023, 442, 130021. [Google Scholar] [CrossRef]
- Chen, A.; Lin, C.; Lu, W.; Ma, Y.; Bai, Y.; Chen, H.; Li, J. Chemical dynamics of acidity and heavy metals in a mine water-polluted soil during decontamination using clean water. J. Hazard. Mater. 2010, 175, 638–645. [Google Scholar] [CrossRef] [PubMed]
- Kavamura, V.N.; Esposito, E. Biotechnological strategies applied to the decontamination of soils polluted with heavy metals. Biotechnol. Adv. 2010, 28, 61–69. [Google Scholar] [CrossRef] [PubMed]
- Chen, W.; Li, H. Cost-Effectiveness Analysis for Soil Heavy Metal Contamination Treatments. Water Air Soil Pollut. Vol. 2018, 229, 126. [Google Scholar] [CrossRef]
- Karachaliou, T.; Protonotarios, V.; Kaliampakos, D.; Menegaki, M. Using Risk Assessment and Management Approaches to Develop Cost-Effective and Sustainable Mine Waste Management Strategies. Recycling 2016, 1, 328–342. [Google Scholar] [CrossRef]
- Ahmed, I.B.; Nwaichi, E.O.; Ugwoha, E.; Ugbebor, J.N.; Arokoyu, S.B. Cost reduction strategies in the remediation of petroleum hydrocarbon contaminated soil. Open Res. Afr. 2022, 5, 21. [Google Scholar] [CrossRef] [PubMed]
- Zhang, J.; Wu, C.; Wang, L.; Mao, X.; Wu, Y. The Work Flow and Operational Model for Geotechnical Investigation Based on BIM. IEEE Access 2016, 4, 7500–7508. [Google Scholar] [CrossRef]
- Lindh, P. Optimising binder blends for shallow stabilisation of fine-grained soils. Proc. Inst. Civ. Eng.—Ground Improv. 2001, 5, 23–34. [Google Scholar] [CrossRef]
- Boumezerane, D. Recent Tendencies in the Use of Optimization Techniques in Geotechnics: A Review. Geotechnics 2022, 2, 114–132. [Google Scholar] [CrossRef]
- Rehman, A.U.; Moghal, A.A.B. The Influence and Optimization of Treatment Strategy in Enhancing Semiarid Soil Geotechnical Properties. Arab. J. Sci. Eng. 2018, 43, 5129–5141. [Google Scholar] [CrossRef]
- Yin, Z.Y.; Jin, Y.F.; Shen, J.S.; Hicher, P.Y. Optimization techniques for identifying soil parameters in geotechnical engineering: Comparative study and enhancement. Int. J. Numer. Anal. Methods Geomech. 2018, 42, 70–94. [Google Scholar] [CrossRef]
- Onyelowe, K.C.; Mojtahedi, F.F.; Ebid, A.M.; Rezaei, A.; Osinubi, K.J.; Eberemu, A.O.; Salahudeen, B.; Gadzama, E.W.; Rezazadeh, D.; Jahangir, H.; et al. Selected AI optimization techniques and applications in geotechnical engineering. Cogent Eng. 2023, 10, 2153419. [Google Scholar] [CrossRef]
- SS-EN 197-1:2011; Cement—Part 1: Composition, specifications and conformity criteria for common cements. Swedish Institute for Standards: Stockholm, Sweden, 2011; 48p.
- SS-EN 15167-1:2006; Ground granulated blast furnace slag for use in concrete, mortar and grout—Part 1: Definitions, specifications and conformity criteria. Swedish Institute for Standards: Stockholm, Sweden, 2006.
- Lindh, P.; Lemenkova, P. Resonant Frequency Ultrasonic P-Waves for Evaluating Uniaxial Compressive Strength of the Stabilized Slag–Cement Sediments. Nord. Concr. Res. 2021, 65, 39–62. [Google Scholar] [CrossRef]
- SS-EN ISO 17892-11:2019; Geotechnical investigation and testing—Laboratory testing of soil—Part 11: Permeability tests (ISO 17892-11:2019). Swedish Institute for Standards: Stockholm, Sweden, 2019.
- STD-8013628; Karaktärisering av Avfall—Test av GrundläGgande Lakegenskaper—Dynamisk Laktest för Monoliter Med Periodiskt Utbyte av LakväTska vid BestäMda TestföRhåLlanden [Characterization of waste—Test of basic leach properties—Dynamic Leach Test for Monoliths with Periodic Exchange of Leach Liquid at Specified Test Conditions]. Swedish Institute for Standards: Stockholm, Sweden, 2015. (In Swedish)
- Zeffer, A.; Samuelsson, P.O. Sedimentprovtagning i SmåBåTshamnar i Stenungsund [Sediment Sampling in Marinas in Stenungsund]; Technical Report; Stenungsund Municipality: Stenungsund, Sweden, 2011; 62p. (In Swedish) [Google Scholar]
- Inui, T.; Kamon, M.; Katsumi, T.; Kida, A. Evaluating Cr(VI) Leaching from Recycled Waste Concrete Aggregate Using Acceleration Tests. In Proceedings of the GeoCongress 2008, New Orleans, LA, USA, 9–12 March 2008; ASCE: Reston, VA, USA, 2008; pp. 280–287. [Google Scholar] [CrossRef]
- Holleran, I.; Wilson, D.J.; Holleran, G.; Walubita, L.F. Reclaimed Asphalt Pavements and Contaminant Leaching-A Literature Review Study. In Proceedings of the Geo-China 2016, Shandong, China, 25–27 July 2016; ASCE: Reston, VA, USA, 2016; pp. 19–28. [Google Scholar] [CrossRef]
- Chen, J.; Eun, J.; Feng, Y.; Tinjum, J.M. Long-Term Leaching Behavior of Chromite Ore Processing Residue as Backfill Material and the Propagation of Chromium in the Surrounding Soil. J. Hazard. Toxic Radioact. Waste 2021, 25, 04021017. [Google Scholar] [CrossRef]
- Sandhu, N.K.; Axe, L.B.; Jahan, K.; Ramanujachary, K.V.; Magdaleno, T.F. Leaching of Arsenic, Lead, and Antimony from Highway-Marking Glass Beads. J. Environ. Eng. 2013, 139, 1168–1177. [Google Scholar] [CrossRef]
- Lin, Y.T.; Weng, C.H.; Lee, S.Y. Spatial Distribution of Heavy Metals in Contaminated Agricultural Soils Exemplified by Cr, Cu, and Zn. J. Environ. Eng. 2012, 138, 299–306. [Google Scholar] [CrossRef]
- Kim, S.O.; Kim, K.W.; Stüben, D. Evaluation of Electrokinetic Removal of Heavy Metals from Tailing Soils. J. Environ. Eng. 2002, 128, 705–715. [Google Scholar] [CrossRef]
- Bongo, G.; Mercier, G.; Chartier, M.; Dhenain, A.; Blais, J.F. Treatment of Aluminum Plant Hazardous Wastes Containing Fluorides and PAH. J. Environ. Eng. 2009, 135, 159–166. [Google Scholar] [CrossRef]
- Nordmark, D.; Vestin, J.; Lagerkvist, A.; Lind, B.B.; Arm, M.; Hallgren, P. Geochemical Behavior of a Gravel Road Upgraded with Wood Fly Ash. J. Environ. Eng. 2014, 140, 05014002. [Google Scholar] [CrossRef]


| Sample ID | Sample Water Ratio (%) | Bulk Density (t/m3) | Dry Density (t/m3) |
|---|---|---|---|
| 60.8 | 1.62 | 1.01 | |
| 75.3 | 1.49 | 0.85 | |
| 107 | 1.40 | 0.68 | |
| 63.5 | 1.62 | 0.99 | |
| 45.2 | 1.77 | 1.22 | |
| 45.5 | 1.72 | 1.18 |
| Sample 1_5 | Sample 3_5 | Sample 4_1 | Sample 5_4 | Sample 6_5 | Sample 8_5 | ||||||
|---|---|---|---|---|---|---|---|---|---|---|---|
| t | p | t | p | t | p | t | p | t | p | t | p |
| 41.90 | 1.7 | 41.94 | 1.1 | 41.91 | 1.2 | 65.91 | 6.2 | 41.96 | 2.3 | 17.98 | 1.2 |
| 49.96 | 1.8 | 49.99 | 1.2 | 49.97 | 1.1 | 74.05 | 6.1 | 46.29 | 2.3 | 26.02 | 1.2 |
| 65.88 | 1.9 | 65.93 | 1.4 | 65.89 | 1.5 | 91.27 | 5.0 | 50.00 | 2.3 | 41.96 | 1.7 |
| 74.02 | 1.8 | 74.07 | 1.4 | 74.03 | 1.8 | 122.25 | 4.9 | 65.94 | 2.5 | 50.11 | 1.9 |
| 91.23 | 1.5 | 91.29 | 1.2 | 91.24 | 1.6 | – | – | 74.09 | 2.9 | 67.32 | 1.7 |
| – | – | – | – | – | – | – | – | 91.31 | 3.0 | – | – |
| 122.22 | 1.5 | 122.26 | 1.0 | 122.23 | 1.2 | 144.98 | 4.8 | 122.27 | 3.0 | 98.28 | 1.5 |
| Test Site | Heavy Metals | Total PAH-16 | TBT-Sn | ||||||
|---|---|---|---|---|---|---|---|---|---|
| As | Pb | Cd | Cr | Hg | Ni | Zn | |||
| 1–2 | 13 | 47 | 0.5 | 47 | 0.365 | 41 | 200 | 9.4 | 37 |
| 3–4 | 10 | 34 | 0.2 | 43 | 0.17 | 38 | 140 | 0.5 | 2.8 |
| 5 | 9 | 38 | 0.32 | 45 | 0.174 | 30 | 140 | 0.94 | <2.0 |
| 6 | 7.5 | 45 | 0.1 | 37 | 0.317 | 26 | 180 | 1.4 | 38 |
| 8 | 13 | 100 | 0.86 | 52 | 0.574 | 50 | 350 | 8.1 | 5.9 |
| TS | PCB 28 | PCB 52 | PCB 101 | PCB 118 | PCB 153 | PCB 138 | PCB 180 | ∑ 7 PCB |
|---|---|---|---|---|---|---|---|---|
| 1–2 | 0.0054 | 0.019 | 0.014 | 0.0098 | 0.20 | 0.20 | 0.013 | 0.1 |
| 3–4 | <0.00050 | 0.00061 | <0.00050 | <0.00050 | 0.00063 | 0.00063 | <0.00050 | 0.0019 |
| 5 | <0.00053 | <0.00053 | <0.00053 | <0.00053 | 0.0011 | 0.0011 | 0.00070 | 0.0029 |
| 6 | 0.0017 | 0.0059 | 0.0026 | 0.0031 | 0.0033 | 0.0033 | 0.0022 | 0.022 |
| 8 | 0.0063 | 0.017 | 0.015 | 0.012 | 0.012 | 0.012 | 0.0071 | 0.081 |
| Metal | Class 1 | Class 2 | Class 3 | Class 4 | Class 5 |
|---|---|---|---|---|---|
| As | <10 | 10–17 | 17–28 | 28–45 | >45 |
| Cd | <0.2 | 1.2–0.5 | 0.5–1.2 | 1.2 | >3 |
| Cr | <40 | 40–48 | 48–60 | 60–72 | >72 |
| Cu | <15 | 15–30 | 30–49.5 | 49.5–79.5 | >79.5 |
| Hg | <0.04 | 0.04–0.12 | 0.12–0.4 | 0.4–1 | >1 |
| Ni | <30 | 30–45 | 46–66 | 66–99 | >99 |
| Pb | <25 | 25–40 | 40–65 | 65–110 | >110 |
| Zn | <85 | 85–127.5 | 127.5–204 | 204–357 | >357 |
| Sample | As | Pb | Cd | Cr | Hg | Ni | Zn |
|---|---|---|---|---|---|---|---|
| B 1, S-6 | above | below | below | below | below | above | both |
| B 1, S-7 | above | below | below | below | below | above | below |
| B 1, S-8A | above | below | below | below | below | above | both |
| Metal | A 23 | A 17 | A 18 | T 11 | T 09 | |||
|---|---|---|---|---|---|---|---|---|
| As | 0.0807 | 0.0782 | 0.105 | 0.0276 | 0.0050 | <0.0014 | 0.0042 | 0.0090 |
| Cd | <0.004 | <0.004 | <0.004 | 0.0025 | 0.00035 | <0.00028 | <0.0003 | <0.0003 |
| Cr | <0.04 | <0.04 | <0.04 | 0.006 | 0.010 | 0.0091 | 0.0091 | 0.024 |
| Hg | <0.002 | <0.002 | <0.002 | <0.0063 | <0.0070 | <0.0070 | <0.0076 | <0.0082 |
| Ni | 0.272 | 0.411 | 0.4 | 0.52 | 1.1 | 0.14 | 0.46 | 0.69 |
| Zn | <0.2 | <0.2 | <0.2 | <0.013 | <0.014 | <0.014 | <0.015 | <0.02 |
| TBT | 101 | 103 | 157 | 275 | 1180 | 315 | – | – |
Disclaimer/Publisher’s Note: The statements, opinions and data contained in all publications are solely those of the individual author(s) and contributor(s) and not of MDPI and/or the editor(s). MDPI and/or the editor(s) disclaim responsibility for any injury to people or property resulting from any ideas, methods, instructions or products referred to in the content. |
© 2023 by the authors. Licensee MDPI, Basel, Switzerland. This article is an open access article distributed under the terms and conditions of the Creative Commons Attribution (CC BY) license (https://creativecommons.org/licenses/by/4.0/).
Share and Cite
Lindh, P.; Lemenkova, P. Optimized Workflow Framework in Construction Projects to Control the Environmental Properties of Soil. Algorithms 2023, 16, 303. https://doi.org/10.3390/a16060303
Lindh P, Lemenkova P. Optimized Workflow Framework in Construction Projects to Control the Environmental Properties of Soil. Algorithms. 2023; 16(6):303. https://doi.org/10.3390/a16060303
Chicago/Turabian StyleLindh, Per, and Polina Lemenkova. 2023. "Optimized Workflow Framework in Construction Projects to Control the Environmental Properties of Soil" Algorithms 16, no. 6: 303. https://doi.org/10.3390/a16060303
APA StyleLindh, P., & Lemenkova, P. (2023). Optimized Workflow Framework in Construction Projects to Control the Environmental Properties of Soil. Algorithms, 16(6), 303. https://doi.org/10.3390/a16060303