Abstract
A lung nodule is a tiny growth that develops in the lung. Non-cancerous nodules do not spread to other sections of the body. Malignant nodules can spread rapidly. One of the numerous dangerous kinds of cancer is lung cancer. It is responsible for taking the lives of millions of individuals each year. It is necessary to have a highly efficient technology capable of analyzing the nodule in the pre-cancerous phases of the disease. However, it is still difficult to detect nodules in CT scan data, which is an issue that has to be overcome if the following treatment is going to be effective. CT scans have been used for several years to diagnose nodules for future therapy. The radiologist can make a mistake while determining the nodule’s presence and size. There is room for error in this process. Radiologists will compare and analyze the images obtained from the CT scan to ascertain the nodule’s location and current status. It is necessary to have a dependable system that can locate the nodule in the CT scan images and provide radiologists with an automated report analysis that is easy to comprehend. In this study, we created and evaluated an algorithm that can identify a nodule by comparing multiple photos. This gives the radiologist additional data to work with in diagnosing cancer in its earliest stages in the nodule. In addition to accuracy, various characteristics were assessed during the performance assessment process. The final CNN algorithm has 84.8% accuracy, 90.47% precision, and 90.64% specificity. These numbers are all relatively close to one another. As a result, one may argue that CNN is capable of minimizing the number of false positives through in-depth training that is performed frequently.
1. Introduction
Lung nodules are tiny clusters of cells that are highly frequent in the lungs. The majority of lung nodules are scar tissue from previous lung infections. Lung nodules seldom cause symptoms. They are frequently discovered by chance on a chest X-ray or CT scan performed for another purpose. Some lung nodules are malignant, while others are not. The majority of nodules are harmless. People may seek medical attention if a nodule grows fast or continues for an extended period. Small, non-cancerous lung nodules usually have little effect on your quality of life. According to a 2020 study, persons with solitary malignant nodules had a 3-year overall survival rate of 93.6% and a 5-year overall survival rate of 89.8% [1].
Shortness of breath, back discomfort, weight loss, weakness, and weariness are all symptoms of lung nodules. When a patient exhibits signs of a respiratory ailment or infection, a doctor will often order a chest X-ray or a CT scan. A CT scan provides a more comprehensive image and can detect nodules as tiny as 1 cm. The optimal therapy for a lung nodule typically relies on whether it contains characteristics that indicate cancer risk. Lung cancer is the leading cause of cancer-related mortality in the United States and the third most prevalent cause of death overall [2].
Cancer comprises a group of illnesses distinguished from one another by the uncontrolled development of aberrant cells. Cancer is a catchall term for a group of diseases that have the potential to invade other sections of the body or spread after they have established a foothold in one area. After receiving a cancer diagnosis, a patient’s prognosis may be influenced by various circumstances, including treatment options. It is crucial to note that while there is a strong correlation between the advancement of cancer to later stages (stages 3–4) and a poorer prognosis, this association is not always cut and dried. It is far more difficult to precisely diagnose and treat a specific patient because there are more than a hundred forms of cancer [3,4,5]. The degree of difficulty varies depending on the kind of sickness and the patient’s current state of health. It is of the utmost importance to provide the medical community with unique shortcuts to enable a rapid diagnosis of the specific kind of cancer and the stage at which it was discovered.
Lung cancer is a danger to the general public’s health on a global scale. With over 884,000 occurrences yearly, lung cancer is the third most prevalent cancer in developed nations. Breast and colon cancer are the two most pervasive kinds [6].
In an attempt to lower the mortality rates brought on by lung cancer, the governments of several countries have made the construction of early detection and screening programs for the disease a top priority. The National Lung Screening estimates that low-dose computerized tomography (CT) screening might lower the mortality rate from lung cancer by 20%. Radiologists risk missing specific tiny lung cancer nodules by looking at a large volume of medical pictures when evaluating patients utilizing LDCT. Radiologists may identify patients more quickly and accurately using computer-aided detection systems (CADs), which may offer potential nodules with particular placements. In the United States of America, there will be around 222,500 new cases of cancer diagnosed in 2020. Early detection of uncontrolled cell growth is essential since it may considerably increase a patient’s chances of surviving the illness because unchecked cell proliferation is the primary cause of lung cancer. Lung cancer patients can now start treatment sooner because of the advent of CT imaging, which has significantly increased the likelihood of achieving an early diagnosis. The focused opacity and size range of three to thirty millimeters of a nodule may be utilized to identify it. The development of computer tomography has led to the discovery of many lung nodules that vary in kind and size [7].
Pulmonary nodules are a type of lung irregularity that can be observed in the early stages of pulmonary disease. Radiologists use pulmonary imaging to diagnose lung nodules. Identifying and categorizing lung nodules on various pictures, such as CT images, electron microscopy images, and histopathology images, has sparked significant mathematical, statistical, and observational research during the last 50 years. Recent remarkable and significant improvements in machine learning for pulmonary nodules have been attained across research and commercial applications. Various methods appear promising as suitable decision analysis systems to adequately handle the core problems in lung nodule diagnosis, such as feature extraction, nodule identification, true-negative reduction, and cancerous–non-cancerous differentiation [8].
Lung cancer is the leading cause of death worldwide, accounting for around 1.8 million deaths each year and the expenditure of several billion dollars for medical care. Compared to other types of cancer, lung cancer is the third most prevalent cause of death among women. On the other hand, cancer, in general, is the leading cause of death among men [9]. Lung cancer is distinguished from other forms of cancer by the unchecked growth of abnormal cells in either one or both of the lungs. The capacity of the pulmonary system to transmit oxygen-rich blood to the rest of the body, as suggested by Liu and colleagues, may be hampered by defective cells in the pulmonary system. It may be difficult to diagnose lung cancer in its early stages, since symptoms do not show until the illness has advanced to its last stages. Most lung cancer patients receiving diagnoses right now are in the advanced stages of the disease. This is because the nodule, a small lesion formation, first emerged earlier in the process. Most of the time, these microscopic lesions are not detected by X-rays, since this scanning approach does not depend on the expert competence and knowledge of a medical practitioner, even if X-rays may be used to discover these nodules [10]. Figure 1 shows multiple chest X-ray scanning routes (left) and depictions of all scanning zones in symmetry (right). In this challenging example of scanning without arrows, the reader could miss several tiny spots with lung nodules.
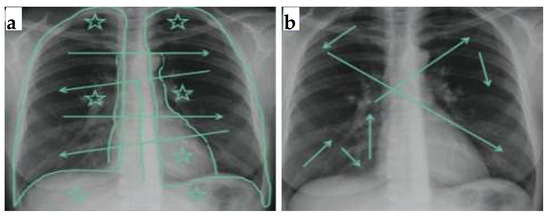
Figure 1.
Multiple chest X-ray scanning routes (a); depiction of all scanning zones in symmetry (b).
X-ray and CT Scan images of the same patient are presented in Figure 2, where image (a) is an X-rays that show no nodule, while CT scan images (b,c) identify the lung cancer nodules.
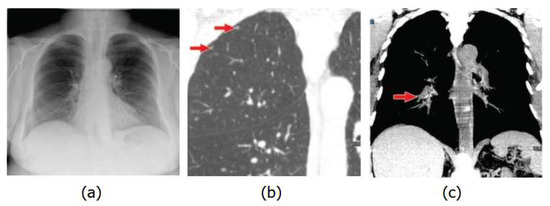
Figure 2.
X-rays shows no nodule (a), CT scan images identify the lung cancer nodules (b,c).
Several algorithms and research approaches have been developed to investigate lung cancer. These strategies are effective. The present research highlights the need to utilize SVM and image processing techniques to correctly identify lung cancer at all stages and deliver more precise results. This is despite the different methodologies that have been previously explored.
Deep learning and artificial intelligence are becoming more popular search terms across various business sectors and application domains, including but not limited to the automotive industry, identification systems, financial predictions, and automated diagnostics. Convolutional neural networks, which strive to create computerized systems with the capacity to revolutionize the world in a matter of years, have made this subject increasingly prominent. However, deep neural networks, of which convolutional neural networks are a subtype, have recently shown extraordinary achievements in speech recognition, object identification, and natural language processing, amongst others [11,12,13].
1.1. Problem Statement and Goal
Automated lung detection and segmentation is a complex problem, although much progress has been made. However, expert radiologists manually detect lung nodules, which is both costly and time-consuming. This is because much of the prior “automation” work was actually performed using supervised/unsupervised learning techniques, which have a high false positive rate and need a large amount of previously segmented training data. Furthermore, most approaches were limited to a small number of datasets. To solve these concerns, a novel strategy was used in this work. An algorithm was created that can be used for both 2D and 3D images. This approach is based on the characteristics of lung nodules and patch-based image segmentation. A unique size- and shape-based feature vector was developed, as was a nodule-based atlas search approach. As a result, this approach has a high sensitivity for detecting diverse types of nodules. The algorithms prioritize having minimal false positives while remaining computationally efficient.
1.2. Research Question
The following research questions were developed to guide this investigation.
- RQ1: What are the obstacles to utilizing CT imaging to detect early lung nodules?
- RQ2: How can an effective lung nodule identification system that minimizes false positives and reduces computing time be developed?
- RQ3: How can we increase nodule detection sensitivity for different lung nodules?
1.3. Objectives of the Study
The following were the study’s objectives:
- To develop quick nodule detection and analysis methods for computed tomography (CT) scan pictures.
- To use advanced Python and MATLAB tools that will make this procedure more precise, consistent and improve the radiologist workflow.
- To create a robust algorithm for detecting lung nodules in 2D and 3D pictures.
2. Related Works
This section discusses baseline approaches to machine learning-based lung nodule classification. A keyword-based string comprising machine learning and lung nodule detection approaches was used to search the papers in various databases, including IEEE, Springer, Scopus, Google Scholar, ACM, Science Direct, and Wiley. Those papers that discussed lung nodule classification and had been published in the journals listed above were selected. After initial selection, the papers were reviewed for their proposed method and classification approach. The papers that were focused on machine learning-based approaches were then identified and included in this research to learn about the foundations of lung nodule classification. All other articles retrieved from the initial search were excluded. The authors investigated the problem of lung cancer diagnosis using CT images to classify and detect pulmonary nodules. An automated deep learning-based system for classifying and detecting lung nodules was developed.
Furthermore, they used novel state-of-the-art architectures such as Faster-RCNN, YOLOv3, and SSD for detection. A publicly available benchmark LIDC-IDRI dataset was used to evaluate all deep learning models. The results of the experiments revealed that the false positive rate (FPR) was reduced, and the accuracy was improved [14].
To detect nodules from CT scans using semantic segmentation in conjunction with the classification model, a novel computer-aided lung nodule detection framework was proposed (PD-CLSTM). A modified Atrous UNet + model was developed to detect nodule candidates from axial slices. The model achieves high nodule detection sensitivity by combining multilevel semantic features with ensemble skip connection [15].
According to the authors, both small-cell and non-small-cell lung cancers are quite common, although small-cell lung cancer is the more common of the two. All of these categories have the potential to result in fatalities. Small-cell lung cancer accounts for 15% of all instances of lung cancer, while non-small-cell lung cancer accounts for 85% of all lung cancer cases [16].
Pulmonary nodules are a kind of tumor that develops in the tissue of the lungs, as stated by the American Lung Association. Pulmonary nodules are most often seen in patients who have lung cancer. In 1984, a thoracic radiology terminology dictionary developed by the Fleischer Society and based on industry standards was published (public picture data source). According to the definition provided by this organization, a pleural lesion is “any lung or pleural lesion with a well-defined, clear, generally circular opacity ranging in diameter from 2 to 30 cm”. In 2004, the association determined that a lung nodule was a “round opacity, at least diminished, and with a maximum diameter of fewer than 3 cm” [17].
According to the authors, a radiological opacity, known as a single pulmonary nodule (SPNs), may be as large as 30 mm in diameter and encompass about two-thirds of the lung parenchyma along with its boundaries. There are three different types of nodules: just pleural, vascularized, and plain-tailed. Contrary to a just pleural nodule, which connects to the pleural surface, a plain-tailed lesion lacks any substantial vascular connections. The types of SPNs (single pulmonary nodule) are different from each other due to their diameter. Groups of nodules larger than 30 mm are referred to as lung masses, and malignant lung tumors almost always include cancerous cells. “Lung cancer” refers to possible lung tissue growth [18,19,20].
Similarly, substantial research has been conducted on identifying and segmenting 2D and 3D CT images. Several periodicals have reported on the findings of these investigations. These approaches used for the detection of images were built by using an algorithm that often includes many steps. However, only a tiny proportion of publications regularly use the same strategies [21].
Further, the authors cited that imaging involves several customary steps, including acquisition, pre-processing, lung segmentation, nodule detection, and false positive removal. They advise starting with thorough pulmonary imaging. In academia, various free database options are available [22].
In CT scans, pre-processing lowers noise and objects. Since various CT scanners create pictures with varied sizes and intensities, pre-processing processes could also be necessary. Since pre-processing is not essential, it was not included in any publications. There are several pre-processing techniques employed. A trustworthy 3D spatial reconstruction for data reconstruction is provided by [23] and uses linear isotropic interpolation. Morphological procedures followed the median filtration for flushing. Gaussian filtering was used to remove artifacts in several studies, including [24]. Lung nodule identification using a generic module is presented in Figure 3.
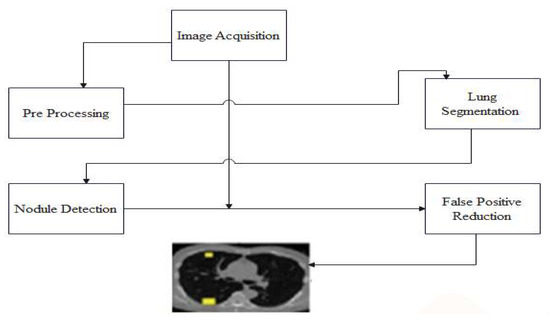
Figure 3.
Lung nodule identification using a generic module.
The procedure outlined in [25] included a variety of pre-processing phases, including but not limited to the following: They began by standardizing the voxel size and then moved on to ensure that the intensity was consistent throughout all of the voxels. In addition to that, a Gaussian picture noise filter was used. According to the study in [26], the third phase involves the division of the lungs. The term “lung segmentation” refers to dividing the fatty and muscular components that make up the lung area into distinct compartments. The techniques known as threshold approaches and the methods based on form or diameter are two of the most common segmentation procedures [27]. Figure 4 illustrates the process of segmenting a lung sample that has been obtained. Authors in [26] applied a threshold approach in the first phase. The second phase used a 3D-linked component label for pulmonary volume, and the third step involved an allocation of segmenting ratios.
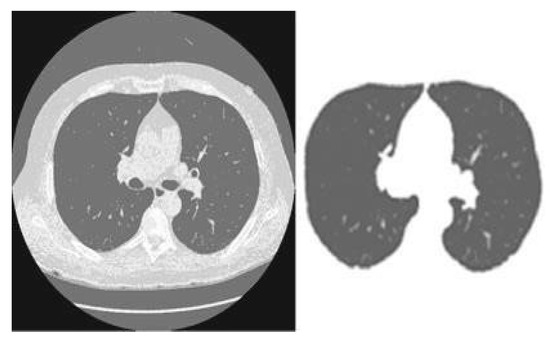
Figure 4.
Segmentation example on lung scan image.
Authors in one study proposed a multistage contour modeling technique that was used for lung segmentation. Initially, an adaptive, fluid threshold-holding method was used to collect the binary pictures. A hole-free mask was then fitted with the assistance of two windows. After that, the lung area was determined by using the active contour modeling technique [28]. Researchers conducted an additional study in which they segmented the lung boundaries for the same activities using a deformable pattern. They suggested that the area be modeled after the lungs, which are similar in that they are both a developing zone and an active form [29].
One category, “Bayesian supervised”, has been explicitly designed for false positives. Classifiers were developed by [9]. Seven criteria were determined to apply to each candidate nodule within their methodology. A threshold value was determined for each characteristic, or cut-off value, at which a potential nodule might be identified as a solid nodule. Most of the study concentrated on the conventional imaging and pre-processing techniques used in applying 2D and 3D procedures [30]. The photos obtained as source material for any of these approaches can be found in the RIDER database, which can be reached via the TCIA archives. Both of these solutions include the development of two different pre-processing techniques: thresholding and morphological operation.
A target picture is segmented using multitask segmentation, which involves manipulating a series of atlases (already pre-segmented images). The authors proposed the concept and offered a comprehensive assessment of segmentation approaches based on numerous atlases. Instead of employing a model-based approach to picture segmentation, this technique modifies existing atlases to create new ones. Figure 5 provides an example of a block diagram that may be used in a MAS algorithm [31].
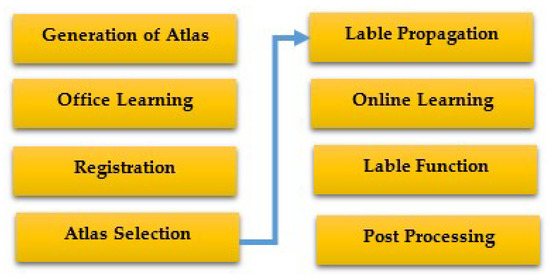
Figure 5.
The fundamental components of a standard MAS algorithm [31].
In atlases, split images are already present. Domain-specific experts often draw inspiration from the facts and figures available in anatomy textbooks when producing atlases. Additionally, when necessary, they employ alternative visual modalities and commercial software.
Atlases are often inspected offline after creation, and while the atlas is being divided, extra information may be gathered for further processing. Atlases were examined and rated independently by [32] based on various factors, such as their intensity, deformation, and reference. Then they used the technique for rectification of spearman ranks to group atlases. Registration is the process of figuring out how several images connect geographically. A similitude parameter is chosen in the first phase of the photo registration process. For an image to be distorted, it is essential to employ a deformation model to optimize this value (atlas). There are several methods to go about the registration process. The similarity metric was described as an improved version of the mutual data spline-based deformation model by [32], who developed a sift-flow atlas deformation method and a similarity measure that is based on the SIFT descriptor in their study. They created a novel approach for the directed group of particle image registration. The exact number of particles/pixels is chosen from various themes to achieve the minimum description length (MDL) correspondence. There is a claim that relatively recent publications have clarified the idea of non-local approaches and the lack of patch development.
For instance, breaking the target image into smaller pieces [30] improved local registration. Each brick made a difference in the final result. An essential part of the procedure is the MAS algorithm. The ultimate labels for the target image are created by mixing the spreading bands. The majority of the pixel labels from the selected atlases were utilized by early MAS algorithms’ majority voting method to choose which pixel label should be used for the target pixel. In recent works, a weighted voting approach has been used. As an example, [33] created a weighted voting system that selects weights based on regional cross-country weights.
To detect lung nodules in images, ref. [34] suggested threshold-based image segmentation methods. The least complex photo segmentation technique presently known is this one. This way of segmenting images makes use of the image histogram. Each histogram peak represents a separate region, and the value of the intensity of the two extremes, also known as the “threshold”, is used to split the classes into the desired categories. The pixel intensities for each threshold level should then be grouped. After that, the segmentation process will be carried out.
Authors in [35] created algorithms to categorize lung nodules depending on where they were discovered. This technique divides an image into a few discrete pieces, each following its homogeneity requirements. The demand is that grayscale pixel values be used to ensure uniformity. Numerous approaches, including the fusion, split, and merger of areas, are included in regional segmentation. Geographic segmentation is used to divide the population. The split and merge method is a hybrid strategy that combines the most practical elements of all of the previously stated tactics. Pixels are categorized using a set of standards based on levels of resemblance. The use of similarity criteria is crucial for effective segmentation.
Several clustering-based approaches for nodule identification were reported in [36]. The cornerstone of this method in clustering algorithms is segmenting pixels into regular clusters. With the help of this technology, image segmentation may be completed without the need for human supervision. It chooses the natural pixel grouping based on a stated set of parameters. Numerous distinct categorization algorithms have been widely used in the segmentation of medical images. These techniques include, for instance, the expectation maximization (EM) methodology, ISODATA, fuzzy c-means, and K-means. When working together with others, researcher created a computer-aided design (CAD) system with a variety index and quality threshold (QT) (DI). Using the QT algorithm, candidates were chosen.
The nodules were found using the K-means clustering technique. There were initially just three courses from which to pick. The nodule cluster was then considered the class since it had the highest mean intensity value. All of the just vascular nodules were linked by blood arteries. Therefore, dissecting the just vascular nodules from the blood vessels is crucial. The researchers’ results led them to classify these links as either 2D or 3D. It was known as a “2D” structure if a vessel and a nodule were connected in a single slice. The term “3D connection” was used to describe branches and nodules that seemed to be separate objects inside a single piece but were connected to every last portion or another. Using a form-specific morphological opening strategy, the researchers could sever the 2D relationship. A structural “line” element with length and angle attributes was employed throughout the inquiry. Whether or not branches should be removed in three dimensions may be decided by comparing the related three-dimensional areas of each component. They concluded that nodules should be classified into six categories based on the “nodule inherited thickness” and the “% of wall connection”.
3. Methods and Techniques
3.1. Proposed Method for Lung Nodule Localization
Computer-aided diagnostic (CAD) systems were developed to offer a second perspective. These technologies have the potential to detect and evaluate lung nodules shown on CT scans automatically. Because they are required to cope with various situations in a condensed amount of time daily, radiologists endure less stress than other medical professionals. By incorporating linear and non-linear adjustments, researchers improved the CAD system’s ability to detect lung cancer. The researchers enhanced the system’s capability to identify lung cancer due to these modifications, which provided more abstract and easily comprehendible representations of machine learning approaches and procedures. In this way, the system’s accuracy was increased. These improvements have greatly improved the system’s ability to identify the problem. However, it is of the utmost importance to develop an automated system that can locate lung nodules rapidly while requiring little human effort.
This section breaks down and goes into great depth on a new CNN-based nodule localization technique for detecting lung nodules in CT images. Throughout the system’s development, we discussed the pre-processing procedures needed to analyze the many meta-parameters that make up the system’s configuration. The suggested approach generates a grid with the exact dimensions of the CT image being examined to identify lung nodules in those pictures. The positions and boundaries of lung nodules may be predicted using this grid. The technique also makes use of a convolutional neural network (CNN) [37,38,39]. Before being utilized in the pre-processing step, every DICOM image in RGB format is converted to grayscale. An adaptive median filter may be used to enhance image quality. The flow chart of our proposed system is presented in Figure 6.
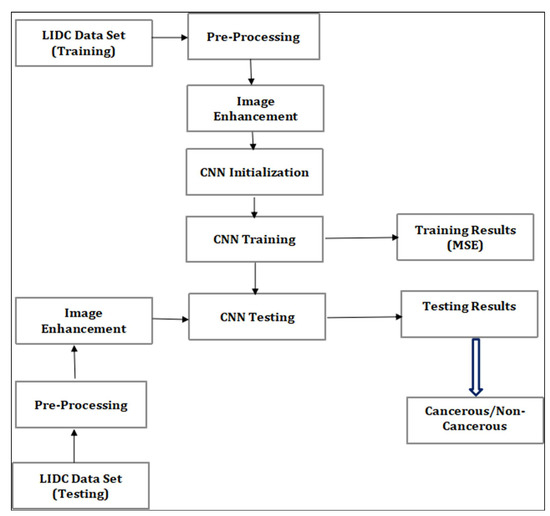
Figure 6.
Flow chart of the proposed system.
To better effectively manage the information, the Lung Image Database Consortium and the Image Database Resource Initiative (IDRI) divided the data gathering into training and testing data (LIDC). Several performance indicators, including accuracy, sensitivity, and specificity, were considered while assessing the proposed system’s efficacy. The likelihood of discovering a nodule at each scan site is represented by a single grid that combines the results of two CT scan sub-volumes. This grid shows the possibility of finding a nodule.
3.1.1. Pre-Processing
The resolution of images acquired from CT scanners is 512 pixels on each side, recorded in the DICOM format. One of the objectives of this research was to detect malignant cells, which should be made simpler by using these samples that have already undergone pre-processing. The dataset given by the LIDC was used in this study. The images were stored in the LIDC using the “digital imaging and communications in medicine” (DICOM) standard. The procedure for acquiring data included CT scans of both benign and malignant neoplasms. Each image was first converted into a grayscale version before being rescaled. The photos were scaled up to a better resolution, after which they were utilized by the algorithm to train itself. The procedure may be divided into the following stages.
3.1.2. Bitmap Conversion
The image will be converted into a bitmap when we proceed to the subsequent step. You usually have the option of choosing between two different file formats for the photographs that you upload. At the moment, you may purchase them in both 2D and 3D versions. Images rendered in a two-dimensional form have the potential to showcase a diverse variety of characteristics. The data initially stored in the 2D DICOM format is transformed into a bitmap image format using the RadiAnt DICOM Viewer program (64-it). In contrast, the 3D format provides users with various benefits, some of which were discussed above. These benefits include the following: The application known as MITK will perform a conversion on the file so that it may be saved in a bitmap format. In addition to that, the file will contain information that was kept in the 3D-MHD format. Converting to a single version guarantees that the proposed solution works properly with 2D and 3D photos. This is because both pictures can have the same characteristics after being transformed into bitmap images.
3.1.3. Noise Removal
The image’s visual and overall quality is improved by noise reduction. The image filtering methods used in this strategy are intended to enhance the overall picture quality. The quality of a picture degrades when there is noise present, which also has the effect of decreasing the colorization performance requirements. An adaptive median filter is used to remove noise. This filter uses the average formula to help change the pixel value to correspond with the area/cluster-wide weighted average. An image’s quality increases as noise is removed from it. The adaptive median filter is simple and understandable. It reduces the density variance and modulates the clusters’ mean values. Additionally, it eliminates noise by using each picture pixel’s definition. A weighted average value is used to replace each missing pixel value, which is then adjusted based on how close it is to other pixels in the picture.
3.1.4. Grayscale Conversion
Initially stored in RGB format, the bitmap images must be changed into a grayscale version. Several techniques may be used to convert photos into grayscale. This objective is achieved by using the weighted average calculation approach. The average value of a pixel’s red, green, and blue components in color pictures is used as the RGB matrix [40]. The moderate approach computes a projection that is then utilized to determine the value of the grayscale using the average value of the r, g, and b components.
3.1.5. Image Enhancement
The whole completed output is subjected to an image enhancement procedure. Then, an adjustment is applied to the intensity value to make the colors easier to perceive and process. Further, a Gaussian high-pass filter is used for the data to achieve this goal. At this stage, pixels from the picture are chosen for removal if their values are less than the average of the cluster. The intensity values of these pixels are then changed. The image’s look and overall quality are enhanced by changing the picture’s intensity value. The method locates the pixels in the picture with black values either below or above the threshold and then modifies their values to make them consistent with the grayscale. With this gray-toning approach, the shot’s outcomes are enhanced. The technique then moves on to improving the photos once they have been compressed. The gray tone has been shown to aid in the tumor detection process. This results from the tumor’s location having the most significant pixel value. The low and high adjustments must thus be found to segment the picture. The low- and high-intensity levels of the pictures in this experiment were modified to 0.41 and 0.42, respectively.
Additionally, pixel values below the lower limit threshold are regarded as 0, and those above the upper bound barrier are considered 1. This procedure assisted in the segmentation of the tumor. The average pixel intensity of the tumor pixels is used to generate the upper and lower bound limits from the image database. The lower bound is the least value of the tumor pixel used to determine the pixel value.
3.1.6. CNN Architecture
Convolutional neural networks are artificial neural networks made up of interconnected nodes meant to simulate the function of neurons in the human brain. In the network diagram, the artificial neurons are portrayed as nodes, and the connections between their input and output are illustrated as arrows. This network has many layers, including convolutional layers, top pooling layers, and fully connected layers. These layers are responsible for a wide array of activities that are connected to the process of learning. CNN’s next iteration will have two distinct areas that are entirely different. Its architecture uses maximum pooling, rectified linear units, and multiple layers of volumetric convolution. The second CNN module that is part of the network is referred to by its internal name, the classifier. In hierarchical neural networks, the second module is made up of layers that are entirely connected, in addition to layers that feature different non-linear processes. With the assistance of these two connected neural network modules, it is possible to achieve high-level thinking. Figure 7 shows the actual setup of a CNN operating in a single vector with only one dimension in length produced by combining all of the values present in the layer that came before the highest pooling layer. This results in the vector having only one dimension. It provides a visual depiction of the differences between convolutional neural networks and fully connected neural networks in terms of the connections between their nodes, which is one of the defining properties of each.
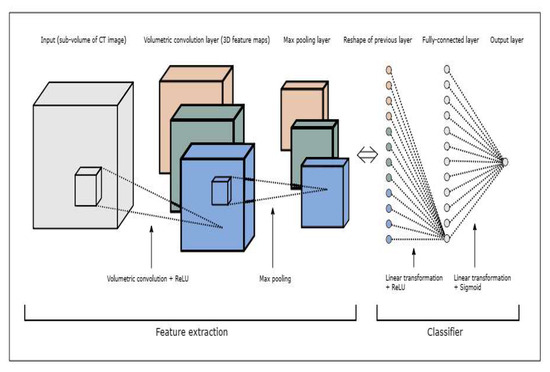
Figure 7.
The architecture of a CNN.
The proposed CNN was employed for image detection and classification. To identify or classify a picture, we ran the trained CNN on test images, which were matrices of pixels in two dimensions. The CNN used a convolution operation to identify and correctly classify a cancerous instance. Similarly to neural networks, CNN draws inspiration from the human brain. The model we used was a modified version of the one initially proposed by Hubel and Wiesel for object recognition. The mathematical procedure known as “convolution” uses an input (or “I”) and an argument (or “kernel”) to produce an output that illustrates how another changes the shape of one item. Let us use an image to illustrate this. The result of performing a mathematical operation on an image “x”, which is a 2D array of pixels with distinct color channels (red, green, and blue—RGB), and a feature detector or kernel “w”, is referred to as a feature map. An image “z” results from an image “y”, a 3D array of pixels with various color channels. The mathematical representation of the classification equation is Equation (1), given below.
where:
- S[t] is the feature map,
- x is the input, and w is the kernel.
3.2. Dataset for Evaluation of System
The location of lung cancers was pinpointed with publicly available information (i.e., LIDC). The LIDC database includes computed tomography (CT) scans of the thoracic region for 1010 people, along with annotation data on nodules larger than 3 mm that up to four other radiologists provided. This information, compiled from the findings of the scans performed on the patients, was gathered gradually over time and stored in a single location. The diagnostic data was collected from a tiny sample size of 157 people. These people were evaluated for two years for biopsy, surgical resection, progression, and radiographic imaging to determine the nodule size. The primary objective of the LIDC data collection was to understand better how these semantic components collaborate throughout the data interpretation process for lung nodule diagnostics. To educate users, we make use of the data that were collected after the development of the learning module. The dataset has been partitioned into two distinct categories for evaluation: training data and testing data, with a split of 20:80 between the two types of information (20% of overall images recorded for learning, 80% of records for testing).
4. Experimentation and Results
Experimentation was performed using MATLAB (R2022a). While learning and using Python might be difficult, MATLAB specializes in mathematical computations. Matrix handling is not native to Python, although it is possible to do so using the NumPy library. Signal processing and image processing are two areas where MATLAB excels, but Python suffers and performs substantially worse in these fields. The main technical difference between MATLAB and Python is that everything is treated as an array in MATLAB, while everything is an object in Python. Since MATLAB was designed to operate with arrays, it is more suitable to deal with feature maps and matrices in image processing and precise classification tasks. Considering these features, we opted for MATLAB for image processing and precise classification of lung nodule detection.
4.1. Proposed CNN Architecture
When considering the architecture that was studied, a model with 350 nodes in the fully connected 1 with patch sizes of (36, 48, and 48) achieved maximum sensitivity for the dataset. The proposed CNN architecture for efficient lung nodule classification is presented in Table 1.

Table 1.
Proposed CNN architecture for efficient lung nodule classification.
A crucial stage in lowering false positives is the comprehensive training phase. Due to this, the training for this study was performed iteratively on a range of unique subsets of the training dataset. These subsets were built utilizing a healthy mix of false positive cases and genuine positive cases that were not identified during the algorithm evaluation. The false positive cases were manually separated from the other examples for the next training iteration once each training session was complete. Consequently, training in the recommended CNN architecture was required to reduce false positives. The training algorithm for false positive reduction is presented in Figure 8.
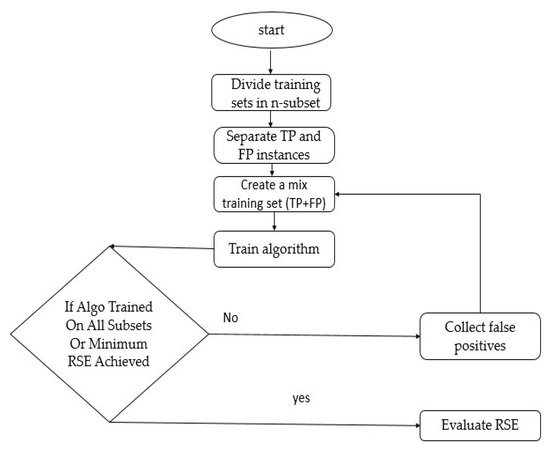
Figure 8.
A training algorithm for false positive reduction.
4.2. Evaluation of Mean Squared Error (MSE)
The convolutional neural network was trained using 850 iterations in total. Convolutional neural networks generally undergo increases in the number of iterations to guarantee the least amount of learning error possible. Additionally, the learning factor was set to 0.5, and the momentum parameter was changed to 0.7. The convolutional neural network’s training process included several moments when the accuracy of the quadratic error prediction was carefully assessed. The graphic in Figure 9 below displays the values of the detected quadratic errors. Given that the quadratic error of the network was 0.02018 after the most recent iteration, it could be inferred that deep learning had little to no impact on the quadratic error of the network.
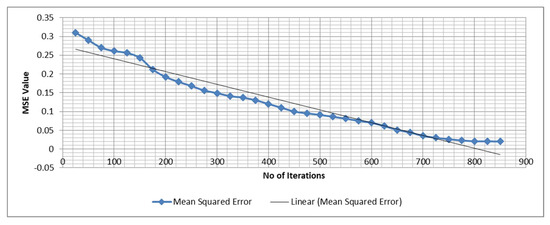
Figure 9.
The quadratic error of the network.
4.3. Results and Discussion
It is necessary to research the sensitivity and specificity of the diagnostic procedures currently used in the medical field. In the jargon of algorithm design, the ability of an algorithm to differentiate between accurate positive results and erroneous positive results is referred to as its “sensitivity”. When determining how comprehensive a person’s judgment is, one additional metric to consider is that person’s ability to detect true negatives often. The classification techniques covered in this article provided results that were both true negatives and true positives, as may be seen here, and the confusion matrix is presented in Table 2.
Table 2.
Confusion matrix for the CNN.
According to the results for the tested dataset, the algorithm was able to correctly recognize 852 occurrences, whereas it incorrectly labeled 166 instances. This information was gleaned from the dataset. Consequently, an algorithm was developed that had an accuracy of 84.8% and a sensitivity of 79.5%. In addition, the approach achieved a specificity of 90.6% and a precision of 90.5%. A graphical representation of the findings is provided in Figure 10 below.
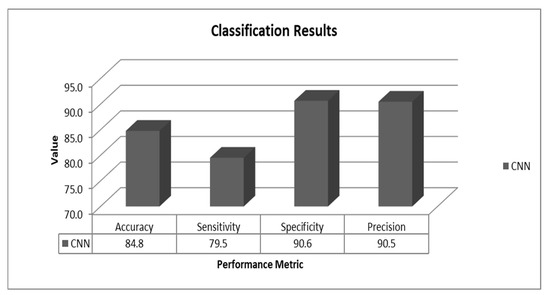
Figure 10.
Results for the proposed method.
4.4. Comparison of Results
The findings were compared to those that were acquired using the most cutting-edge approaches reported in the academic literature. Table 3 overviews the many methods that may be applied. As a direct consequence of these findings, the CNN (Luna Challenge) in 2016 [41] and Setio et al. (2017) [42] both accomplished an accuracy rate of 82.7%. Zou et al. (2019) [43] obtained an accuracy of 78.4% using the same dataset for their CNN experiment, but they did so using a different technique. The accuracy of these discoveries was compared to those obtained by a matching algorithm (CNN) on the same dataset, which was found to have significantly improved.
Table 3.
Comparison of results.
5. Discussion of Experimental Findings
This work contributes to a better knowledge of how a CNN algorithm may contribute to accurately categorizing lung nodules from CT images. The following conclusions were drawn from the experiments carried out as part of this research.
- The classification accuracy is affected by various algorithm factors, notably patch size, hidden layer nodes, and architectural decisions regarding the CNN.
- Optimizing the CNN architecture to obtain the highest possible accuracy in classification is vital.
- It is possible to reduce false positives by iteratively training the CNN algorithm. In addition, using a training set comprising both unseen true and false positives is of great assistance in reducing the number of false positives to an acceptable level.
- Optimization of the CNN relies on parameters such as the dropout value, the activation function, the number of convolutional layers, and the number of max pooling layers.
- Observation of the distribution of the dataset is necessary for both the statistical analysis and the machine learning-based categorization of lung nodules. Adjusting the voxel size is one of the steps that should be taken to optimize the learning advantage while simultaneously lowering the MSE (the patch size option should be utilized). Significant nodules may be missed if a smaller patch size is used instead of a larger one. If, on the other hand, a considerable number were selected for the patch size, the tiny nodule threshold would not be taken into consideration.
- During the process of detecting lung nodules, it is essential to give careful consideration to both the patch size and the threshold value to achieve the highest achievable level of classification precision.
6. Conclusions
The study’s LIDC and IDRI archive of CT scan images might be used to locate lung nodules. The LIDC collection includes 1018 photographs featuring various nodule sizes and backdrops. This material is available to the general public and is considered in the public domain. It is essential to have an understanding of the characteristics of the images inside a dataset that may be used to recognize lung nodules in photographs. For training and testing, the dataset was partitioned into subgroups. The CNN module that was utilized to classify the lung nodule consisted of five tests. These tests evaluated various algorithmic parameters to obtain the highest possible sensitivity. The architecture finally chosen for use was the one that had the most significant level of sensitivity. The selected algorithm had a sensitivity score of 79.3 out of 100. After that, training was repeated on the algorithm, using testing data as input to evaluate its effectiveness. According to the findings, the suggested design achieved the highest possible level of accuracy—84.8%—when automated feature selection was used for the classification process. During the performance review process, in addition to accuracy, additional variables were monitored. The finished CNN algorithm has an accuracy of 84.8%, a precision of 90.47%, and a specificity of 90.64%. These values are all relatively close to one another. As a consequence, one may say that the proposed CNN can reduce the number of false positives via repeated in-depth training.
7. Future Work
The proposed method uses a single dataset (LIDC/IDRI) that includes images and nodule sizes of various shapes and sizes and solely uses the CNN algorithm. As a result, following the offered instructions will enable this method to proceed. In the future, this work might be strengthened by making use of more significant and diversified datasets, as well as by using a range of deep learning classifiers. The algorithm may be independently assessed in three- and two-dimensional forms. Future research may develop a universal technique for the most precise classification of lung nodules. The results of this study may be compared with those from earlier real-time investigations for a more thorough understanding of lung nodule detection methods.
Author Contributions
Conceptualization, I.H. and M.M.K.; methodology, I.H.; software, I.H., M.A.M. and T.M.; validation, I.H. and T.M.; formal analysis, I.H. and T.K.; investigation, I.H, T.M. and M.A.M.; resources, I.U.; Data curation, T.M., M.A.M. and T.K.; Writing—original draft preparation, I.H.; Writing—review and editing, I.H., I.U. and H.H.; visualization, I.U. and M.H.; supervision, I.U. and H.H.; project administration, I.U., H.H. and M.H.; funding acquisition, H.H. and M.H. All authors have read and agreed to the published version of the manuscript.
Funding
This research was funded by Princess Nourah bint Abdulrahman University Researchers Supporting Project number (PNURSP2022R125), Princess Nourah bint Abdulrahman University, Riyadh, Saudi Arabia.
Institutional Review Board Statement
Not applicable.
Informed Consent Statement
Not applicable.
Data Availability Statement
Not applicable.
Acknowledgments
This research was funded by Princess Nourah bint Abdulrahman University Researchers Supporting Project number (PNURSP2022R125), Princess Nourah bint Abdulrahman University, Riyadh, Saudi Arabia.
Conflicts of Interest
The authors declare no conflict of interest.
References
- Healthline. Lung (Pulmonary) Nodules: Symptoms, Causes, and Treatment. August 2022. Available online: https://www.healthline.com/health/lung-cancer/lung-nodule#causes-and-risk-factors (accessed on 23 November 2022).
- Today, M.N. Lung Nodule. 29 November 2021. Available online: https://www.medicalnewstoday.com/articles/317531 (accessed on 23 November 2022).
- Tufail, A.B.; Ma, Y.K.; Kaabar, M.K.; Martínez, F.; Junejo, A.R.; Ullah, I.; Khan, R. Deep learning in cancer diagnosis and prognosis prediction: A minireview on challenges, recent trends, and future directions. Comput. Math. Methods Med. 2021, 2021, 9025470. [Google Scholar] [CrossRef] [PubMed]
- Khan, R.; Yang, Q.; Ullah, I.; Rehman, A.U.; Tufail, A.B.; Noor, A.; Rehman, A.; Cengiz, K. 3D convolutional neural networks based automatic modulation classification in the presence of channel noise. IET Commun. 2022, 16, 497–509. [Google Scholar] [CrossRef]
- Tufail, A.B.; Ma, Y.K.; Zhang, Q.N.; Khan, A.; Zhao, L.; Yang, Q.; Adeel, M.; Khan, R.; Ullah, I. 3D convolutional neural networks-based multiclass classification of Alzheimer’s and Parkinson’s diseases using PET and SPECT neuroimaging modalities. Brain Inform. 2021, 8, 1–9. [Google Scholar] [CrossRef] [PubMed]
- Gu, Y.; Lu, X.; Zhang, B.; Zhao, Y.; Yu, D.; Gao, L.; Cui, G.; Wu, L.; Zhou, T. Automatic lung nodule detection using multi-scale dot nodule-enhancement filter and weighted support vector machines in chest computed tomography. PLoS ONE 2019, 14, e0210551. [Google Scholar] [CrossRef] [PubMed]
- Teramoto, A.; Fujita, H. Automated lung nodule detection using positron emission tomography/computed tomography. In Artificial Intelligence in Decision Support Systems for Diagnosis in Medical Imaging; Springer: Berlin/Heidelberg, Germany, 2018; pp. 87–110. [Google Scholar]
- Siddiqui, E.A.; Chourasia, V.; Shandilya, M.; Patel, V. Computed Tomography Image Processing Methods for Lung Nodule Detection and Classification: A Review. In Data, Engineering and Applications; Lecture Notes in Electrical Engineering; Sharma, S., Peng, S.L., Agrawal, J., Shukla, R.K., Le, D.N., Eds.; Springer: Singapore, 2022; Volume 907. [Google Scholar] [CrossRef]
- Zhang, G.; Jiang, S.; Yang, Z.; Gong, L.; Ma, X.; Zhou, Z.; Bao, C.; Liu, Q. Automatic nodule detection for lung cancer in CT images: A review. Comput. Biol. Med. 2018, 103, 287–300. [Google Scholar] [CrossRef]
- Abrar, A.; Rajpoot, P. “Classification and Detection of Lung Cancer Nodule using Deep Learning of CT Scan Images”: A Systematic Review. 2022. Available online: https://assets.researchsquare.com/files/rs-2145172/v1/2a94278e-c16b-4346-ae89-3042ca2fb409.pdf?c=1666567759 (accessed on 25 November 2022).
- Tufail, A.B.; Ullah, I.; Khan, R.; Ali, L.; Yousaf, A.; Rehman, A.U.; Alhakami, W.; Hamam, H.; Cheikhrouhou, O.; Ma, Y.K. Recognition of Ziziphus lotus through Aerial Imaging and Deep Transfer Learning Approach. Mob. Inf. Syst. 2021, 2021, 4310321. [Google Scholar] [CrossRef]
- Ahmad, I.; Ullah, I.; Khan, W.U.; Ur Rehman, A.; Adrees, M.S.; Saleem, M.Q.; Cheikhrouhou, O.; Hamam, H.; Shafiq, M. Efficient algorithms for E-healthcare to solve multiobject fuse detection problem. J. Healthc. Eng. 2021, 2021, 9500304. [Google Scholar] [CrossRef]
- Tufail, A.B.; Anwar, N.; Othman, M.T.; Ullah, I.; Khan, R.A.; Ma, Y.K.; Adhikari, D.; Rehman, A.U.; Shafiq, M.; Hamam, H. Early-stage Alzheimer’s disease categorization using PET neuroimaging modality and convolutional neural networks in the 2D and 3D domains. Sensors 2022, 22, 4609. [Google Scholar] [CrossRef]
- Ahmed, I.; Chehri, A.; Jeon, G.; Piccialli, F. Automated pulmonary nodule classification and detection using deep learning architectures. IEEE/ACM Trans. Comput. Biol. Bioinform. 2022, 1–12. [Google Scholar] [CrossRef]
- Agnes, S.A.; Anitha, J.; Solomon, A.A. Two-stage lung nodule detection framework using enhanced UNet and convolutional LSTM networks in CT images. Comput. Biol. Med. 2022, 149, 106059. [Google Scholar] [CrossRef]
- Rodrigues, M.B.; Da Nobrega, R.V.M.; Alves, S.S.A.; Rebouças Filho, P.P.; Duarte, J.B.F.; Sangaiah, A.K.; De Albuquerque, V.H.C. Health of things algorithms for malignancy level classification of lung nodules. IEEE Access 2018, 6, 18592–18601. [Google Scholar] [CrossRef]
- Kumar, D.; Wong, A.; Clausi, D.A. Lung nodule classification using deep features in CT images. In Proceedings of the 2015 12th Conference on Computer and Robot Vision, Halifax, NS, Canada, 3–5 June 2015; pp. 133–138. [Google Scholar]
- Aresta, G.; Cunha, A.; Campilho, A. Detection of juxta-pleural lung nodules in computed tomography images. In Proceedings of the Medical Imaging 2017: Computer-Aided Diagnosis, Orlando, FL, USA, 3 March 2017; pp. 952–958. [Google Scholar]
- Ahmad, S.; Ullah, T.; Ahmad, I.; Al-Sharabi, A.; Ullah, K.; Khan, R.A.; Rasheed, S.; Ullah, I.; Uddin, M.; Ali, M. A novel hybrid deep learning model for metastatic cancer detection. Comput. Intell. Neurosci. 2022, 2022, 8141530. [Google Scholar] [CrossRef] [PubMed]
- Tufail, A.B.; Ullah, K.; Khan, R.A.; Shakir, M.; Khan, M.A.; Ullah, I.; Ma, Y.K.; Ali, M. On Improved 3D-CNN-Based Binary and Multiclass Classification of Alzheimer’s Disease Using Neuroimaging Modalities and Data Augmentation Methods. J. Healthc. Eng. 2022, 2022, 1302170. [Google Scholar] [CrossRef] [PubMed]
- Nakrani, M.G.; Sable, G.S.; Shinde, U.B. Lung Nodule Detection from Computed Tomography Images Using Stacked Deep Convolutional Neural Network. In Intelligent Systems, Technologies and Applications; Springer: Singapore, 2021; pp. 237–246. [Google Scholar]
- Hamidian, S.; Sahiner, B.; Petrick, N.; Pezeshk, A. 3D convolutional neural network for automatic detection of lung nodules in chest CT. In Proceedings of the Medical Imaging 2017: Computer-Aided Diagnosis, Orlando, FL, USA, 3 March 2017; pp. 54–59. [Google Scholar]
- Sun, L.; Wang, Z.; Pu, H.; Yuan, G.; Guo, L.; Pu, T.; Peng, Z. Attention-embedded complementary-stream CNN for false positive reduction in pulmonary nodule detection. Comput. Biol. Med. 2021, 133, 104357. [Google Scholar] [CrossRef]
- Singadkar, G.; Mahajan, A.; Thakur, M.; Talbar, S. Automatic lung segmentation for the inclusion of juxtapleural nodules and pulmonary vessels using curvature based border correction. J. King Saud Univ. Comput. Inf. Sci. 2021, 33, 975–987. [Google Scholar] [CrossRef]
- Eisapour Moghaddam, A.; Akbarizadeh, G.; Kaabi, H. Automatic detection and segmentation of blood vessels and pulmonary nodules based on a line tracking method and generalized linear regression model. Signal Image Video Process. 2019, 13, 457–464. [Google Scholar] [CrossRef]
- Choi, W.-J.; Choi, T.-S. Automated pulmonary nodule detection based on three-dimensional shape-based feature descriptor. Comput. Methods Programs Biomed. 2014, 113, 37–54. [Google Scholar] [CrossRef]
- de Sousa Costa, R.W.; da Silva, G.L.F.; de Carvalho Filho, A.O.; Silva, A.C.; de Paiva, A.C.; Gattass, M. Classification of malignant and benign lung nodules using taxonomic diversity index and phylogenetic distance. Med. Biol. Eng. Comput. 2018, 56, 2125–2136. [Google Scholar] [CrossRef]
- Kasinathan, G.; Jayakumar, S.; Gandomi, A.H.; Ramachandran, M.; Fong, S.J.; Patan, R. Automated 3-D lung tumor detection and classification by an active contour model and CNN classifier. Expert Syst. Appl. 2019, 134, 112–119. [Google Scholar] [CrossRef]
- Gong, L.; Jiang, S.; Yang, Z.; Zhang, G.; Wang, L. Automated pulmonary nodule detection in CT images using 3D deep squeeze-and-excitation networks. Int. J. Comput. Assist. Radiol. Surg. 2019, 14, 1969–1979. [Google Scholar] [CrossRef]
- Karkra, S.; Patel, J.K.B. Multi-atlas Segmentation: Label Propagation and Fusion Based Approach. In Advances in Computer Communication and Computational Sciences; Springer: Singapore, 2019; pp. 323–335. [Google Scholar]
- Sharp, G.C. Introduction to Multi-Atlas Auto-Segmentation. In Auto-Segmentation for Radiation Oncology; CRC Press: Boca Raton, FL, USA, 2021; pp. 13–18. [Google Scholar]
- Zuo, W.; Zhou, F.; He, Y.; Li, X. Automatic classification of lung nodule candidates based on a novel 3D convolution network and knowledge transferred from a 2D network. Med. Phys. 2019, 46, 5499–5513. [Google Scholar] [CrossRef] [PubMed]
- Spadea, M.F.; Pileggi, G.; Zaffino, P.; Salome, P.; Catana, C.; Izquierdo-Garcia, D.; Amato, F.; Seco, J. Deep convolution neural network (DCNN) multiplane approach to synthetic CT generation from MR images—Application in brain proton therapy. Int. J. Radiat. Oncol. Biol. Phys. 2019, 105, 495–503. [Google Scholar] [CrossRef] [PubMed]
- Shenoy, A.T.; Wasserman, G.A.; Arafa, E.I.; Wooten, A.K.; Smith, N.; Martin, I.; Jones, M.R.; Quinton, L.J.; Mizgerd, J.P. Lung CD4+ resident memory T cells remodel epithelial responses to accelerate neutrophil recruitment during pneumonia. Mucosal Immunol. 2020, 13, 334–343. [Google Scholar] [CrossRef] [PubMed]
- Hossain, M.D.; Chen, D. Segmentation for Object-Based Image Analysis (OBIA): A review of algorithms and challenges from remote sensing perspective. ISPRS J. Photogramm. Remote Sens. 2019, 150, 115–134. [Google Scholar] [CrossRef]
- Wong, J.F.; Mohan, M.D.; Young, E.W.; Simmons, C.A. Integrated electrochemical measurement of endothelial permeability in a 3D hydrogel-based microfluidic vascular model. Biosens. Bioelectron. 2020, 147, 111757. [Google Scholar] [CrossRef] [PubMed]
- Tufail, A.B.; Ullah, I.; Khan, W.U.; Asif, M.; Ahmad, I.; Ma, Y.K.; Khan, R.; Ali, M. Diagnosis of diabetic retinopathy through retinal fundus images and 3D convolutional neural networks with limited number of samples. Wirel. Commun. Mob. Comput. 2021, 2021, 6013448. [Google Scholar] [CrossRef]
- Yousafzai, B.K.; Khan, S.A.; Rahman, T.; Khan, I.; Ullah, I.; Ur Rehman, A.; Baz, M.; Hamam, H.; Cheikhrouhou, O. Student-performulator: Student academic performance using hybrid deep neural network. Sustainability 2021, 13, 9775. [Google Scholar] [CrossRef]
- Tufail, A.B.; Ullah, I.; Rehman, A.U.; Khan, R.A.; Khan, M.A.; Ma, Y.-K.; Hussain Khokhar, N.; Sadiq, M.T.; Khan, R.; Shafiq, M.; et al. On Disharmony in Batch Normalization and Dropout Methods for Early Categorization of Alzheimer’s Disease. Sustainability 2022, 14, 14695. [Google Scholar] [CrossRef]
- Khairuzzaman, A.K.M.; Chaudhury, S. Multilevel thresholding using grey wolf optimizer for image segmentation. Expert Syst. Appl. 2017, 86, 64–76. [Google Scholar] [CrossRef]
- Lessmann, N.; Išgum, I.; Setio, A.A.; de Vos, B.D.; Ciompi, F.; de Jong, P.A.; Oudkerk, M.; Willem, P.T.M.; Viergever, M.A.; van Ginneken, B. Deep convolutional neural networks for automatic coronary calcium scoring in a screening study with low-dose chest CT. In Proceedings of the Medical Imaging 2016: Computer-Aided Diagnosis, San Diego, CA, USA, 24 March 2016; pp. 255–260. [Google Scholar]
- Setio, A.A.A.; Traverso, A.; De Bel, T.; Berens, M.S.; Van Den Bogaard, C.; Cerello, P.; Chen, H.; Dou, Q.; Fantacci, M.E.; Geurts, B. Validation, comparison, and combination of algorithms for automatic detection of pulmonary nodules in computed tomography images: The LUNA16 challenge. Med. Image Anal. 2017, 42, 1–13. [Google Scholar] [CrossRef]
- Gao, Z.; Wang, X.; Yang, Y.; Mu, C.; Cai, Q.; Dang, W.; Zuo, S. EEG-based spatio–temporal convolutional neural network for driver fatigue evaluation. IEEE Trans. Neural Netw. Learn. Syst. 2019, 30, 2755–2763. [Google Scholar] [CrossRef] [PubMed]


Publisher’s Note: MDPI stays neutral with regard to jurisdictional claims in published maps and institutional affiliations. |
© 2022 by the authors. Licensee MDPI, Basel, Switzerland. This article is an open access article distributed under the terms and conditions of the Creative Commons Attribution (CC BY) license (https://creativecommons.org/licenses/by/4.0/).