3.1. Behavior of Granular Materials During the Gyratory Shearing Compaction
Figure 2 shows us the general behavior of granular materials during gyratory shearing compactions. Before compaction happens, the granular assembly is in a loosely packed state, where the initial packing fraction is around 0.51 and the initial porosity is approximately 0.49. After the gyratory compaction starts,
Figure 2a shows that the gyratory compaction of granular materials can be roughly classified into two stages: (i) At the beginning of the compaction, the solid fraction increases rapidly from a loosely, randomly packed solid fraction to a randomly packed fraction, and we can witness a swift decrease in the porosity of the granular system. (ii) Afterwards, the solid fraction exceeds the randomly packed fraction and has logarithmic growth with respect to time. Between these two stages, there is a seemingly intermediate stage where the slope of the curve is slightly smaller than that in the logarithmic growth region. However, the second stage can be further divided into sub-stages when we change other variables, such as the viscosity of the interstitial fluid.
The detailed explanations of the
relationships with respect to different gyratory speeds, different fluid viscosities, and different pressures will be presented in the following sections. However, we ought to explain the way we normalize the parameters. The solid fraction,
, is dimensionless, but the compaction time,
t, is dimensional. Without knowing the characteristic time scale associated with the gyratory compaction scenario, we initially non-dimensionalize
t with a time factor of
, where
g is the gravitational acceleration and
is the average particle diameter. In this way, the dimensionless time becomes
Based on the general behavior of the
relationships, in the gyratory shearing compaction of a granular system, particles may undergo two distinct types of motion, as illustrated in
Figure 3. Initially, particles experience shearing, characterized by the relative displacement of one layer over another. The temporal scale of this shearing motion is inversely proportional to the shear rate,
, and can be expressed as
. Secondly, particles are subject to a relaxation effect, where the application of confining pressure facilitates the compression of particles from one layer into another, thereby increasing the density of the granular assembly. The temporal scale of this relaxation process is related to the grain diameter,
d; the confining pressure,
; and the particle density,
and can be quantified as
, where
is the mean particle diameter. When an interstitial fluid is present, and its viscosity,
, governs the behavior of the granular–fluid system, the temporal scale of motion can be represented as
.
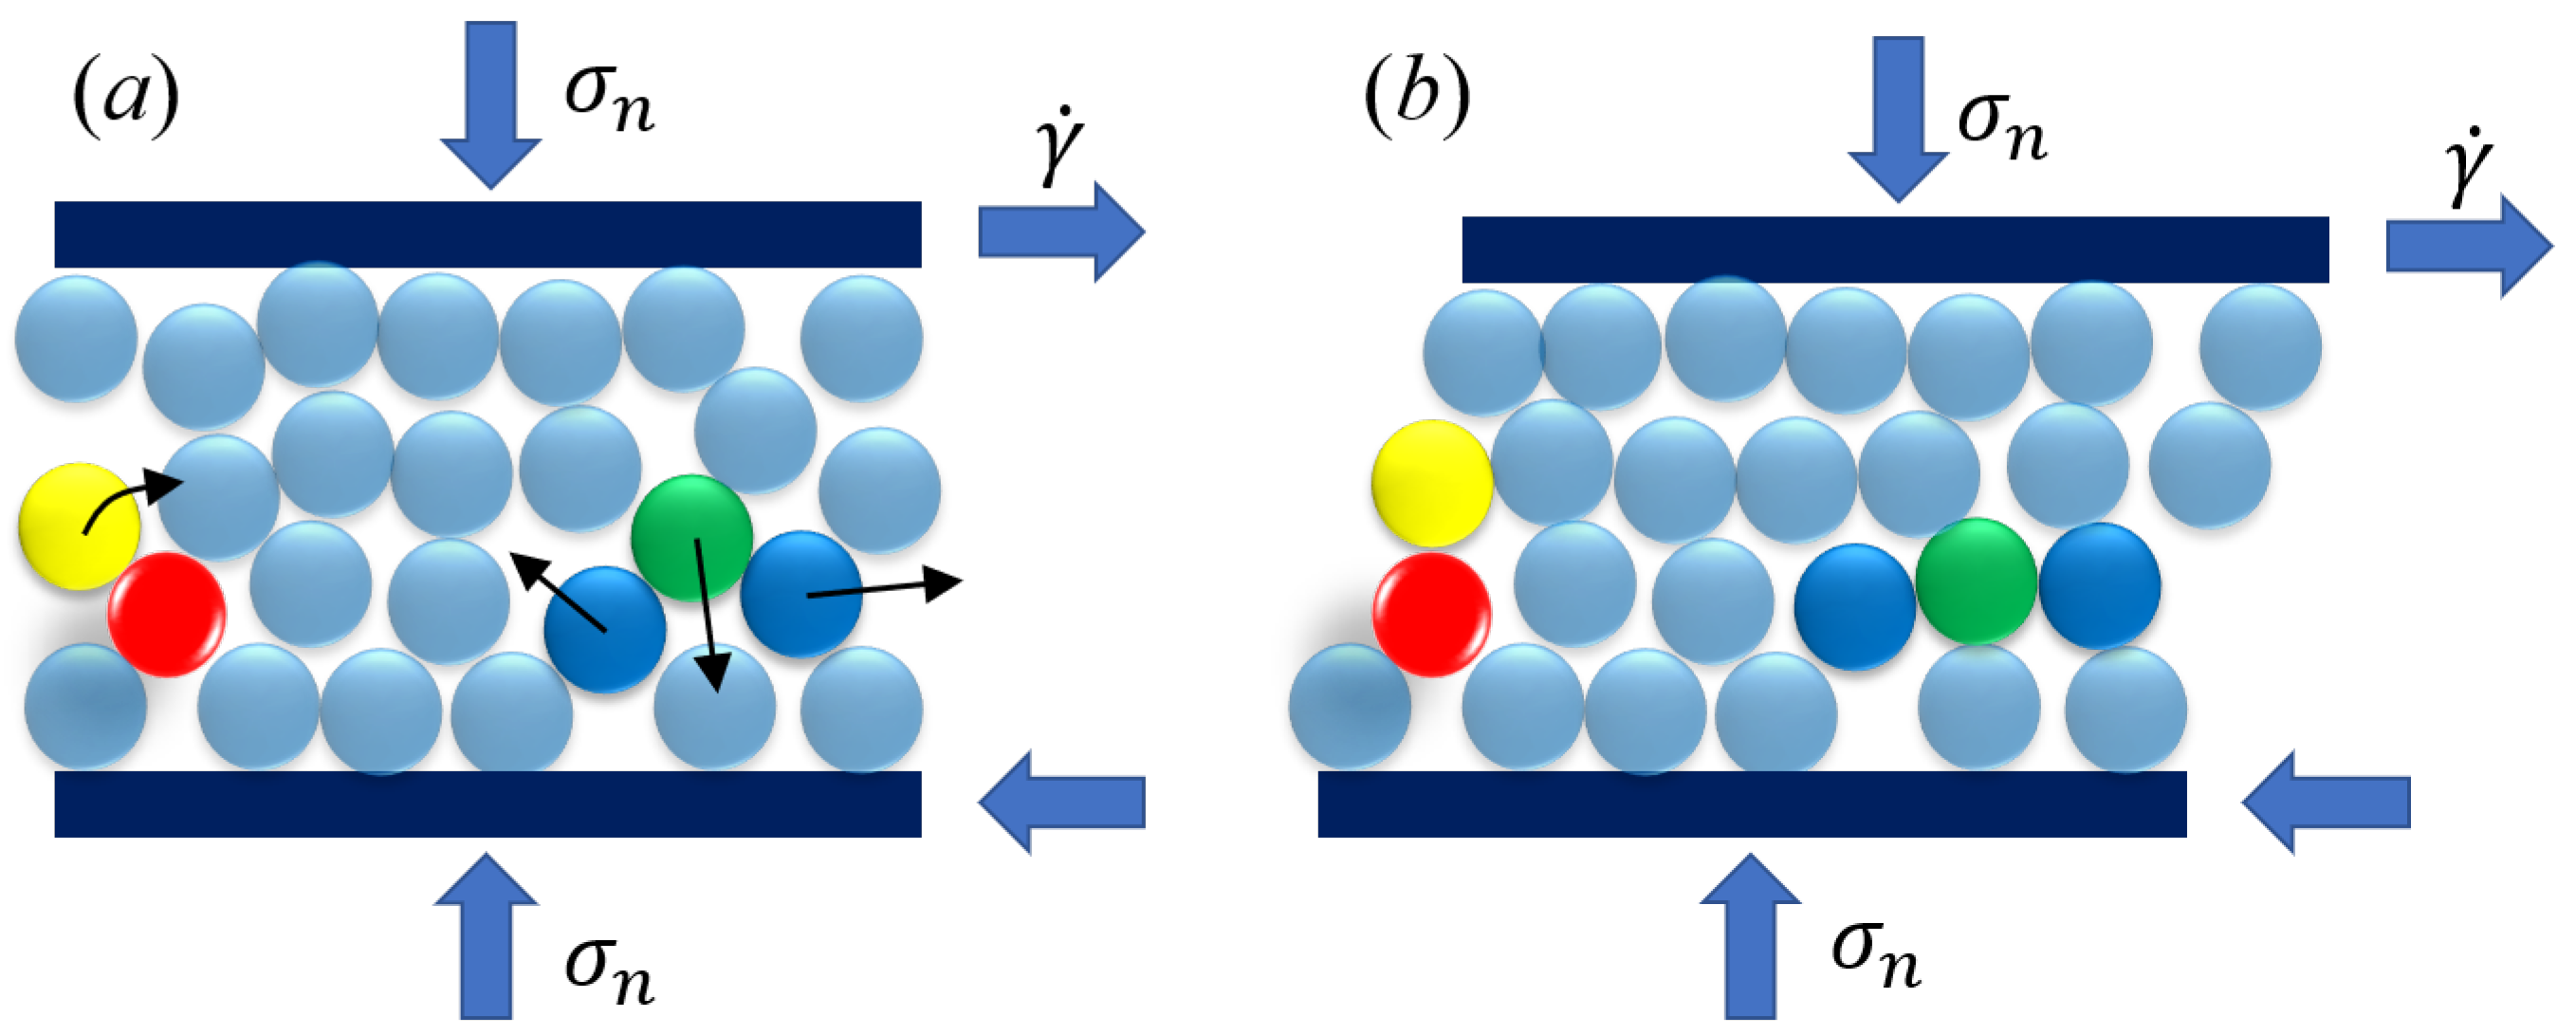
Figure 3 provides a detailed depiction of the particle motions associated with these two types of granular behavior. Under the influence of both normal stress,
, and shear rate,
, particles exhibit complex interactions. For instance, the shearing effect causes a yellow particle to slide over a red particle in a sub-layer, increasing its height and contributing to the dilation of the system. Conversely, a green particle is compressed to fill the void between two blue particles, promoting a denser state of the system. During gyratory shearing compaction, these two types of particle motions counterbalance each other, ultimately leading to a condensed state of the granular assembly. We note that, although
Figure 3 is shown in a two-dimensional manner, the gyratory compaction is always three-dimensional, as shown in
Figure 1.
3.2. Influence of Gyratory Speed and the Viscosity of Interstitial Fluid
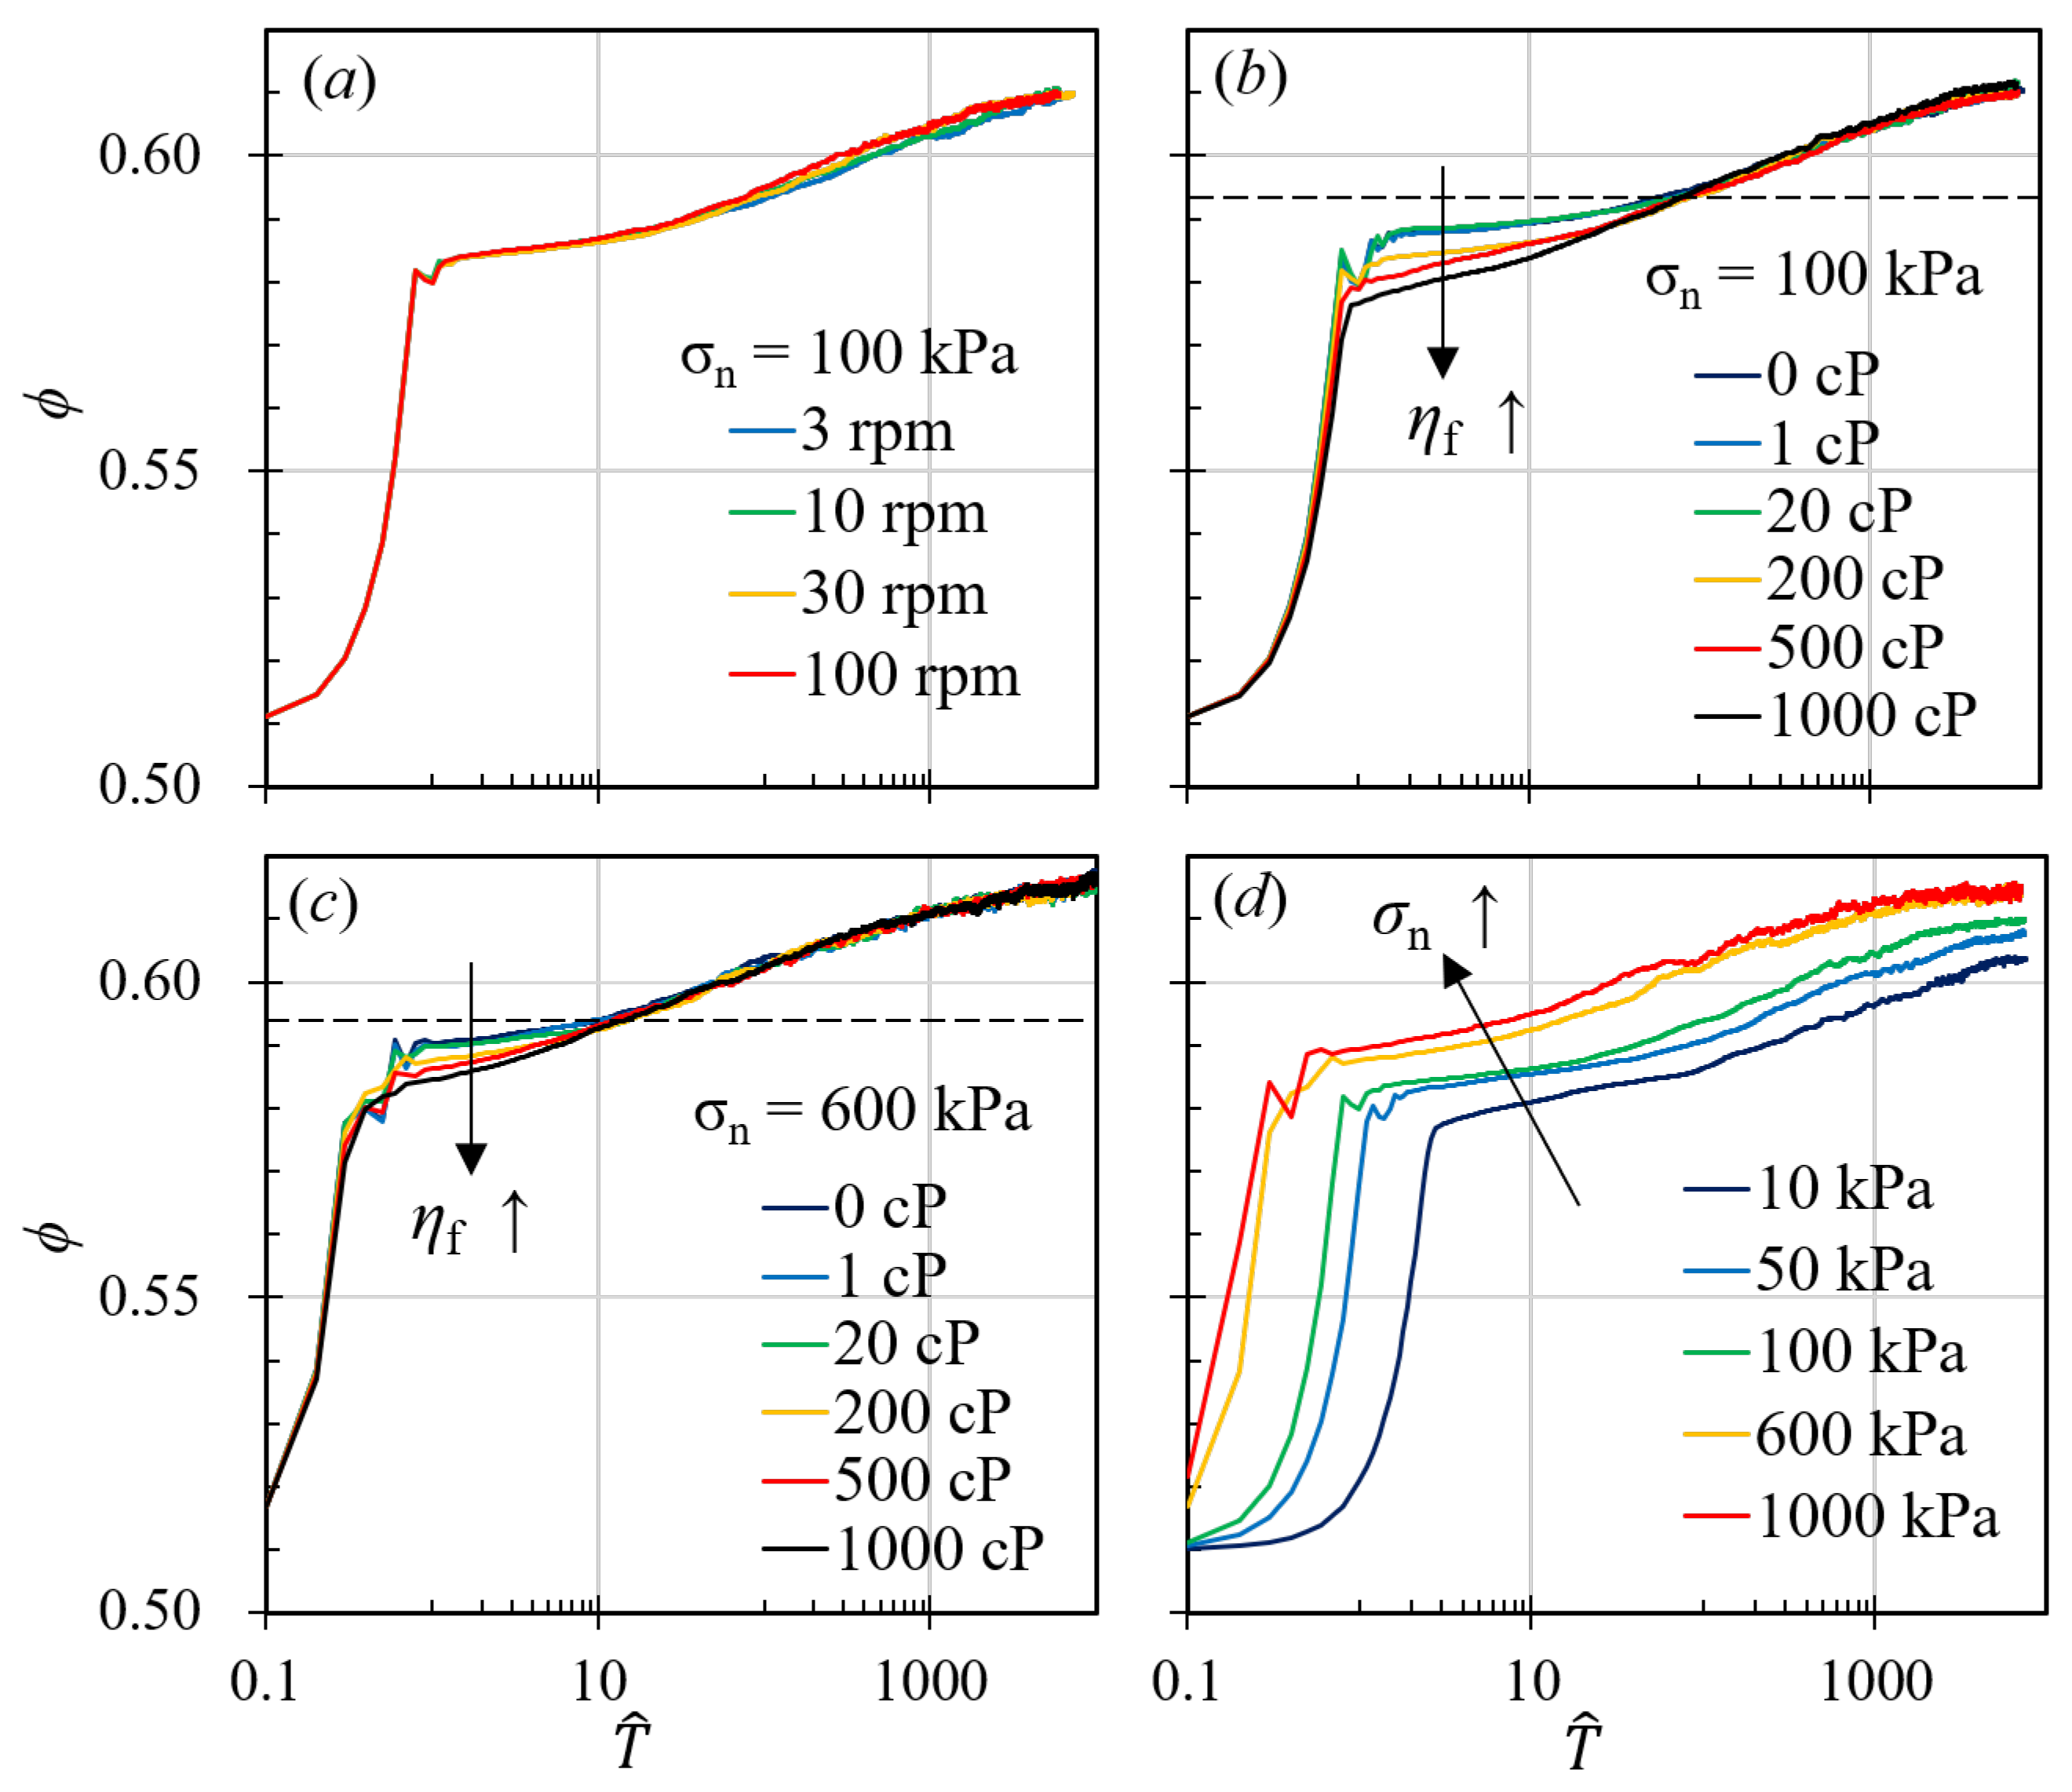
Figure 2a illustrates the compaction curves for granular materials subjected to various gyratory speeds while maintaining a constant pressure of 100 kPa and interstitial fluid viscosity of 100 cP. The curves delineate the relationship between the solid fraction,
, and the normalized time,
, as introduced in the previous section, where
represents the average particle radius, calculated as
, and
is the average particle diameter. Previous studies have indicated that cyclic shearing significantly affects the compaction behavior of granular systems. In contrast, our research, as depicted in
Figure 2a, demonstrates that alterations in gyratory speed, which correspond to changes in the average shear rate, do not substantially influence the overall compaction dynamics.
Figure 2a shows that, when we keep the compaction pressure and the interstitial fluid viscosity constant, changing the gyratory speed alone has no effects on the
curve. All four curves shown in
Figure 2a have exactly the same behavior: at the beginning of the compaction, the granular systems go through the same rapid compaction period, where the solid fraction grows rapidly from approximately 0.51 to approximately 0.56, after which, systems with different gyratory speeds experience the same slow compaction period, as the solid fraction increase from 0.58 to almost 0.61. In other word, the porosities of systems with different gyratory speeds decrease from 0.49 to 0.42 and then to 0.39 in exactly the same manner.
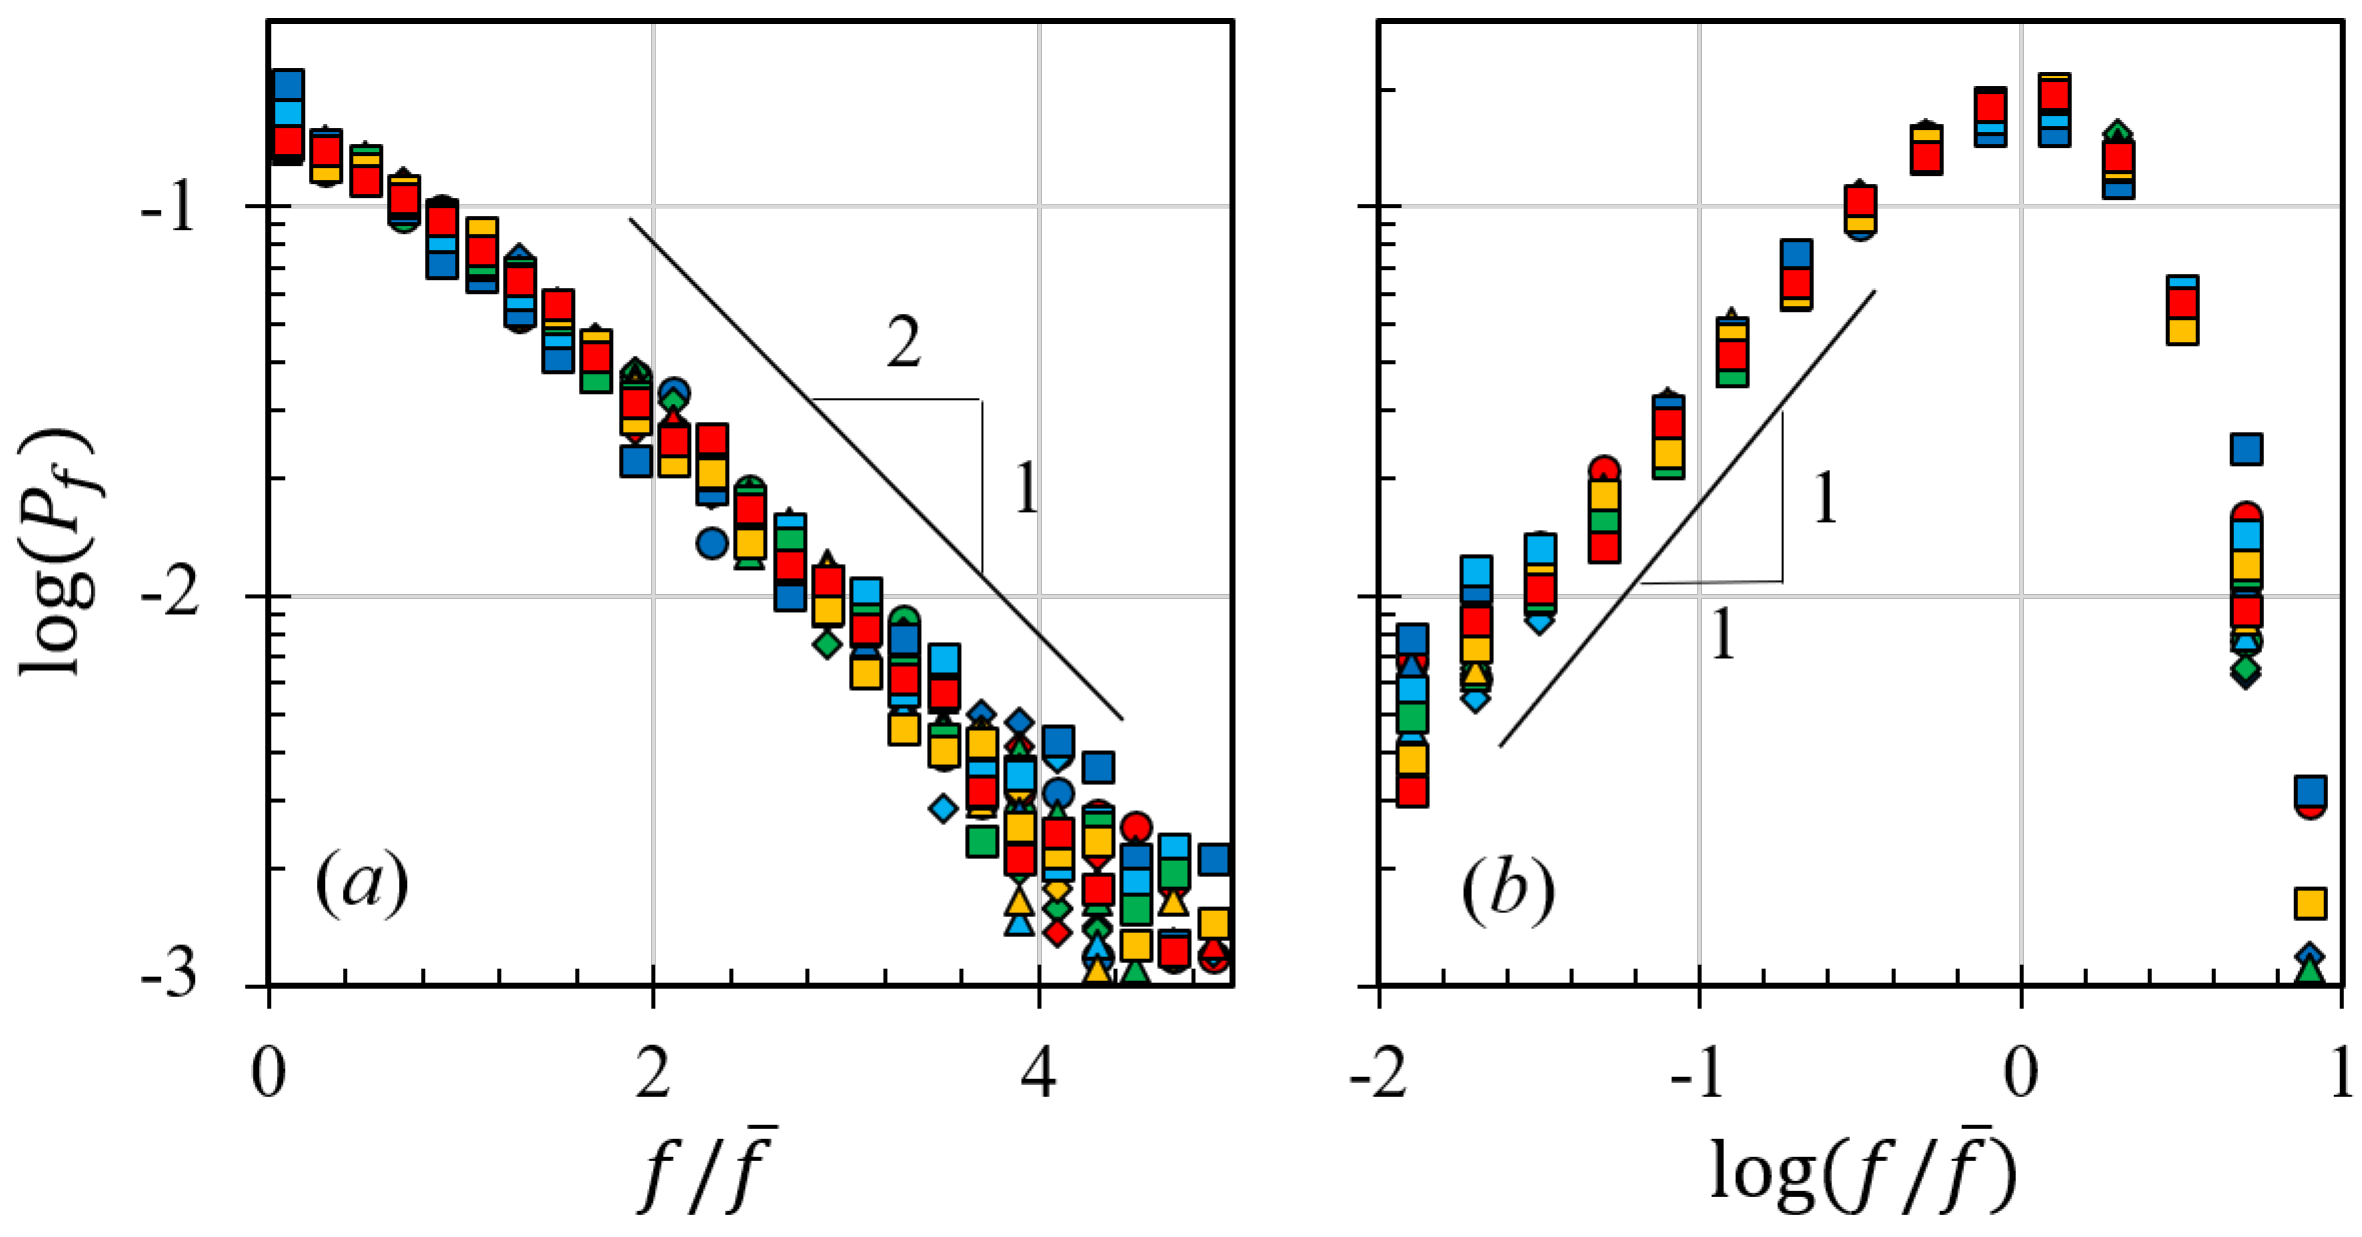
Furthermore, the gyratory speed appears to have no significant effect on the statistical behavior of the granular materials, as shown in
Figure 4. In
Figure 4, we plot the histograms of the ratio between the contact forces among particles,
f, and the mean contact force,
, where the circles with different colors represent the simulation results of systems with different gyratory speeds. As we can see from this figure, the probability density function of
is insensitive to the change of gyratory speeds.The figure reveals that the distribution of normalized contact forces exhibits an exponential decay for forces
f exceeding the mean contact force
(shown in the right figure) and a power-law tail for forces below the mean (shown in the left figure). We can conclude that the functional form of the force probability distribution in a gyratory shearing compaction of a granular system is the same as that in a sand pile, where
when
, and
when
.
and
seem to be affected by the compaction pressure, which will be discussed in
Section 3.3.
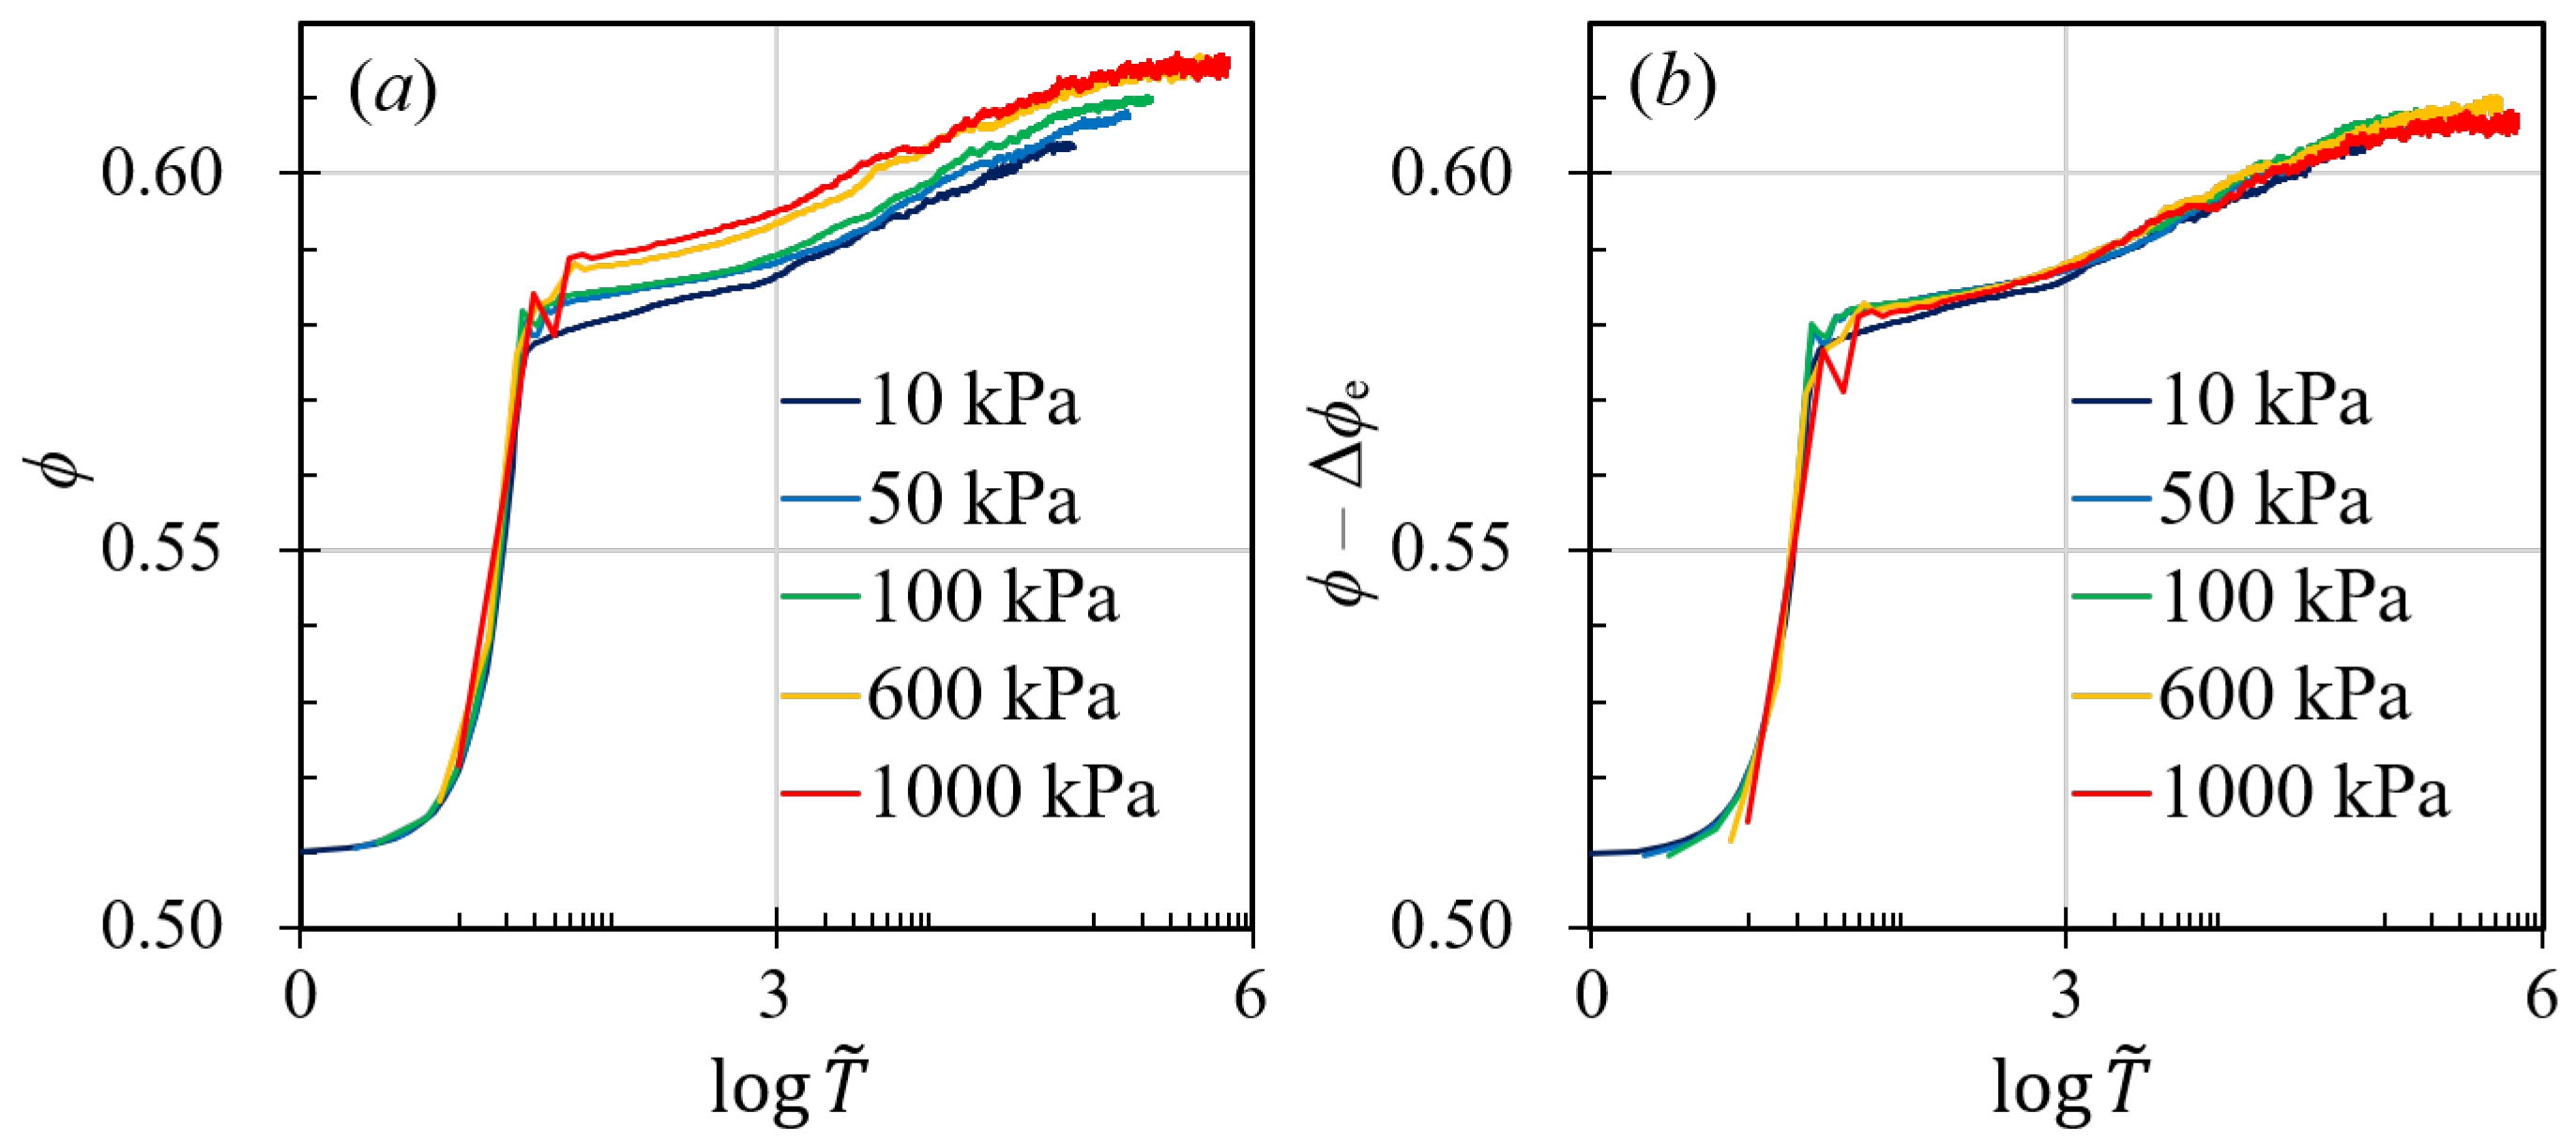
We also examine the impact of interstitial fluid viscosity, presenting results from two sets of simulations in
Figure 2b,c. In one set (
Figure 2b), we hold the pressure and gyratory speed constant at 100 kPa and 30 rpm and vary the viscosity from 0 cP to 1000 cP. Although one might intuitively expect a significant influence of interstitial fluid viscosity on compaction behavior, as suggested by Fiscina et al. [
21], our findings indicate that the presence of interstitial fluid primarily affects the intermediate stages of gyratory compaction.
Figure 2b shows the relationship between
and
for systems with different interstitial fluid viscosities,
. It shows that when
is large, the system will directly transition from the rapid compaction phase to the logarithmic growth phase. However, decreasing
results in a larger solid fraction at the end of the rapid compaction phase while introducing a plateau of the solid fraction. For example, at the end of the rapid compaction stage, the system with
cP has a solid fraction of roughly 0.575 (or porosity of 0.425), while the system with
cP reaches a solid fraction of approximately 0.59. This indicates that the viscosity of the interstitial fluid may hinder the compaction process, but, eventually, after the plateau, the influence of
will diminish.
Similarly in
Figure 2c, we plot the relationship between the solid fraction,
, and the dimensionless time,
, when the pressure is 600 kPa. Compared to
Figure 2b, the time period where the interstitial fluid has influences (the period of the solid fraction plateau, which can be influenced by
decreases as we increase the confining pressure. In this case, the pressure is much higher (600 kPa, compared to 100 kPa in
Figure 2b), which makes the granular assembly to reach a certain solid fraction much earlier than that in
Figure 2b. Interestingly, the solid fraction which marks the end of interstitial fluid interference is the same for different pressure conditions. When the solid fraction is larger than ≈0.59, the viscosity of the interstitial fluid has almost no effect on the gyratory compaction behavior of the granular materials, no matter how large the viscosity becomes. Meanwhile, this dividing point for the solid fraction happens to be equal to the loose, randomly packed fraction [
22]. Also, Man and Hill [
13,
23] found that, in a granular–fluid system, the frictional rheology (the
relationship) followed two pathways depending on the magnitude of the viscous number
in a shearing system, but these two different pathways merged into one curve at approximately
where fluid viscosity can no longer influence the rheology of the granular materials. Our results in the gyratory compaction also conclude with a 0.59 solid fraction terminating the influence of the interstitial fluids.
Based on the influence of the interstitial fluid viscosity, we can classify the whole gyratory compaction process into three stages: (i) the fast compaction stage, where the solid fraction of the granular system grows rapidly and is unaffected by the change of the fluid viscosity; (ii) the intermediate stage, which is signatured by the obvious influence of fluid viscosities and during which the system solid fraction is usually below 59.5%; (iii) the creeping stage, where the system is compacted in a logarithmic manner until it reaches the jamming solid fraction, beyond which we regard as out of the scope of this work. Meanwhile, similar to the influence of the gyratory speed, changing the viscosity of the interstitial fluid results in negligible influences on the histogram of . This indicates that, in a fully saturated condition and while the system is under gyratory shearing, changing the fluid viscosity does not necessarily alter the contact network.
3.3. The Pressure Influence and the Dominating Time Scale
In contrast to the effects of gyratory speed and interstitial fluid viscosity, altering the pressure on granular packing substantially modifies the compaction behavior. Higher pressures allow granular materials to attain a significantly higher solid fraction and reach a specific solid fraction more swiftly than simulations conducted at lower pressures, as depicted in
Figure 2d. Despite these variations in compaction behavior across different pressures, the statistics of inter-particle forces remain largely unchanged (as illustrated in
Figure 4). If we examine this figure more carefully, we can find that, in the right figure of
Figure 4 and when
, systems with lower pressures exhibit higher probability of establishing weak-force networks. This subtle difference may result in different fluctuation behaviors for systems with different pressure. Since larger fluctuations often lead to smaller solid fractions, smaller compaction pressure inevitably results in smaller
. This observation prompts the question of what drives these alterations in compaction behavior, which our study seeks to answer. Previous research frequently correlates the compaction curve with time scales yet often fails to explore the details or the influencing factors. In our study, we regard the compaction behavior as a consequence of the interplay between the shearing time scale,
; the viscous time scale,
; and the inertial time scale,
, in accordance with the frictional rheology of granular materials [
13,
24,
25].
Upon examining
Figure 2a–c, we can deduce that the impact of interstitial fluid viscosity and gyratory speed is negligible when compared to the inertial effect. Consequently, the compaction curve should be predominantly governed by the inertial time scale,
. By graphing
against the normalized time
, we would expect the compaction curves to converge onto a single trajectory. However, as evidenced in
Figure 5a, the curves diverge post-logarithmic stage. Intriguingly, at identical normalized times
, the slope of the curves remains roughly consistent across various pressure conditions, suggesting that an additional factor is absent from our current analysis.
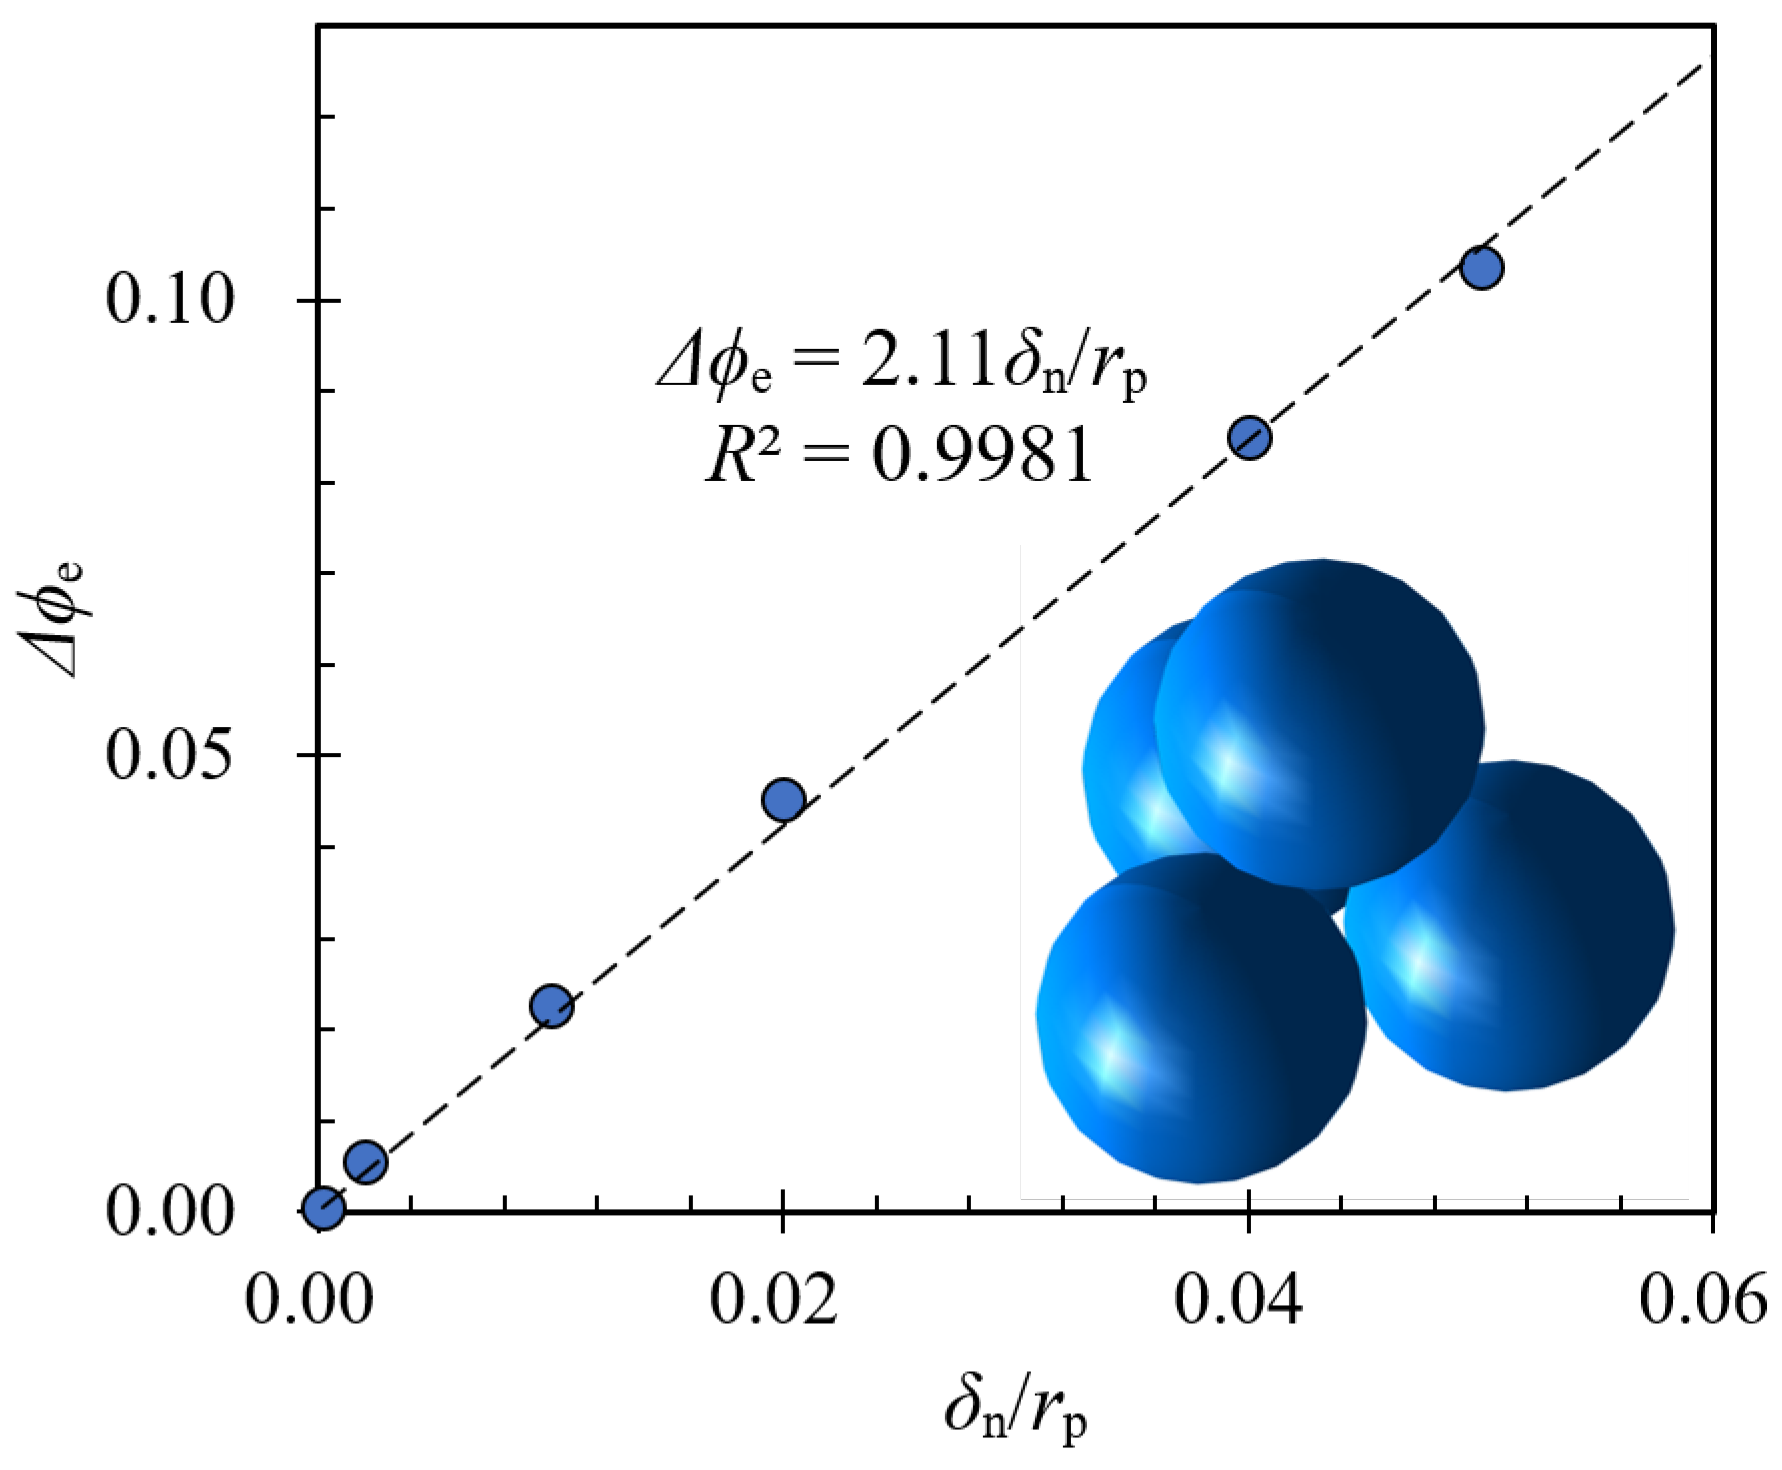
Thus, we divided the compaction into “elastic” compaction and “visco-plastic” compaction. The “elastic” compaction can be calculated based on the solid fraction change of granular packing with the basic hexagonal close packing (HCP) given pressure condition
. In this case, the forces between adjacent particles are
, where
according to the Hertz contact model [
15]. Based on this, we can calculate the elastic deformation
. For a monodispersed granular system, the effective radius
is the same as the particle radius
and the effective elastic modulus
is the same as the particle elastic modulus
. Then, we can rewrite the overlap ratio
as a function of the loading condition in a hexagonal close-packing condition as follows:
Using a Monte Carlo algorithm, we could measure the approximate solid fraction given a contact overlap and calculate the relationship between
and the “elastic” change of the solid fraction and plot the results in
Figure 6, which shows that the elastic contribution of the solid fraction changes scales linearly with respect to the overlap ratio
. With these analyses, we could link the pressure
to the change in solid fraction
. In
Figure 5b, we plotted the relationship between
and
, which shows a good collapse of data among simulations with different pressures. This indicates that the compacted solid fraction of granular systems under gyratory compaction can be written as a combined function of both
and
with the following equation:
where
is the function shown in
Figure 5b, and
is a fitting parameter that comes from the relationship between
and
. The influence of compaction pressure also stems from the force probability distribution presented in
Figure 4, where changing
affects the extreme statistics of
. When
, simulations with smaller pressure have larger chances to experience relatively large contact force. Similarly, when
, simulations with smaller pressure are also more likely to have relatively small contacts. These indicate that low compaction pressure leads to relatively large fluctuations, which may result in a smaller compaction solid fraction.
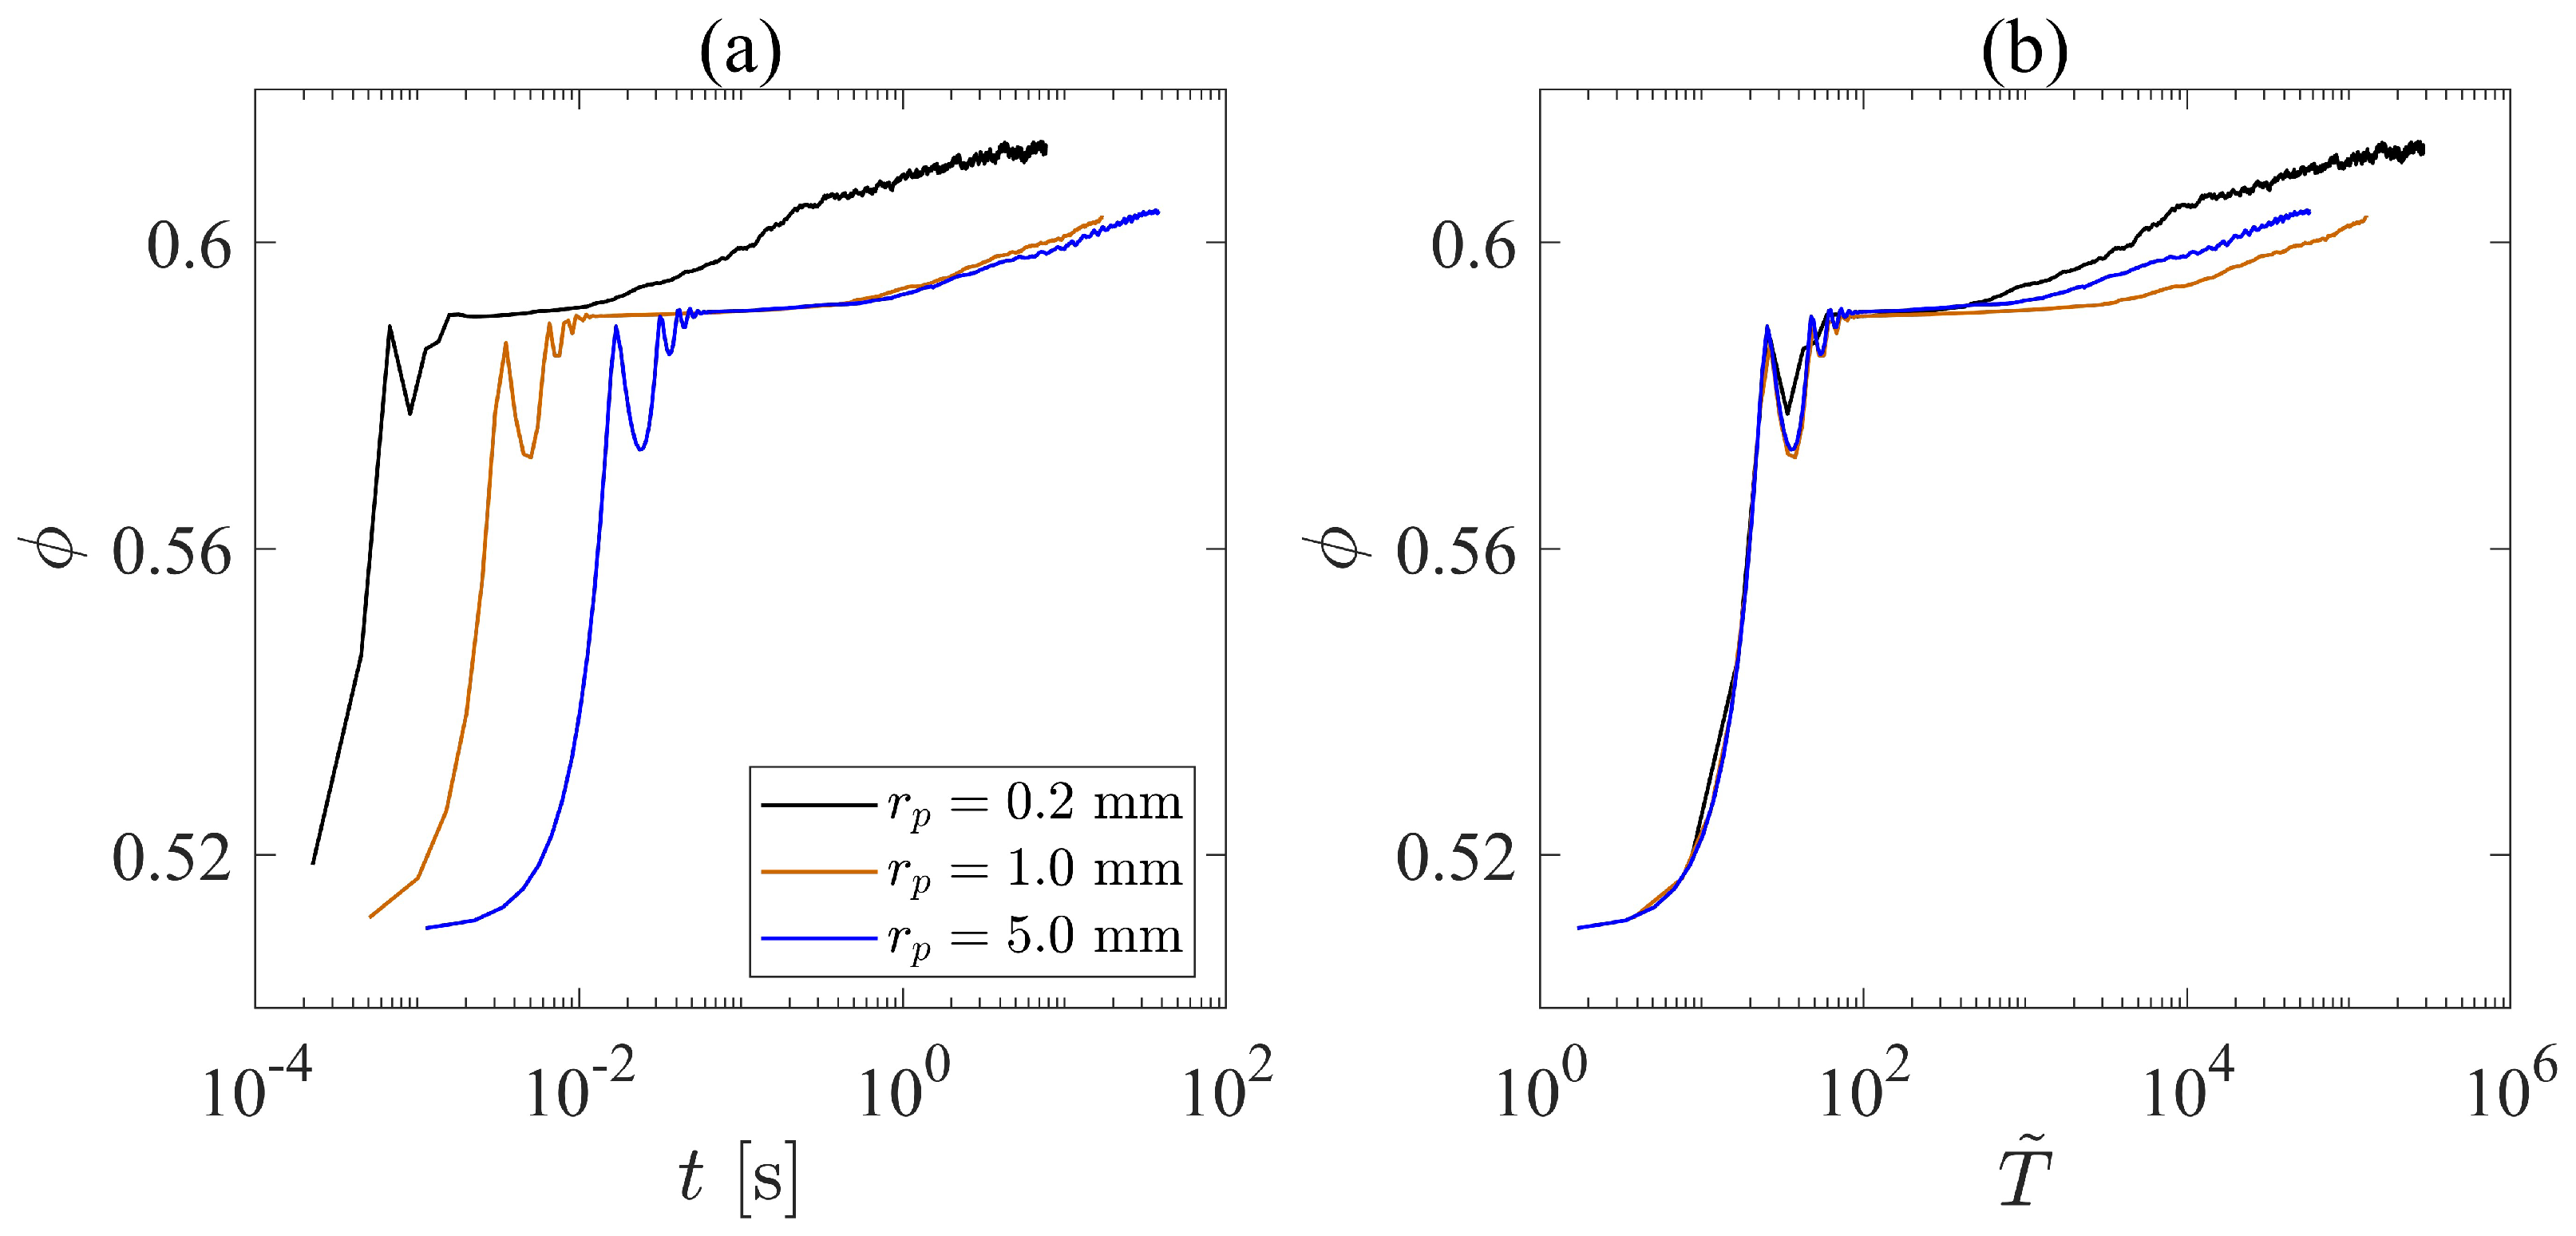
3.4. Influence of Particle Sizes
We have found that the compaction pressure plays a more important role than the viscosity of the interstitial fluid and the gyratory speed, and the time scale, , is the key scaling factor for the gyratory compaction of granular systems. However, we should also investigate the influence the particle size, , as this factor also influences the time scale . In this case, we choose three different particle sizes ( 0.2 cm, 1.0 cm, and 5.0 cm) for our investigation. As we change the particle size, we also change the system size accordingly to ensure that the ratio between the system radius and the particle radius is kept constant. To eliminate the effect of the interstitial fluid, we set the fluid viscosity to 0.
In
Figure 7a, we plot the solid fraction against the real compaction time. We find that, during the rapid compaction stage, three different cases behave similarly. However, the granular system with smaller particle sizes reaches the intermediate stage earlier than the granular system with larger particles, which indicates that it is easier to compact a small-particle granular system than to compact a large-particle granular system. Additionally, the system with
mm reaches the creeping stage much earlier than the other two cases. As we normalize the compaction time
t with the inertial time scale
and plot the results in
Figure 7b, the transition points between the rapid compaction stage and the intermediate stage are unified into one single point, which shows that the transition between these two stages is dominated by the inertial time scale. However, the transition point between the intermediate stage and the creeping stage varies from case to case.
Figure 7b shows that the system with
mm reaches the creeping stage earlier, but the system with
mm comes second, while the granular system with
mm becomes the latest one among the three to reach the creeping stage in terms of the dimensionless time,
. The influence of particle sizes on the transition from the intermediate stage to the creeping stage is apparently complex and non-monotonic. We note that as we change the particle size, we also vary the system size accordingly. Thus, the geometric constraints for the three systems with different
are exactly the same. Since we also keep the material’s Young’s modulus constant, the effective stiffness of the particles varies with the particle size, which may also contribute to the complex behavior of the size-induced compaction difference.
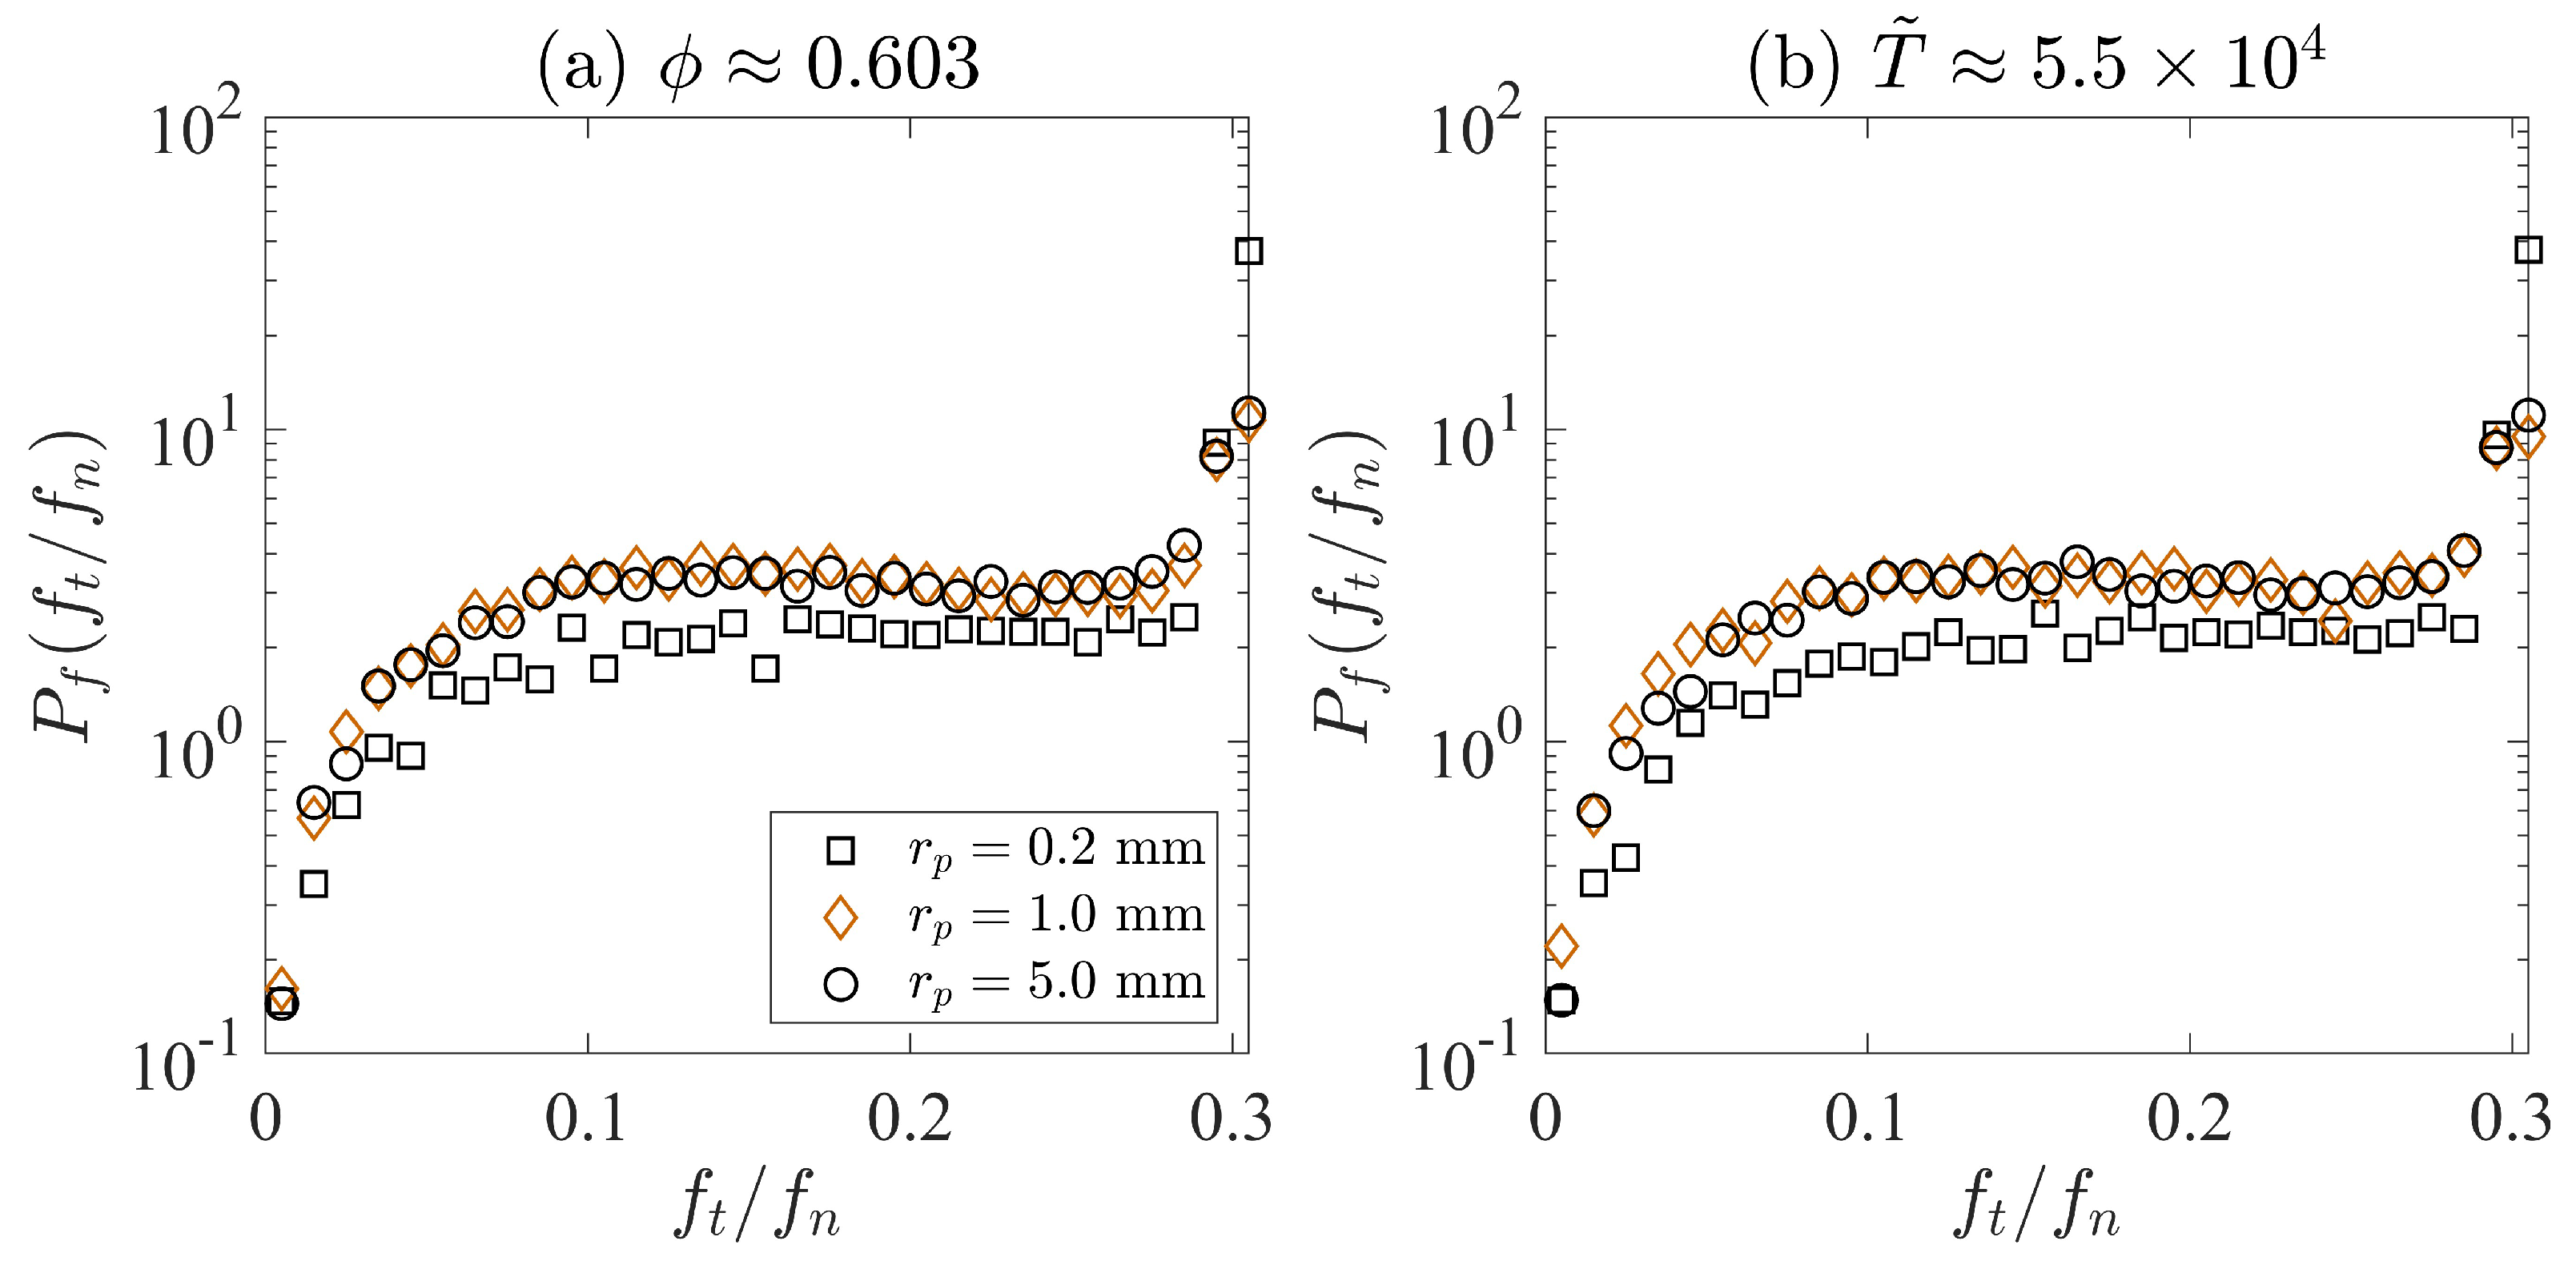
In addition to the influence of the effective stiffness, we argue that the size effect may also be due to the differences in frictional contacts among particles. Systems with more sliding contact lead to easier particle rearrangement, which results in larger solid fractions. Thus, we plot the histogram of the ratio between tangential and normal contact force,
, in
Figure 8. Since we have set the contact frictional coefficient to be 0.3, particles have sliding contact when their
values are approximately equal to 0.3. Two sets of simulation results are examined in this section. In
Figure 8a, we focus on the histograms when three different cases are at the same compacted solid fraction (
0.603), whereas, in
Figure 8, we investigate the histograms when three different simulations are at the same dimensionless time, where
. For
Figure 8a,b, the system with
mm has a larger probability to have
0.3. This indicates that it is easier to find sliding contacts when the particle radius is 0.2 mm. The systems with
mm and
mm have larger probability values for
than the system with
mm, but the difference between the simulations with
mm and
mm is not obvious.
Figure 8 shows that the system with
mm has a slightly larger chance to have sliding contact, which may help improve the compactibility of the system. Detailed investigations on the contact network and particle stiffness are still needed in our future studies.


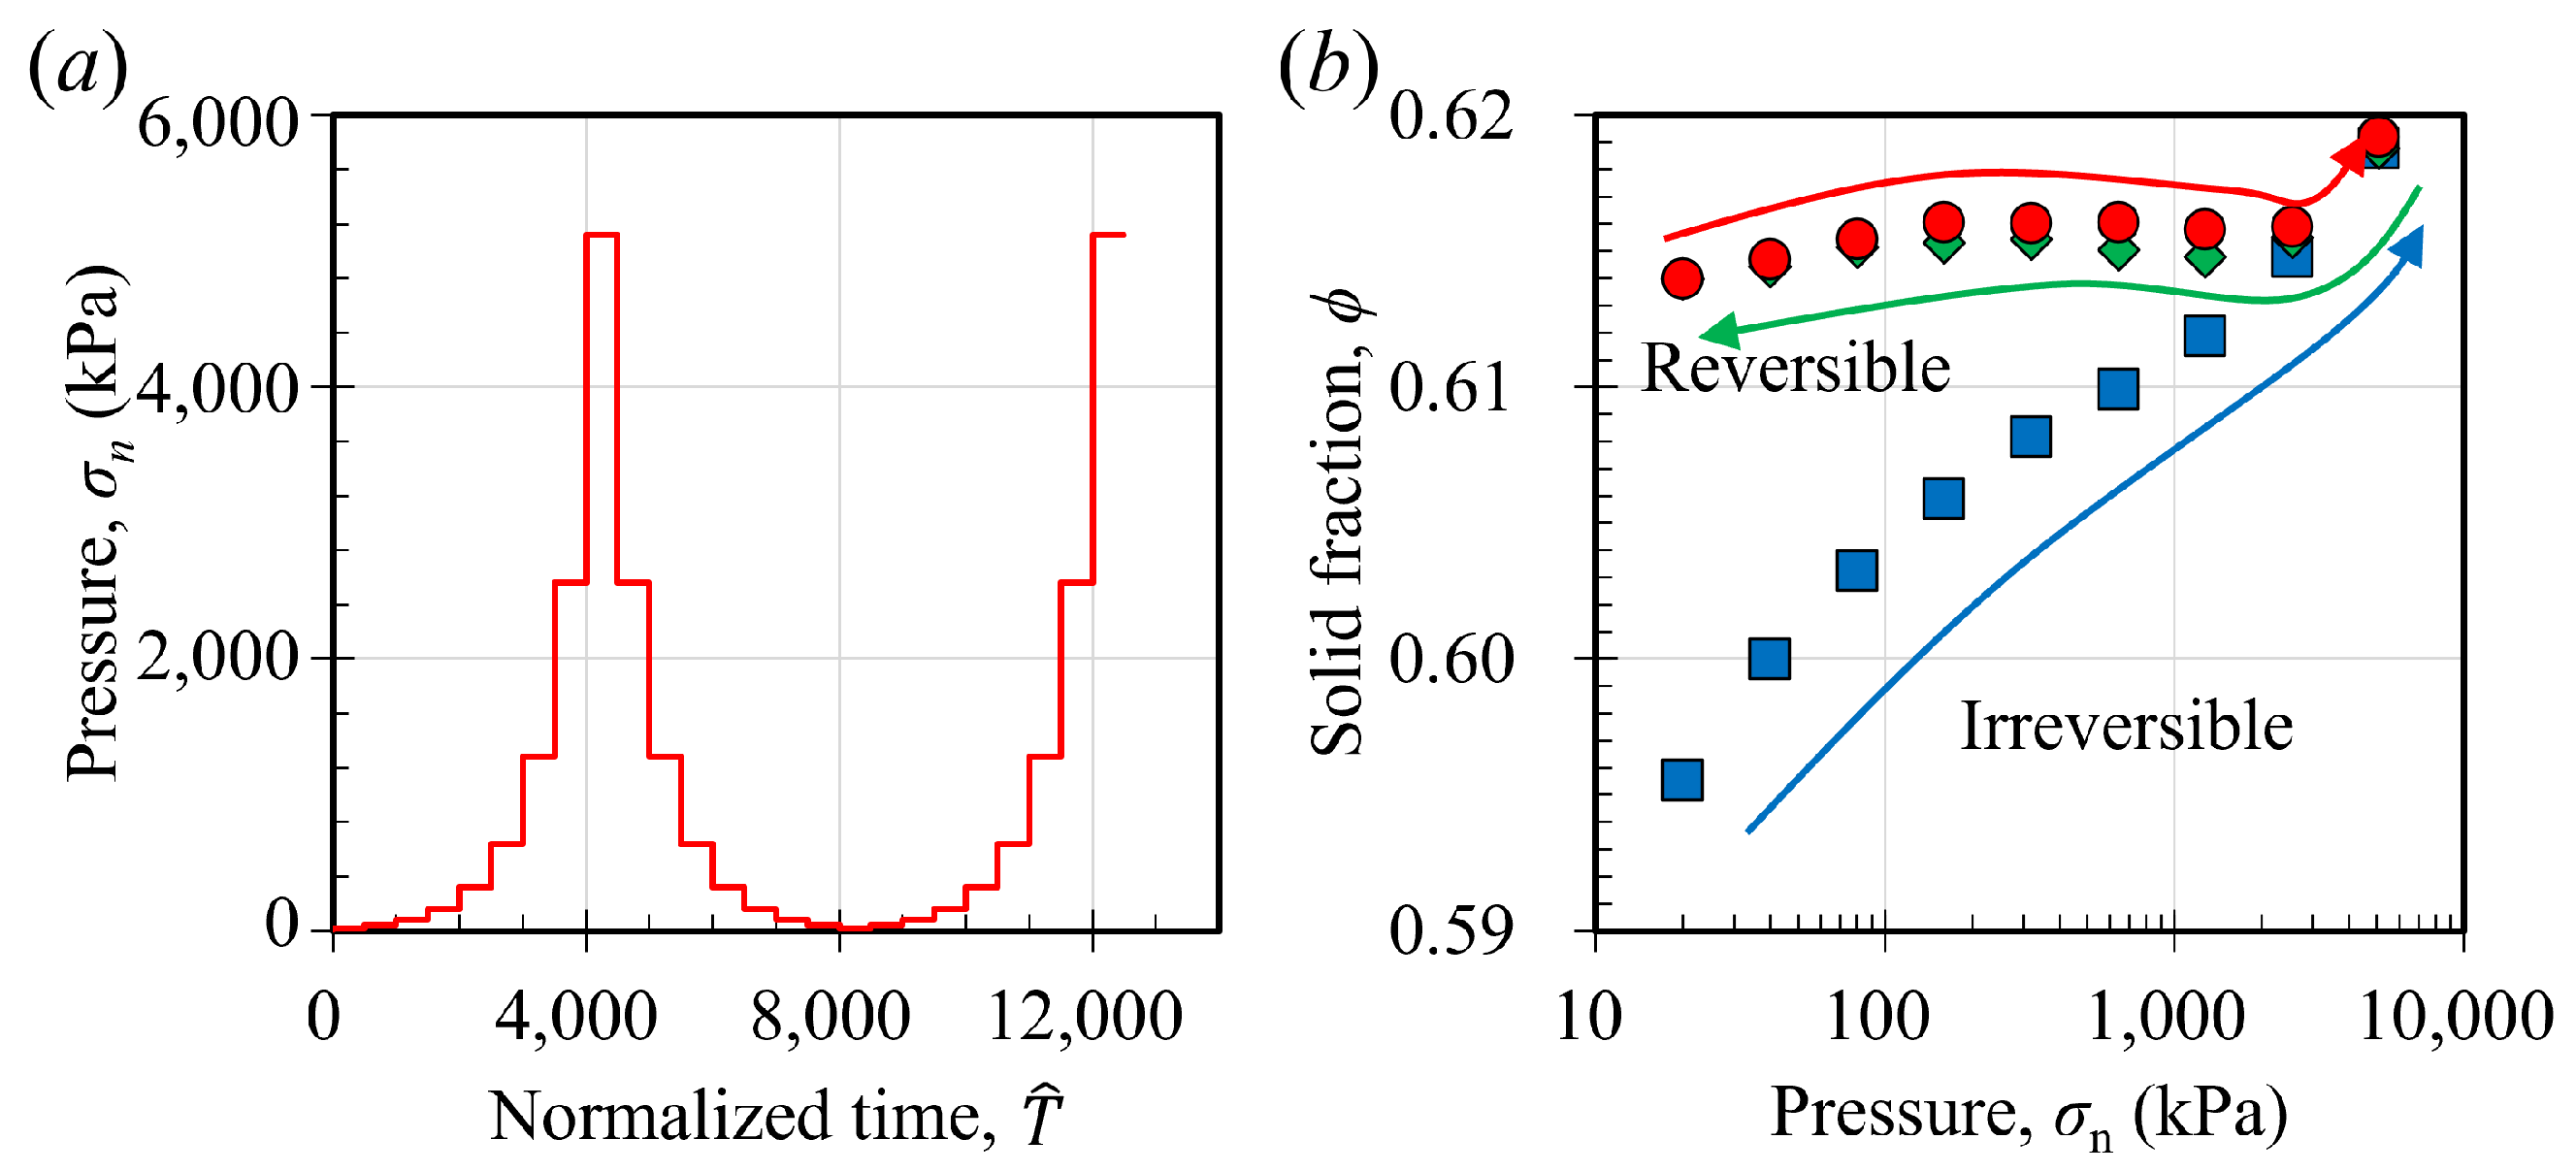
 ), at which point we began a gradual unloading process, decrementing the pressure back to 20 kPa (
 ). Following the unloading phase, we subjected the system to an additional loading cycle, increasing the pressure from 20 kPa to 5120 kPa (
 ) again. We note that the increase in pressure is not in a linear manner but in a logarithmic manner.
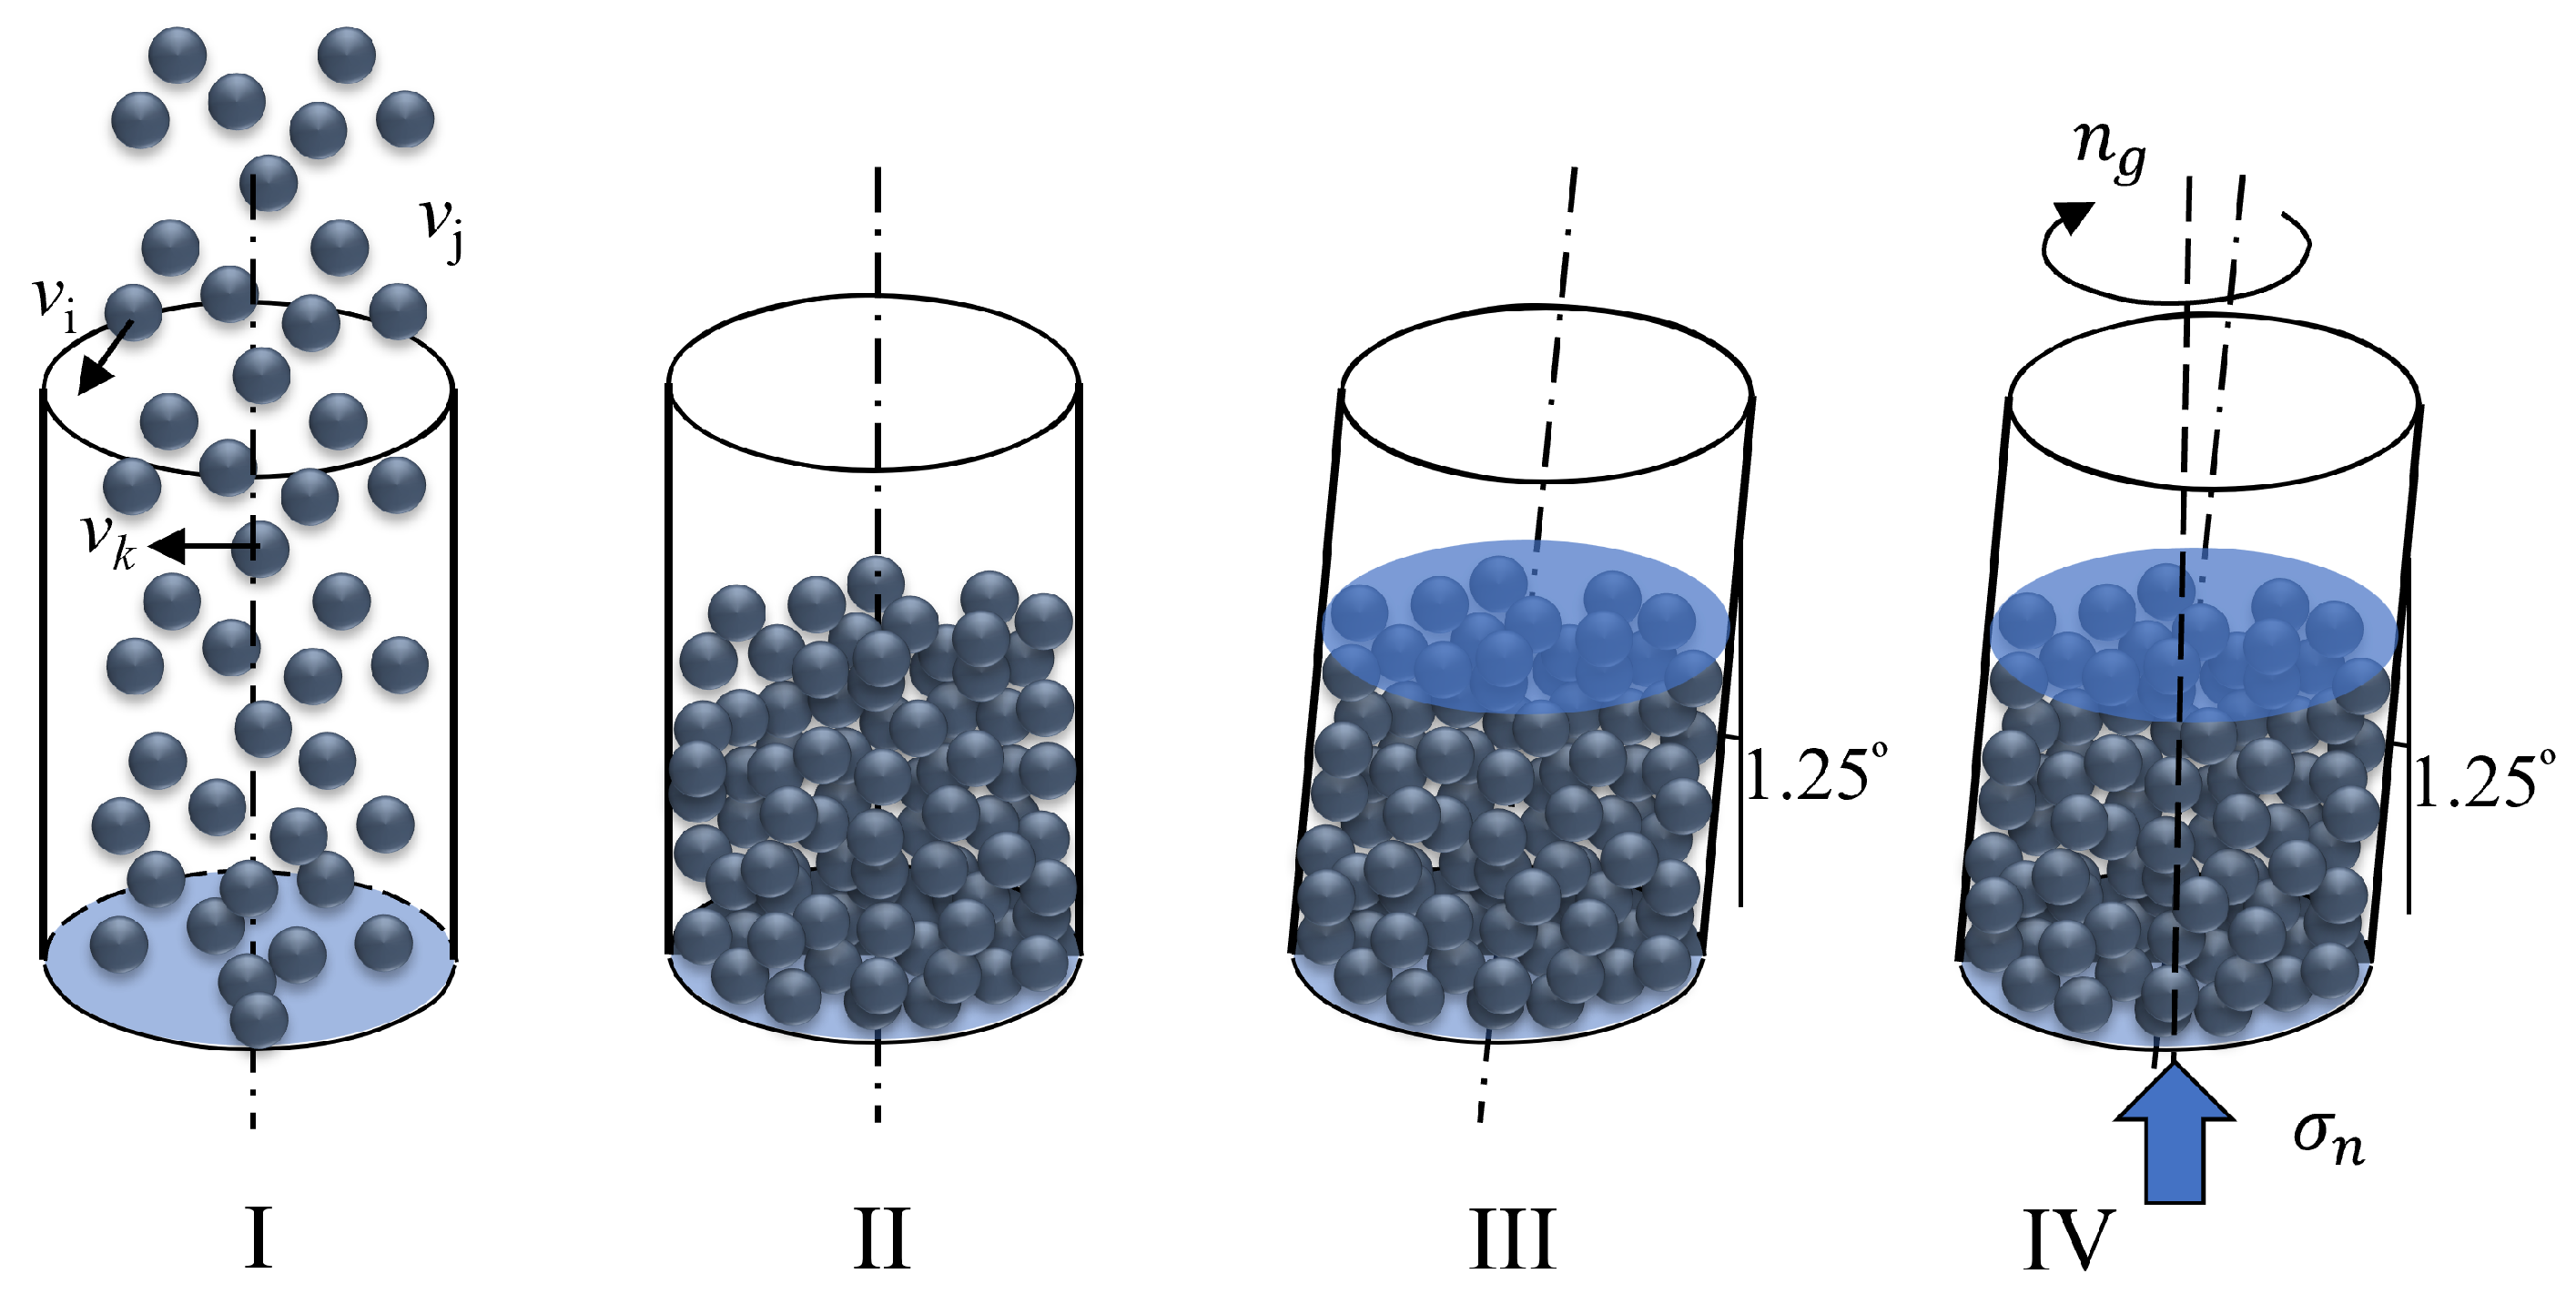
 ,
,  ,
,  ,
,  represent simulation
results of different gyratory speeds.
represent simulation
results of different gyratory speeds.  ,
,  ,
,  ,
,  ,
,  ,
,  represent simulation results of different
viscosity when kPa, while
represent simulation results of different
viscosity when kPa, while  ,
,  ,
,  ,
,  ,
,  ,
,  represent simulation results of different viscosity when kPa.
  ,
,  ,
,  ,
,  ,
,  represent simulation with different pressures.
 ) shows the cases of the change in solid fractions when we increase the pressure from 20 kPa to around 5120 kPa (the first loading process). Marker (
 ) shows the results when we decrease the pressure from 5120 kPa to 20 kPa (the unloading process). Marker (
 ) shows the results when we increase the pressure from 20 kPa to 5120 kPa again (the second loading process).