Article

Deep Red Photoluminescence from Cr3+ in Fluorine-Doped Lithium Aluminate Host Material

1
Applied Chemistry, Chemical Engineering, and Biochemical Engineering, Yamagata University, Yonezawa 992-8510, Japan
2
Center for Crystal Science and Technology, University of Yamanashi, Kofu 400-0021, Japan
3
Faculty of Science, Yamagata University, Yamagata 990-8560, Japan
4
Faculty of Engineering, Shizuoka University, Hamamatsu 432-8561, Japan
5
Research Institute of Electronics, Shizuoka University, Hamamatsu 432-8011, Japan
*
Author to whom correspondence should be addressed.
Materials 2024, 17(2), 338; https://doi.org/10.3390/ma17020338
Submission received: 1 December 2023 / Revised: 25 December 2023 / Accepted: 2 January 2024 / Published: 10 January 2024

Abstract

:
Deep red phosphors have attracted much attention for their applications in lighting, medical diagnosis, health monitoring, agriculture, etc. A new phosphor host material based on fluorine-doped lithium aluminate (ALFO) was proposed and deep red emission from Cr3+ in this host material was demonstrated. Cr3+ in ALFO was excited by blue (~410 nm) and green (~570 nm) rays and covered the deep red to near-infrared region from 650 nm to 900 nm with peaks around 700 nm. ALFO was a fluorine-doped form of the spinel-type compound LiAl5O8 with slightly Li-richer compositions. The composition depended on the preparation conditions, and the contents of Li and F tended to decrease with preparation temperature, such as Al4.69Li1.31F0.28O7.55 at 1100 °C, Al4.73Li1.27F0.17O7.65 at 1200 °C, and Al4.83Li1.17F0.10O7.78 at 1300 °C. The Rietveld analysis revealed that ALFO and LiAl5O8 were isostructural with respect to the spinel-type lattice and in a disorder–order relationship in the arrangement of Li+ and Al3+. The emission peak of Cr3+ in LiAl5O8 resided at 716 nm, while Cr3+ in ALFO showed a rather broad doublet peak with the tops at 708 nm and 716 nm when prepared at 1200 °C. The broad emission peak indicated that the local environment around Cr3+ in ALFO was distorted, which was also supported by electron spin resonance spectra, suggesting that the local environment around Cr3+ in ALFO was more inhomogeneous than expected from the diffraction-based structural analysis. It was demonstrated that even a small amount of dopant (in this case fluorine) could affect the local environment around luminescent centers, and thus the luminescence properties.

1. Introduction

Inorganic phosphors have been widely used in display and lighting applications such as cathode-ray tubes and fluorescent lamps. Conventional phosphors used in these applications are typically excited by high-energy radiation such as X-rays and ultraviolet (UV) rays or electron beams. Recent light-emitting diode (LED) lighting achieves a pseudo-white color by combining blue light emitted from LED chips and the emission of the phosphors excited by the blue light, which has lower energy than X-rays and UV rays.
“Red” is an important color in lighting applications because it has a significant emotional effect on humans, as people unconsciously perceive the warmth of an atmosphere, the state of a person’s health from their complexion, or the freshness of red meat from the color red. Typical rare-earth ions that emit red light are Eu3+ and Eu2+. The former shows orange-red luminescence with a sharp peak around 610 nm due to the 4f-4f transition in some host materials, while the latter, e.g., CaAlSiN3:Eu2+ [1,2,3] and K2CaPO4F:Eu2+ [4], shows a rather broad emission between 600 and 700 nm due to the 5d-4f transition. In recent years, fluorescent materials other than inorganic phosphors, such as polymethine dye molecules, their aggregates and nanoparticles, conjugated polymer nanoparticles, single-walled carbon nanotubes, quantum dots, and lanthanide complex molecules, have also been extensively investigated for emerging applications utilizing near-infrared emission from 700 to 2000 nm, including medical diagnosis, health monitoring, agriculture, and night vision [5,6,7,8].
The 3d transition metal ions, Cr3+, Mn4+, and Fe3+, can act as luminescent centers emitting in the red to deep red region from 640 to 800 nm in suitable host materials due to 3d-3d transitions [9]. The luminescence properties are highly dependent on the combination of the luminescent center ions and the host materials. For example, Mn4+ in K2SiF6 has sharp excitation lines around 450 nm, leading it to be a candidate for a red phosphor for LED lighting [10]. On the other hand, Mn4+ in SrLaAlO4 [11] and SrGdAlO4 [12] is not excited by blue light as it shows the excitation peak in the UV region around 365 nm.
Cr3+ has specifically attracted attention as a luminescent center for near-infrared luminescence. Various compounds, whether natural or synthetic, have been reported as host materials, in which Cr3+ often replaces Al3+ or Ga3+ in the host compounds. The sharp deep red emission around 694 nm of Cr3+ in α-Al2O3 has been utilized for solid-state lasers. Emission of Cr3+ has also been observed in, for example, β-Ga2O3 [13], spinel-type MgAl2O4 [14,15,16], ZnAl2O4 [15,16,17,18], LiAl5O8 [19,20], garnet-type Y3Al5O12 [21,22,23], Gd3Ga5O12 [24], and Gd3Sc2Ga3O12 [22], beryl Be3Al2Si6O18 [25,26], aluminosilicate CaSc1–xAl1+xSiO6 [27], SrAl11.88−xGaxO19 [28], Bi2Ga4O9 [29], La3GaGe5O16 [30], and phosphate KMP2O7 (M = Ga, Sc, In, and Lu) [31]. Cr3+ in these host materials has been considered to occupy octahedral sites. When the strength of the crystal filed is relatively large, such as α-Al2O3 and the spinel-type hosts [14,15,16,17,18,19,20], sharp emission spectra are observed near 700 nm due to the electronic transition from the excited state 2E to the ground state 4A2, while in the host materials with a weak crystal field, such as the garnet-type hosts [21,22,23,24], CaSc1−xAl1+xSiO6 [27], Bi2Ga4O9 [29], and La3GaGe5O16 [30], a red-shifted broad emission is observed due to the spin-allowed 4T24A2 transition.
We have demonstrated different types of deep red luminescence from 650 to 800 nm achieved with a single host material doped with either Mn4+, Fe3+, or Cr3+ [32]. The host material was prepared from LiF and Al2O3 at 1:2, which first appeared in the report by Belov et al. [33], described as “Al4LiO6F” with a spinel-type lattice, assuming a stoichiometric reaction between LiF and two Al2O3. Our previous paper and other researchers referred to this material as Al4LiO6F [34] or LiAl4O6F [35], following Belov’s suggestion. However, the composition of Al4LiO6F does not match the spinel-type composition of AB2O4. In normal spinel, the divalent cation A2+ and the trivalent cation B3+ occupy the tetrahedral and octahedral cation sites in the spinel-type lattice.
In our previous paper [32], we showed that Mn4+ in the host material prepared from LiF and Al2O3 significantly enhanced photoluminescence (PL) compared to spinel-type lithium aluminate LiAl5O8, indicating its potential as a new host material for deep red phosphors. However, the details of the composition and crystal structure had not been clarified. In this paper, we denote this host material as aluminum lithium fluoride oxide (ALFO) and discuss the characteristics of ALFO and the luminescent properties of Cr3+ in ALFO, the luminescent center ion for deep red phosphors which can be excited by visible radiation; this finding will help provide new insights into the design of new phosphor host materials.

2. Materials and Methods

ALFO samples were prepared from LiF and γ-Al2O3; LiF was prepared from lithium hydroxide monohydrate (99%, Kanto Chem. Co., Inc., Tokyo, Japan) and ammonium fluoride (99%, Kanto Chem. Co., Inc.) by precipitation in aqueous solution. The starting aluminum source was aluminum triisopropoxide (>99.9%, Kanto Chem. Co., Inc.); aluminum hydroxide was precipitated at pH 10 in isopropanol solution by NH3 aq. Using Cr(NO3)3·9H2O (98.0–103.0%, Kanto Chem. Co., Inc.) as the starting material, Cr3+ was coprecipitated with aluminum hydroxide in the isopropanol solution. The coprecipitated hydroxide mixture was rinsed with deionized water, heated in a platinum crucible to 1000 °C at a ramp rate of 10 °C/min, and cooled in the furnace to obtain γ-Al2O3:Cr3+. The concentration of Cr3+ was defined as Cr3+/(Al3+ + Cr3+), assuming that it replaced Al3+ in the products. γ-Al2O3:Cr3+ and LiF were weighed at (Al + Cr)/Li = 4 (note that γ-Al2O3 contains a certain amount of water in its composition and that (Al + Cr)/Li in the starting composition could be slightly smaller than 4). Typically, 0.2 g of a mixture of LiF and γ-Al2O3:Cr3+ was placed in a 5 cm3 platinum crucible with a lid. The 5 cm3 platinum crucible was put in a larger platinum crucible (30 cm3) with a lid to suppress volatilization of the components, specifically lithium and fluorine, during heat treatment. Samples were heated at 800–1300 °C at a ramp rate of 20 °C/min. Heating times were 15 min at 1100 °C and above, and 1 h at 800–1000 °C.
For comparison, LiAl5O8:Cr3+ was prepared from Li2CO3 (99%, Kanto Chem. Co., Inc.) and α-Al2O3:Cr3+ at a ratio of Li:(Al + Cr) = 1:5. α-Al2O3 was prepared by heating the Al(OH)3 precipitate at 1200 °C for 2 h in air. The Li and Al sources were thoroughly mixed in an alumina mortar and pressed into pellets. The pellets were heated in an alumina crucible with the inner bottom covered with pre-prepared LiAl5O8 powder to suppress the diffusion of the lithium component from the sample to the alumina crucible.
The chemical compositions of the samples were analyzed for Li, Al, and Cr using inductively coupled plasma-optical emission spectroscopy after the samples were decomposed in molten salt. Fluorine contents were analyzed by ion chromatography after thermal hydrolysis. Oxygen contents were estimated from charge neutrality using the analyzed Al3+, Li+, Cr3+, and F contents. The morphology of the phosphor particles was observed with scanning electron microscopy (SEM) (T-330, JEOL Ltd., Tokyo, Japan and TM3030 plus, Hitachi High-Tech Co., Tokyo, Japan). Carbon was evaporated for conductive coating on the samples.
The crystallographic phases were identified by X-ray diffraction (XRD) using Cu Kα radiation (MiniFlex, Rigaku Co., Tokyo, Japan) operated at 40 kV and 15 mA. The scan step was 0.01°. Structural refinement was carried out by the Rietveld method using Rietan-FP [36]. The crystal structures were illustrated using VESTA [37]. The PL spectra and the photoluminescence excitation (PLE) spectra were measured using a fluorescence spectrometer (FL-6000, Shimadzu Co., Kyoto, Japan) and a multichannel spectral analyzer (PMA-11, Hamamatsu Photonics Co., Hamamatsu, Japan) combined with a lamp and a bandpass filter (MC-570, Asahi Spectra Co. Ltd., Tokyo, Japan) as the excitation light source. Quantum efficiencies (QEs) were evaluated with FL-6000 using an integral sphere. X-band (9.13 GHz) electron spin resonance (ESR) measurements were conducted at room temperature between 0 and 800 mT with 100 kHz magnetic field modulation to detect differences in the local environments around Cr3+ in the different host materials. As an aid for the discussion of the ESR results, classical molecular dynamics (MD) simulations using the MXDORTO code [38] were performed to reproduce the local structures. One Cr3+ ion was introduced into an octahedral site in the MD cell to replace the Al3+ ion, and the MD cell consisted of the crystallographic unit cells with x, y, and z axes of 23–26 Å. The detailed calculation procedure of the MD has already been described in our previous paper [39].

3. Results and Discussion

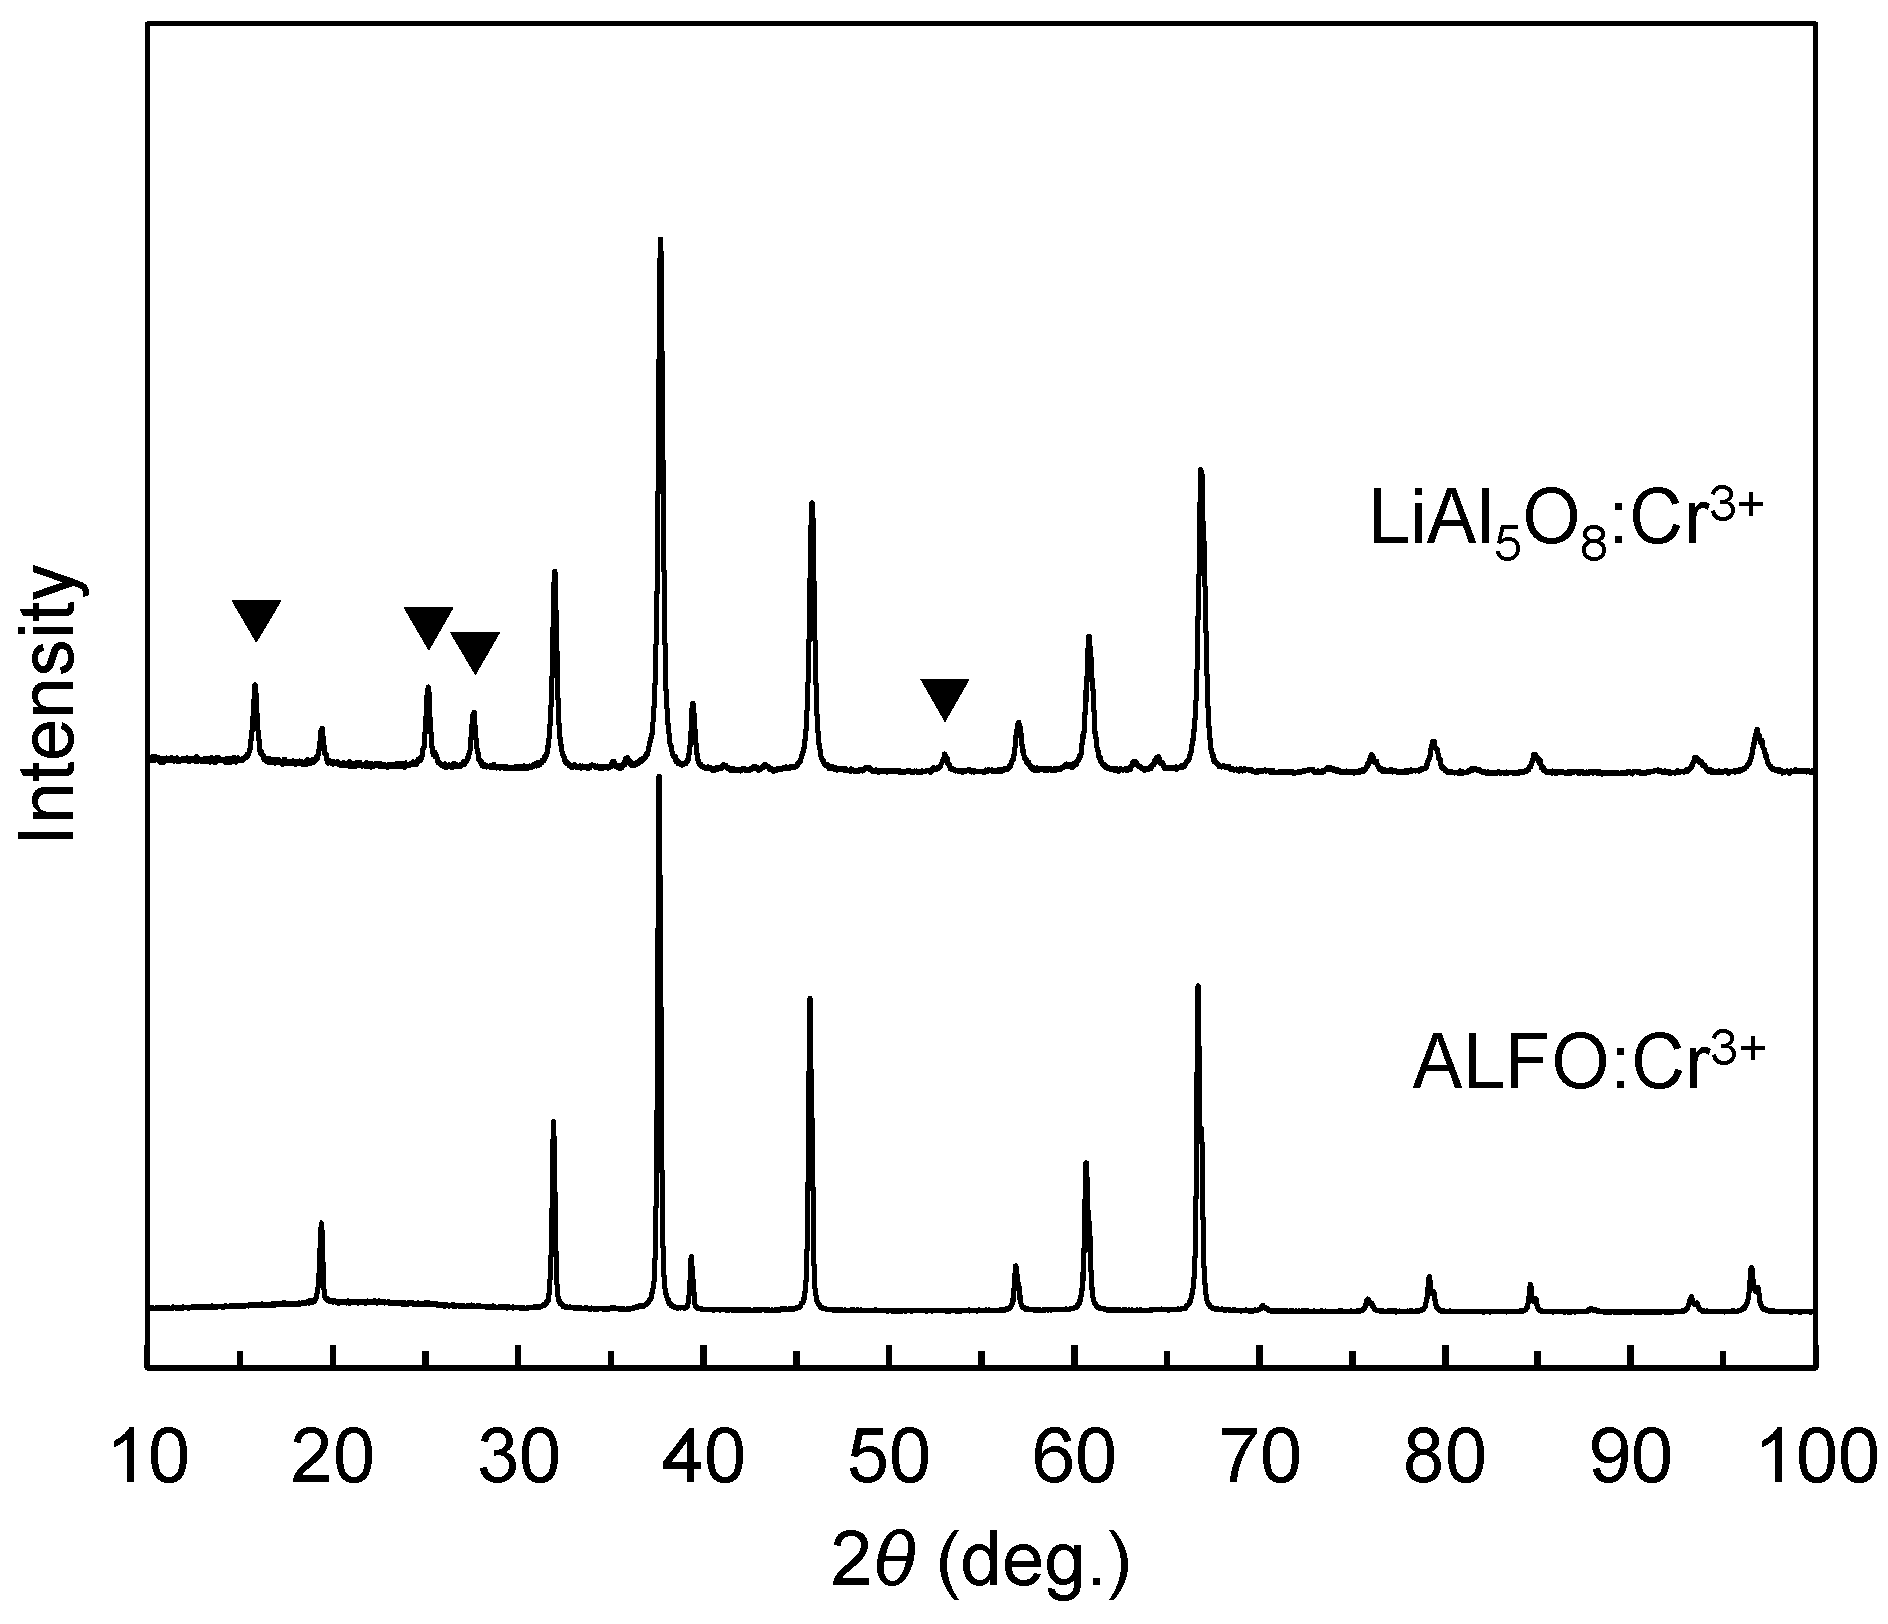
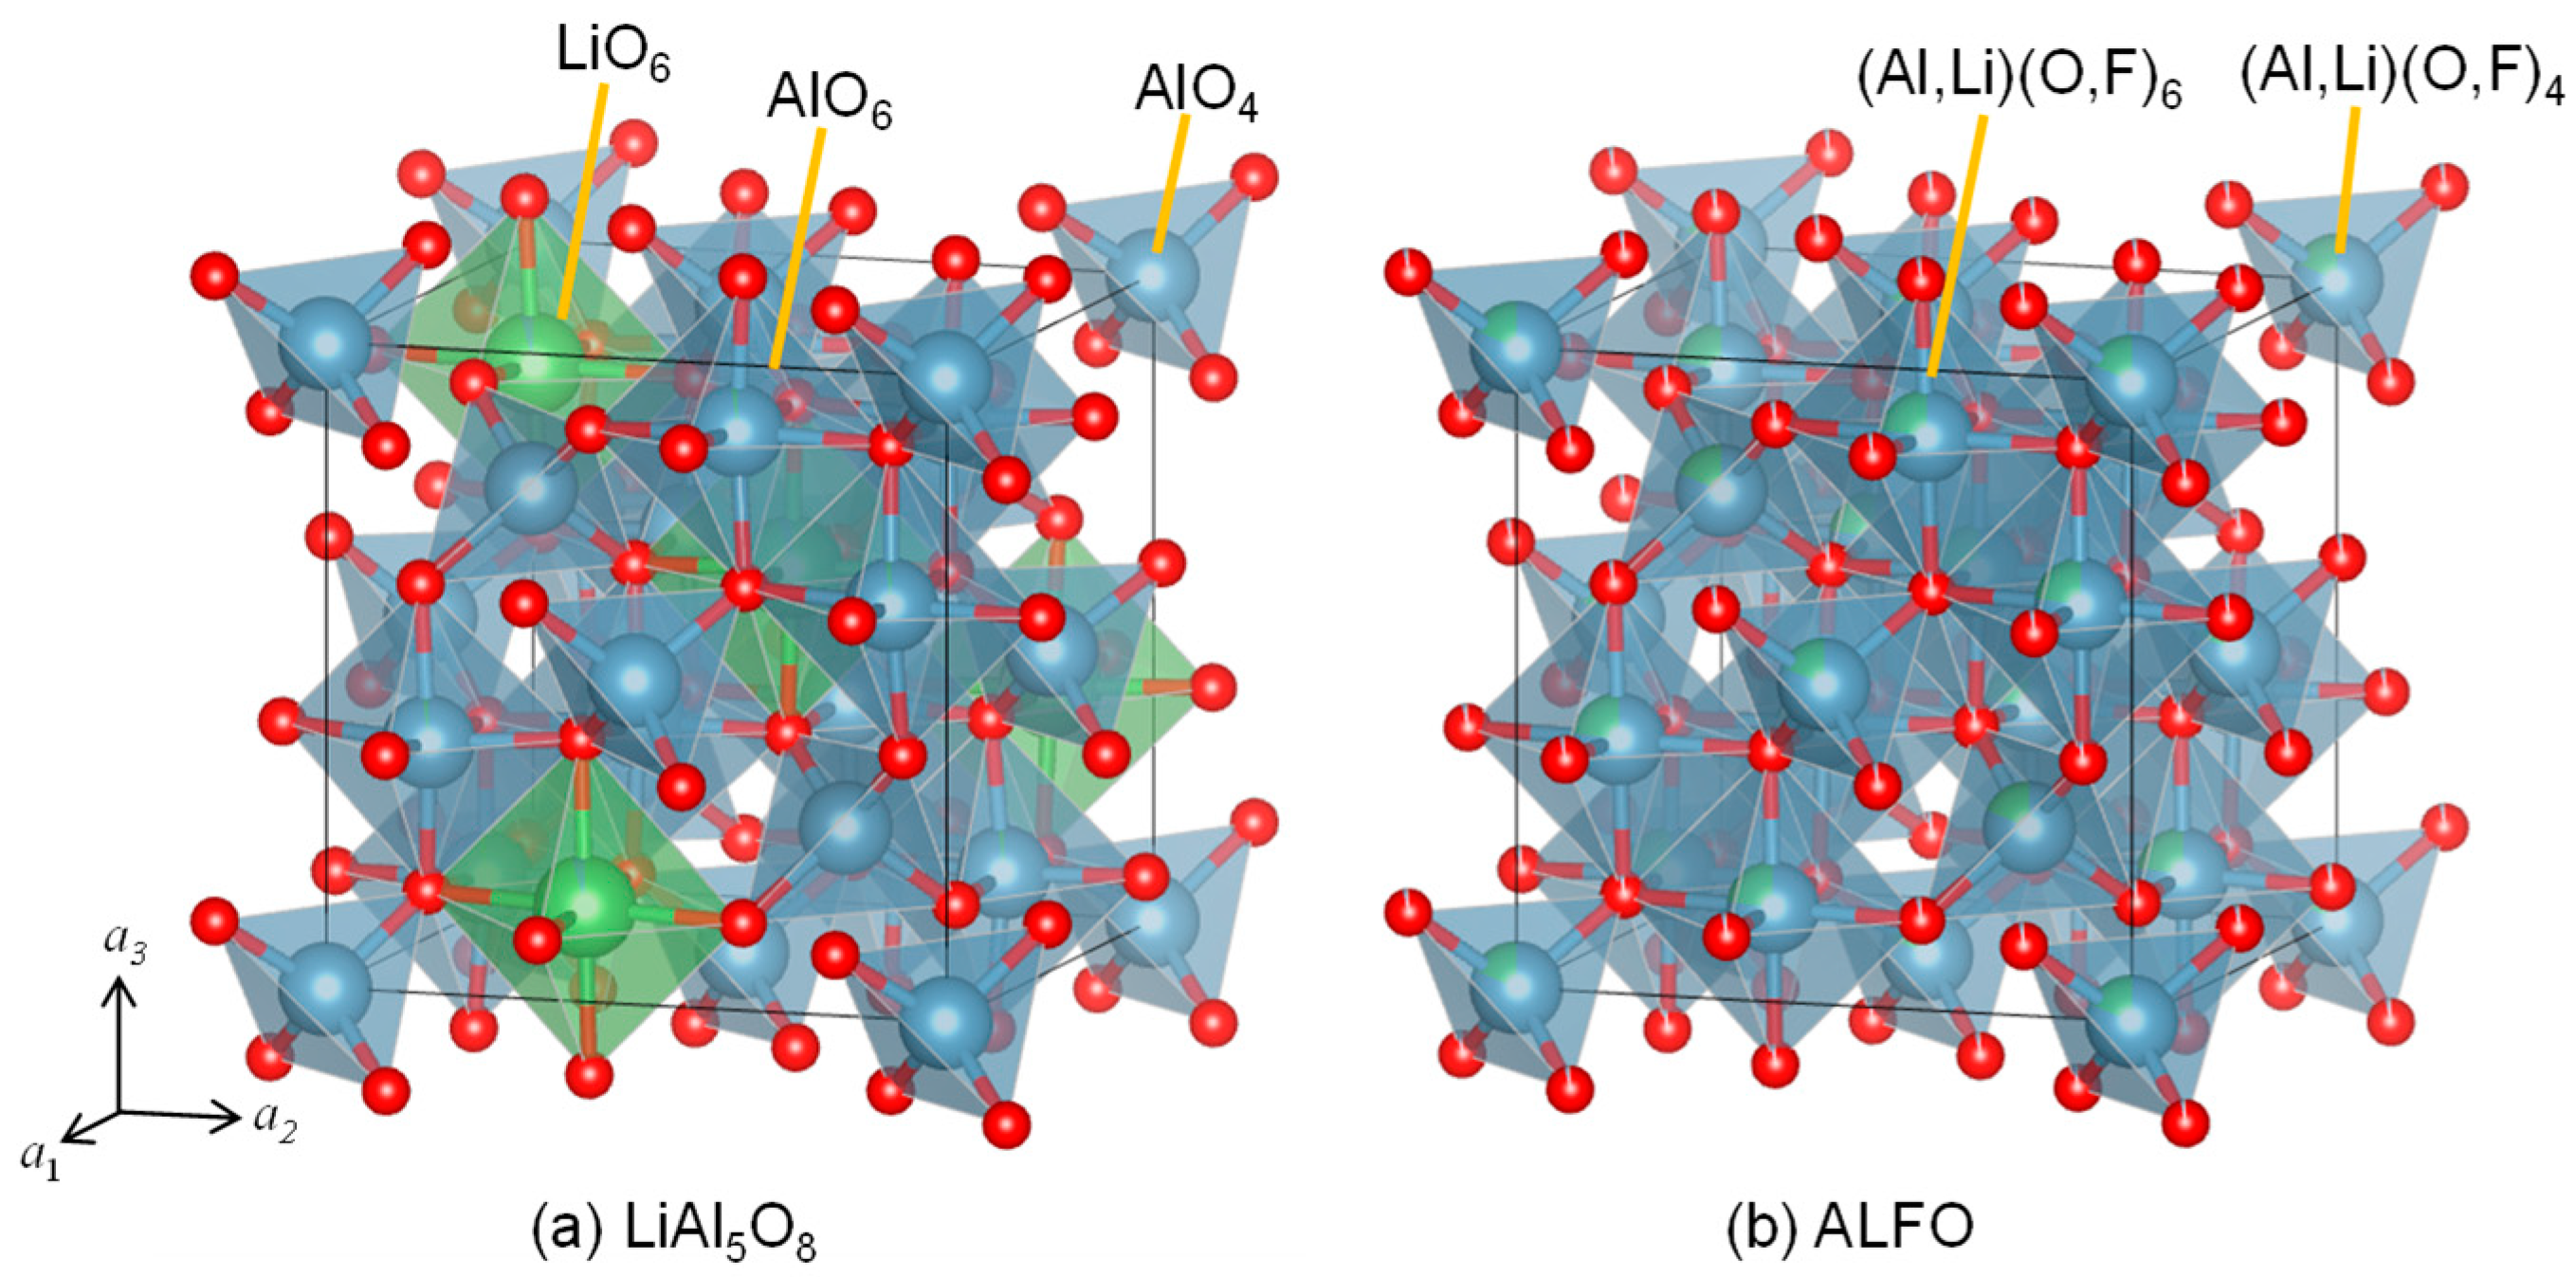
3.1. Compositions and Crystal Structure
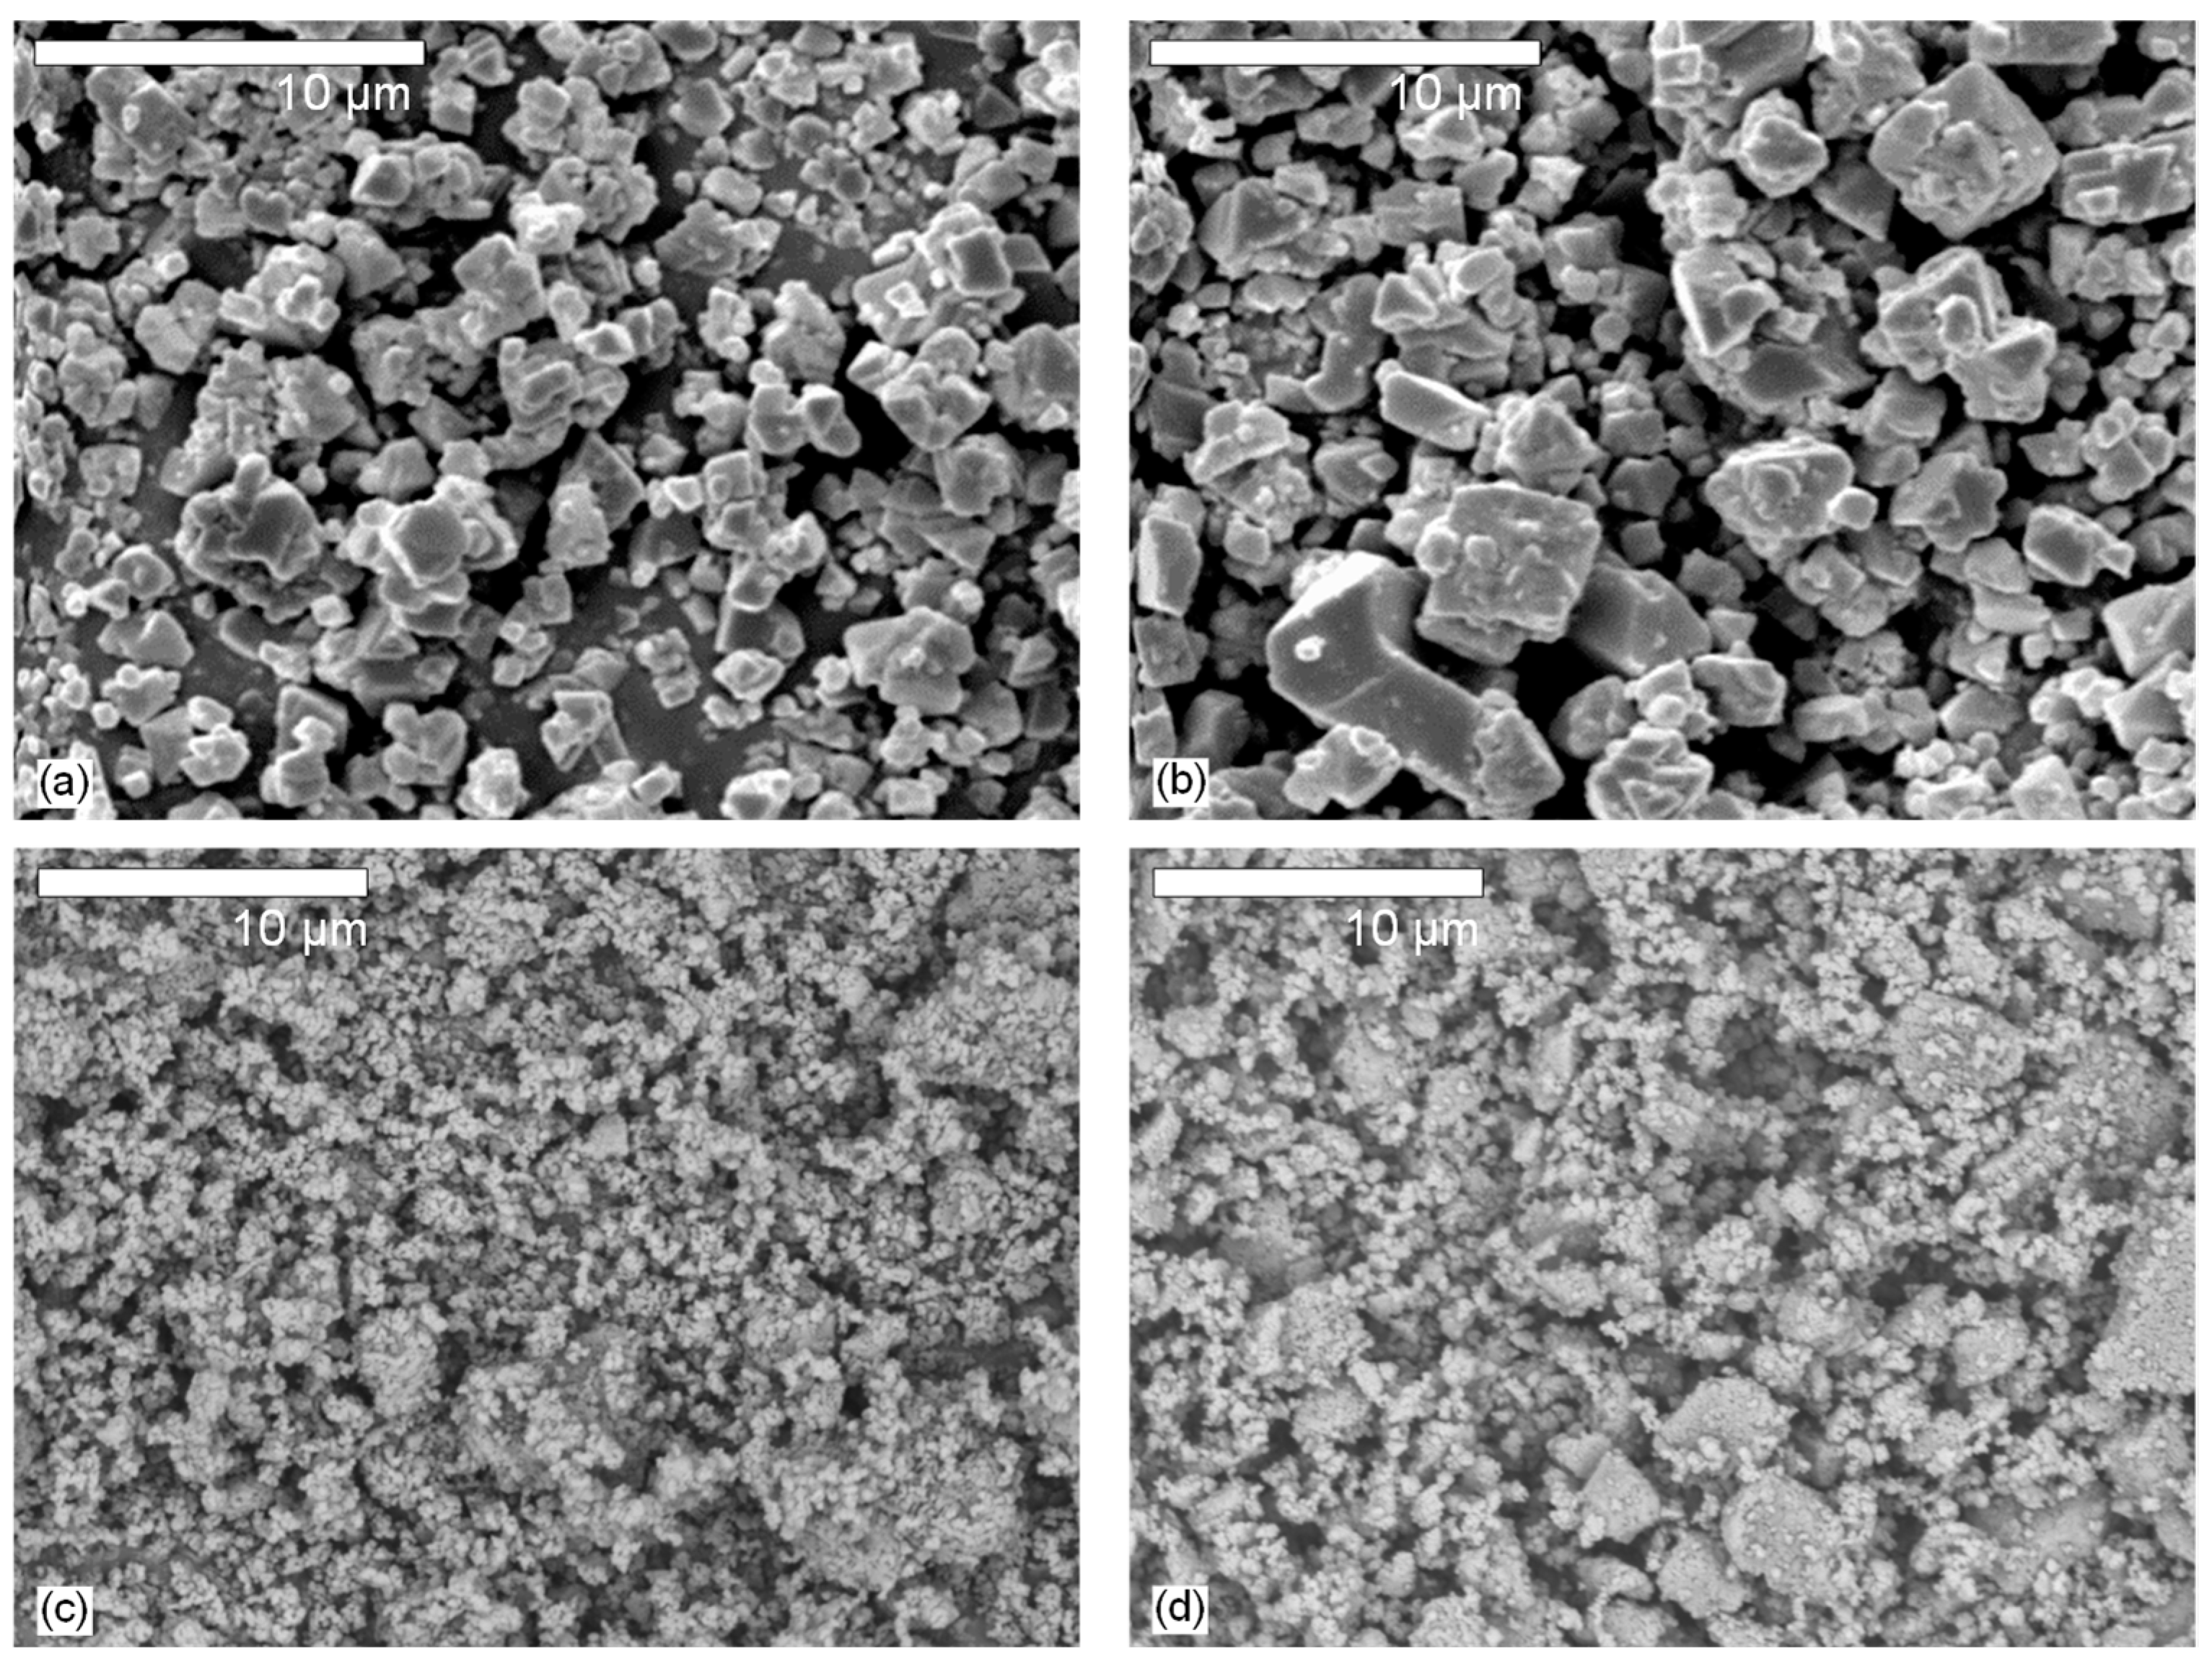
Figure 1 compares the XRD patterns of ALFO:Cr3+ and LiAl5O8:Cr3+ prepared at 1200 °C with the Cr3+ concentration of 0.5%. Each pattern is consistent with the single phase of LiAl5O8 (ICDD # 38-1426) and Al4LiO6F (ICDD #38-610) reported by Belov et al. [33]. The peaks marked with ▼ are the extra peaks originating from the cation ordering of Li+ and Al3+ in spinel-type LiAl5O8, which will be discussed below.
Table 1 shows the chemical compositions of the ALFO host material without the luminescent center ion Cr3+ prepared at 1100 °C, 1200 °C, and 1300 °C. The XRD patterns of these samples are shown in Figure S1 in Supplementary Materials, confirming that each sample was in the single phase. The composition suggested by Belov et al. [33] was Al4LiO6F, but the compositional analysis (Table 1) showed that ALFO is a fluorine-doped form of LiAl5O8 with Li-rich compositions. The Al/Li/F ratios varied depending on the preparation temperature. The fluorine content was 0.28 for the sample prepared at 1100 °C; it decreased to 0.10 for the sample prepared at 1300 °C, indicating that fluorine dissipated during heat treatment at the high temperatures. The lithium content also decreased from Al/Li = 4.69/1.31 (=3.58/1) at 1100 °C and 4.73/1.27 (=3.72/1) at 1200 °C to 4.83/1.17 (=4.13/1) at 1300 °C.
The Cr3+ concentration in the Cr3+-doped ALFO samples was consistent with the starting composition; the compositional analysis showed that ALFO:Cr3+ prepared at 1200 °C with a starting concentration of 0.5% Cr3+ was 0.48%.
The structural refinement by the Rietveld analysis for ALFO prepared at 1200 °C without Cr3+ converged to Rwp/Rp = 0.058/0.042, goodness-of-fit (S) = 1.90, and the lattice constant a = 7.9222(8) Å. Figure S2 in Supplementary Materials shows the refinement results and the structural parameters are listed in Table S1 in Supplementary Materials. The structural model was based on disordered spinel with the space group Fd3m. The spinel-type lattice accommodates cations in the tetrahedral and octahedral sites. In the initial model, Al3+ and Li+ were assumed to be randomly distributed in the tetrahedral sites (8a position) and the octahedral sites (16d position). For the random distribution, the occupancies (g) of Li estimated from the chemical composition analysis (Table 1) should be g = 0.211 for both the tetrahedral and octahedral sites. However, the refined structure indicated a slight preference for Li to occupy the octahedral site, with g = 0.183 and 0.226 for the tetrahedral and octahedral sites, respectively.
According to the literature, LiAl5O8 has crystallographic polymorphs, namely I (disordered) and II (ordered) [19,40,41,42] (Appendix A). Figure 2 compares the crystal structures of ALFO and ordered LiAl5O8. Figure S3 in Supplementary Materials illustrates the structural differences in the arrangement of the tetrahedra and the octahedra in the range of x = 0.2 to 0.6 for spinel-type ALFO and ordered LiAl5O8 in a perspective view along <100>. The octahedra form diagonal chains by edge sharing, and the chains of the octahedra are linked to each other by the tetrahedra connected by corner sharing. In ordered LiAl5O8, the tetrahedra consist of only AlO4, and the chains of the octahedra consist of one LiO6 and three AlO6 in sequence (Figure 2a and Figure S3a in Supplementary Materials). In ALFO, on the other hand, the tetrahedra are statistically AlO4 or LiO4 and the octahedra are AlO6 or LiO6 (Figure 2b and Figure S3b in Supplementary Materials).
The spinel-type framework leads to the unmarked peaks common to ALFO and LiAl5O8 in the XRD patterns in Figure 1. The peaks marked with ▼ in Figure 1 are derived from the periodicity due to the regular arrangement of Al3+ and Li+ on the cation sites in ordered LiAl5O8. The difference in the cation arrangement results in the lattice symmetry of Fd3m for ALFO and P4332 for ordered LiAl5O8. The doped Cr3+ was assumed to occupy octahedral sites in both the host materials because of the preference of Cr3+ with the d3 configuration to occupy octahedral sites; the ionic radius of Cr3+ on a tetrahedral site is not defined in Shannon’s ionic radii table [43].
As a summary of the compositional and structural analyses, ALFO and ordered LiAl5O8 have a disorder–order relationship with respect to the arrangement of Li+ and Al3+ on the cation sites. ALFO has slightly Li-richer compositions than LiAl5O8, resulting in anion vacancies for the charge neutrality. Fluorine replaces 1.3–3.5% of the oxygen sites.
The solubility limit of Cr3+ in the ALFO lattice exceeded 10%. Figure S4 in Supplementary Materials shows the XRD patterns of ALFO:Cr3+ prepared at 1200 °C at different Cr3+ concentrations from 0.01 to 10%. All the samples were substantially a single phase of ALFO; the six-fold coordinated ionic radii of Al3+ and Cr3+ were 0.535 Å and 0.615 Å [43], and replacing Al3+ with larger Cr3+ shifted the diffraction peaks slightly toward the lower angles.

3.2. Morphologies

Figure 3 shows the SEM images of 0.5% Cr3+-doped ALFO and LiAl5O8 prepared at 1200 °C and 1300 °C. The effect of treatment temperature did not appear to have a significant effect on the morphology; ALFO:Cr3+ was composed of angular grains with well-developed crystal faces. The grain size varied from sub-micrometers to several micrometers. On the other hand, the grains of LiAl5O8:Cr3+ did not have a definite shape and their size was several hundred nanometers, which formed agglomerates of a few micrometers in size. The difference in morphology between ALFO:Cr3+ and LiAl5O8:Cr3+ was attributed to the difference in the lithium sources. The melting points of LiF and Li2CO3 used to prepare ALFO and LiAl5O8 are 848 °C and 723 °C, respectively. The development of the crystal faces of the ALFO:Cr3+ grains strongly suggested that LiF formed the melt at elevated temperatures and acted as a self-flux to grow the crystalline grains. On the other hand, the indistinct shape of the grains observed in Figure 3c,d for LiAl5O8:Cr3+ indicated that no flux growth effect was expected, and thus Li2CO3 reacted with α-Al2O3:Cr3+ to form LiAl5O8:Cr3+ before forming the melt.

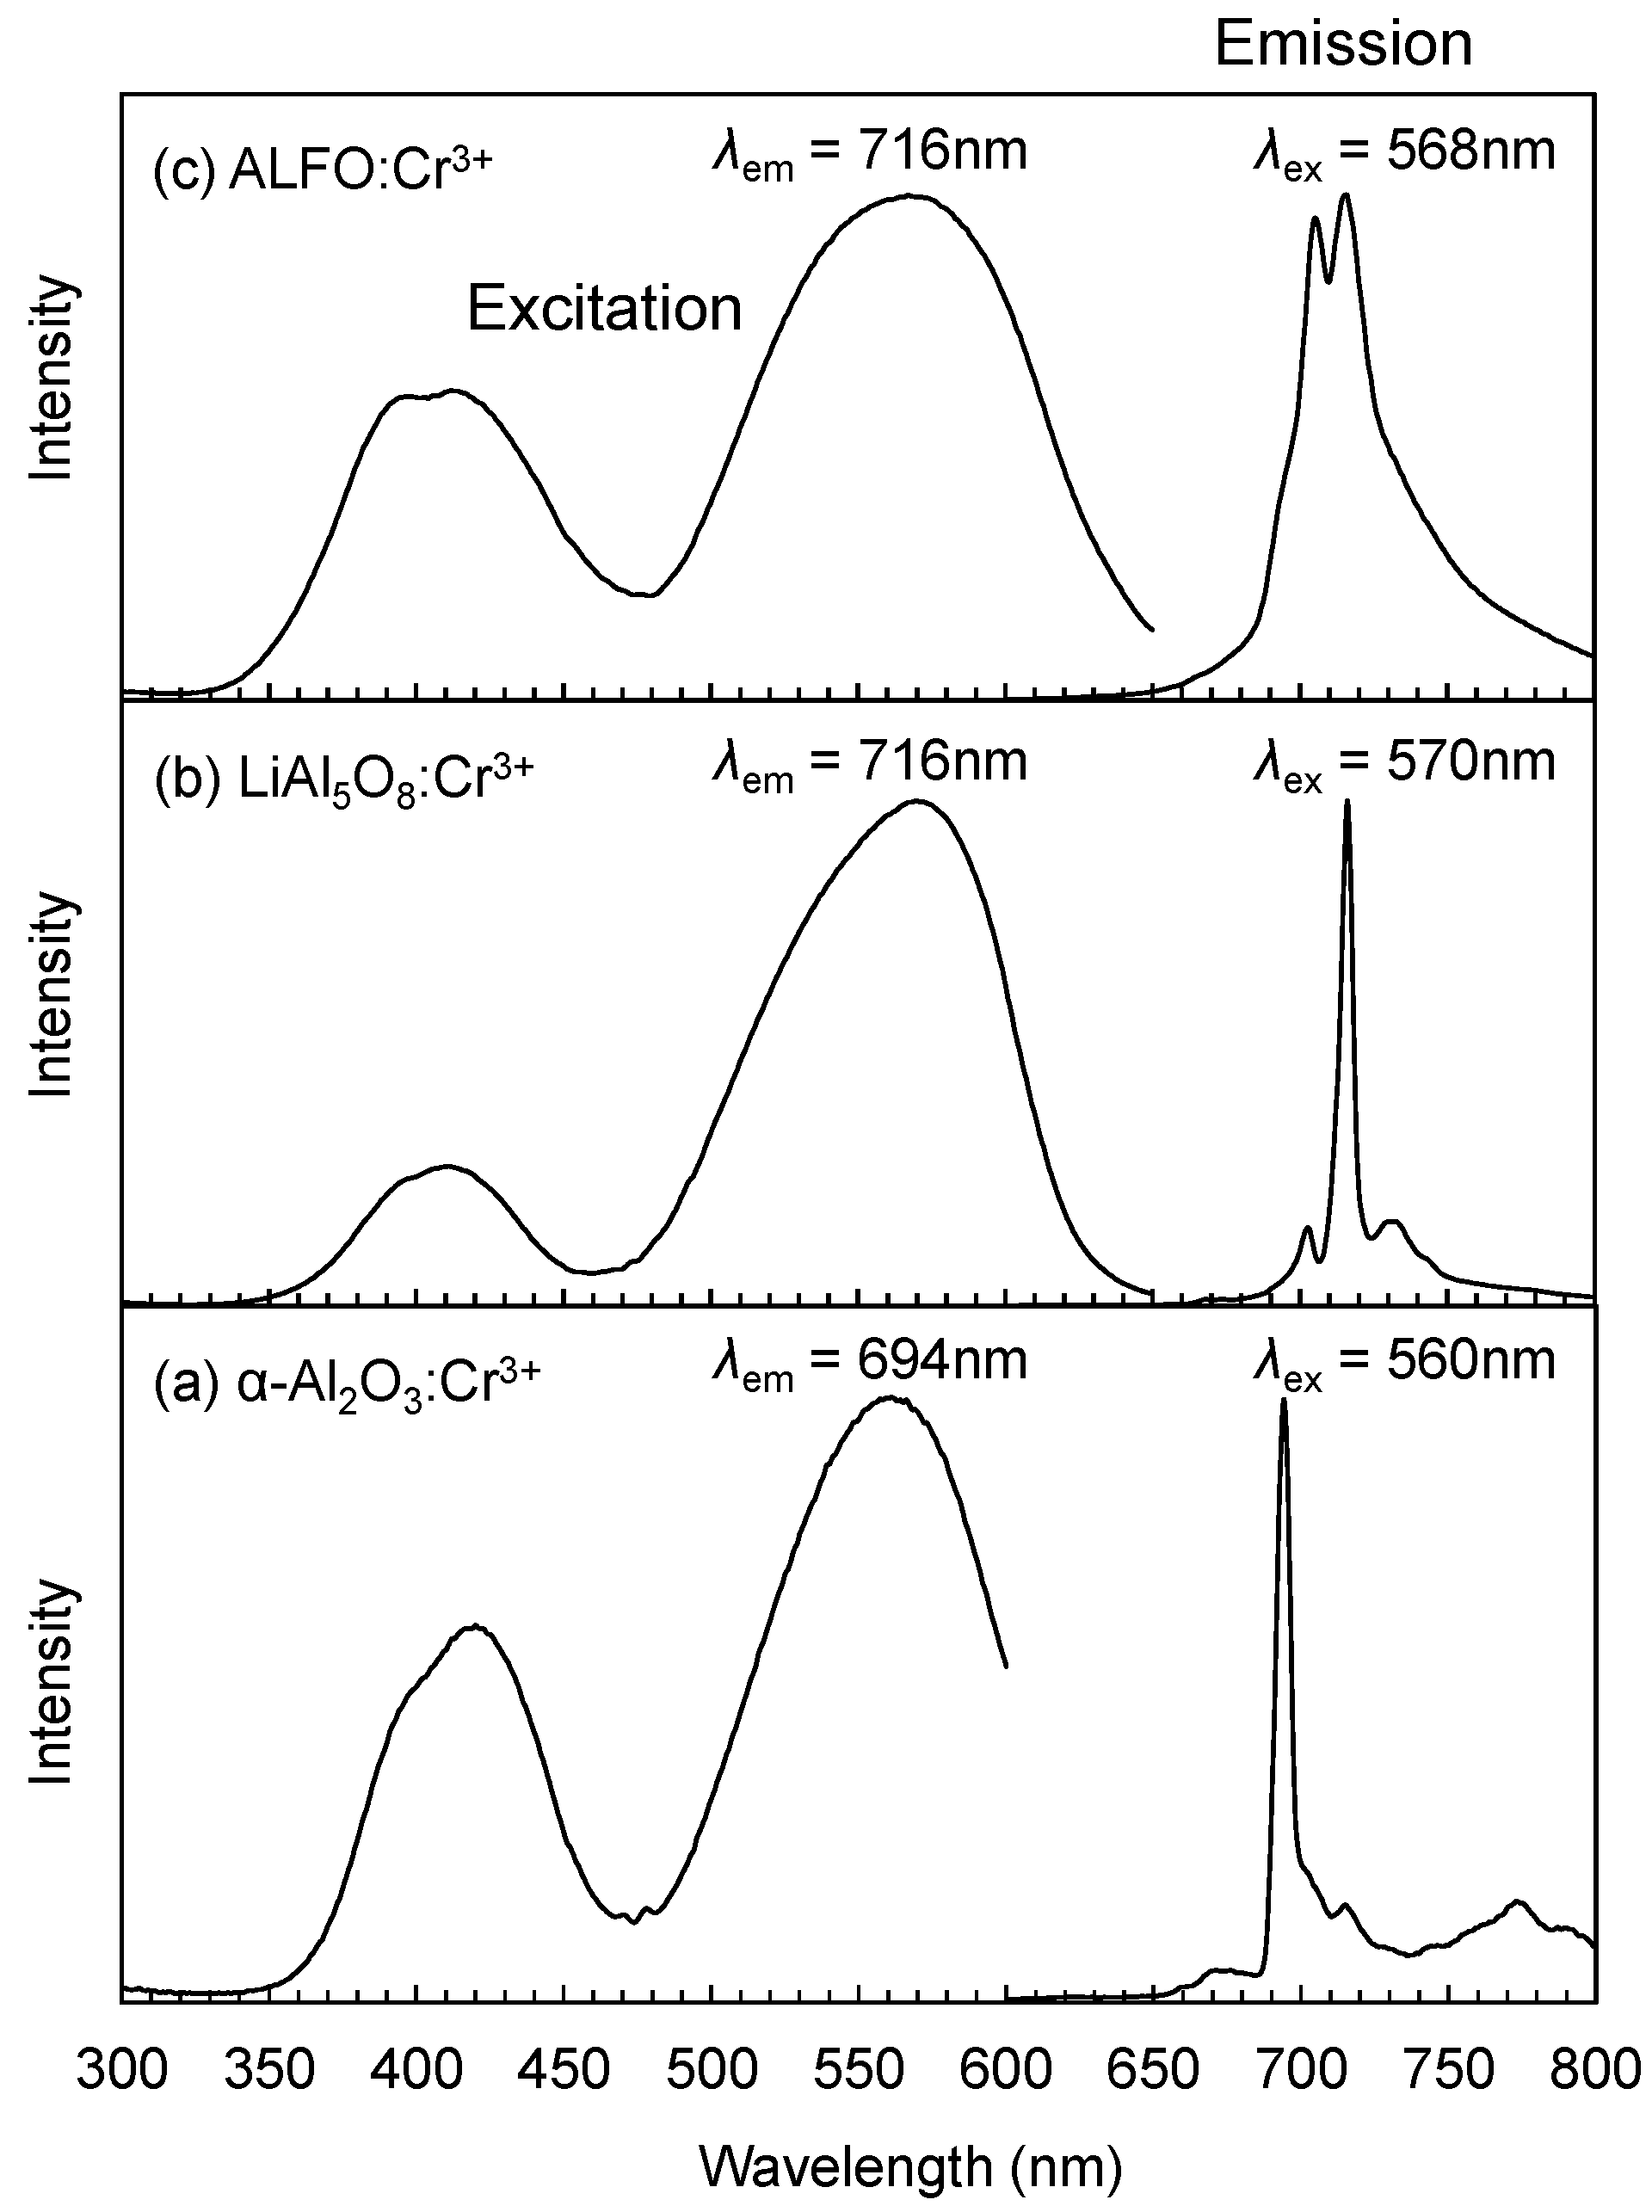
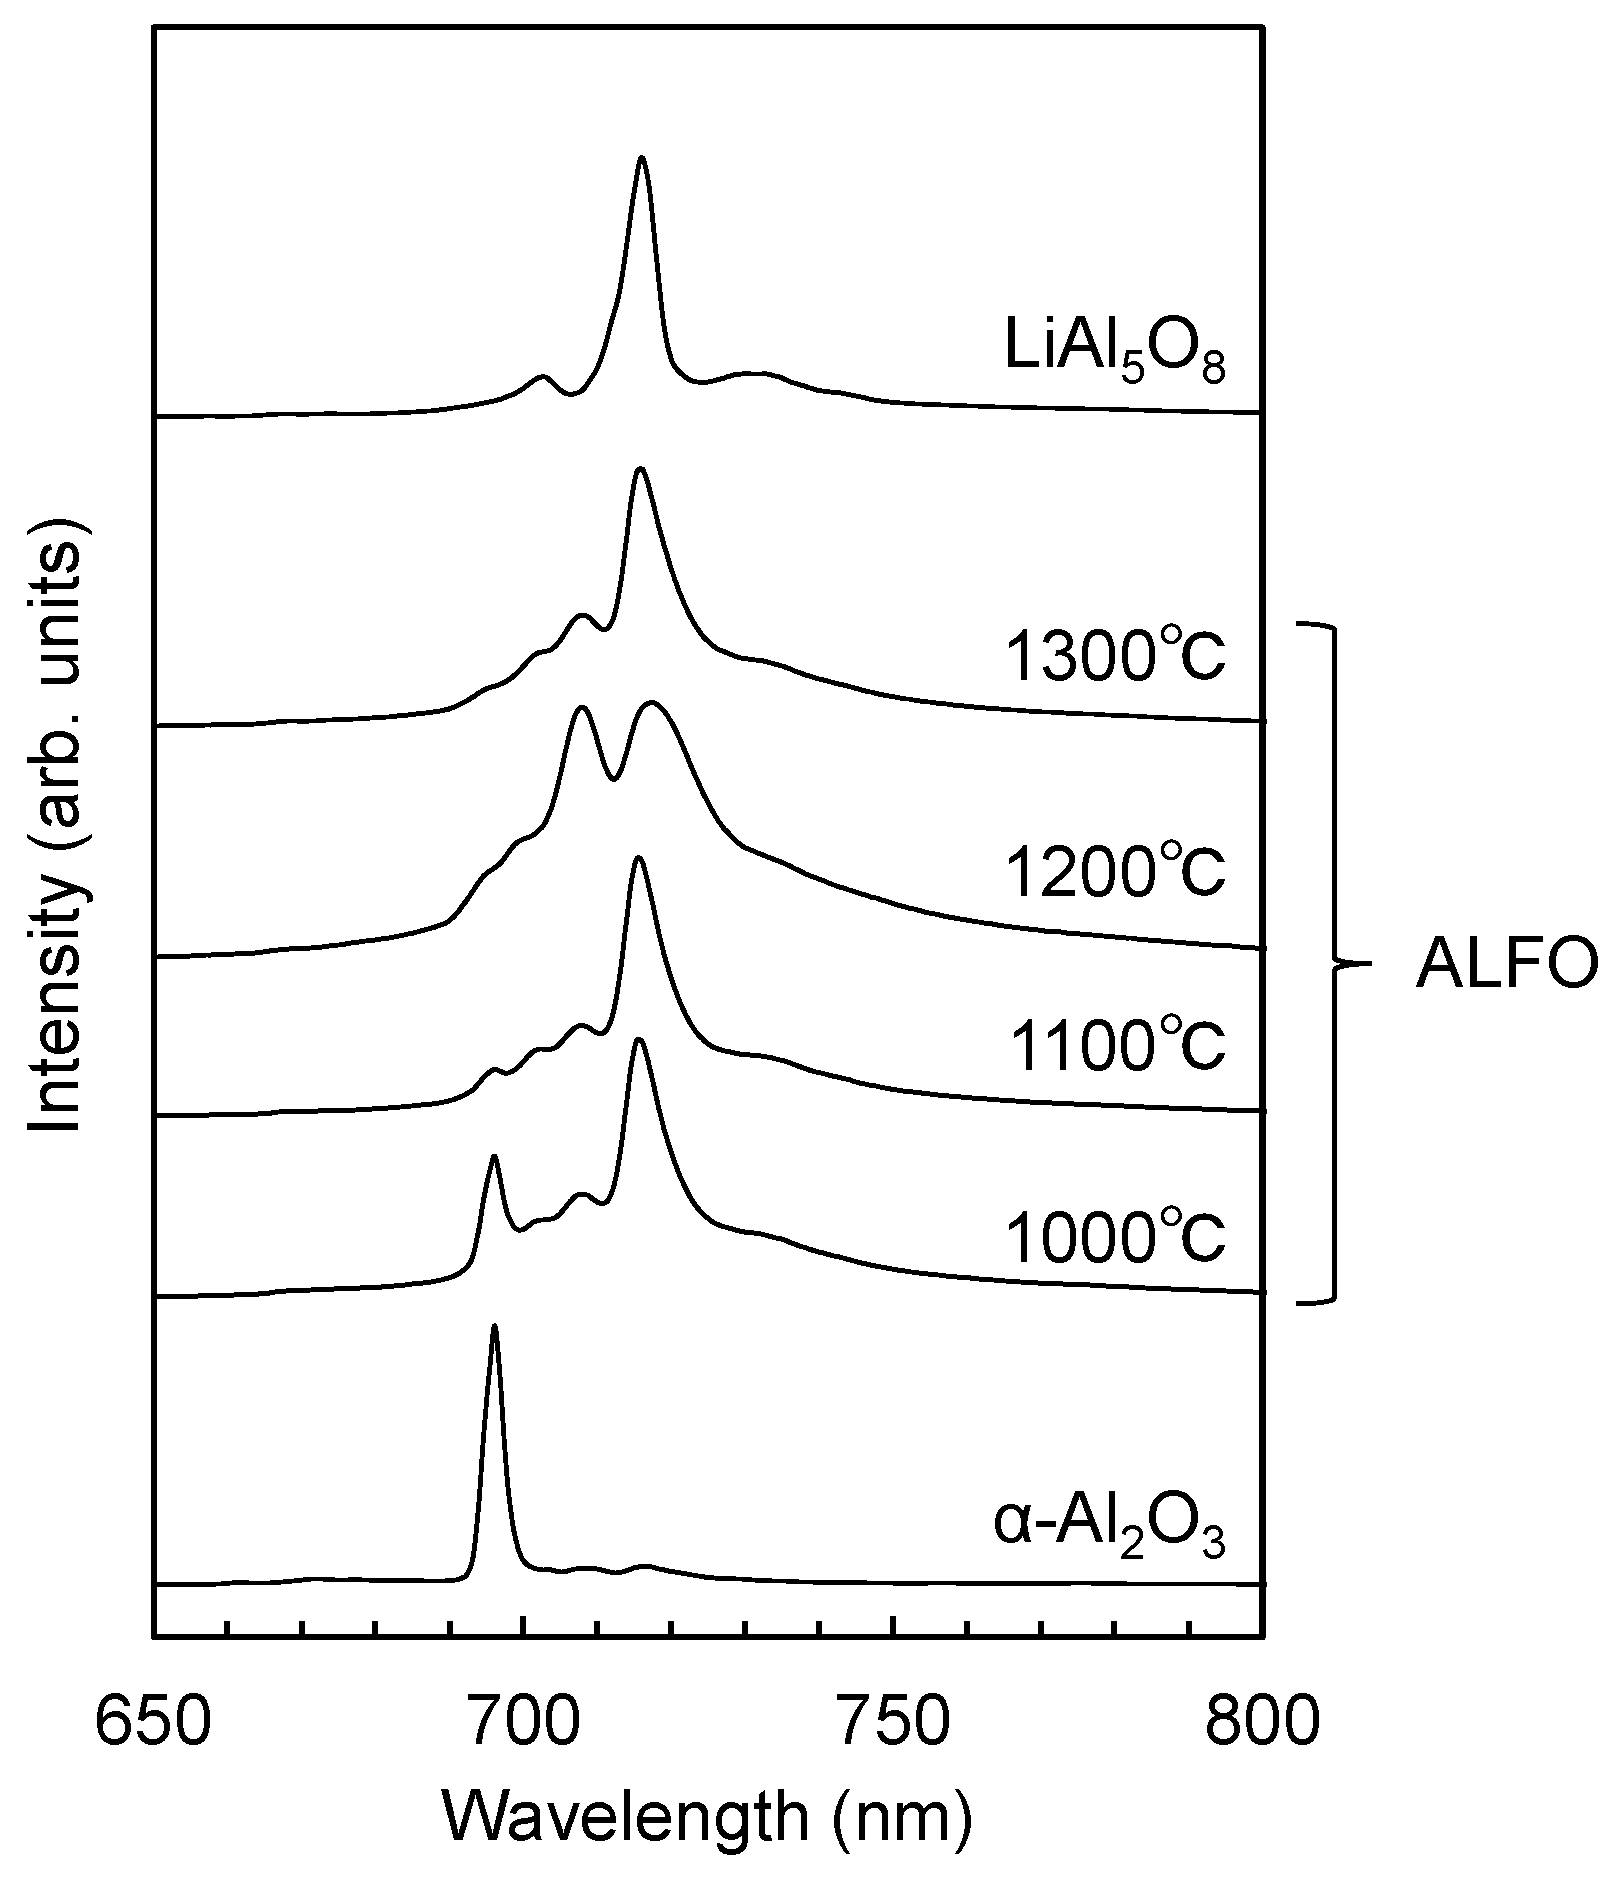
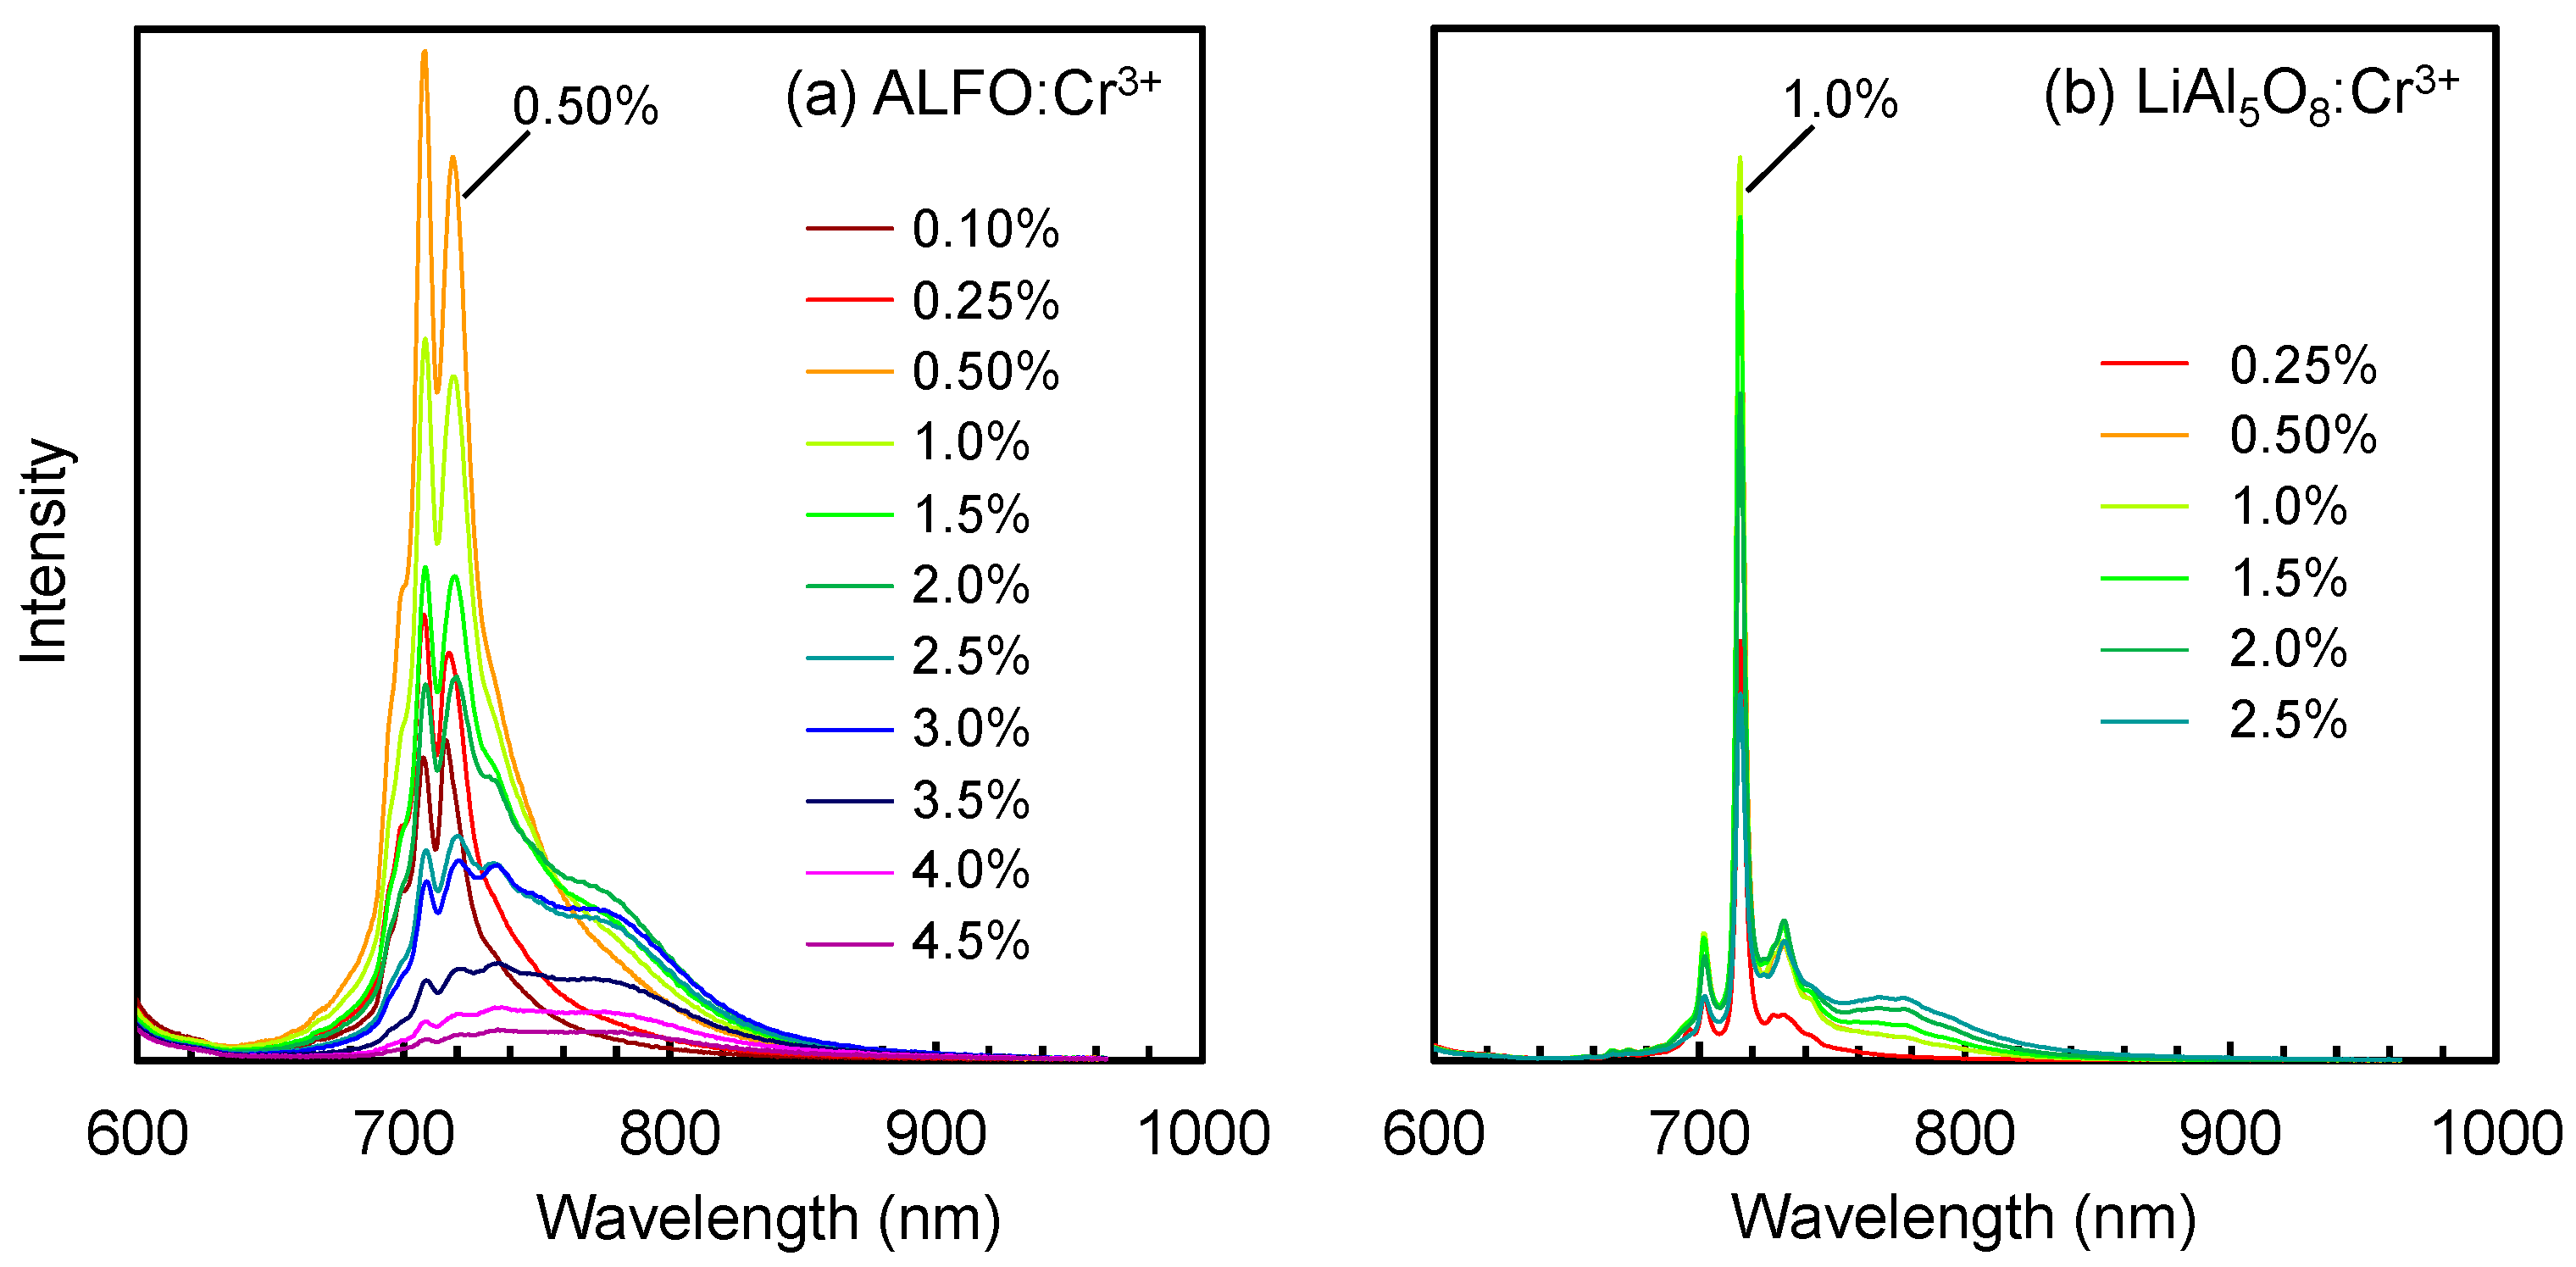
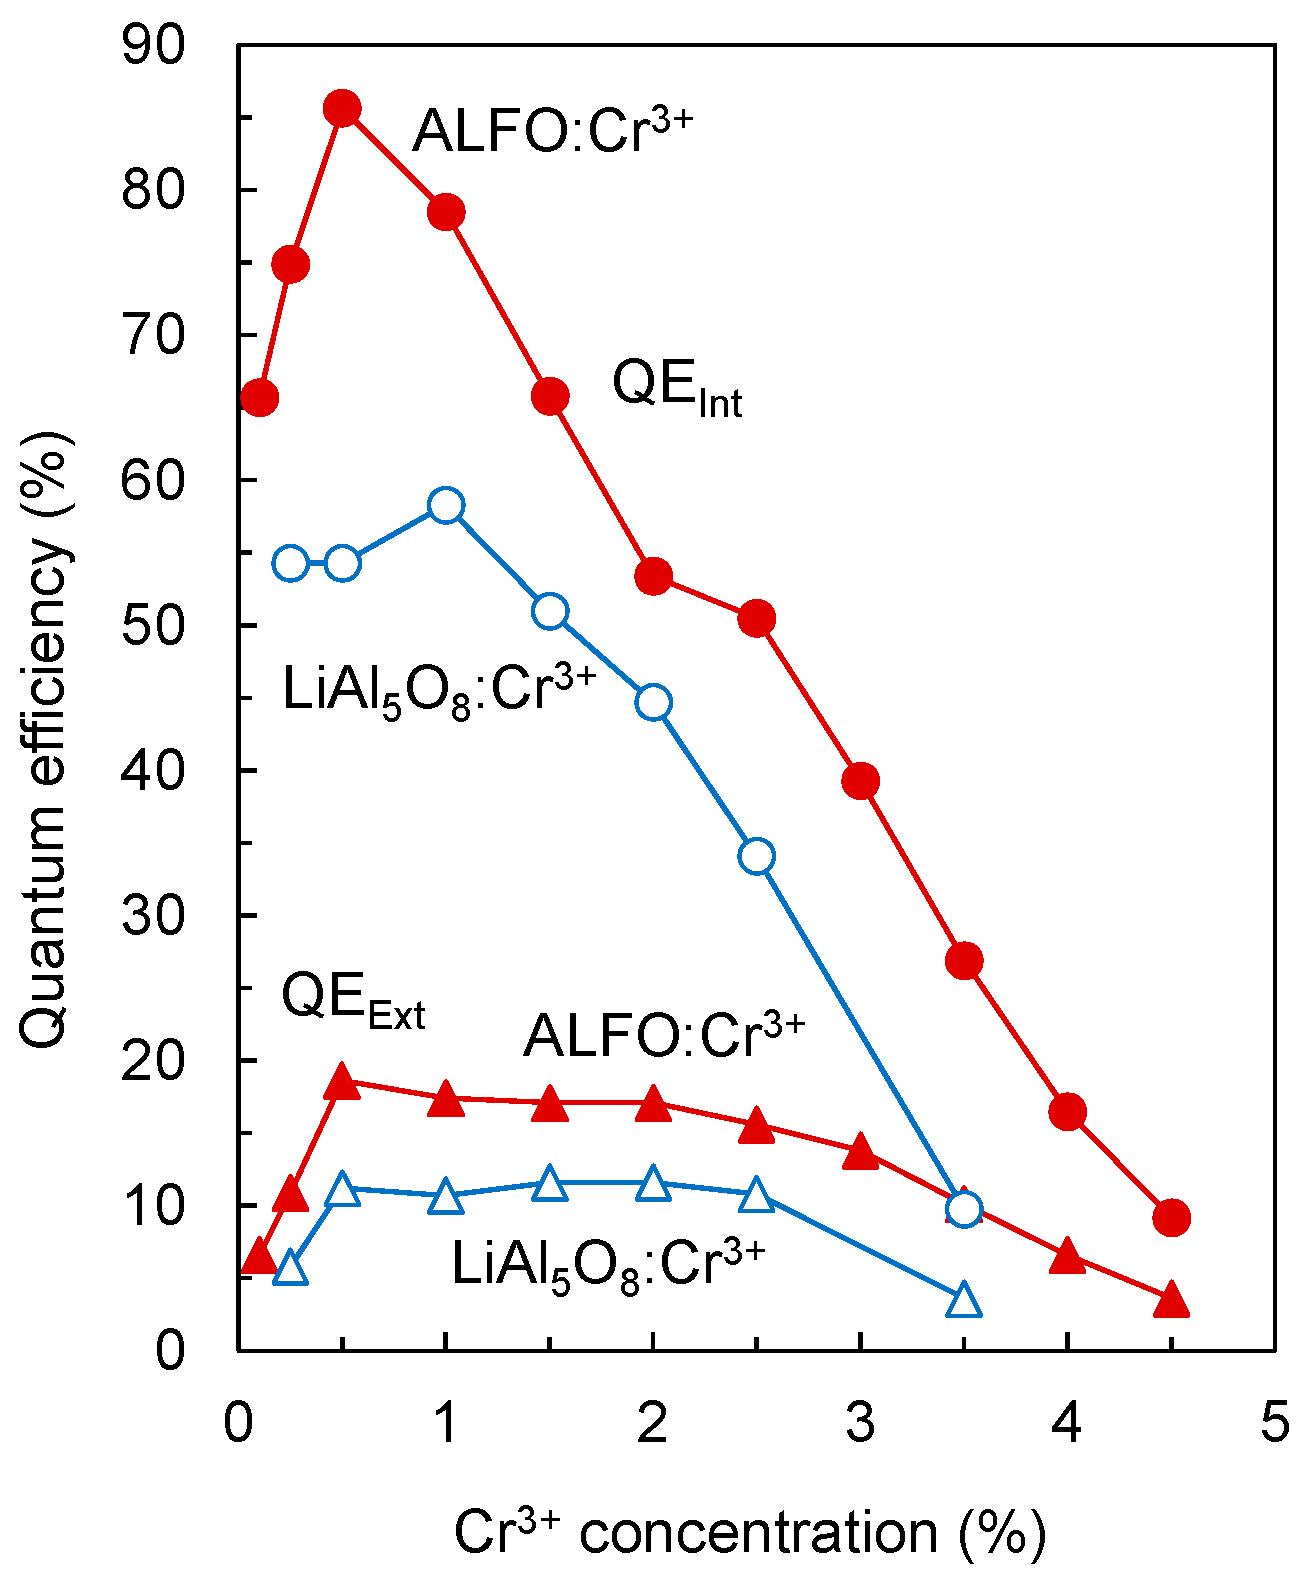
3.3. Photoluminescence Properties

The emission and excitation spectra of 0.5% Cr3+ in ALFO, LiAl5O8, and α-Al2O3 prepared at 1200 °C are compared in Figure 4. The excitation spectra were similar to each other regardless of the type of the host crystal, and the excitation bands consisted of two broad peaks at around 420 nm and 570 nm. They corresponded to the transitions from the ground state 4A2 to the excitation states 4T1 (4F) and 4T2 (4F) in Cr3+ of the d3 state. The emission peaks depended on the host crystal. α-Al2O3:Cr3+ showed a typical line spectrum, named “R line”, at 694 nm with several small side peaks on the longer wavelength side, as found in the literature [9,44]; LiAl5O8:Cr3+ showed a sharp peak at 716 nm with smaller peaks at 703 nm and 730 nm which are also similar to those reported in the previous literature [19,45]. On the other hand, Cr3+ in ALFO characteristically exhibited a doublet peak at 708 and 716 nm, and the profile was broader than those of α-Al2O3 and LiAl5O8. Although the apparent difference between the crystal structures of ALFO and ordered LiAl5O8 shown by the Rietveld analysis was in the cation arrangement, the broad doublet peak in ALFO:Cr3+ indicated that the local environment around the luminescent center Cr3+ in ALFO was even more inhomogeneous than simply considering octahedral coordination by six neighboring oxygens.
Figure 5 shows the variation of the emission peaks of ALFO:Cr3+ with the treatment temperature and compares them with those of α-Al2O3:Cr3+ and LiAl5O8:Cr3+. The peak at 696 nm of the ALFO:Cr3+ sample prepared at 1000 °C was due to the unreacted Al2O3 residue (Figure S5 in Supplementary Materials), indicating that the coprecipitated Cr3+ was incorporated into the α-Al2O3 grains to form α-Al2O3:Cr3+. The peak at around 715 nm was specific to ALFO:Cr3 and was observed in ALFO:Cr3+ prepared at 1000–1300 °C. Interestingly, the rather broad doublet peak with peak tops at 708 nm and 716 nm was characteristically observed in the sample prepared at 1200 °C, and the detailed mechanism of the occurrence of the doublet peak is still unclear. It could be attributed to the difference in the local coordination environment around Cr3+ that did not appear in the average structure by XRD (Figure S5 in Supplementary Materials). Figure S5 in Supplementary Materials shows the XRD patterns of the ALFO:Cr3+ samples prepared at 1000–1300 °C. Residual unreacted α-Al2O3 was recognized in the sample prepared at 1000 °C, while the samples prepared at 1100–1300 °C were in the single phase.
Figure 6 compares the PL spectra of ALFO:Cr3+ (a) and LiAl5O8:Cr3+ (b) at different Cr3+ concentrations. The emission intensity of ALFO:Cr3+ increased from Cr3+ = 0.1% to 0.5% and decreased above 0.5%. Above 2.5%, the intensity of the main doublet peak decreased while the shoulders developed around 780 nm. In the previous literature, it has been discussed that the broad emission of Cr3+ in the near-infrared region was due either to the 4T24A2 transition of Cr3+ placed in a weak crystal field, or to magnetic interactions between Cr3+ ions at the neighboring sites. According to the Tanabe–Sugano diagram [46,47,48], the first excited state in the d3 configuration of octahedral coordination is the 4T2 or 2E state, depending on the strength of the crystal field. The transition from the 2E state to the 4A2 ground state yields the line spectra typically observed for Cr3+ around 700 nm, while broad near-infrared emission is reported for the transition from the 4T2 state in the host materials with a weak crystal field [21,22,23,24,27,29,30]. Magnetic interactions also bring the red-shift of the emission [49], as exemplified by the so-called N-lines of Cr3+ emission [9,15] and the broad luminescence due to Cr3+-Cr3+ pairs observed in SrAl11.88−xGaxO19:0.12Cr3+ by Rajendran et al., which was concluded from the decay time measurements [28]. As for the shoulder peak around 780 nm in ALFO:Cr3+, the origin was attributed to the magnetic interaction between Cr3+ ions from the fact that the change in the lattice parameter with Cr3+ addition, i.e., the change in the strength of the crystal field at the Cr3+ sites, was not very large (Figure S4 in Supplementary Materials), and that the interaction between Cr3+ ions was observed in the ESR signal at a high Cr3+ concentration as described in Section 3.4.
LiAl5O8:Cr3+ showed the maximum intensity at Cr3+ = 1.0%, and the change of the overall peak profile was less distinct than ALFO:Cr3+. The broad peak around 780 nm also developed in LiAl5O8:Cr3+ above 1.0%, but the intensity was relatively low.
Figure 7 shows the variation of the internal and external quantum efficiencies (QEs) of ALFO:Cr3+ and LiAl5O8:Cr3+ versus Cr3+ concentration. The circles and triangles indicate the internal and external quantum efficiencies QEInt and QEExt, respectively; the filled and unfilled marks indicate the QEs of ALFO:Cr3+ and LiAl5O8:Cr3+, respectively. ALFO:Cr3+ showed higher QEs than LiAl5O8:Cr3+. The QEInt for ALFO was 85.6% at Cr3+ = 0.5%, higher than the maximum QEInt of 58.3% for LiAl5O8 at Cr3+ = 1.0%. The highest QEExt was 18.6% for ALFO:Cr3+ and 11.6% for LiAl5O8:Cr3+. The enhancement of QEs of ALFO:Cr3+ was attributed to the high crystallinity suggested by the well-developed grains observed in SEM (Figure 3), the disruption of local symmetry around the luminescent center Cr3+ from the ideal octahedron with the introduction of F and vacancies on the O2− sites, and the increased area of the PL peaks due to peak broadening.

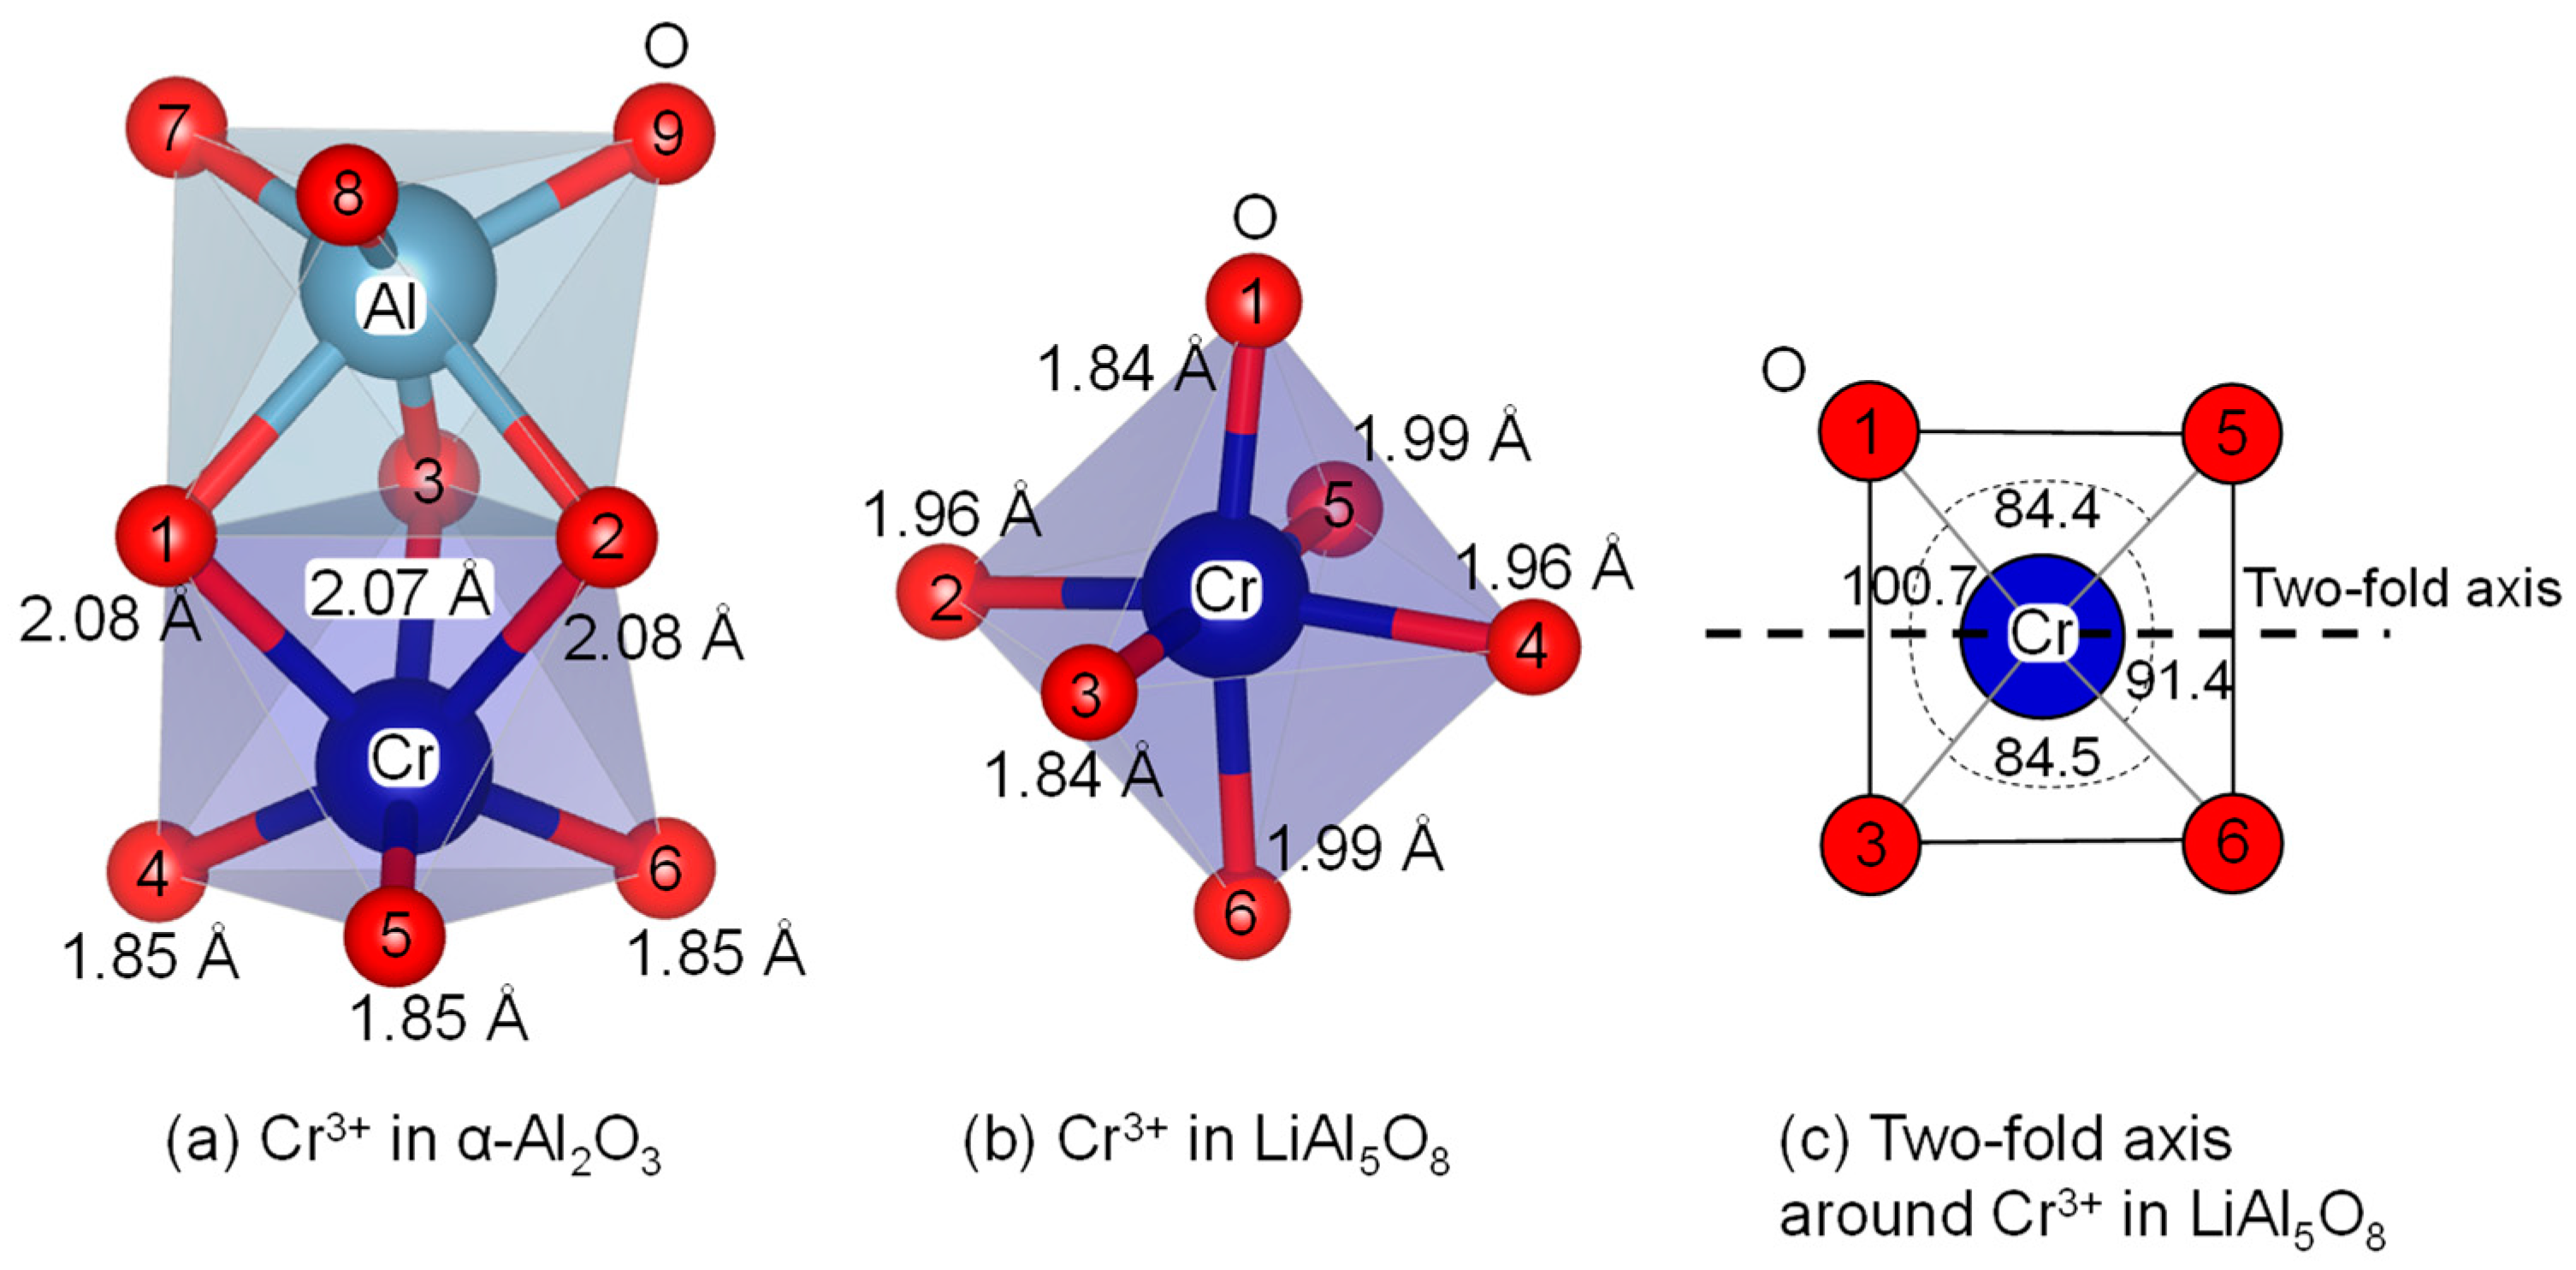
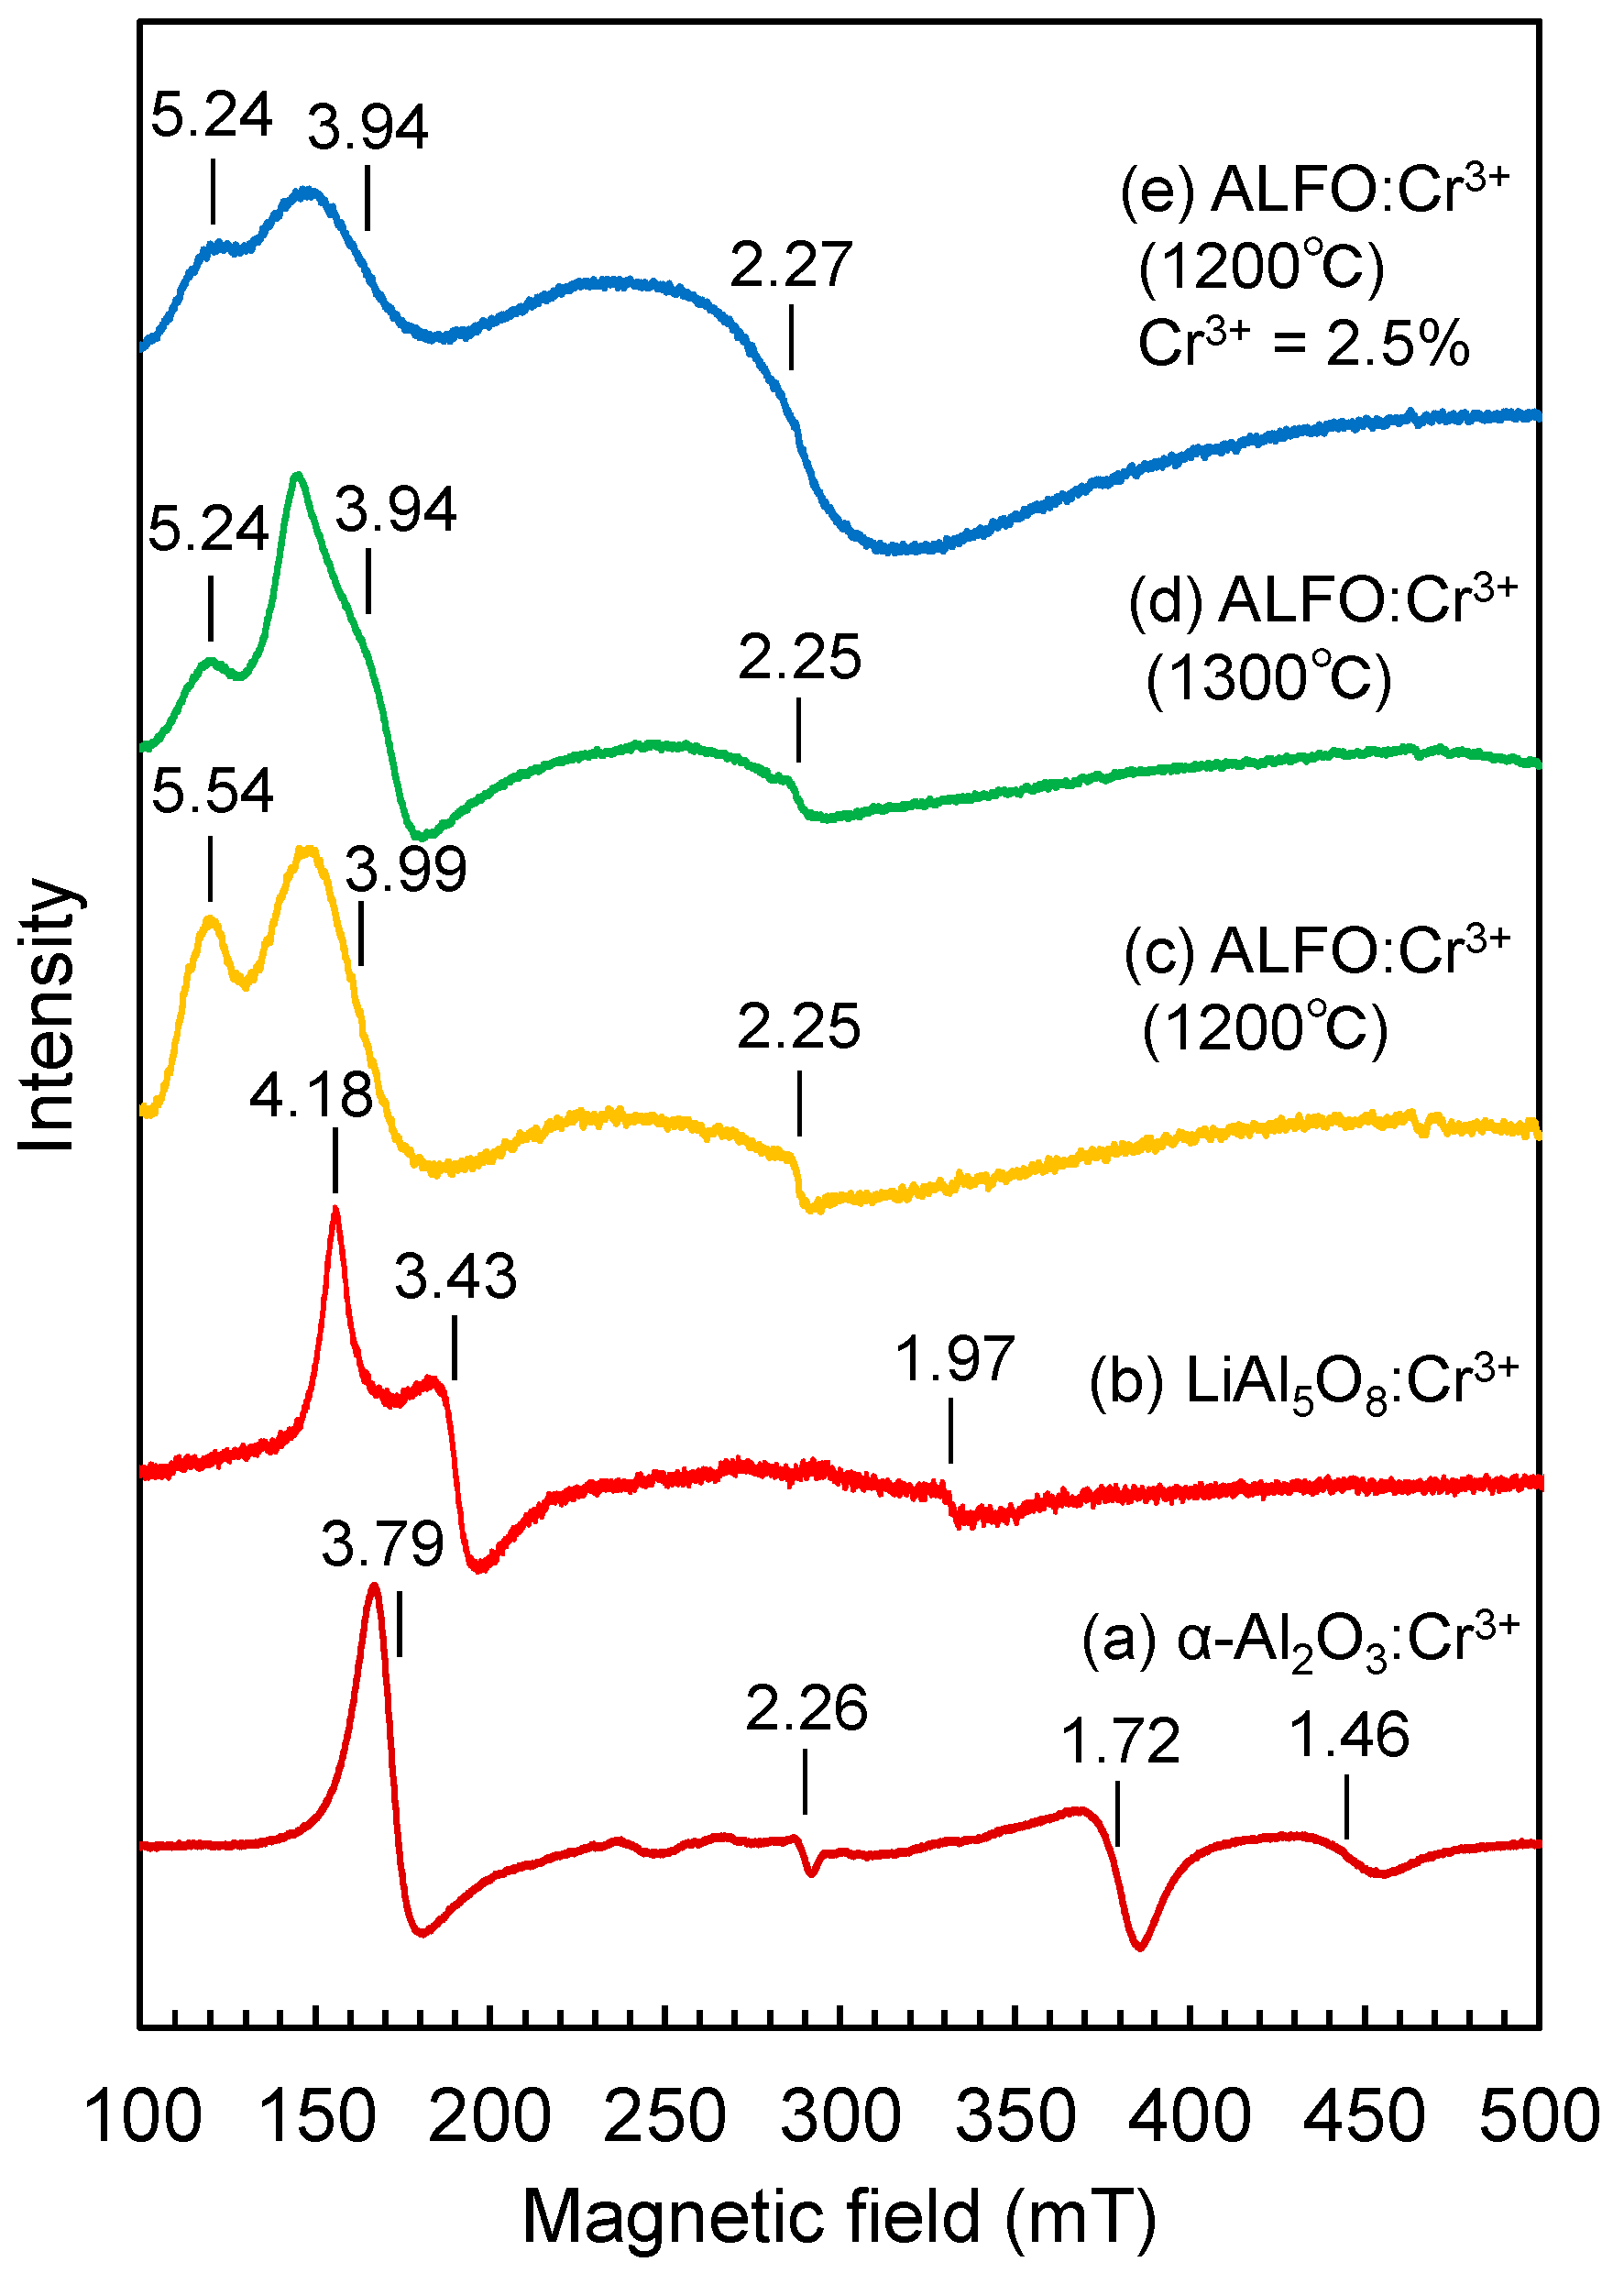
3.4. Local Environments around Cr3+

Cr3+ prefers octahedral coordination in the host spinel lattice in both ALFO and LiAl5O8, whereas the different spectra suggested different local environments around Cr3+ in ALFO and LiAl5O8. Such aperiodic local structures are difficult to investigate using diffraction-based structural analysis, particularly for low-concentration dopants. In fact, the ALFO:Cr3+ samples prepared at the different temperatures showed substantially the same XRD patterns (Figure S5 in Supplementary Materials), but the emission peaks varied as shown in Figure 5.
Cr3+ in the d3 configuration is an ESR active ion, and the ESR technique was expected to effectively detect the differences in the electronic structures affected by the coordination environment. Figure 8 compares the ESR spectra of 0.5% Cr3+ doped α-Al2O3 (a), LiAl5O8 (b), and ALFO (c) prepared at 1200 °C. Cr3+ in α-Al2O3 was focused on in the 1960s as a good model example for ESR measurements [44,50,51,52,53,54,55,56,57,58]. The ESR signal of Cr3+ in α-Al2O3 (Figure 8a) was consistent with those reported for Cr3+ in polycrystalline α-Al2O3 in the previous literature [50] and consisted of several peaks corresponding to g = 3.79, 2.26, 1.72, and 1.46. For octahedrally coordinated d3 ions placed in a magnetic field, the lowest energy state is the spin quartet, with the spin quantum number s = −3/2 along the direction of the magnetic field. The signal of a polycrystalline sample is the average of the spectra of individual crystallites, and the angular dependence of Cr3+ in single crystalline Al2O3 [59] indicated that the peaks at g = 3.79 and 2.26 were assigned to the s = −3/2 to −1/2 transition, and the peaks at g = 1.72 and 1.46 to the −1/2 to +1/2 transition and +1/2 to +3/2 transition, respectively (Appendix B) [50,51].
Cr3+ in LiAl5O8 showed essentially the same ESR signal (Figure 8b) as reported by Singh et al. [45] for LiAl5O8:Cr3+. Singh et al. assigned distinct peaks at g = 4.03 and 3.27 and smaller peaks at g = 5.44, 4.89, and 4.51 to the isolated Cr3+ ions and the resonance signal at g = 1.97 to the magnetic interaction between the Cr3+ ions, based on the literature [60,61].
The basic features of the ESR signal of Cr3+ in ALFO (Figure 8c) were similar to those of Cr3+ in LiAl5O8 (Figure 8b), but the profiles became broad and the signal positions shifted toward the low magnetic field side. The broadening of the ESR signal was attributed to an inhomogeneous local environment around the Cr3+ ions in ALFO. The CrO6 octahedra in ALFO are expected to be disturbed by the statistical distribution of Al3+ and Li+ on the adjacent cation sites. The shift of the ESR signal of ALFO toward the lower field side than LiAl5O8 indicated the increased zero-field splitting.
The PL spectra of Cr3+ in ALFO prepared at 1100 °C and 1300 °C were apparently similar to that of Cr3+ in LiAl5O8, but the ERS signal of Cr3+ in ALFO prepared at 1300 °C (Figure 8d) was different from that in LiAl5O8 prepared at 1200 °C (Figure 8b), indicating that the similarity in the PL spectra was not due to similar local environments around the luminescent center Cr3+ in these host materials.
Increasing the Cr3+ concentration to 2.5% resulted in broadening and enhancement of the ESR peak around g ~ 2.3 (Figure 8e), which was considered to reflect the magnetic interaction between Cr3+ ions, as Singh et al. discussed that g = 1.95 was due to exchange coupling of Cr3+-Cr3+ pairs [45]. The broadening of the peak at g ~ 1.96 with increasing Cr3+ concentration was also observed in Cr3+-containing phosphate glasses in the literature [62]. The presence of the magnetic interactions between Cr3+ ions at high concentrations was consistent with the discussion of the PL spectra, where the broad shoulder peak developed around 780 nm with increasing Cr3+ concentration (Figure 6a).
Since it was difficult to directly deduce the detailed local environment from the ESR signals, the local environment of isolated Cr3+ ions is discussed here using MD. The O-Cr-O bond angles of CrO6 octahedra in α-Al2O3 and ordered LiAl5O8 obtained in MD are tabulated in Table S2 in Supplementary Materials.
In α-Al2O3, Cr3+ was considered to be placed in a trigonal symmetry as suggested by McClure experimentally [63], which was also reproduced in our MD [39]. The previous literature referred to the rhombic distortion for CrO6 in LiAl5O8 with C2 symmetry [19,45]. Our MD result indicated that Cr3+ was arranged in a monoclinic symmetry that retained a single two-fold axis passing through the midpoints of O1 and O3, and of O5 and O6 (Figure 9b), and the two-fold axis is illustrated on the O1-O3-O6-O5 plane (c). Because of the complexity of the structure, including the disordered arrangement of cations and the presence of vacancies on the anion sites, MD for ALFO has not yet been performed; the local environment around Cr3+ in ALFO was inferred to be similar to that in LiAl5O8, but even more disordered.

4. Conclusions

Fluorine-doped lithium aluminate (ALFO) was prepared from LiF and Al2O3 at a ratio of 1:2. ALFO was a fluorine-doped form of LiAl5O8 with slightly lithium-rich compositions. The concentration of the incorporated fluorine was dependent on the preparation conditions; the chemical composition varied from Al4.69 Li1.31 F0.28 O7.55 prepared at 1100 °C to Al4.83 Li1.17 F0.10 O7.78 prepared at 1300 °C. ALFO and LiAl5O8 were isostructural with respect to having a spinel-type lattice and they were in a disorder–order relationship, where the regular arrangement of Li+ and Al3+ in ordered LiAl5O8 was disordered to a random arrangement with a slight preference of Li+ on the octahedral sites. The structural difference between ALFO and LiAl5O8 resulted in the different PL spectra for Cr3+. Cr3+ in ALFO showed deep red emission at around 700 nm, as did Cr3+ in LiAl5O8, but the peaks broadened. This was attributed to the disordered arrangement of Li+ and Al3+ on the adjacent cation sites, which led to ununiform local distortion of the CrO6 octahedra.
In conclusion, a new host material was proposed for deep red phosphors with the luminescent center Cr3+ excited by visible rays of blue (~410 nm) and green (~570 nm) light. This work revealed that the structural modification with a small amount of dopant (in this case, fluorine) led to variations in the luminescence properties and enhancement of PL even for the common lattice structure.

Supplementary Materials

The following supporting information can be downloaded at: https://www.mdpi.com/article/10.3390/ma17020338/s1, Figure S1: XRD patters of aluminum lithium fluoride oxide (ALFO) samples prepared at 1100 °C, 1200 °C, and 1300 °C; Figure S2: The result of the Rietveld analysis for non-doped ALFO sample (Al4.73Li1.27F0.17O7.65) prepared at 1200 °C; Figure S3: Perspective view of the crystal structures of ordered LiAl5O8 (a) and aluminum lithium fluoride oxide (ALFO) (b) in the range x = 0.2 to 0.6 along <100>, illustrating the difference in the arrangement of the tetrahedra and the octahedra in these host materials; Figure S4: XRD patterns of aluminum lithium fluoride oxide (ALFO) samples prepared at 1200 °C with different Cr3+ concentrations; Figure S5: XRD patterns of aluminum lithium fluoride oxide (ALFO) samples prepared at different temperatures: Figure S6: Comparison of XRD patterns of disordered spinel (ALFO), ordered spinel (LiAl5O8), and partially ordered LiAl5O8 prepared by quenching from 1400 °C; Table S1: The structural parameters refined in the Rietveld analysis for non-doped ALFO sample (Al4.73Li1.27F0.17O7.65) prepared at 1200 °C; Table S2: Bond angles in CrO6 octahedra in α-Al2O3 and ordered LiAl5O8 after relaxation by MD; Table S3: Assignment of the ESR peaks of the polycrystalline sample of Cr3+ in α-Al2O3.

Author Contributions

Conceptualization, Y.M.; methodology, Y.M., T.T. and M.K.; software, R.H.; validation, Y.M., T.T., M.K., H.K. and K.H.; formal analysis, Y.K., M.K. and Y.M.; investigation, Y.K., M.K., K.U., T.S. and Y.M.; resources, Y.M., H.K., K.H. and M.K.; data curation, Y.K., T.T., M.K. and Y.M.; writing—original draft preparation, Y.K.; writing—review and editing, T.T., M.K., H.K., K.H. and Y.M.; visualization, Y.K., R.H. and Y.M.; supervision, Y.M.; project administration, Y.M.; funding acquisition, Y.M. and K.H. All authors have read and agreed to the published version of the manuscript.

Funding

This research was funded by KAKENHI (20K05658) and the Cooperative Research Project of Research Center for Biomedical Engineering (2021 #2012).

Institutional Review Board Statement

Not applicable.

Informed Consent Statement

Not applicable.

Data Availability Statement

Data are available from the corresponding author upon reasonable request.

Acknowledgments

The authors thank Toshiba Nanoanalysis Co. for contract analysis of the chemical compositions.

Conflicts of Interest

The funders had no role in the design of the study; in the collection, analyses, or interpretation of data; in the writing of the manuscript; or in the decision to publish the results.

Appendix A

According to the previous literature [19,40,41,42], LiAl5O8 underwent the phase transition between the low-temperature ordered (II) and high-temperature disordered (I) forms at 1295 °C. However, in our experiments, quenching of LiAl5O8 samples prepared from Li2CO3 and α-Al2O3 into liquid nitrogen from 1400 °C did not result in the fully disordered phase of LiAl5O8. The quenching resulted in partial Al3+ and Li+ disorder and reduced the peak intensity originating from the cation ordering, indicated by ▼ in Figure 1 and Figure S6 in Supplementary Materials. Figure S6 in Supplementary Materials compares the XRD patterns of ordered LiAl5O8 prepared at 1400 °C, partially ordered LiAl5O8 quenched from 1400 °C, and ALFO. The reason that disordered LiAl5O8 was not obtained in this work was that the samples were not started from the nitrate gel precursor [19,40,41,42], and/or a highly sensitive semiconductor X-ray detector, which is supposed to achieve diffraction intensities 100 times higher than those of conventional scintillation counters [64], was used.
ALFO is similar to disordered LiAl5O8 with respect to the random distribution of Li+ and Al3+ on the tetrahedral and octahedral cation sites; the incorporation of fluorine from the starting material LiF specifically leads to disorder in the Al and Li arrangement in ALFO.

Appendix B

According to de Biasi [59], the ESR peaks of a polycrystalline α-Al2O3:Cr3+ sample occur at θ ≈ 40° and 90°, the angle (θ) between the direction of the applied magnetic field and the z axis. From the angle dependence of the ESR signal of a Cr3+-doped α-Al2O3 single crystal [51], the peaks were assigned as shown in Table S3 in Supplementary Materials.

References

  1. Uheda, K.; Hirosaki, N.; Yamamoto, Y.; Naito, A.; Nakajima, T.; Yamamoto, H. Luminescence properties of a red phosphor, CaAlSiN3:Eu2+, for white light-emitting diodes. Electrochem. Solid-State Lett. 2006, 9, H22–H25. [Google Scholar] [CrossRef]
  2. Piao, X.; Machida, K.; Horikawa, T.; Hanzawa, H.; Shimomura, Y.; Kijima, N. Preparation of CaAlSiN3:Eu2+ phosphors by the self-propagating high-temperature synthesis and their luminescent properties. Chem. Mater. 2007, 19, 4592–4599. [Google Scholar] [CrossRef]
  3. Kim, H.S.; Horikawa, T.; Hanzawa, H.; Machida, K. Luminescence properties of CaAlSiN3:Eu2+ mixed nitrides prepared by carbothermal process. J. Phys. Conf. Ser. 2012, 379, 012016. [Google Scholar] [CrossRef]
  4. Daicho, H.; Shinomiya, Y.; Enomoto, K.; Nakano, A.; Sawa, H.; Matsuishi, S.; Hosono, H. A novel red-emitting K2Ca(PO4)F:Eu2+ phosphor with a large Stokes shift. Chem. Commun. 2018, 54, 884–887. [Google Scholar] [CrossRef] [PubMed]
  5. Kamimura, M. Recent progress of near-infrared fluorescence in vivo bioimaging in the second and third biological window. Anal. Sci. 2021, 37, 691–697. [Google Scholar] [CrossRef] [PubMed]
  6. Gil, H.M.; Price, T.W.; Chelani, K.; Bouillard, J.-S.G.; Calaminus, S.D.J.; Stasiuk, G.J. NIR-quantum dots in biomedical imaging and their future. iScience 2021, 24, 102189. [Google Scholar] [CrossRef] [PubMed]
  7. Piwoński, H.; Nozue, S.; Habuchi, S. The pursuit of shortwave infrared-emitting nanoparticles with bright fluorescence through molecular design and excited-state engineering of molecular aggregates. ACS Nanosci. Au 2022, 2, 253–283. [Google Scholar] [CrossRef] [PubMed]
  8. Congiu, M.; Alamiry, M.; Moudam, O.; Ciorba, S.; Richardson, P.R.; Maron, L.; Jones, A.C.; Richards, B.S.; Robertson, N. Preparation and photophysical studies of [Ln(hfac)3DPEPO], Ln = Eu, Tb, Yb, Nd, Gd; interpretation of total photoluminescence quantum yields. Dalton Trans. 2013, 42, 13537–13545. [Google Scholar] [CrossRef]
  9. Tamatani, M. Luminescence centers of transition metal ions. In Phosphor Handbook; Shionoya, S., Yen, W.M., Eds.; CRC Press: Boca Raton, FL, USA, 1999; pp. 153–176. [Google Scholar]
  10. Sijbom, H.F.; Verstraete, R.; Joos, J.J.; Poelman, D.; Smet, P.F. K2SiF6:Mn4+ as a red phosphor for displays and warm-white LEDs: A review of properties and perspectives. Opt. Mater. Exp. 2017, 7, 3332–3365. [Google Scholar] [CrossRef]
  11. Sankarasubramanian, K.; Devakumar, B.; Annadurai, G.; Sun, L.; Zeng, Y.-J.; Huang, X. Novel SrLaAlO4:Mn4+ deep-red emitting phosphors with excellent responsiveness to phytochrome PFR for plant cultivation LEDs: Synthesis, photoluminescence properties, and thermal stability. RSC Adv. 2018, 8, 30223–30229. [Google Scholar] [CrossRef]
  12. Sun, Q.; Wang, S.; Devakumar, B.; Li, B.; Sun, L.; Liang, J.; Chen, D.; Huang, X. Novel far-red-emitting SrGdAlO4:Mn4+ phosphors with excellent responsiveness to phytochrome PFR for plant growth lighting. RSC Adv. 2018, 8, 39307–39313. [Google Scholar] [CrossRef] [PubMed]
  13. Luchechko, A.; Vasyltsiv, V.; Zhydachevskiyy, Y.; Kushlyk, M.; Ubizskii, S.; Suchocki, A. Luminescence spectroscopy of Cr3+ ions in bulk single crystalline β-Ga2O3. J. Phys. D Appl. Phys. 2020, 53, 354001. [Google Scholar] [CrossRef]
  14. Wood, D.L.; Imbusch, G.F.; Macfarlane, R.M.; Kisliuk, P.; Larkin, D.M. Optical spectrum of Cr3+ ions in spinels. J. Chem. Phys. 1968, 48, 5255–5263. [Google Scholar] [CrossRef]
  15. Derkosch, J.; Mikenda, W.; Preisinger, A. N-lines and chromium-pairs in the luminescence spectra of the spinels ZnAl2O4:Cr3+ and MgAl2O4:Cr3+. J. Solid State Chem. 1977, 22, 127–133. [Google Scholar] [CrossRef]
  16. Brik, M.G.; Papan, J.; Jovanović, D.J.; Dramićanin, M.D. Luminescence of Cr3+ ions in ZnAl2O4 and MgAl2O4 spinels: Correlation between experimental spectroscopic studies and crystal field calculations. J. Lumin. 2016, 177, 145–151. [Google Scholar] [CrossRef]
  17. Tran, M.T.; Trung, D.Q.; Tu, N.; Anh, D.D.; Thu, L.T.H.; Du, N.V.; Quang, N.V.; Huyen, N.T.; Kien, N.D.T.; Viet, D.X.; et al. Single-phase far-red-emitting ZnAl2O4:Cr3+ phosphor for application in plant growth LEDs. J. Alloys Compd. 2021, 884, 161077. [Google Scholar] [CrossRef]
  18. Lin, Y.; Wu, H.; Wang, C.; Zhang, J.; Yao, Q.; Wu, S.; Hu, Y. Co-precipitation synthesis of ZnAl2O4:Cr3+ phosphor for better light penetration in pc-LED. J. Mater. Sci. Mater. Electron. 2022, 33, 19871–19883. [Google Scholar] [CrossRef]
  19. Pott, G.T.; McNicol, B.D. Luminescence of Cr3+ ions in ordered and disordered LiAl5O8. J. Solid State Chem. 1973, 7, 132–137. [Google Scholar] [CrossRef]
  20. Khaidukov, N.M.; Nikonov, K.S.; Brekhovskikh, M.N.; Kirikova, N.Y.; Kondratyuk, V.A.; Makhov, V.N. Low-temperature luminescence of lithium aluminate spinel LiAl5O8 doped with chromium ions. Inorg. Mater. 2022, 58, 751–763. [Google Scholar] [CrossRef]
  21. Sevast’yanov, B.K.; Sviridov, D.T.; Orekhova, V.P.; Pasternak, L.B.; Sviridova, R.K.; Veremeichik, T.F. Optical absorption spectrum of excited Cr3+ ions in yttrium aluminum garnet. Sov. J. Quantum Electron. 1973, 2, 339. [Google Scholar] [CrossRef]
  22. Yamaga, M.; Henderson, B.; O’Donnell, K.P.; Yue, G. Temperature dependence of the lifetime of Cr3+ luminescence in garnet crystals. Appl. Phys. B 1990, 51, 132–136. [Google Scholar] [CrossRef]
  23. Głuchowski, P.; Pązik, R.; Hreniak, D.; Stręk, W. Luminescence properties of Cr3+:Y3Al5O12 nanocrystals. J. Lumin. 2009, 129, 548–553. [Google Scholar] [CrossRef]
  24. Martín-Rodríguez, R.; Valiente, R.; Rodríguez, F.; Bettinelli, M. Temperature and pressure dependence of the optical properties of Cr3+-doped Gd3Ga5O12 nanoparticles. Nanotechnology 2011, 22, 265707. [Google Scholar] [CrossRef] [PubMed]
  25. Wood, D.L.; Ferguson, J.; Knox, K.; Dillon, J.F., Jr. Crystal-field spectra of d3,7 ions. III. Spectrum of Cr3+ in various octahedral crystal fields. J. Chem. Phys. 1963, 39, 890–898. [Google Scholar] [CrossRef]
  26. Skvortsova, V.; Mironova-Ulmane, N.; Trinkler, L.; Merkulov, V. Optical properties of natural and synthetic beryl crystals. IOP Conf. Ser. Mater. Sci. Eng. 2015, 77, 012034. [Google Scholar] [CrossRef]
  27. Liu, G.; Molokeev, M.S.; Xia, Z. Structural rigidity control toward Cr3+-based broadband near-infrared luminescence with enhanced thermal stability. Chem. Mater. 2022, 34, 1376–1384. [Google Scholar] [CrossRef]
  28. Rajendran, V.; Fang, M.-H.; Huang, W.-T.; Majewska, N.; Lesniewski, T.; Mahlik, S.; Leniec, G.; Kaczmarek, S.M.; Pang, W.K.; Peterson, V.K.; et al. Chromium ion pair luminescence: A strategy in broadband near-infrared light-emitting diode design. J. Am. Chem. Soc. 2021, 143, 19058–19066. [Google Scholar] [CrossRef]
  29. Back, M.; Ueda, J.; Brik, M.G.; Lesniewski, T.; Grinberg, M.; Tanabe, S. Revisiting Cr3+-doped Bi2Ga4O9 spectroscopy: Crystal field effect and optical thermometric behavior of near-infrared-emitting singly-activated phosphors. ACS Appl. Mater. Interfaces 2018, 10, 41512–41524. [Google Scholar] [CrossRef]
  30. Zhou, J.; Xia, Z. Synthesis and near-infrared luminescence of La3GaGe5O16:Cr3+ phosphors. RSC Adv. 2014, 4, 46313–46318. [Google Scholar] [CrossRef]
  31. Zhao, F.Y.; Cai, H.; Zhang, S.Y.; Song, Z.; Liu, Q.L. Octahedron-dependent near-infrared luminescence in Cr3+-activated phosphors. Materialstoday Chem. 2022, 23, 100704. [Google Scholar] [CrossRef]
  32. Kobayashi, R.; Tamura, H.; Kamada, Y.; Kakihana, M.; Matsushima, Y. A new host compound of aluminum lithium fluoride oxide for deep red phosphors based on Mn4+, Fe3+ and Cr3+. ECS Trans. 2019, 88, 225–236. [Google Scholar] [CrossRef]
  33. Belov, S.F.; Abaeva, T.I.; Rozdin, I.A.; Varfolomeev, M.B. Reaction of Al2O3 with LiF. Inorg. Mater. 1984, 20, 1675–1676. [Google Scholar]
  34. Takahashi, H.; Takahashi, H.; Watanabe, K.; Kominami, H.; Hara, K.; Matsushima, Y. Fe3+ red phosphors based on lithium aluminates and an aluminum lithium oxyfluoride prepared from LiF as the Li Source. J. Lumin. 2017, 182, 53–58. [Google Scholar] [CrossRef]
  35. Wang, Q.; Liao, J.; Kong, L.; Qiu, B.; Li, J.; Huang, H.; Wen, H. Luminescence properties of a non-rare-earth doped oxyfluoride LiAl4O6F:Mn4+ red phosphor for solid-state lighting. J. Alloys Compd. 2019, 772, 499–506. [Google Scholar] [CrossRef]
  36. Izumi, F.; Momma, K. Three-dimensional visualization in powder diffraction. Solid State Phenom. 2007, 130, 15–20. [Google Scholar] [CrossRef]
  37. Momma, K.; Izumi, F. VESTA 3 for three-dimensional visualization of crystal, volumetric and morphology data. J. Appl. Crystallogr. 2011, 44, 1272–1276. [Google Scholar] [CrossRef]
  38. Kawamura, K. Environmental Nano-Mechanics·Molecular Simulations. Available online: https://kats-labo.jimdofree.com/mxdorto-mxdtricl/ (accessed on 25 December 2023).
  39. Ichikawa, J.; Kominami, H.; Hara, K.; Kakihana, M.; Matsushima, Y. Electronic structure calculation of Cr3+ and Fe3+ in phosphor host materials based on relaxed structures by molecular dynamics simulation. Technologies 2022, 10, 56. [Google Scholar] [CrossRef]
  40. Datta, R.K.; Roy, R. Phase transitions in LiAl5O8. J. Am. Ceram. Soc. 1963, 46, 388–390. [Google Scholar] [CrossRef]
  41. Pott, G.T.; McNicol, B.D. Zero-phonon transition and fine structure in the phosphorescence of Fe3+ ions in ordered and disordered LiAl5O8. J. Chem. Phys. 1972, 56, 5246–5254. [Google Scholar] [CrossRef]
  42. McNicol, B.D.; Pott, G.T. Luminescence of Mn ions in ordered and disordered LiAl5O8. J. Lumin. 1973, 6, 320–334. [Google Scholar] [CrossRef]
  43. Shannon, R.D. Revised effective ionic radii and systematic studies of interatomic distances in halides and chalcogenides. Acta Crystallogr. 1976, A32, 751–767. [Google Scholar] [CrossRef]
  44. Mironova-Ulmane, N.; Brik, M.G.; Grube, J.; Krieke, G.; Kemere, M.; Antuzevics, A.; Gabrusenoks, E.; Skvortsova, V.; Elsts, E.; Sarakovskis, A.; et al. EPR, optical and thermometric studies of Cr3+ ions in the α-Al2O3 synthetic single crystal. Opt. Mater. 2022, 132, 112859. [Google Scholar] [CrossRef]
  45. Singh, V.; Chakradhar, R.P.S.; Rao, J.L.; Kwak, H.-Y. Characterization, EPR and photoluminescence studies of LiAl5O8:Cr phosphors. Solid State Sci. 2009, 11, 870–874. [Google Scholar] [CrossRef]
  46. Tanabe, Y.; Sugano, S. On the absorption spectra of complex ions. I. J. Phys. Soc. Jpn. 1954, 9, 753–766. [Google Scholar] [CrossRef]
  47. Tanabe, Y.; Sugano, S. On the absorption spectra of complex ions II. J. Phys. Soc. Jpn. 1954, 9, 766–779. [Google Scholar] [CrossRef]
  48. Tanabe, Y.; Sugano, S. On the absorption spectra of complex ions, III the calculation of the crystalline field strength. J. Phys. Soc. Jpn. 1956, 11, 864–877. [Google Scholar] [CrossRef]
  49. Vink, A.P.; De Bruin, M.A.; Roke, S.; Peijzel, P.S.; Meijerink, A. Luminescence of exchange coupled pairs of transition metal ions. J. Electrochem. Soc. 2001, 148, E313–E320. [Google Scholar] [CrossRef]
  50. De Biasi, R.S.; Rodrigues, D.C.S. Influence of chromium concentration and particle size on the ESR linewidth of Al2O3:Cr3+ powders. J. Mater. Sci. 1981, 16, 968–972. [Google Scholar] [CrossRef]
  51. Wenzel, R.F.; Kim, Y.W. Linewidth of the electron paramagnetic resonance of (Al2O3)1−x(Cr2O3)x. Phys. Rev. 1965, 140, A1592–A1598. [Google Scholar] [CrossRef]
  52. Grant, W.J.C.; Strandberg, M.W.P. Line shapes of paramagnetic resonances of chromium in ruby. Phys. Rev. 1964, 135, A727–A739. [Google Scholar] [CrossRef]
  53. Manenkov, A.A.; Prokhorov, A.M. The fine structure of the spectrum of the paramagnetic resonance of the ion Cr3+ in Chromium corundum. Sov. Phys.-JETP 1955, 1, 611. [Google Scholar]
  54. Zaripov, M.M.; Shamonin, I.I. Paramagnetic resonance in synthetic ruby. Sov. Phys.-JETP 1956, 3, 171–175. [Google Scholar]
  55. Geusic, J.E. Paramagnetic fine structure spectrum of Cr+++ in a single ruby crystal. Phys. Rev. 1956, 102, 1252–1253. [Google Scholar] [CrossRef]
  56. Manenkov, A.A.; Prokhorov, A.M. Hyperfine structure of the paramagnetic resonance spectrum of 53Cr3+ in Al2O3. Sov. Phys.-JETP 1957, 4, 288–289. [Google Scholar]
  57. Zverev, G.M.; Prokhorov, A.M. Fine structure and hyperfine structure of paramagnetic resonance of Cr+++ in synthetic ruby. Sov. Phys.-JETP 1958, 7, 354–355. [Google Scholar]
  58. Schulz-Du Bois, E.O. Paramagnetic spectra of substituted sapphires–Part I: Ruby. Bell Syst. Tech. J. 1959, 38, 271–290. [Google Scholar] [CrossRef]
  59. De Biasi, R.S.; Rodrigues, D.C.S. Measurement of small concentrations of Cr and Fe in α-Al2O3 using electron spin resonance. J. Am. Ceram. Soc. 1985, 68, 409–412. [Google Scholar] [CrossRef]
  60. Orton, J.W. Electron Paramagnetic Resonance: An introduction to Transition Group Ions in Crystals; ILIFFE Book Ltd.: London, UK, 1968. [Google Scholar]
  61. Ardelean, I.; Ilonca, G.; Peteanu, M.; Barbos, E.; Indrea, E. EPR and magnetic susceptibility studies of xCr2O3-(1−x) 3B2O3-PbO glasses. J. Mater. Sci. 1982, 17, 1988–1996. [Google Scholar] [CrossRef]
  62. Landry, R.J.; Fournier, J.T.; Young, C.G. Electron spin resonance and optical absorption studies of Cr3+ in a phosphate glass. J. Chem. Phys. 1967, 46, 1285–1290. [Google Scholar] [CrossRef]
  63. McClure, D.S. Optical spectra of transition-metal ions in corundum. J. Chem. Phys. 1962, 36, 2757–2779. [Google Scholar] [CrossRef]
  64. Rigaku Co. Measurement of Trace Components Using D/teX Ultra. Available online: https://japan.rigaku.com/en/applications/bytes/xrd/miniflex/1302286925 (accessed on 25 December 2023).
Figure 1. Comparison of XRD patterns of ALFO:Cr3+ and LiAl5O8:Cr3+ prepared at 1200 °C. The peaks marked with ▼ are the extra peaks originating in the cation ordering of Li+ and Al3+ in the spinel-type lattice of LiAl5O8 (see text for details).
Materials 17 00338 g001
Figure 2. Crystal structures of (a) ordered LiAl5O8 and (b) aluminum lithium fluoride oxide (ALFO) after Rietveld analysis.
Materials 17 00338 g002
Figure 3. SEM images of aluminum lithium fluoride oxide (ALFO) (a,b) and LiAl5O8 (c,d). The preparation temperatures were 1200 °C for (a,c) and 1300 °C for (b,d).
Materials 17 00338 g003
Figure 4. Emission and excitation spectra of 0.5% Cr3+ in α-Al2O3 (a), LiAl5O8 (b), and ALFO (c).
Materials 17 00338 g004
Figure 5. Variation of PL spectra of ALFO:Cr3+ with preparation temperature. The emission peaks of α-Al2O3:Cr3+ and LiAl5O8:Cr3+ prepared at 1200 °C are also shown for comparison.
Materials 17 00338 g005
Figure 6. Emission peaks of ALFO:Cr3+ (a) and LiAl5O8:Cr3+ (b) as a function of Cr3+ concentration.
Materials 17 00338 g006
Figure 7. Internal and external quantum efficiencies of ALFO:Cr3+ and LiAl5O8:Cr3+ with different Cr3+ concentrations. QEInt and QEExt represent internal and external quantum efficiencies, respectively.
Materials 17 00338 g007
Figure 8. ESR signals of 0.5% Cr3+ in (a) α-Al2O3, (b) LiAl5O8, (c) ALFO prepared at 1200 °C, (d) ALFO prepared at 1300 °C, and (e) ALFO prepared at 1200 °C containing 2.5% Cr3+.
Materials 17 00338 g008
Figure 9. Local coordination environments reproduced by molecular dynamics simulations around Cr3+ in α-Al2O3 (a) and LiAl5O8 (b). (c) Two-fold axis is shown on the projected O1-O3-O6-O5 plane of the CrO6 octahedron in (b); note that the bond angles of O1-Cr-O5 (84.4°) and O3-Cr-O6 (84.5°) are not strictly coincident, reflecting thermal vibrations near the equilibrium position of each atom.
Materials 17 00338 g009
Table 1. Chemical compositions of the fluorine-doped lithium aluminate (ALFO) host material prepared at different temperatures.
Preparation TemperatureChemical Composition
1100 °CAl4.69 Li1.31 F0.28 O7.55
1200 °CAl4.73 Li1.27 F0.17 O7.65
1300 °CAl4.83 Li1.17 F0.10 O7.78
Disclaimer/Publisher’s Note: The statements, opinions and data contained in all publications are solely those of the individual author(s) and contributor(s) and not of MDPI and/or the editor(s). MDPI and/or the editor(s) disclaim responsibility for any injury to people or property resulting from any ideas, methods, instructions or products referred to in the content.

