
Biochar from Wood Chips and Corn Cobs for Adsorption of Thioflavin T and Erythrosine B


 ,
,  , ,
, ,  and
and 
Abstract
:1. Introduction
2. Materials and Methods
2.1. Biochar Preparation
2.2. Biochar Characterization
2.3. FFC NMR Data Elaboration
2.4. Adsorption Experiments
3. Results and Discussion
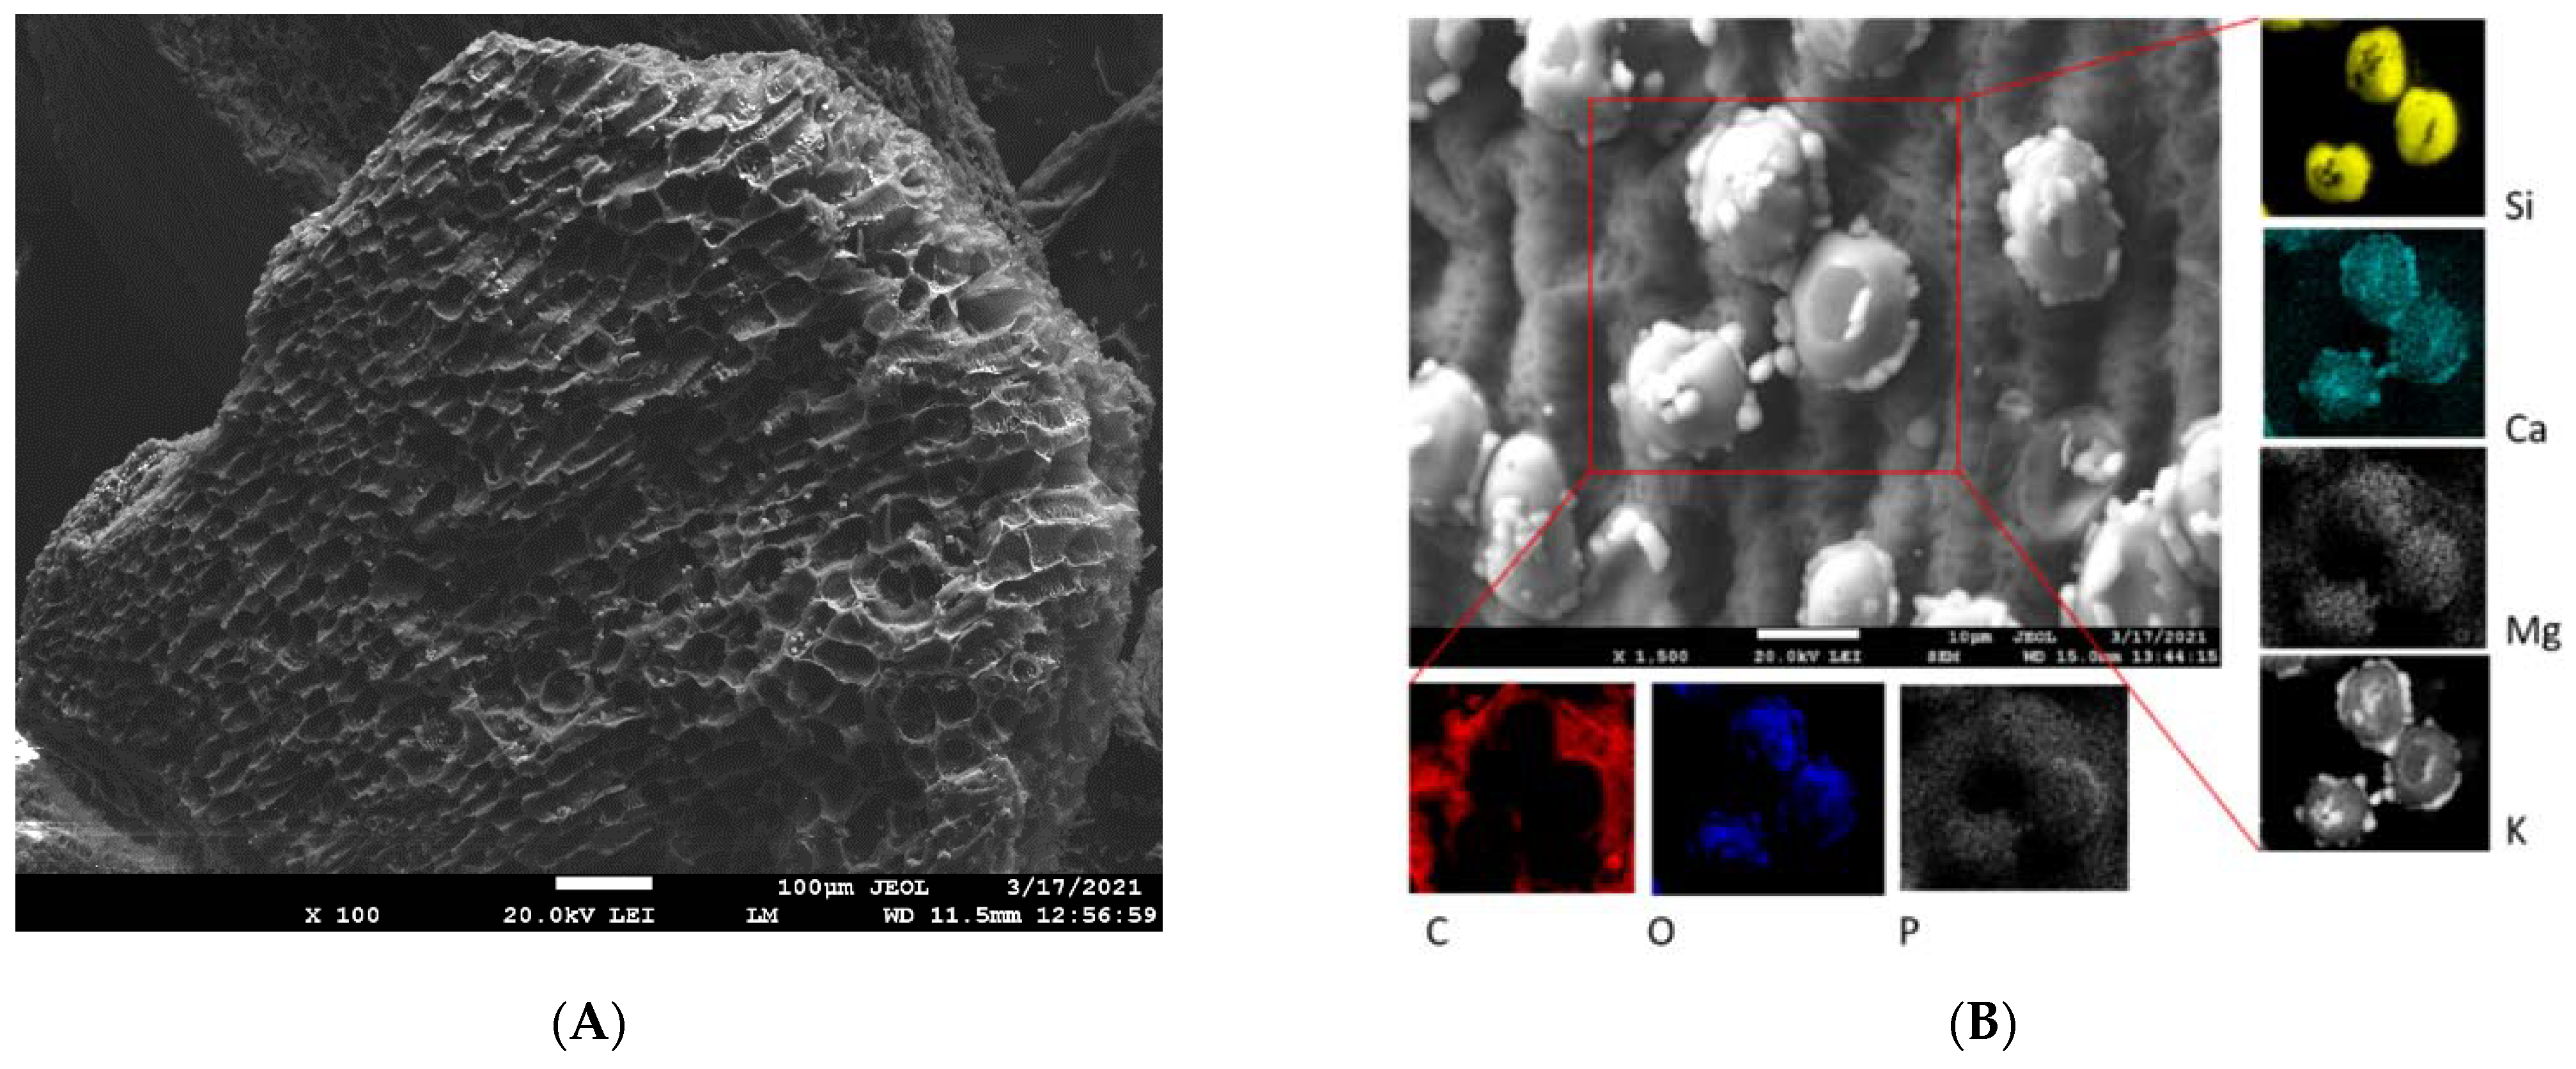
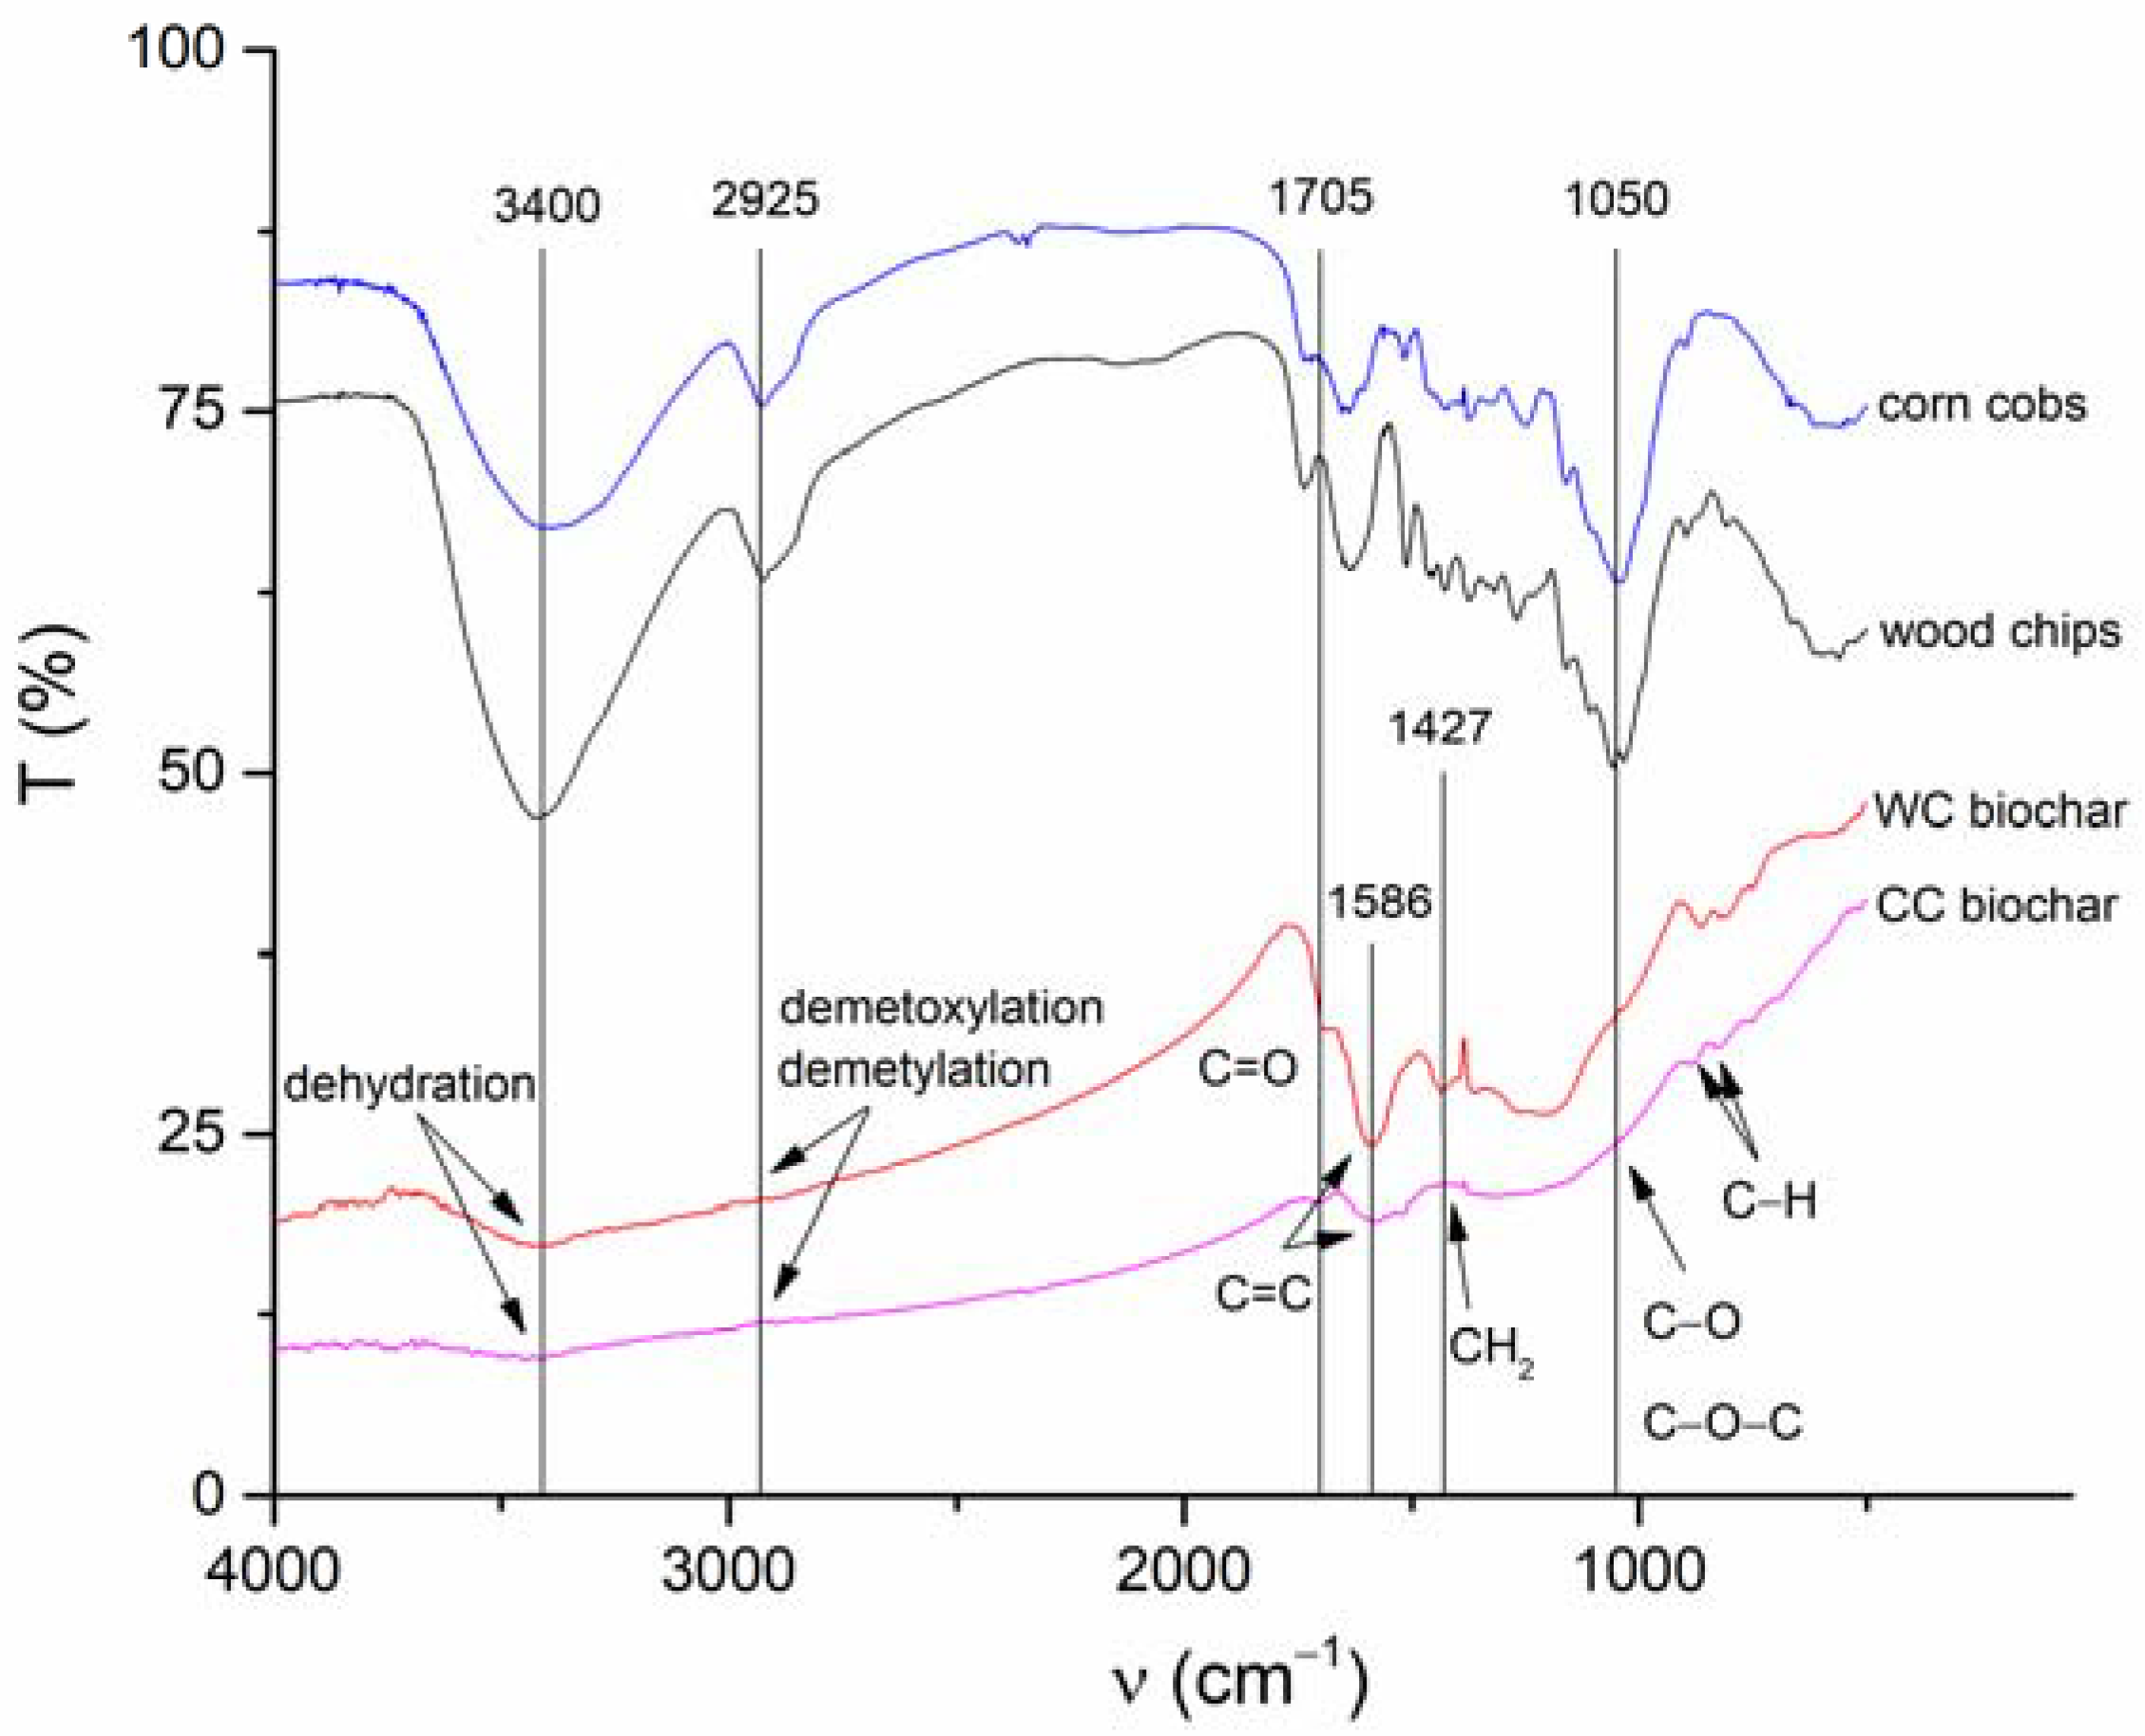
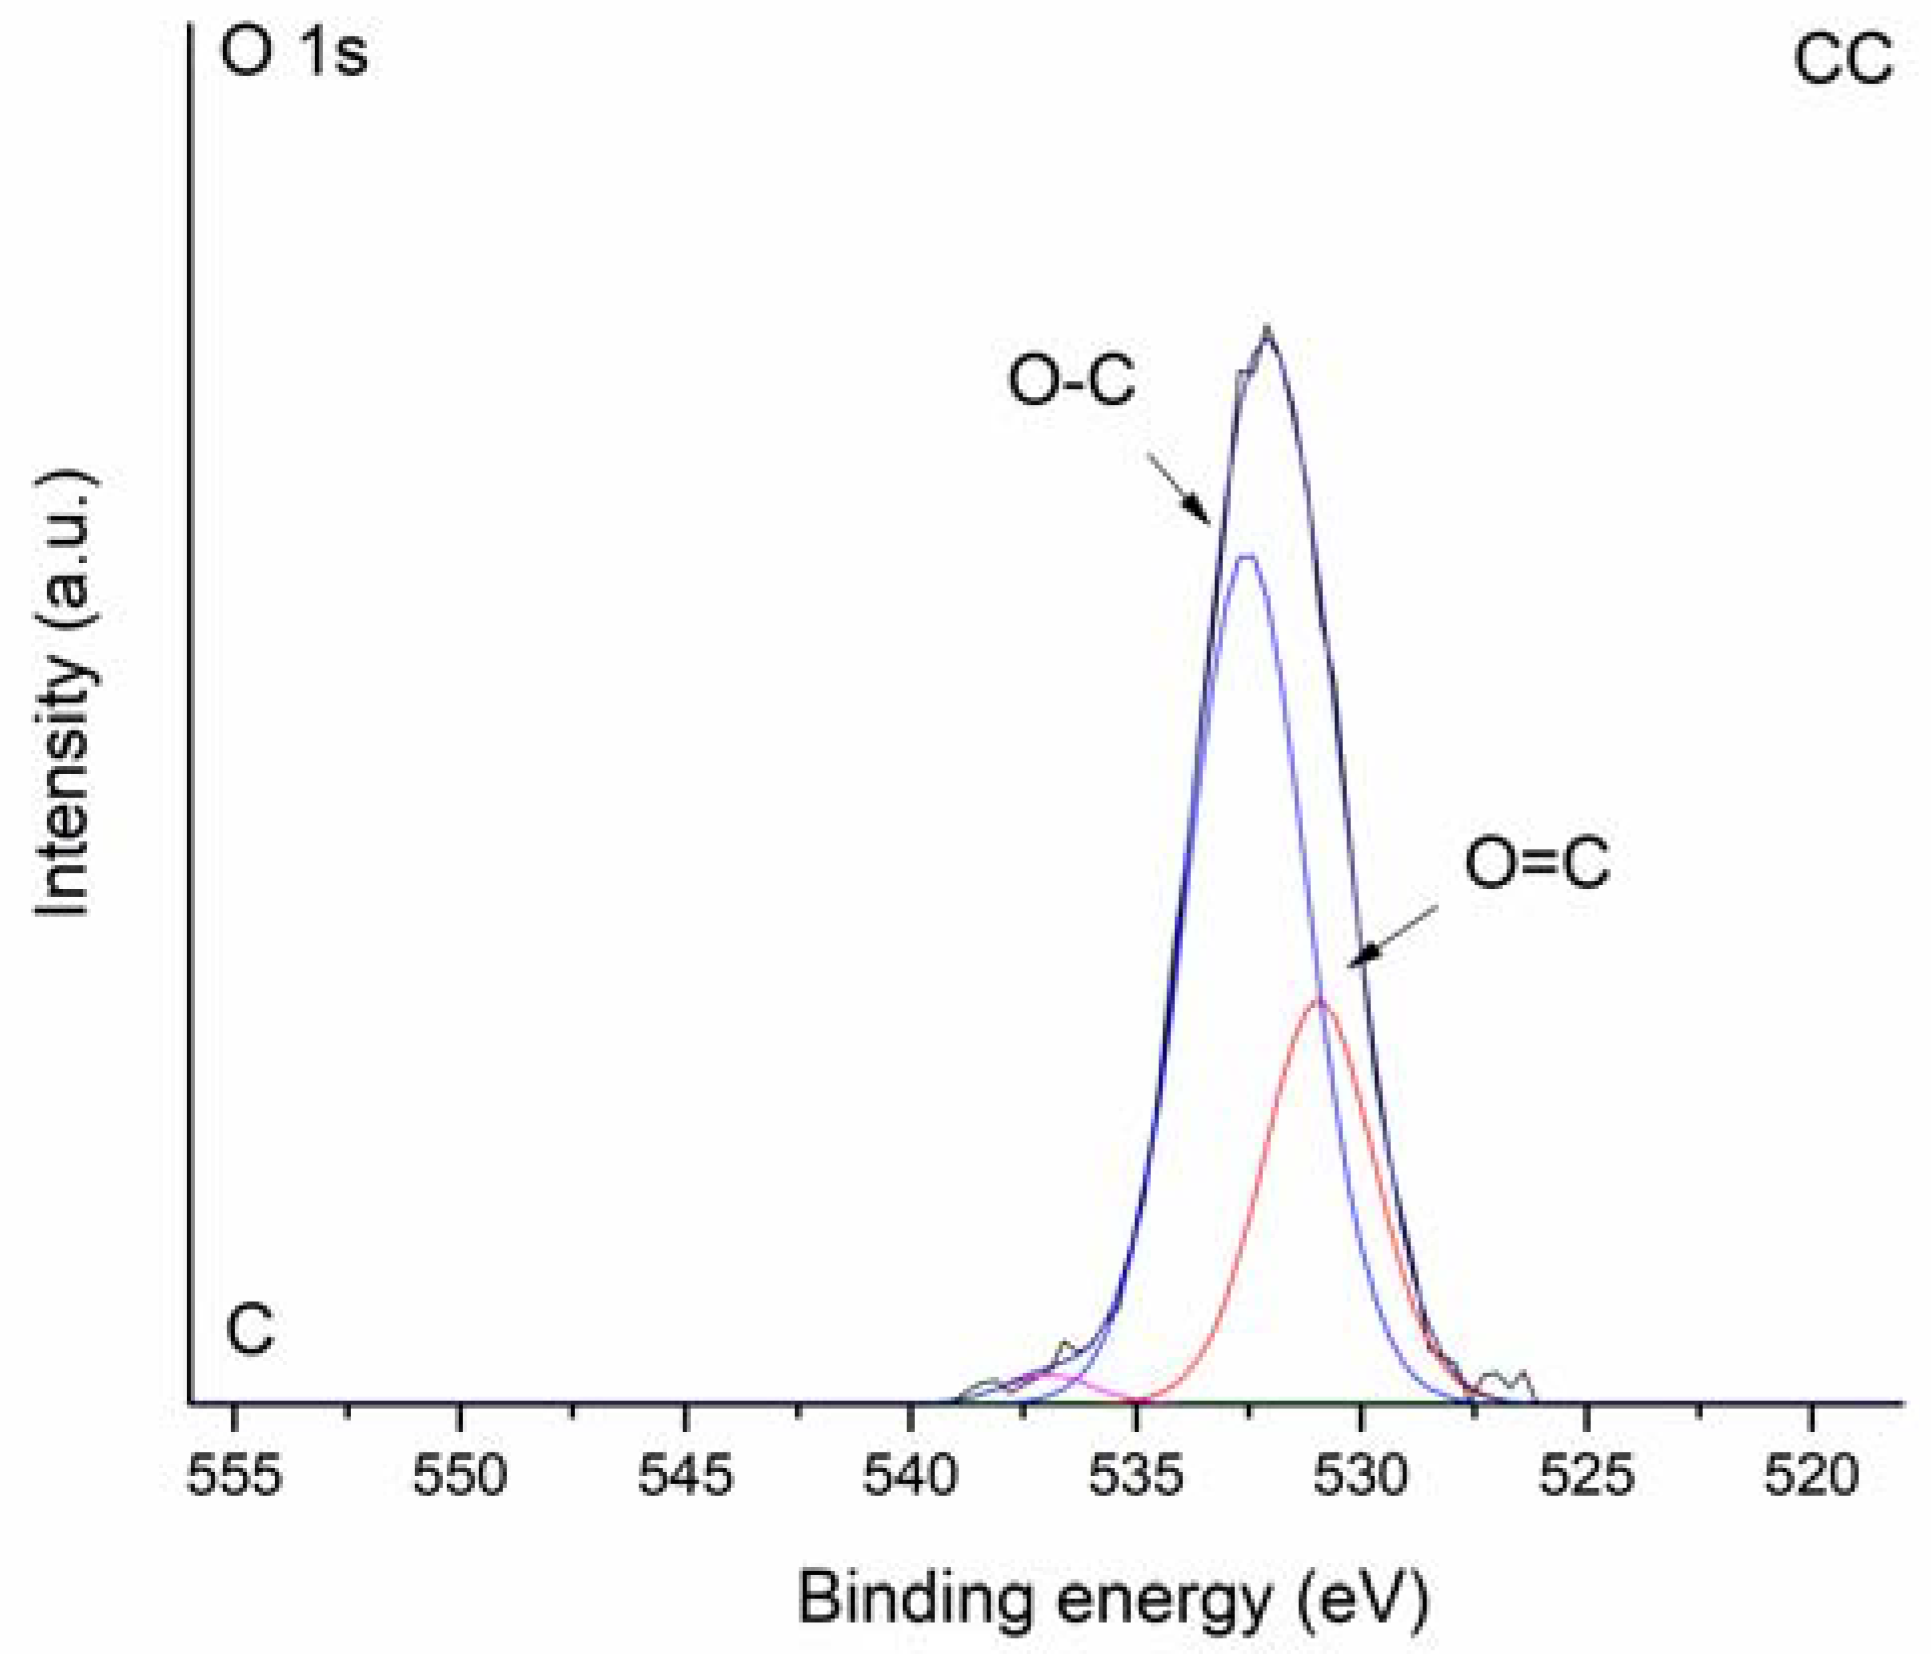
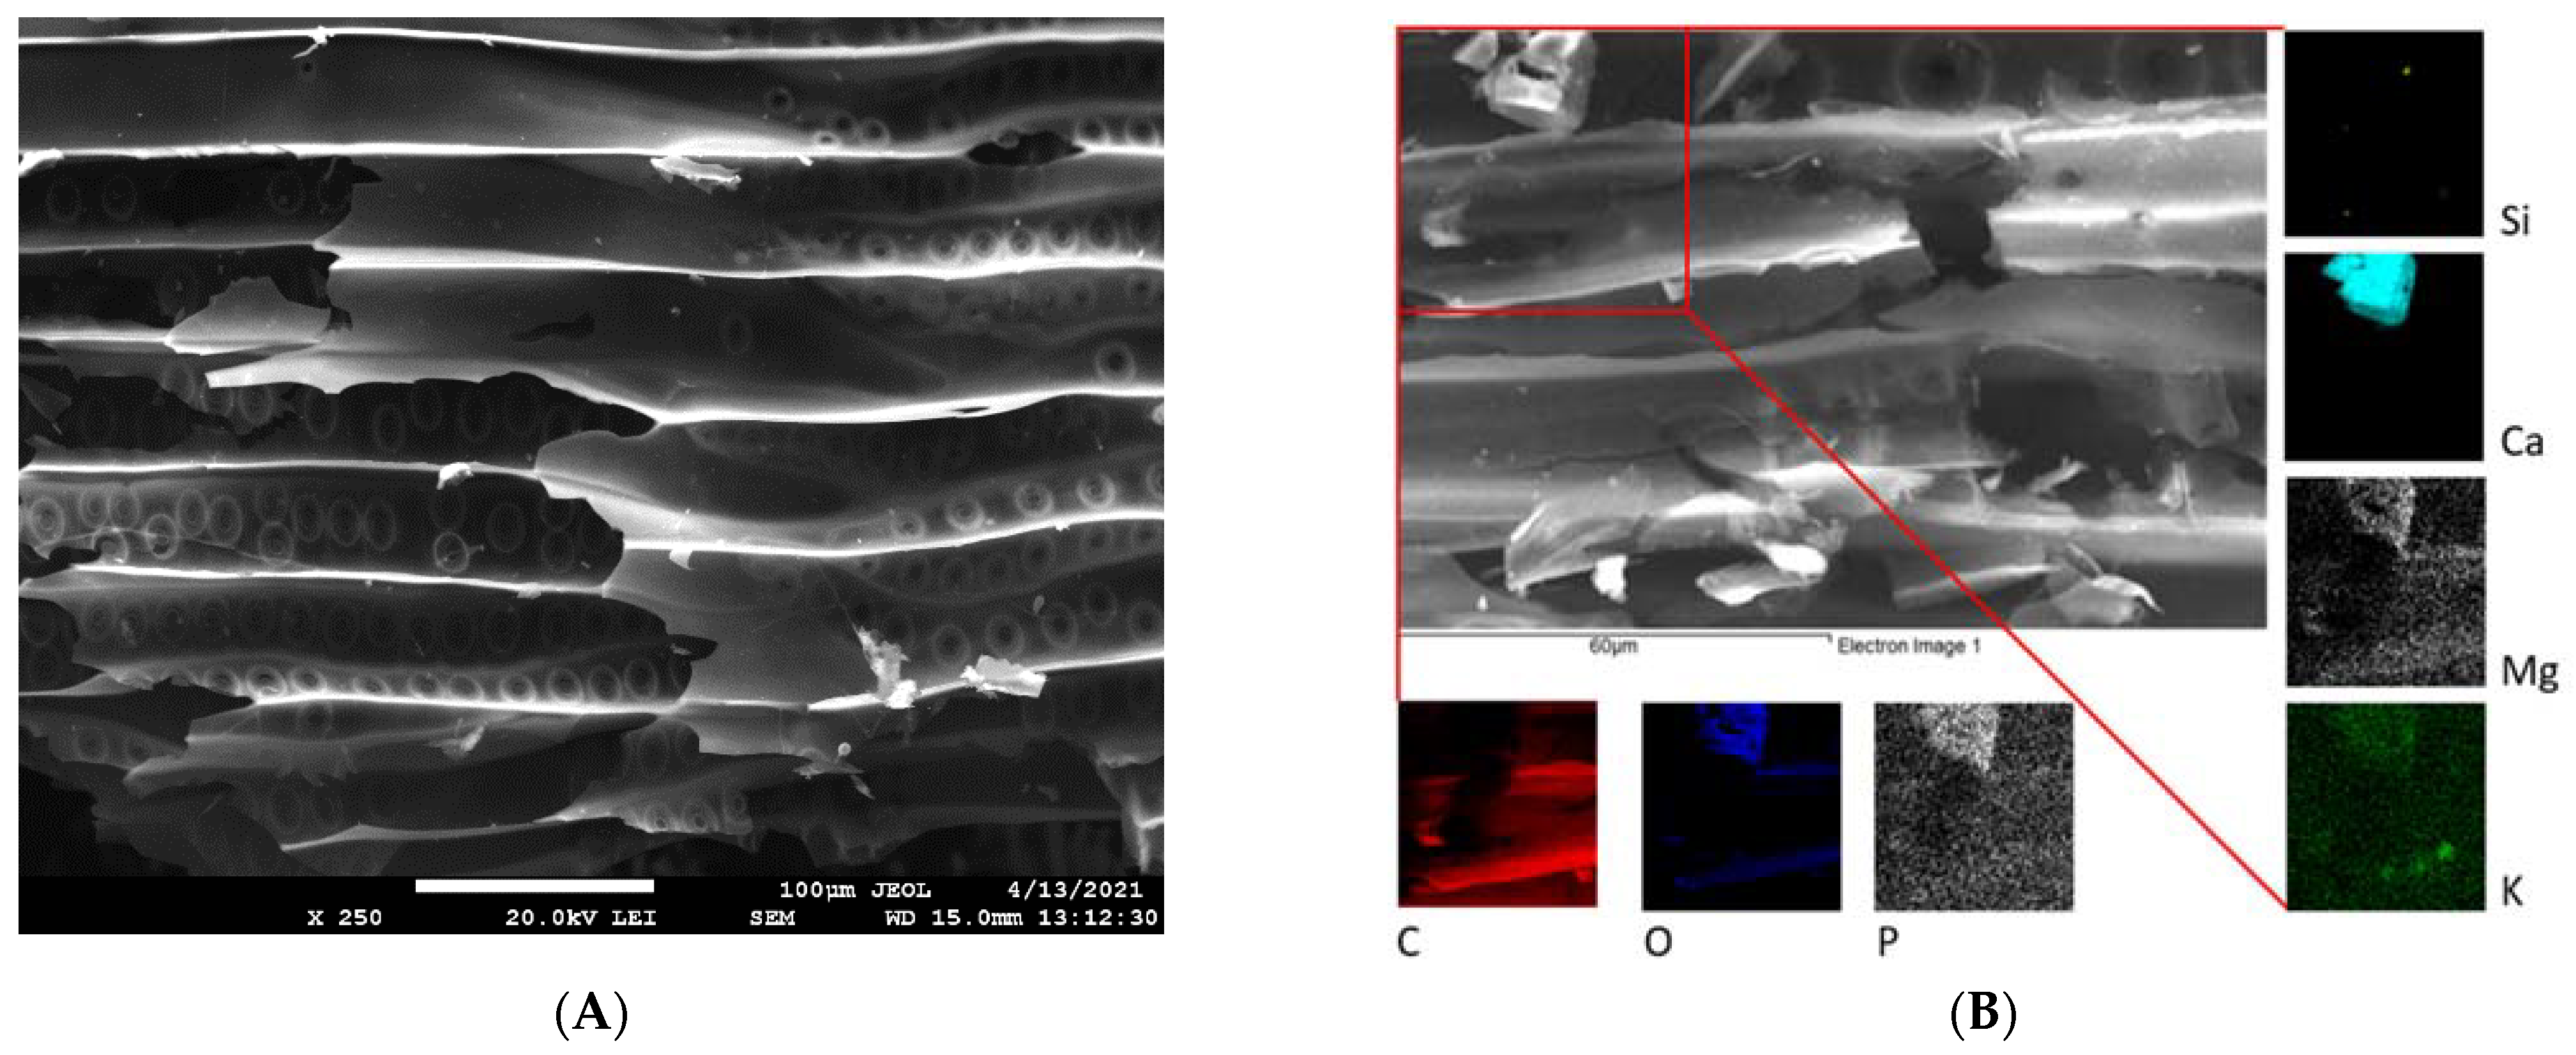
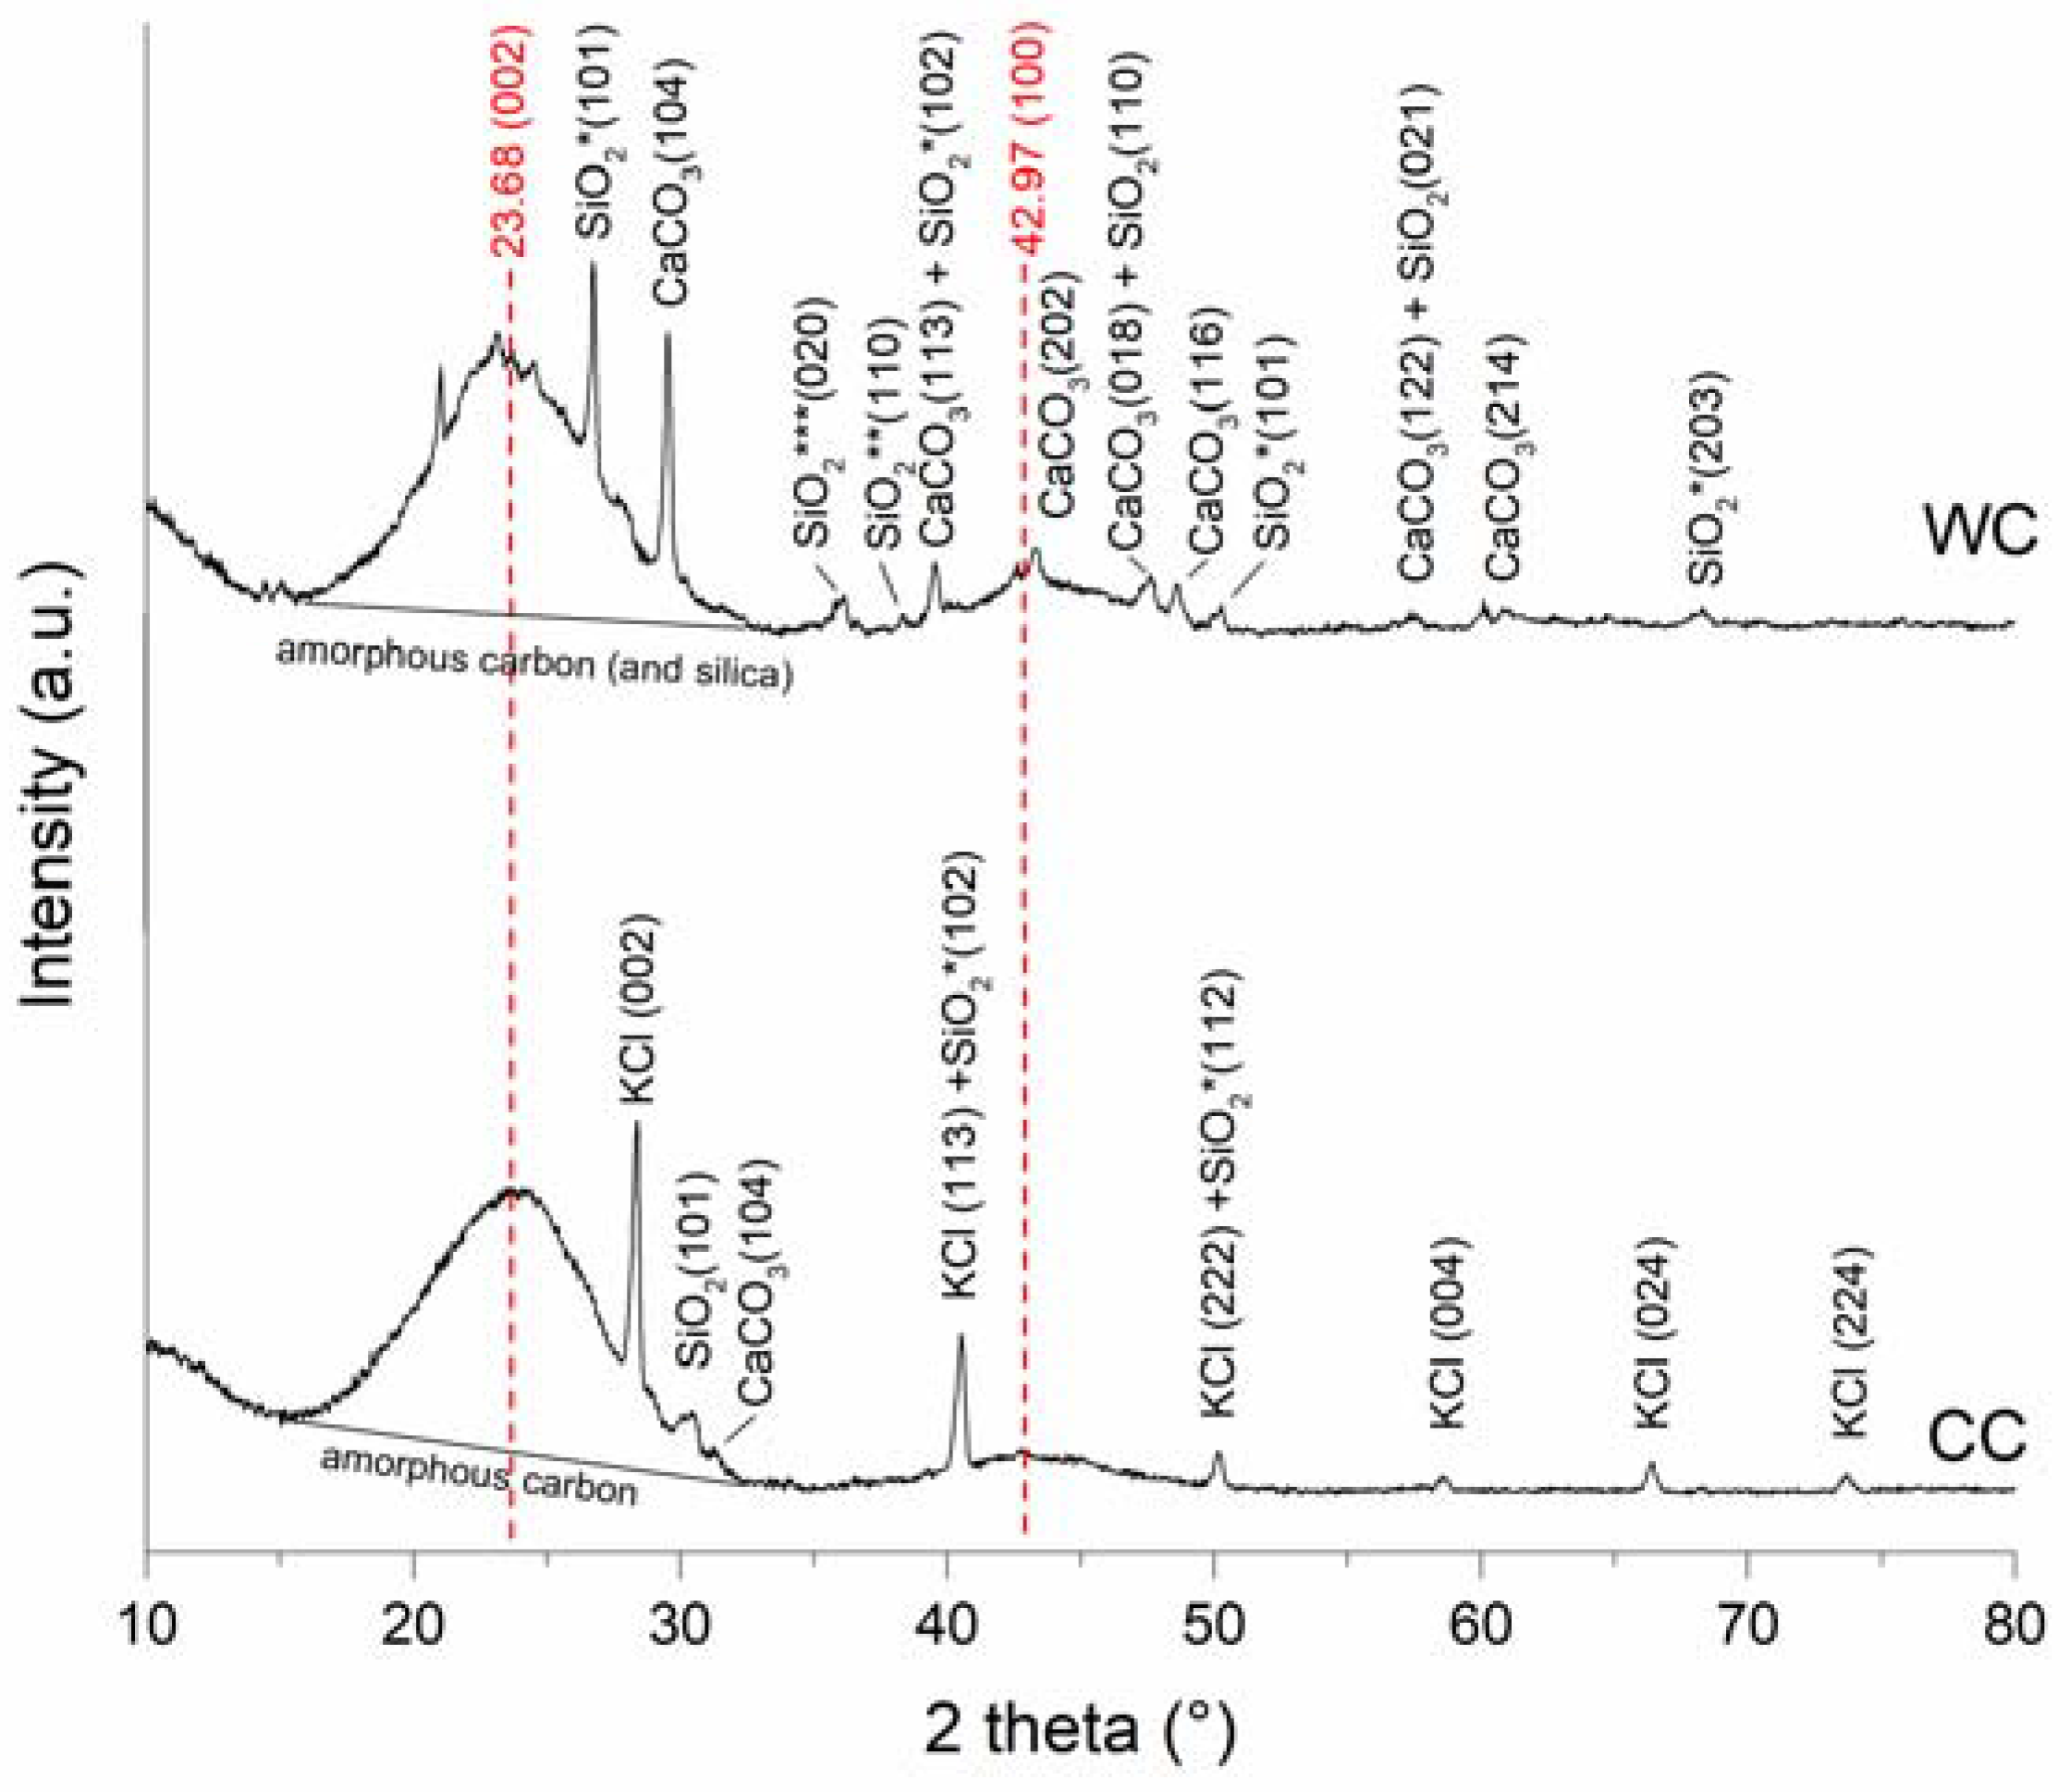
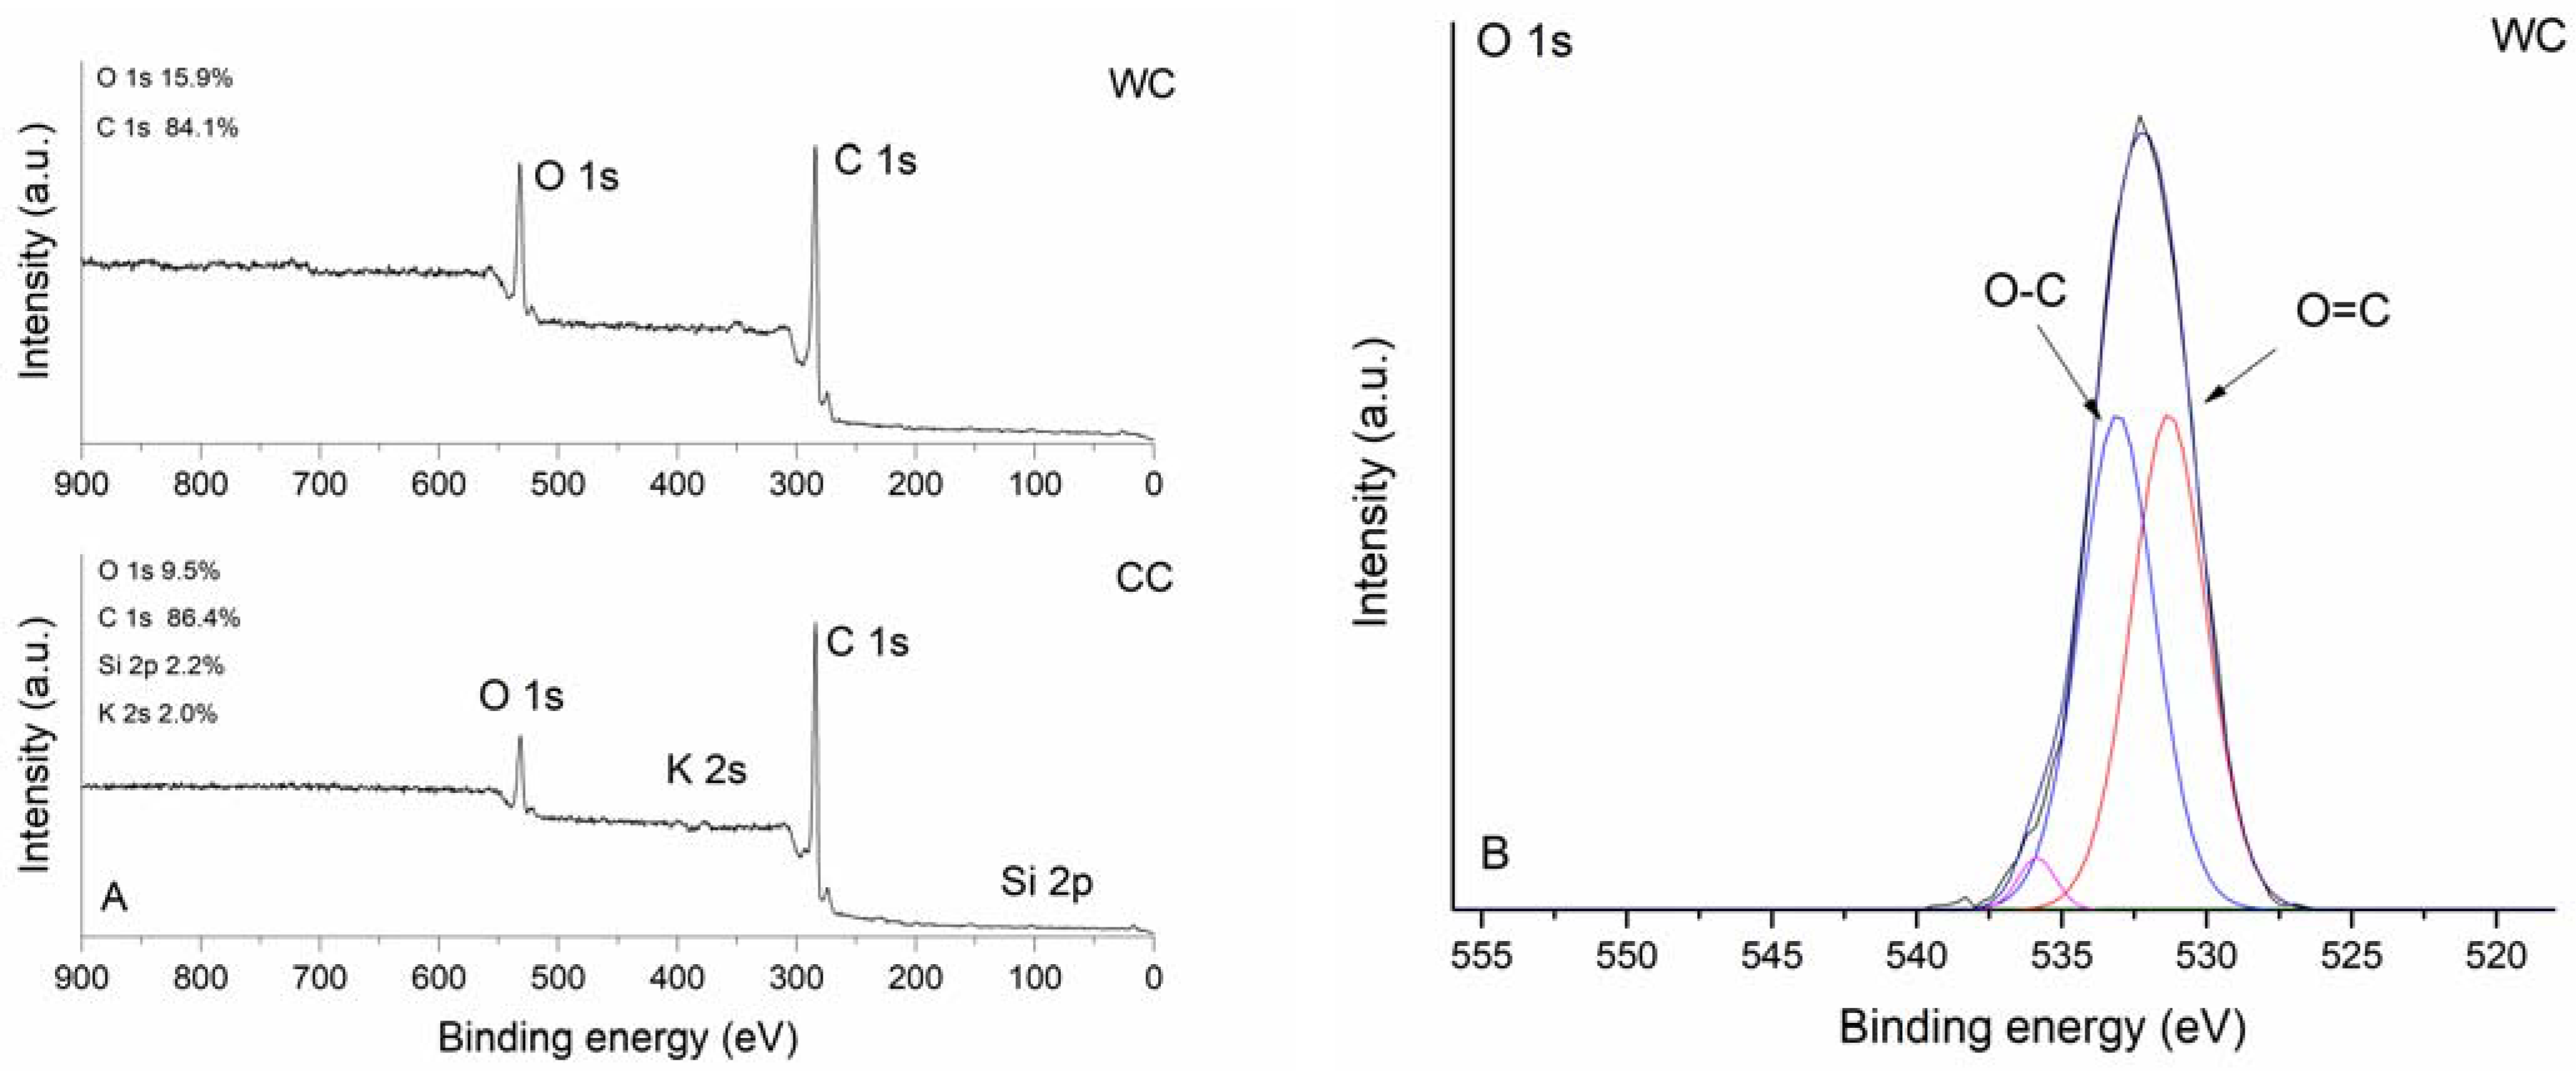
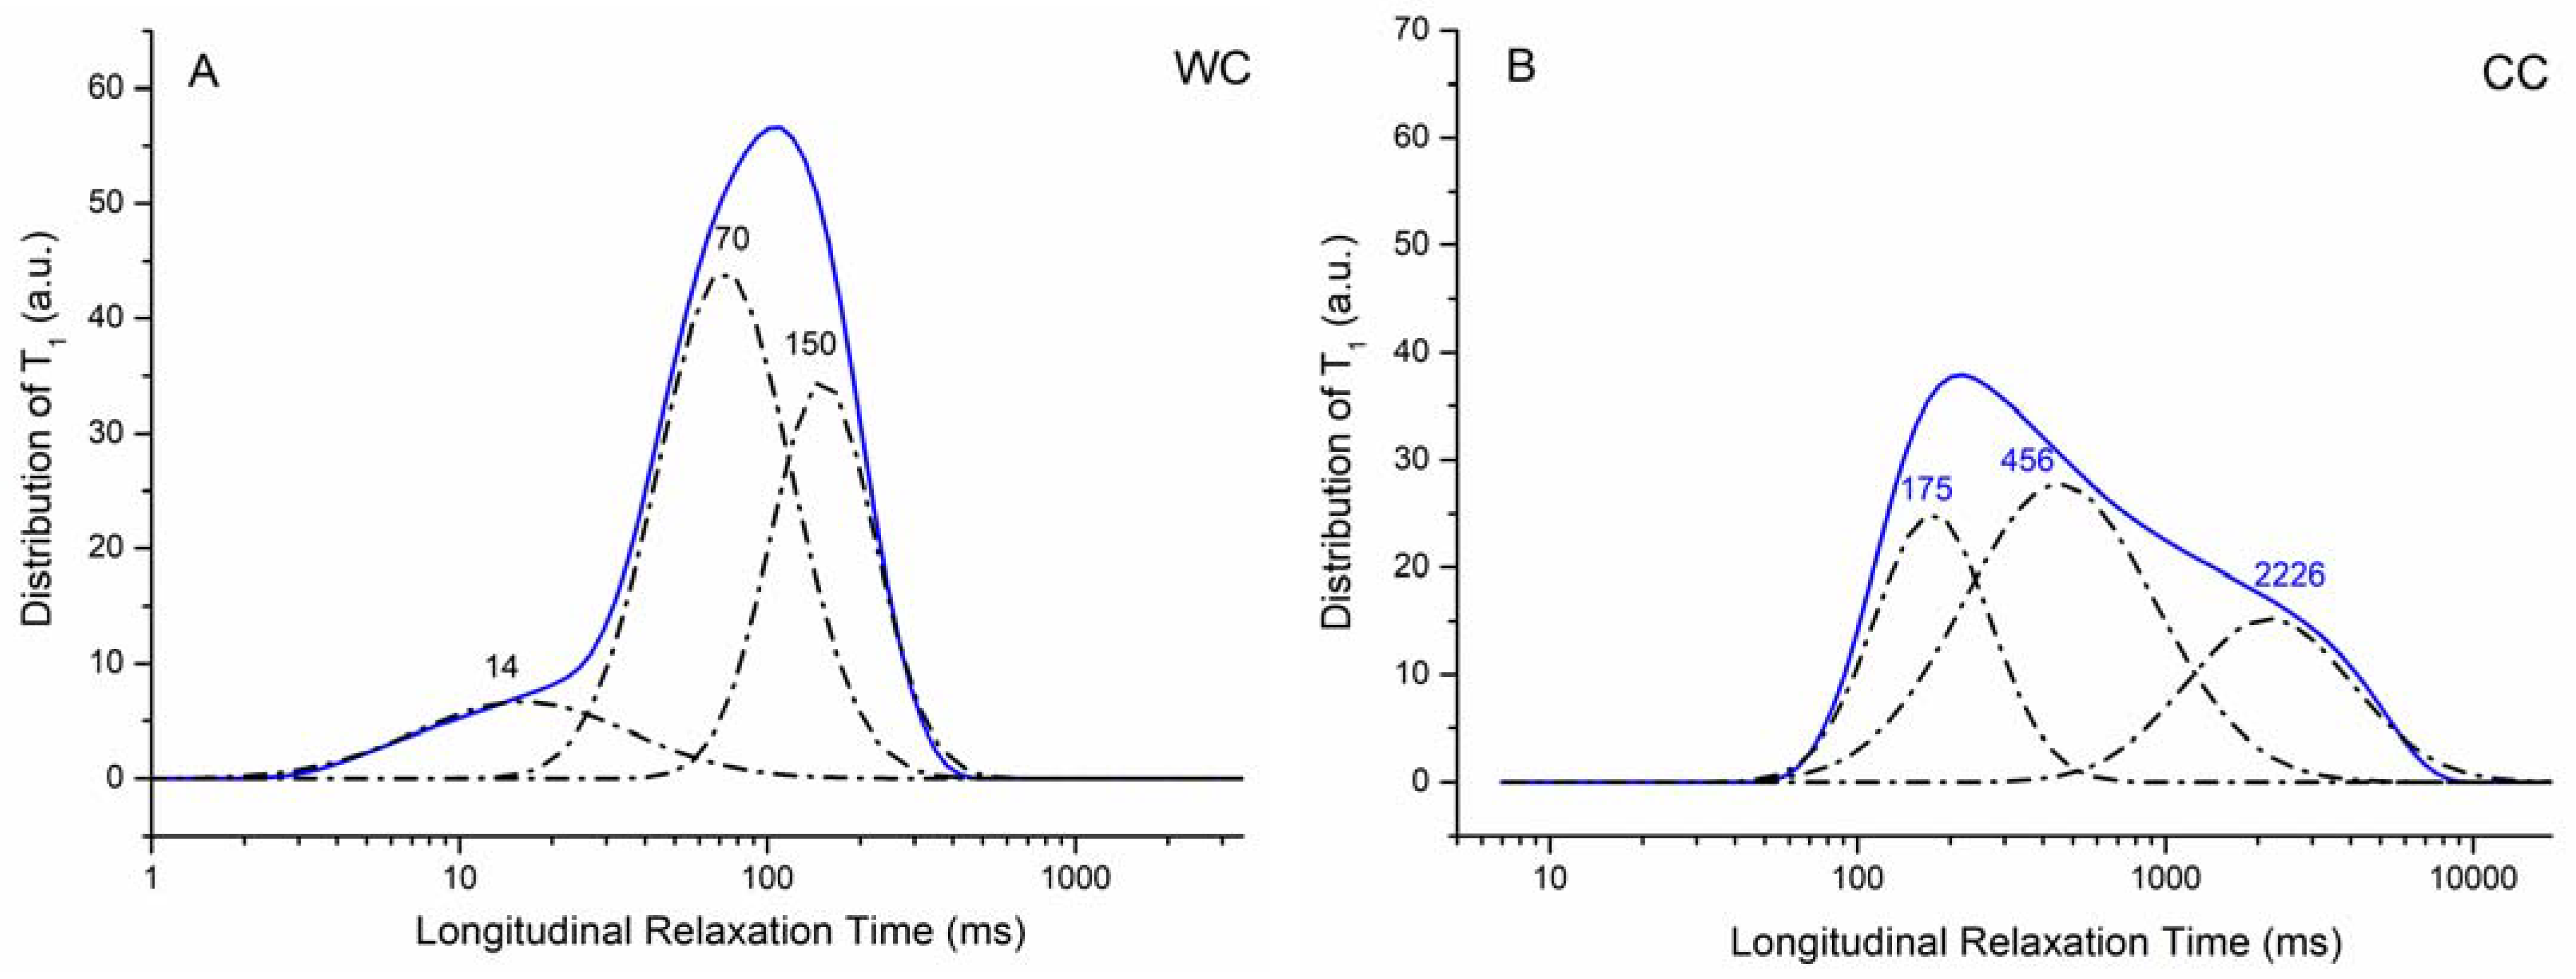
3.1. Properties of the WC and CC Biochars
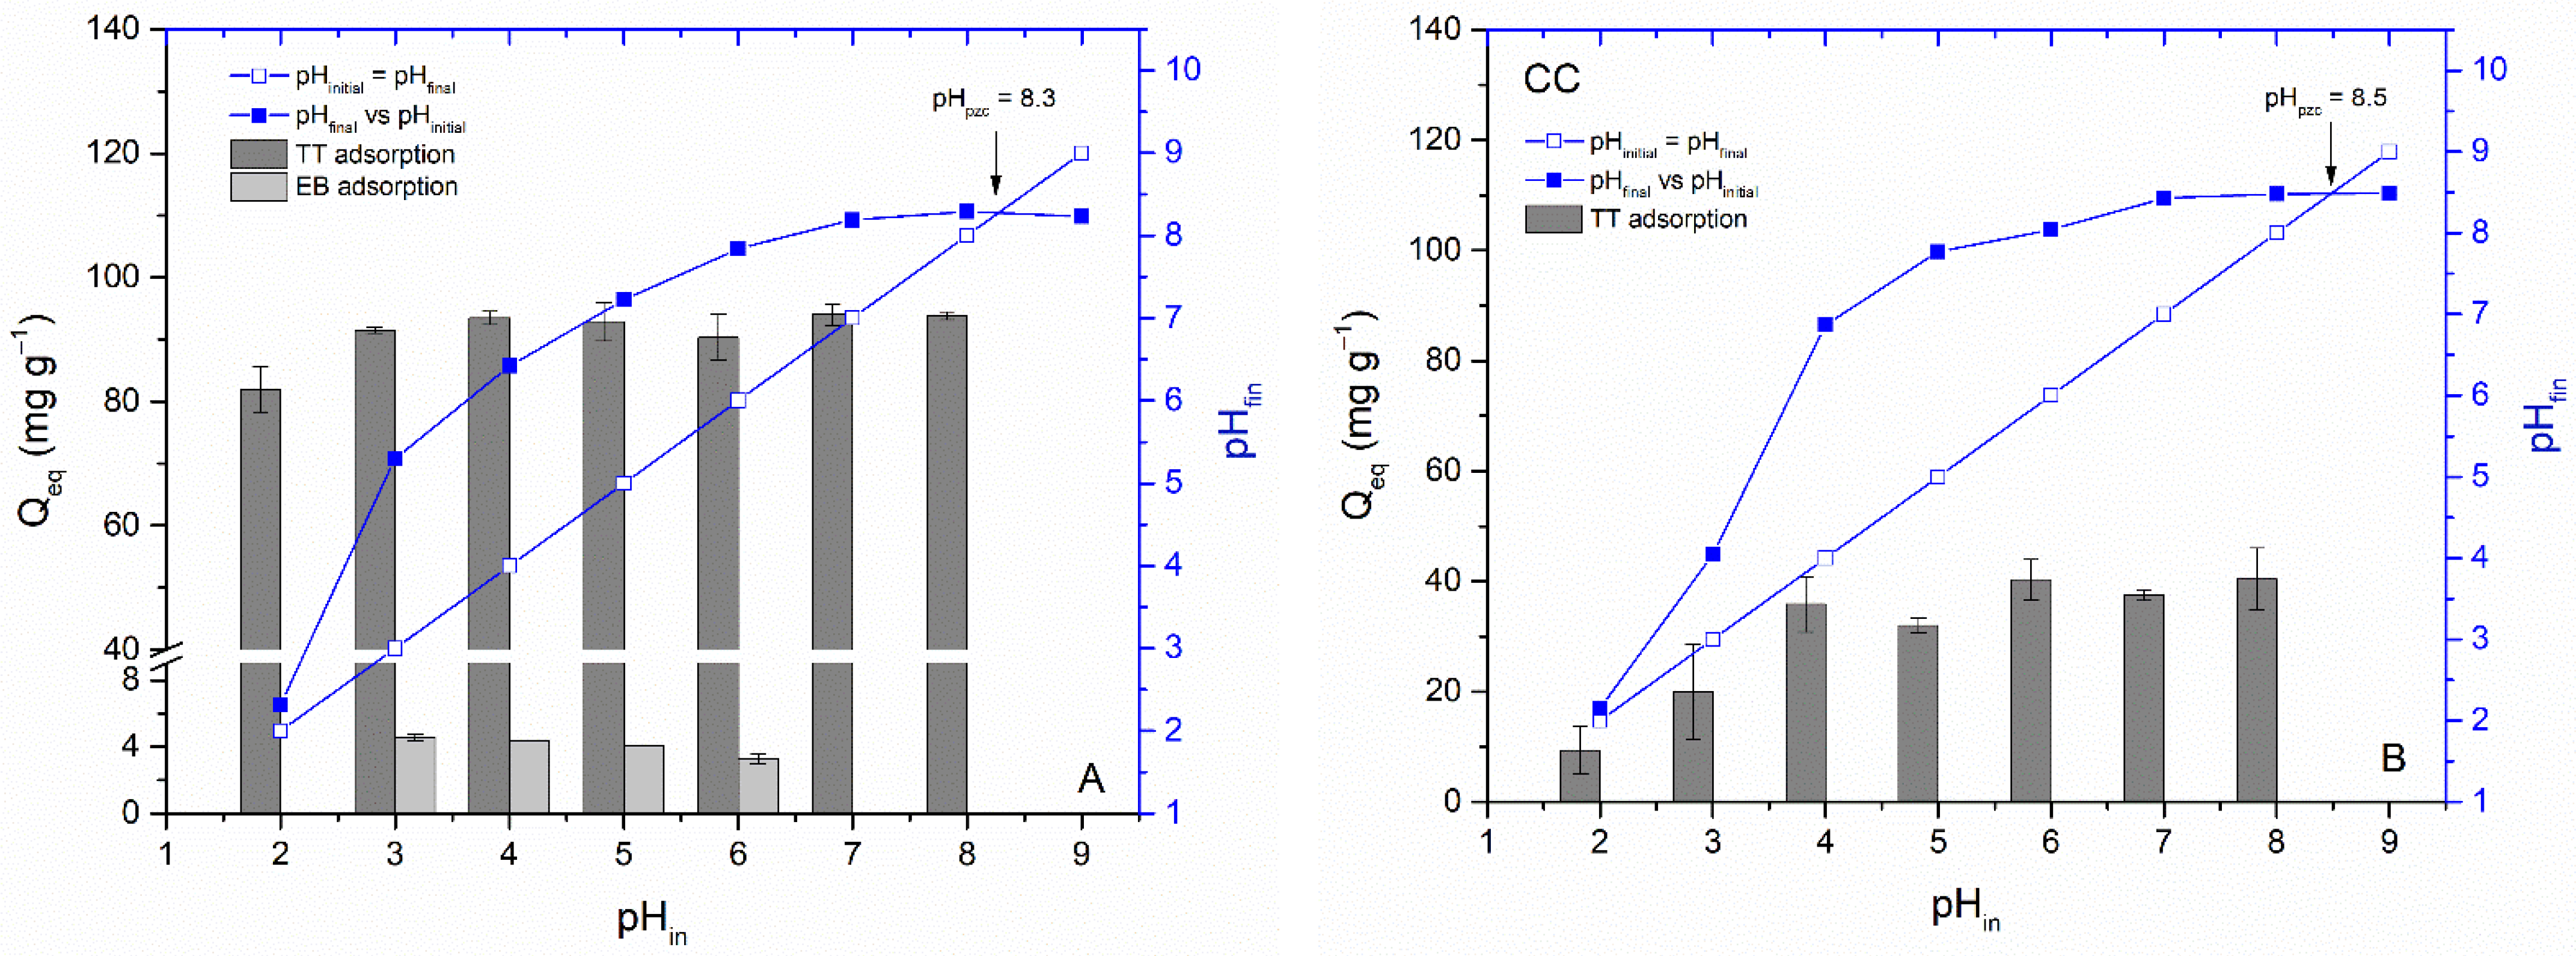
3.2. Erythrosine B and Thioflavin T Adsorption
3.3. Impact of Biochar Characteristics on Dye Removal
4. Conclusions
Author Contributions
Funding
Institutional Review Board Statement
Informed Consent Statement
Conflicts of Interest
References
- Grand View Research. Global Dyes & Pigments Market Size Report, 2021–2028. Available online: https://www.grandviewresearch.com/industry-analysis/dyes-and-pigments-market (accessed on 2 December 2021).
- Pereira, L.; Alves, M. Dyes—Environmental impact and remediation. In Environmental Protection Strategies for Sustainable Development; Malik, A., Grohmann, E., Eds.; Springer Science + Business Media B.V.: Dordrecht, The Netherlands, 2012; pp. 111–162. ISBN 978-94-007-1591-2. [Google Scholar]
- Selvam, K. Recent trends in agro-waste based activated carbons for the removal of emerging textile pollutants. Int. J. Environ. Anal. Chem. 2021; in press. [Google Scholar] [CrossRef]
- Hassan, M.M.; Carr, C.M. Biomass-derived porous carbonaceous materials and their composites as adsorbents for cationic and anionic dyes: A review. Chemosphere 2021, 265, 129087. [Google Scholar] [CrossRef] [PubMed]
- Velusamy, S.; Roy, A.; Sundaram, S.; Kumar Mallick, T. A Review on Heavy Metal Ions and Containing Dyes Removal Through Graphene Oxide-Based Adsorption Strategies for Textile Wastewater Treatment. Chem. Rec. 2021, 21, 1570–1610. [Google Scholar] [CrossRef]
- Pipíška, M.; Valica, M.; Partelová, D.; Horník, M.; Lesný, J.; Hostin, S. Removal of Synthetic Dyes by Dried Biomass of Freshwater Moss Vesicularia Dubyana: A Batch Biosorption Study. Environments 2018, 5, 10. [Google Scholar] [CrossRef] [Green Version]
- Dias, A.A.; Sampaio, A.; Bezerra, R.M. Environmental Applications of Fungal and Plant Systems: Decolourisation of Textile Wastewater and Related Dyestuffs. In Environmental Bioremediation Technologies; Singh, S.N., Tripathi, R.D., Eds.; Springer: Berlin/Heidelberg, Germany, 2007; pp. 445–463. ISBN 978-3-540-34790-3. [Google Scholar]
- Chowdhury, M.F.; Khandaker, S.; Sarker, F.; Islam, A.; Rahman, M.T.; Awual, M.R. Current treatment technologies and mechanisms for removal of indigo carmine dyes from wastewater: A review. J. Mol. Liq. 2020, 318, 114061. [Google Scholar] [CrossRef]
- Ramos, M.D.N.; Santana, C.S.; Velloso, C.C.V.; da Silva, A.H.M.; Magalhães, F.; Aguiar, A. A review on the treatment of textile industry effluents through Fenton processes. Process Saf. Environ. Prot. 2021, 155, 366–386. [Google Scholar] [CrossRef]
- Uddin, M.J.; Ampiaw, R.E.; Lee, W. Adsorptive removal of dyes from wastewater using a metal-organic framework: A review. Chemosphere 2021, 284, 131314. [Google Scholar] [CrossRef]
- Islam, A.; Teo, S.H.; Taufiq-Yap, Y.H.; Ng, C.H.; Vo, D.-V.N.; Ibrahim, M.L.; Hasan, M.M.; Khan, M.A.R.; Nur, A.S.M.; Awual, M.R. Step towards the sustainable toxic dyes and heavy metals removal and recycling from aqueous solution- A comprehensive review. Resour. Conserv. Recy. 2021, 175, 105849. [Google Scholar] [CrossRef]
- Pipíška, M.; Zarodňanská, S.; Horník, M.; Ďuriška, L.; Holub, M.; Šafařík, I. Magnetically functionalized moss biomass as biosorbent for efficient Co2+ ions and thioflavin T removal. Materials 2020, 13, 3619. [Google Scholar] [CrossRef]
- Al-Degs, Y.S.; Abu-El-Halawa, R.; Abu-Alrub, S.S. Analyzing adsorption data of erythrosine dye using principal component analysis. Chem. Eng. J. 2012, 191, 185–194. [Google Scholar] [CrossRef]
- Sharifzade, G.; Asghari, A.; Rajabi, M. Highly effective adsorption of xanthene dyes (rhodamine B and erythrosine B) from aqueous solutions onto lemon citrus peel active carbon: Characterization, resolving analysis, optimization and mechanistic studies. RSC Adv. 2017, 7, 5362–5371. [Google Scholar] [CrossRef] [Green Version]
- Dotto, G.L.; Pinto, L.A.A. Adsorption of food dyes acid blue 9 and food yellow 3 onto chitosan: Stirring rate effect in kinetics and mechanism. J. Hazard. Mater. 2011, 187, 164–170. [Google Scholar] [CrossRef] [PubMed]
- Apostol, L.C.; Smaranda, C.; Diaconu, M.; Gavrilescu, M. Preliminary ecotoxicological evaluation of erythrosin B and its photocatalytic degradation products. Environ. Eng. Manag. J. 2015, 14, 465–471. [Google Scholar] [CrossRef]
- Shin, W.S. Competitive sorption of anionic and cationic dyes onto cetylpyridinium- modified montmorillonite. J. Environ. Sci. Health A Tox. Hazard. Subst. Environ. Eng. 2008, 43, 1459–1470. [Google Scholar] [CrossRef] [PubMed]
- Lian, G.; Zhang, X.; Zhang, S.; Liu, D.; Cui, D.; Wang, Q. Controlled fabrication of ultrathin-shell BN hollow spheres with excellent performance in hydrogen storage and wastewater treatment. Energ. Environ. Sci. 2012, 5, 7072–7080. [Google Scholar] [CrossRef]
- Liu, X.; Tian, J.; Li, Y.; Sun, N.; Mi, S.; Xie, Y.; Chen, Z. Enhanced dyes adsorption from wastewater via Fe3O4 nanoparticles functionalized activated carbon. J. Hazard. Mater. 2019, 373, 397–407. [Google Scholar] [CrossRef]
- Conte, P.; Bertani, R.; Sgarbossa, P.; Bambina, P.; Schmidt, H.-P.; Raga, R.; Lo Papa, G.; Chillura Martino, D.F.; Lo Meo, P. Recent Developments in Understanding Biochar’s Physical–Chemistry. Agronomy 2021, 11, 615. [Google Scholar] [CrossRef]
- Kloss, S.; Zehetner, F.; Dellantonio, A.; Hamid, R.; Ottner, F.; Liedtke, V.; Schwanninger, M.; Gerzabek, M.H.; Soja, G. Characterization of Slow Pyrolysis Biochars: Effects of Feedstocks and Pyrolysis Temperature on Biochar Properties. J. Environ. Qual. 2012, 41, 990–1000. [Google Scholar] [CrossRef]
- Suliman, W.; Harsh, J.B.; Abu-Lail, N.I.; Fortuna, A.-M.; Dallmeyer, I.; Garcia-Pérez, M. The Role of Biochar Porosity and Surface Functionality in Augmenting Hydrologic Properties of a sandy Soil. Sci. Total Environ. 2017, 574, 139–147. [Google Scholar] [CrossRef]
- Vandit, V.; Sowmya, S.; Komalkant, A.; Sachin, P.; Vandana, S.; Girigan, G.; van der Voort, T.S.; Malarvizhi, P.; Yi, S.; Gebert, J.; et al. Review of Large-Scale Biochar Field-Trials for Soil Amendment and the Observed Influences on Crop Yield Variations. Front. Energy Res. 2021, 9, 499. [Google Scholar]
- Rogovska, N.; Laird, D.; Cruse, R.; Fleming, P.; Parkin, T.; Meek, D. Impact of Biochar on Manure Carbon Stabilization and Greenhouse Gas Emissions. Soil Sci. Soc. Am. J. 2011, 75, 871–879. [Google Scholar] [CrossRef] [Green Version]
- Vaccari, F.P.; Baronti, S.; Lugato, E.; Genesio, L.; Castaldi, S.; Fornasier, F.; Miglietta, F. Biochar as a Strategy to Sequester Carbon and Increase Yield in Durum Wheat. Eur. J. Agron. 2011, 34, 231–238. [Google Scholar] [CrossRef]
- Ballová, S.; Pipíška, M.; Frišták, V.; Ďuriška, L.; Horník, M.; Kaňuchová, M.; Soja, G. Pyrogenic carbon for decontamination of low-level radioactive effluents: Simultaneous separation of 137Cs and 60Co. Prog. Nucl. Energy 2020, 129, 103484. [Google Scholar] [CrossRef]
- Tokarčíková, M.; Motyka, O.; Peikertová, P.; Gabor, R.; Seidlerová, J. Magnetically Modified Biosorbent for Rapid Beryllium Elimination from the Aqueous Environment. Materials 2021, 14, 6610. [Google Scholar] [CrossRef] [PubMed]
- Alhashimi, H.A.; Aktas, C.B. Life cycle environmental and economic performance of biochar compared with activated carbon: A meta-analysis. Resour. Conserv. Recy. 2017, 118, 13–26. [Google Scholar] [CrossRef] [Green Version]
- Li, G.; Zhu, W.; Zhang, C.; Zhang, S.; Liu, L.; Zhu, L.; Zhao, W. Effect of a magnetic field on the adsorptive removal of methylene blue onto wheat straw biochar. Bioresour. Technol. 2016, 206, 16–22. [Google Scholar] [CrossRef] [Green Version]
- Singh, S.; Prajapati, A.K.; Chakraborty, J.P.; Mondal, M.K. Adsorption potential of biochar obtained from pyrolysis of raw and torrefied Acacia nilotica towards removal of methylene blue dye from synthetic wastewater. Biomass Convers. Bioref. 2021; in press. [Google Scholar] [CrossRef]
- Yao, X.; Ji, L.; Guo, J.; Ge, S.; Lu, W.; Chen, Y.; Cai, L.; Wang, Y.; Song, W. An abundant porous biochar material derived from wakame (Undaria pinnatifida) with high adsorption performance for three organic dyes. Bioresour. Technol. 2020, 318, 124082. [Google Scholar] [CrossRef]
- Mahmoud, M.E.; Nabil, G.M.; El-Mallah, N.M.; Bassiouny, H.I.; Kumar, S.; Abdel-Fattah, T.M. Kinetics, isotherm, and thermodynamic studies of the adsorption of reactive red 195 A dye from water by modified Switchgrass Biochar adsorbent. J. Ind. Eng. Chem. 2016, 37, 156–167. [Google Scholar] [CrossRef]
- Conte, P. Environmental applications of fast field cycling NMR relaxometry. In Field-Cycling NMR Relaxometry: Instrumentation, Model Theories and Applications; Kimmich, R., Ed.; Royal Society of Chemistry: London, UK, 2019; pp. 229–254. ISBN 978-1-78801-154-9. [Google Scholar]
- Kimmich, R.; Anoardo, E. Field-cycling NMR relaxometry. Prog. Nucl. Magn. Reson. Spectrosc. 2004, 44, 257–320. [Google Scholar] [CrossRef]
- Yu, L.; Zhang, W.; Luo, W.; Dupont, R.L.; Xu, Y.; Wang, Y.; Tu, B.; Xu, H.; Wang, X.; Fang, Q.; et al. Molecular recognition of human islet amyloid polypeptide assembly by selective oligomerization of thioflavin T. Sci. Adv. 2020, 6, abc1449. [Google Scholar] [CrossRef] [PubMed]
- Batista, E.M.C.C.; Shultz, J.; Matos, T.T.S.; Fornari, M.R.; Ferreira, T.M.; Szpoganicz, B.; De Freitas, R.A.; Mangrich, A.S. Effect of surface and porosity of biochar on water holding capacity aiming indirectly at preservation of the Amazon biome. Sci. Rep. 2018, 8, 10677. [Google Scholar] [CrossRef] [PubMed]
- Oluk, I.; Nagawa, C.B.; Banadda, N.; Tumutegyereize, P.; Owusu, P.A. Development of maize cob-based biochar filter for water purification. Water Environ. J. 2021, 35, 349–358. [Google Scholar] [CrossRef]
- Liu, W.; Jiang, H.; Yu, H. Development of Biochar-Based Functional Materials: Toward a Sustainable Platform Carbon Material. Chem. Rev. 2015, 115, 12251–12285. [Google Scholar] [CrossRef]
- Xu, X.Y.; Zhao, Y.H.; Sima, J.K.; Zhao, L.; Masek, O.; Cao, X.D. Indispensable role of biochar-inherent mineral constituents in its environmental applications: A review. Bioresour. Technol. 2017, 241, 887–899. [Google Scholar] [CrossRef] [Green Version]
- Singh, B.; Raven, M.D. X-ray diffraction analysis of biochar. In Biochar A Guide to Analytical Methods; Singh, B., Camps-Arbestain, M., Lehmann, J., Eds.; CSIRO Publishing: Collingwood, VIC, Australia, 2017; pp. 245–252. [Google Scholar]
- Huang, H.; Tang, J.; Gao, K.; He, R.; Zhao, H.; Werner, D. Characterization of KOH modified biochars from different pyrolysis temperatures and enhanced adsorption of antibiotics. RSC Adv. 2017, 7, 14640–14648. [Google Scholar] [CrossRef] [Green Version]
- Mohan, D.; Abhishek, K.; Sarswat, A.; Patel, M.; Singh, P.; Pittman, C.U. Biochar production and applications in soil fertility and carbon sequestration-a sustainable solution to crop-residue burning in India. RSC Adv. 2018, 8, 508–520. [Google Scholar] [CrossRef] [Green Version]
- Rees, F.; Watteau, F.; Mathieu, S.; Turpault, M.-P.; Le Brech, Y.; Qiu, R.; Morel, J.L. Metal immobilization on wood-derived biochars: Distribution and reactivity of carbonate phases. J. Environ. Qual. 2017, 46, 845–854. [Google Scholar] [CrossRef]
- Berek, A.K.; Hue, N.V. Characterization of biochars and their use as an amendment to acid soils. Soil Sci. 2016, 181, 412–426. [Google Scholar] [CrossRef]
- Genovese, M.; Jiang, J.; Lian, K.; Holm, N. High capacitive performance of exfoliated biochar nanosheets from biomass waste corn cob. J. Mater. Chem. A 2015, 3, 2903–2913. [Google Scholar] [CrossRef]
- Conte, P.; Spaccini, R.; Piccolo, A. State of the art of CPMAS 13C-NMR spectroscopy applied to natural organic matter. Prog. Nucl. Magn. Reson. Spectrosc. 2004, 44, 215–223. [Google Scholar] [CrossRef]
- Conte, P. Application of fast field cycling NMR relaxometry. Annu. Rep. NMR Spectrosc. 2021, 104, 141–188. [Google Scholar]
- Conte, P.; Nestle, N. Water dynamics in different biochar fractions. Magn. Reson. Chem. 2015, 53, 726–734. [Google Scholar] [CrossRef] [PubMed] [Green Version]
- Zdravkov, B.D.; Čermák, J.J.; Šefara, M.; Janků, J. Pore classification in the characterization of porous materials: A perspective. Cent. Eur. J. Chem. 2007, 5, 385–395. [Google Scholar]
- Lo Meo, P.; Mundo, F.; Terranova, S.; Conte, P.; Chillura Martino, D.F. Water Dynamics at the Solid–Liquid Interface to Unveil the Textural Features of Synthetic Nanosponges. J. Phys. Chem. B 2020, 124, 1847–1857. [Google Scholar] [CrossRef]
- Liu, Y.; Zhao, X.; Li, J.; Ma, D.; Han, R. Characterization of bio-char from pyrolysis of wheat straw and its evaluation on methylene blue adsorption. Desalin. Water Treat. 2012, 46, 115–123. [Google Scholar] [CrossRef]
- Nirmaladevi, S.; Palanisamy, N. A comparative study of the removal of cationic and anionic dyes from aqueous solutions using biochar as an adsorbent. Desalin. Water Treat. 2020, 175, 282–292. [Google Scholar] [CrossRef]
- Tran, H.N.; Wang, Y.-F.; You, S.-J.; Chao, H.-P. Insights into the mechanism of cationic dye adsorption on activated charcoal: The importance of π–π interactions. Process Saf. Environ. Prot. 2017, 107, 168–180. [Google Scholar] [CrossRef]
- Apostol, L.C.; Ghinea, C.; Alves, M.; Gavrilescu, M. Removal of Erythrosine B dye from water effluents using crop waste pumpkin seed hulls as adsorbent. Desalin. Water Treat. 2016, 57, 22585–22608. [Google Scholar] [CrossRef] [Green Version]
- Tong, Y.; McNamara, P.J.; Mayer, B.K. Adsorption of organic micropollutants onto biochar: A review of relevant kinetics, mechanisms and equilibrium. Environ. Sci. Water Res. Technol. 2019, 5, 821–838. [Google Scholar] [CrossRef]
- Ho, Y.S.; McKay, G. Pseudo-second order model for sorption processes. Process Biochem. 1999, 34, 451–465. [Google Scholar] [CrossRef]
- Weber, W.J.; Morris, J.C. Kinetics on adsorption on carbon from solutions. J. Sanit. Eng. Div. Am. Soc. Civ. Eng. 1963, 89, 31–60. [Google Scholar] [CrossRef]
- Viegas, R.M.C.; Campinas, M.; Costa, H.; Rosa, M.J. How do the HSDM and Boyd’s model compare for estimating intraparticle diffusion coefficients in adsorption processes. Adsorption 2014, 20, 737–746. [Google Scholar] [CrossRef]
- Yaneva, Z.L.; Georgieva, N.V.; Bekirska, L.L.; Lavrova, S. Drug mass transfer mechanism, thermodynamics, and in vitro release kinetics of antioxidant-encapsulated zeolite microparticles as a drug carrier system. Chem. Biochem. Eng. Q. 2018, 32, 281–298. [Google Scholar] [CrossRef]
- Wu, F.-C.; Tseng, R.-L.; Juang, R.-S. Initial behavior of intraparticle diffusion model used in the description of adsorption kinetics. Chem. Eng. J. 2009, 153, 1–8. [Google Scholar] [CrossRef]
- Freundlich, H.M.F. Über die adsorption in lösungen. Z. Phys. Chem. 1906, 57, 385–470. [Google Scholar] [CrossRef]
- Langmuir, I. Adsorption of gases on plane surfaces of glass, mica and platinum. J. Am. Chem. Soc. 1918, 40, 1361–1403. [Google Scholar] [CrossRef] [Green Version]
- Partelová, D.; Šuňovská, A.; Marešová, J.; Horník, M.; Pipíška, S.; Hostin, S. Removal of contaminats from aqueous solutions using hop (Humulus lupulus L.) agricultural by-products. Nova Biotechnol. Chim. 2015, 14, 212–227. [Google Scholar] [CrossRef] [Green Version]
- Maurya, N.S.; Mittal, A.K. Biosorptive uptake of cationic dyes from aqueous phase using immobilised dead macro fungal biomass. Int. J. Environ. Technol. Manage. 2011, 14, 282–293. [Google Scholar] [CrossRef]
- Hagemann, N.; Joseph, S.; Schmidt, H.P.; Kammann, C.I.; Harter, J.; Borch, T.; Young, R.B.; Varga, K.; Taherymoosavi, S.; Elliott, K.W.; et al. Organic coating on biochar explains its nutrient retention and stimulation of soil fertility. Nat. Commun. 2017, 8, 1089. [Google Scholar] [CrossRef]
- Dai, L.; Zhu, W.; He, L.; Tan, F.; Zhu, N.; Zhou, Q.; He, M.; Hu, G. Calcium-rich biochar from crab shell: An unexpected super adsorbent for dye removal. Bioresour. Technol. 2018, 267, 510–516. [Google Scholar] [CrossRef] [PubMed]
- Xia, H.M.; Chen, L.F.; Fang, Y.J. Highly efficient removal of Congo red from wastewater by nano-cao. Separ. Sci. Technol. 2013, 48, 2681–2687. [Google Scholar] [CrossRef]


| Dye | Thioflavin T | Erythrosine B |
|---|---|---|
| Structure and size |  1.3 nm × 0.4 nm (l × w) [35] | 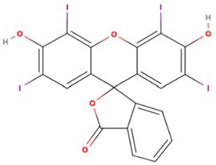 1.1 nm × 1.1 nm (l × w) |
| Color index number | 49,005 | 45,430 |
| Formula | C17H19ClN2S | C20H6I4Na2O5 |
| MW | 318.9 | 879.9 |
| pKa | - | 4.1 |
| WSexp (mg mL−1) | 5 | 0.7 |
| λmax (nm) | 413 | 526 |
| CC | WC | |
|---|---|---|
| pH (H2O) | 8.74 ± 0.07 | 8.58 ± 0.01 |
| EC (mS cm−1) | 2.39 ± 0.01 | 0.36 ± 0.01 |
| ash (%) | 5.65 ± 0.35 | 6.61 ± 0.46 |
| Density (kg L−1) | 0.32 | 0.36 |
| C % | 82.8 | 79.9 |
| H % | 2.08 | 1.59 |
| N % | 1.39 | 0.45 |
| O % | 9.28 | 11.72 |
| S % | 0.19 | 0.18 |
| H/Corg | 0.31 | 0.24 |
| O/Corg | 0.087 | 0.111 |
| CaCO3 (%) | 2.82 ± 0.05 | 0.65 ± 0.02 |
| SSA (m2 g−1) | 10.38 | 53.68 |
| Vpor (cm3 g−1) | 0.021 | 0.045 |
| Vmicro (cm3 g−1) | 0.00005 | 0.021 |
| Vmeso (cm3 g−1) | 0.01995 | 0.021 |
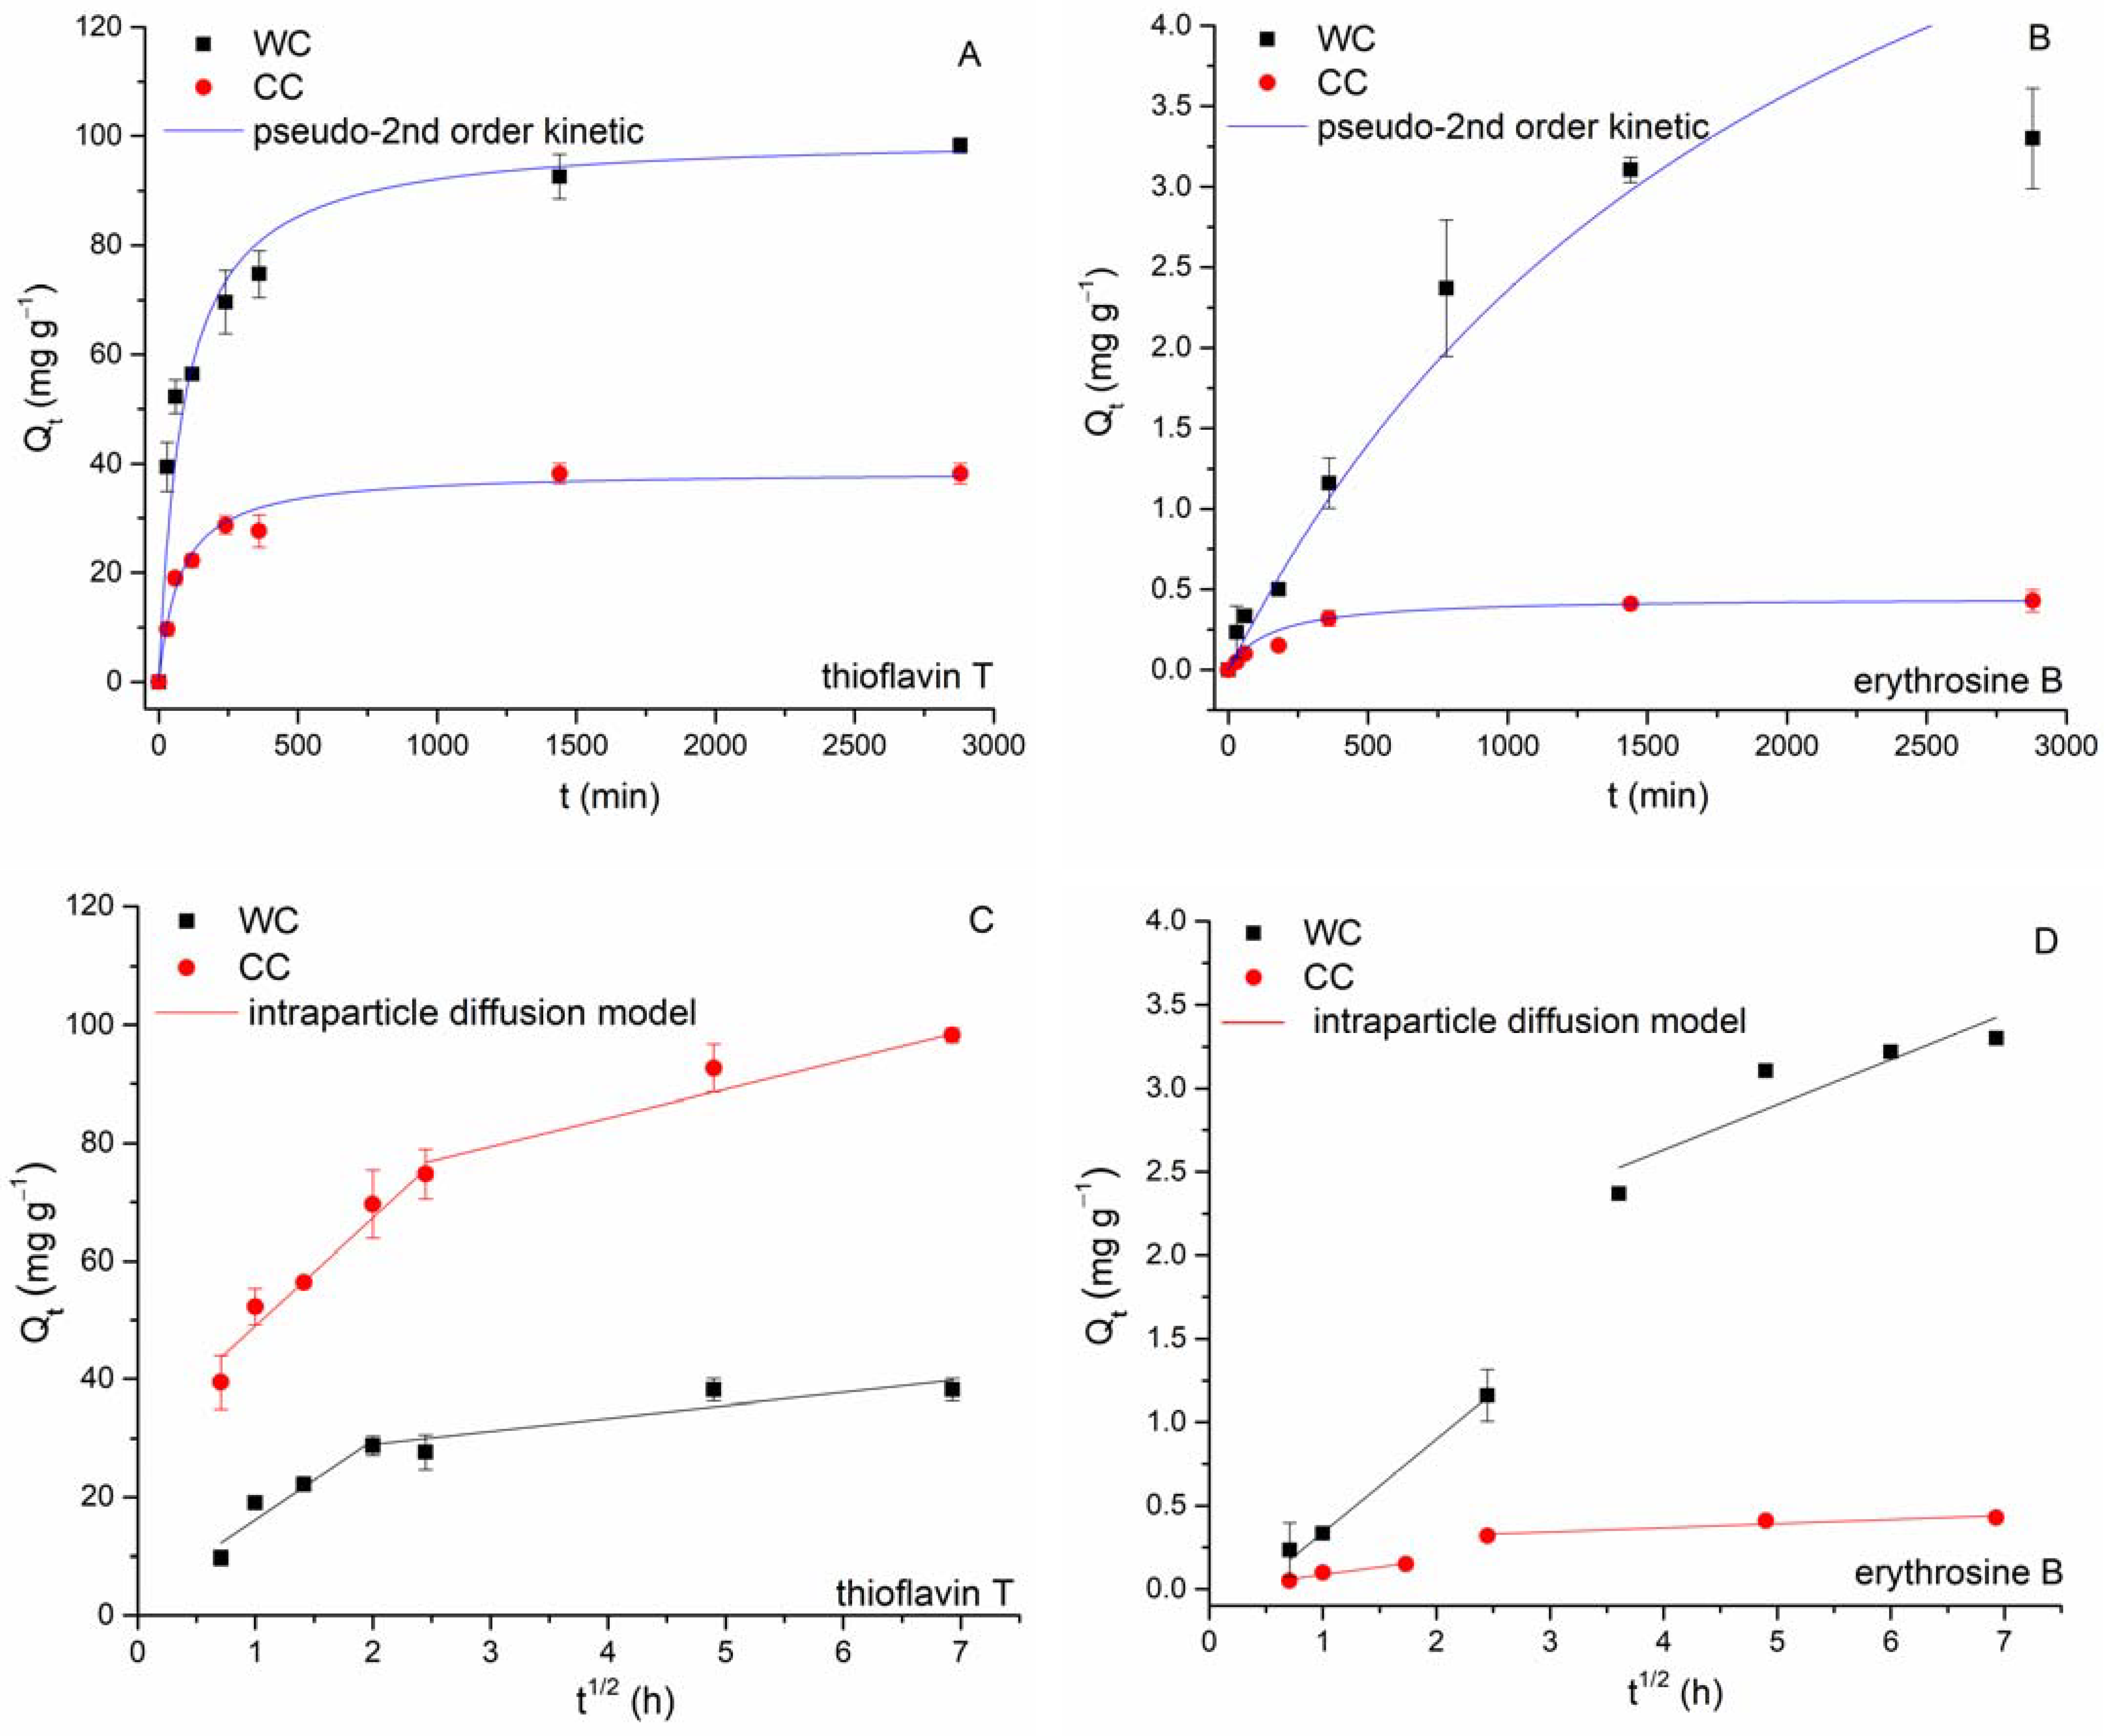
| Synthetic Dye | Biochar | Model | Parameter 1 | Parameter 2 | R2 |
|---|---|---|---|---|---|
| EB | WC | PSO | Qe = 7.41 ± 1.72 | k2 = 0.00006 ± 0.00003 | 0.971 |
| CC | PSO | Qe = 0.45 ± 0.004 | k2 = 0.0014 ± 0.0001 | 0.995 | |
| WC | IDM | ki1 = 0.56 ± 0.04 | I1 = −0.17 ± 0.04 | 0.994 | |
| ki2 = 0.27 ± 0.08 | I2 = 1.55 ± 0.28 | 0.827 | |||
| CC | IDM | ki1 = 0.09 ± 0.02 | I1 = −0.005 ± 0.001 | 0.942 | |
| ki2 = 0.025 ± 0.007 | I2 = 0.27 ± 0.04 | 0.911 | |||
| TT | WC | PSO | Qe = 100.3 ± 2.8 | k2 = 0.00011 ± 0.00002 | 0.993 |
| CC | PSO | Qe = 38.7 ± 1.6 | k2 = 0.00034 ± 0.00006 | 0.987 | |
| WC | IDM | ki1 = 18.3 ± 2.5 | I1 = 30.7 ± 3.70 | 0.945 | |
| ki2 = 4.86 ± 1.0 | I2 = 64.8 ± 6.6 | 0.958 | |||
| CC | IDM | ki1 = 13.7 ± 3.5 | I1 = 2.12 ± 0.39 | 0.883 | |
| ki2 = 2.19 ± 0.64 | I2 = 24.6 ± 2.9 | 0.852 |
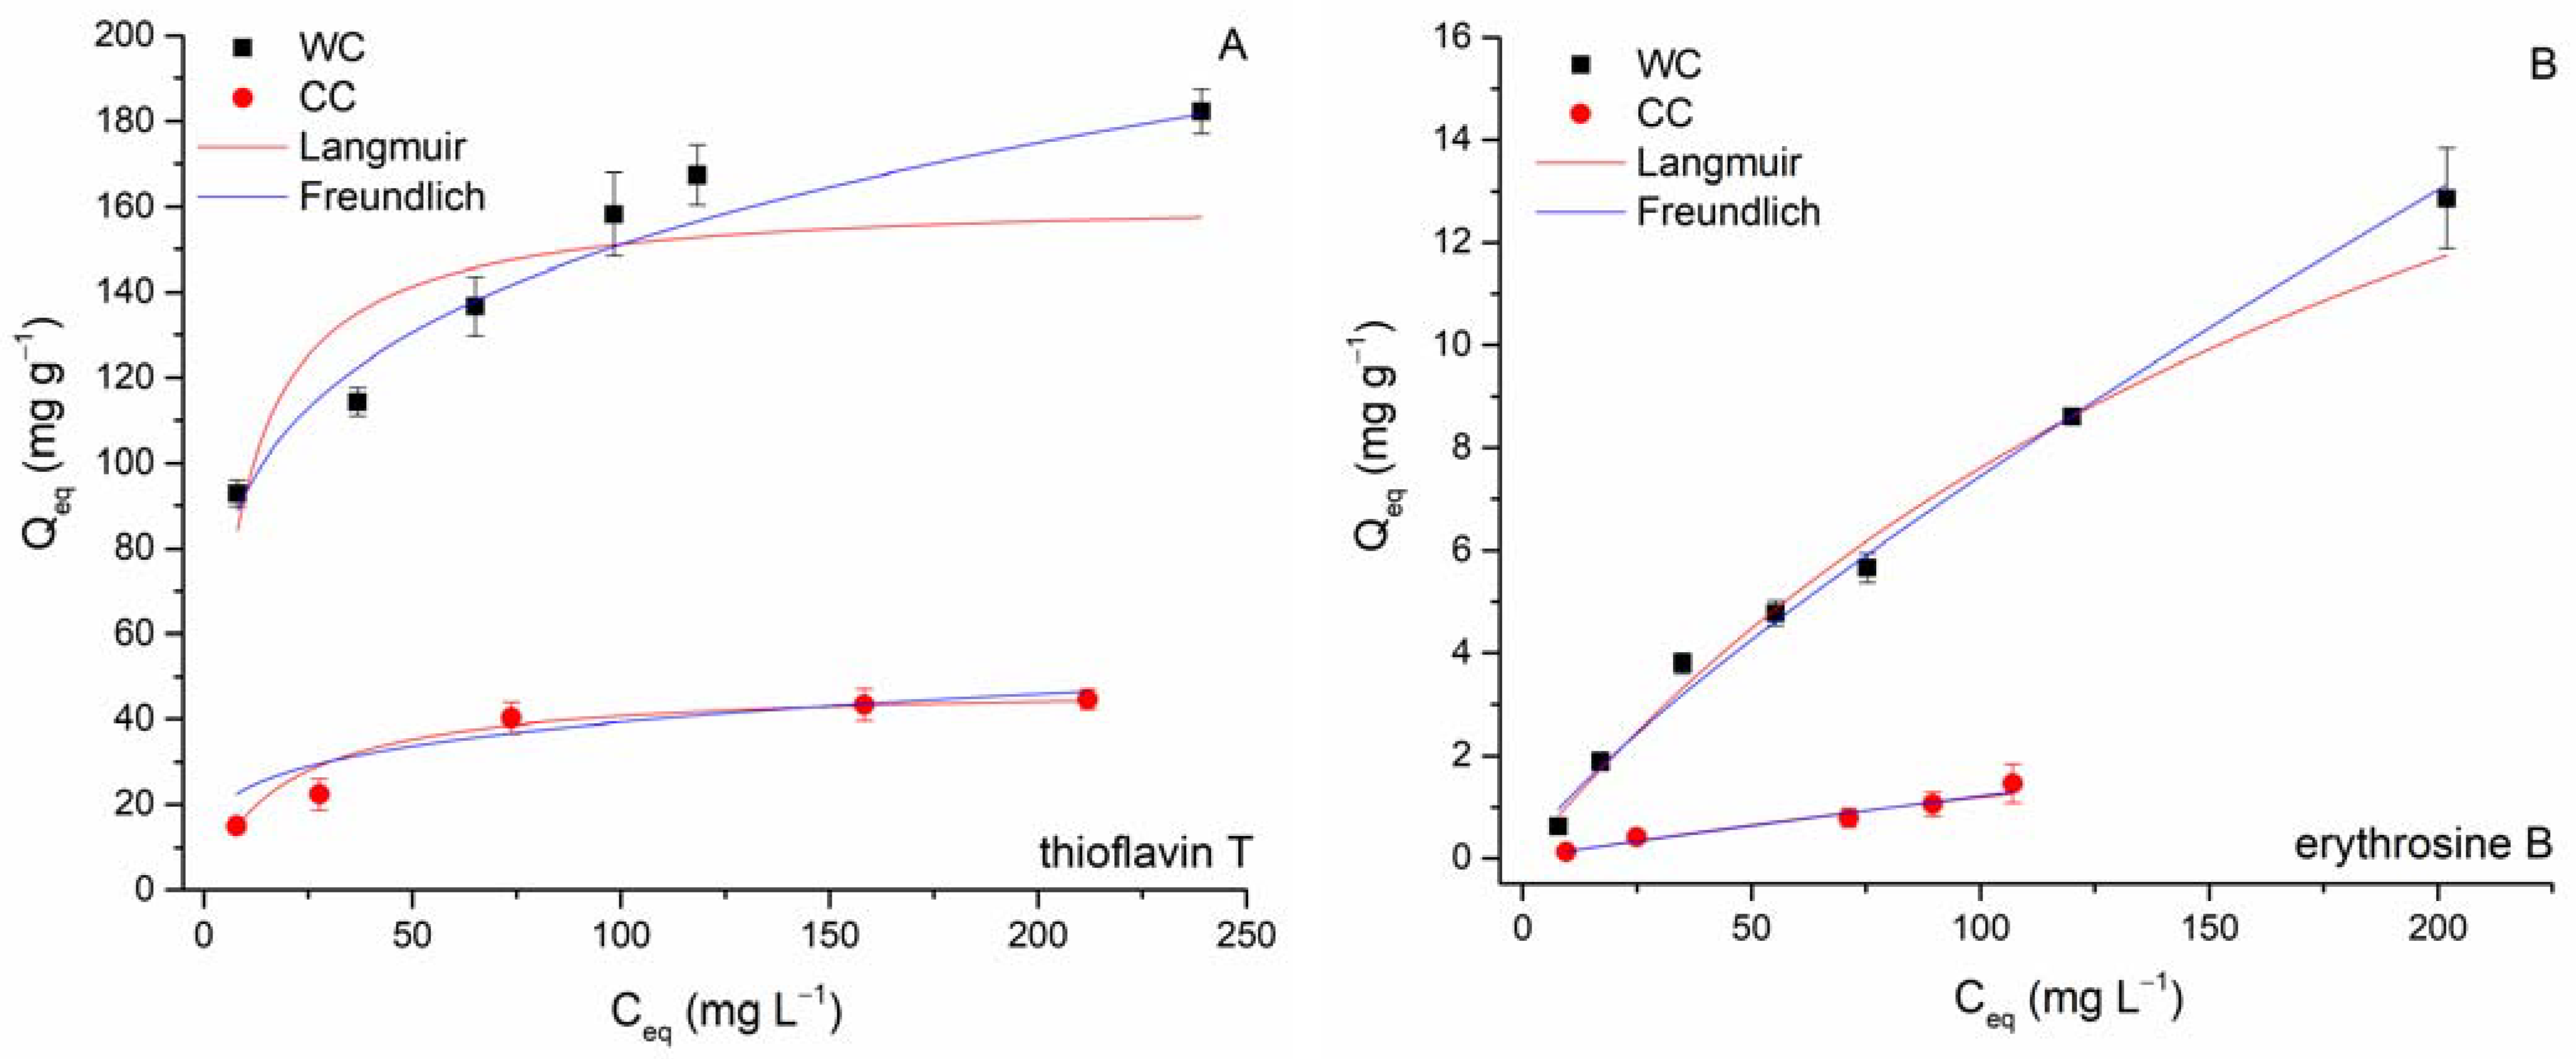
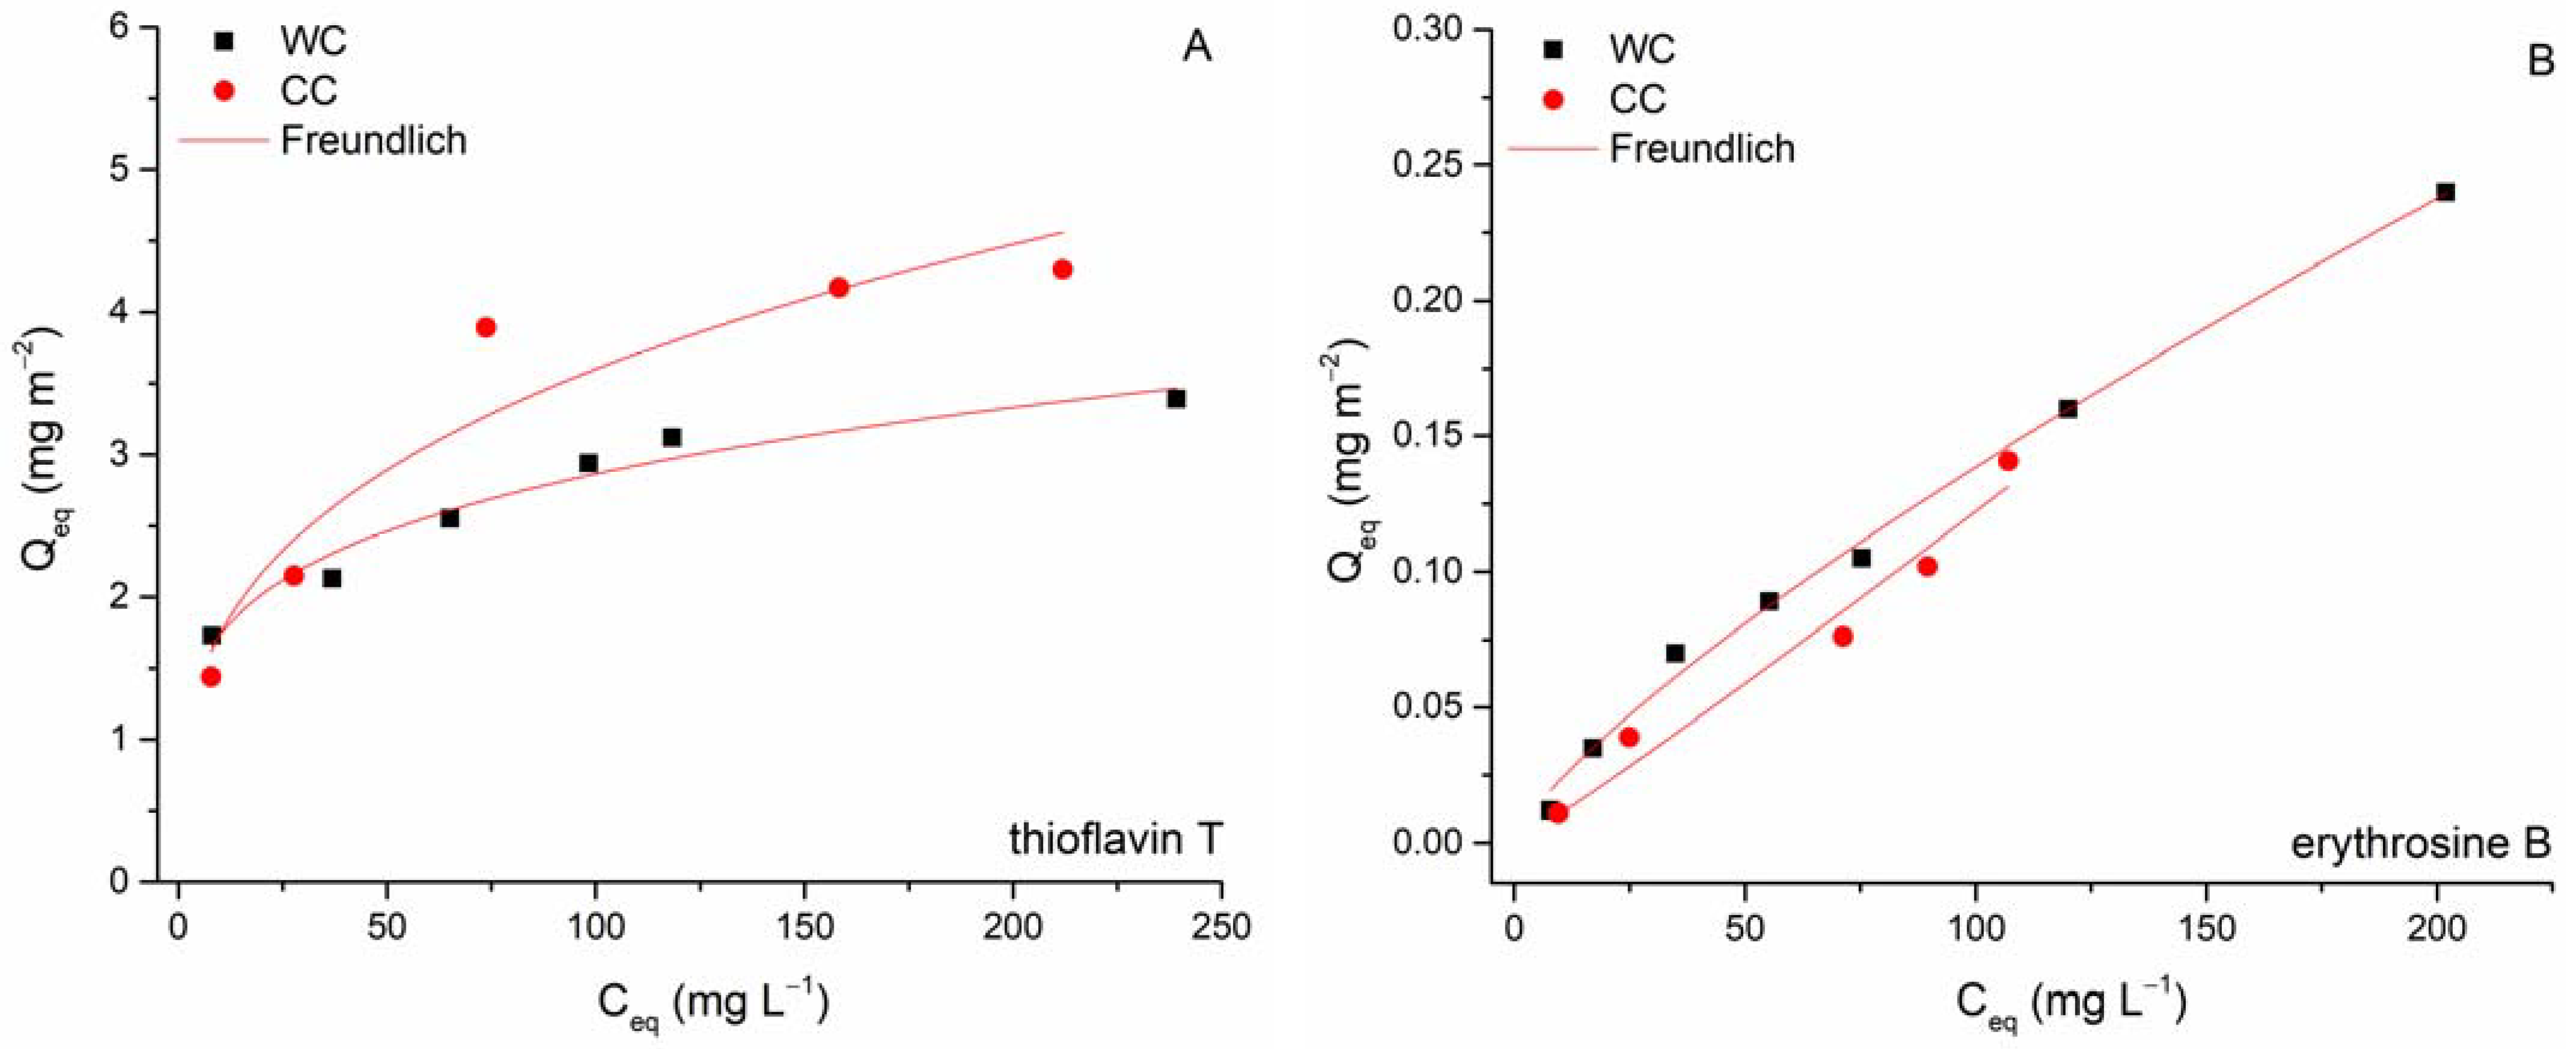
| Biochar | Langmuir | Freundlich | |||||
|---|---|---|---|---|---|---|---|
| Qmax [mg g−1] | b [L mg−1] | R2 | K [mg g−1 (L mg−1)1/n] | 1/n | R2 | ||
| WC | TT | 162 ± 16 | 0.134 ± 0.058 | 0.737 | 57.08 ± 5.04 | 0.21 ± 0.02 | 0.962 |
| EB | 25.2 ± 5.0 | 0.004 ± 0.001 | 0.980 | 0.180 ± 0.043 | 0.81 ± 0.05 | 0.993 | |
| CC | TT | 48.0 ± 2.7 | 0.056 ± 0.008 | 0.981 | 14.2 ± 0.15 | 0.22 ± 0.01 | 0.924 |
| EB | 7.5 ± 5.0 | 0.002 ± 0.001 | 0.969 | 0.016 ± 0.005 | 0.94 ± 0.08 | 0.958 | |
| Sorbent | Qmax EB (mg g−1) | QmaxTT (mg g−1) | Concentration Range (mg L−1) | SSA (m2 g−1) | pH | T (°C) | References |
|---|---|---|---|---|---|---|---|
| Moss Vesicularia dubyana | - | 119 | 20–200 | - | 6.0 | 25 | [6] |
| Ultrathin-shell BN hollow spheres | - | 153 | - ** | 175 | - | - | [18] |
| Hop leaf biomass | - | 77.48 | 40–400 | - | 6.0 | 25 | [63] |
| Montmorillonite (modified) | - | 95.0 | - ** | - | 6.0 | 25 | [17] |
| Fomitopsis carnea | - | 21.9 | 100 *** | - | - | 30 | [64] |
| Magnetically functionalized R. squarrosus | 154 | 50–400 | - | 6.0 | 22 | [12] | |
| Wood-chip biochar | 12.9 * | 162 | 13–309 (EB) 25–400 (TT) | 53.7 | 6.0 | 22 | This work |
| Corn-cob biochar | 1.6 * | 48 | 13–309 (EB) 25–400 (TT) | 10.4 | 6.0 | 22 | This work |
| Pumpkin-seed hulls | 16.4 | - | 100–400 | - | 5.6 | 25 | [54] |
| lemon-peel activated carbon | 296 | - | - ** | - | 4.0 | 25 | [14] |
| Commercial activated carbon | 77.2 | - | 50–450 | 820 | 7.0 | 20 | [13] |
Publisher’s Note: MDPI stays neutral with regard to jurisdictional claims in published maps and institutional affiliations. |
© 2022 by the authors. Licensee MDPI, Basel, Switzerland. This article is an open access article distributed under the terms and conditions of the Creative Commons Attribution (CC BY) license (https://creativecommons.org/licenses/by/4.0/).
Share and Cite
Pipíška, M.; Krajčíková, E.K.; Hvostik, M.; Frišták, V.; Ďuriška, L.; Černičková, I.; Kaňuchová, M.; Conte, P.; Soja, G. Biochar from Wood Chips and Corn Cobs for Adsorption of Thioflavin T and Erythrosine B. Materials 2022, 15, 1492. https://doi.org/10.3390/ma15041492
Pipíška M, Krajčíková EK, Hvostik M, Frišták V, Ďuriška L, Černičková I, Kaňuchová M, Conte P, Soja G. Biochar from Wood Chips and Corn Cobs for Adsorption of Thioflavin T and Erythrosine B. Materials. 2022; 15(4):1492. https://doi.org/10.3390/ma15041492
Chicago/Turabian StylePipíška, Martin, Eva Klára Krajčíková, Milan Hvostik, Vladimír Frišták, Libor Ďuriška, Ivona Černičková, Mária Kaňuchová, Pellegrino Conte, and Gerhard Soja. 2022. "Biochar from Wood Chips and Corn Cobs for Adsorption of Thioflavin T and Erythrosine B" Materials 15, no. 4: 1492. https://doi.org/10.3390/ma15041492
APA StylePipíška, M., Krajčíková, E. K., Hvostik, M., Frišták, V., Ďuriška, L., Černičková, I., Kaňuchová, M., Conte, P., & Soja, G. (2022). Biochar from Wood Chips and Corn Cobs for Adsorption of Thioflavin T and Erythrosine B. Materials, 15(4), 1492. https://doi.org/10.3390/ma15041492