
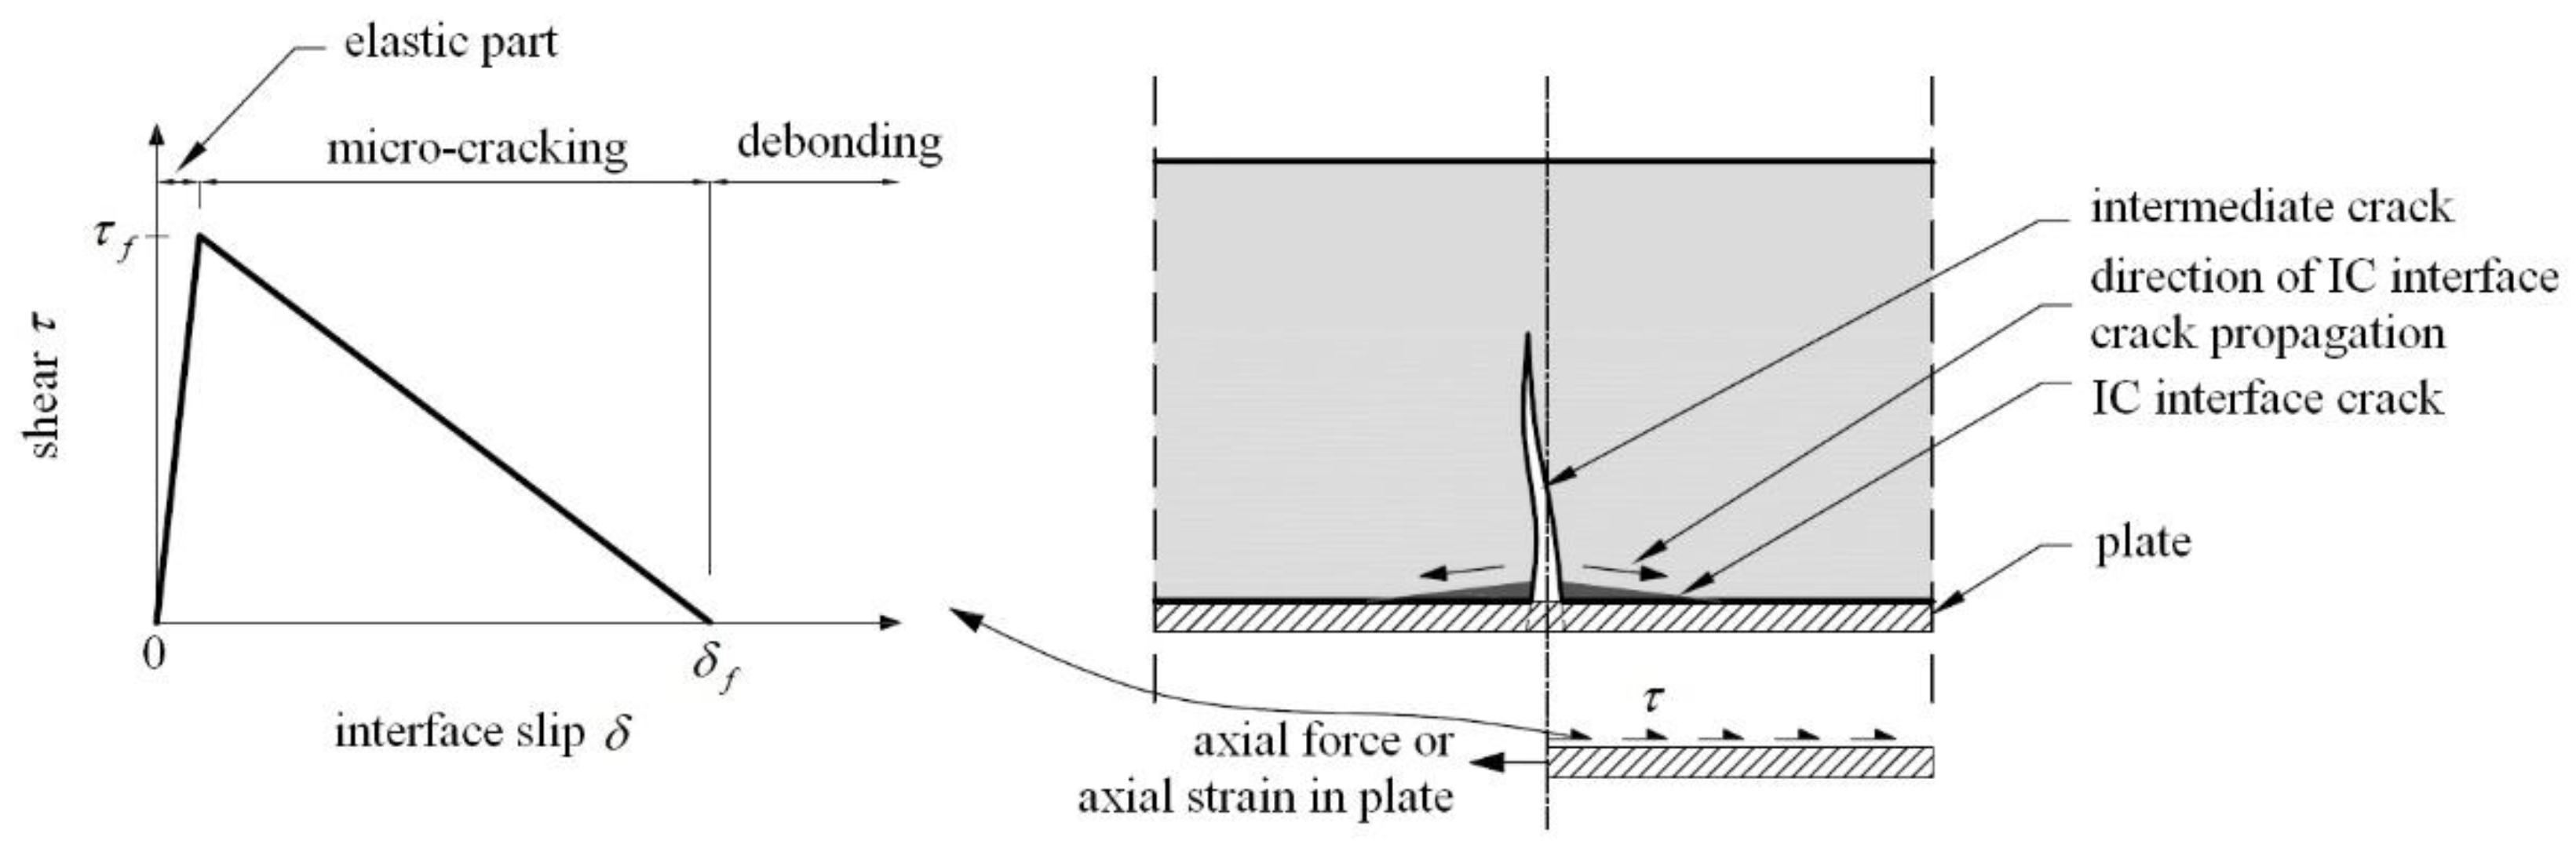
Intermediate Crack Debonding of Externally Bonded FRP Reinforcement—Comparison of Methods


Abstract
1. Introduction
2. IC Debonding Models Considered
2.1. Description of the Test Database Used in the Analysis
- Span length, L;
- Slenderness ratio, L/d;
- Compressive strength of concrete, fc;
- Yield strength of reinforcement, ff;
- Modulus of elasticity of steel, Es;
- Tensile strength of the FRP, Ef;
- Modulus of elasticity of FRP, fy;
- Flexural steel reinforcement ratio, ρs = As1/bd, where As1 is the area of steel tension reinforcement;
- Flexural FRP reinforcement ratio, ρf = Af/bdf, where Af is the area of FRP tension reinforcement;
- Ratio of the width of the FRP sheet to the width of the concrete section, bf/b.
2.2. Assumptions for Calculations
- The average values for steel and concrete strength were used in calculation.
- An equivalent rectangular stress distribution for concrete is used (Whitney stress block [25]). For debonding failure, α1—the multiplier on fc to determine the intensity of an equivalent rectangular stress distribution for concrete given by Equation (16)—and β1—the ratio of the depth of the equivalent rectangular stress block to the depth of the neutral axis—were used.
- For concrete crushing and rupture of FRP, bending moment capacity was calculated based on the fib bulletin 14 [3] approach.
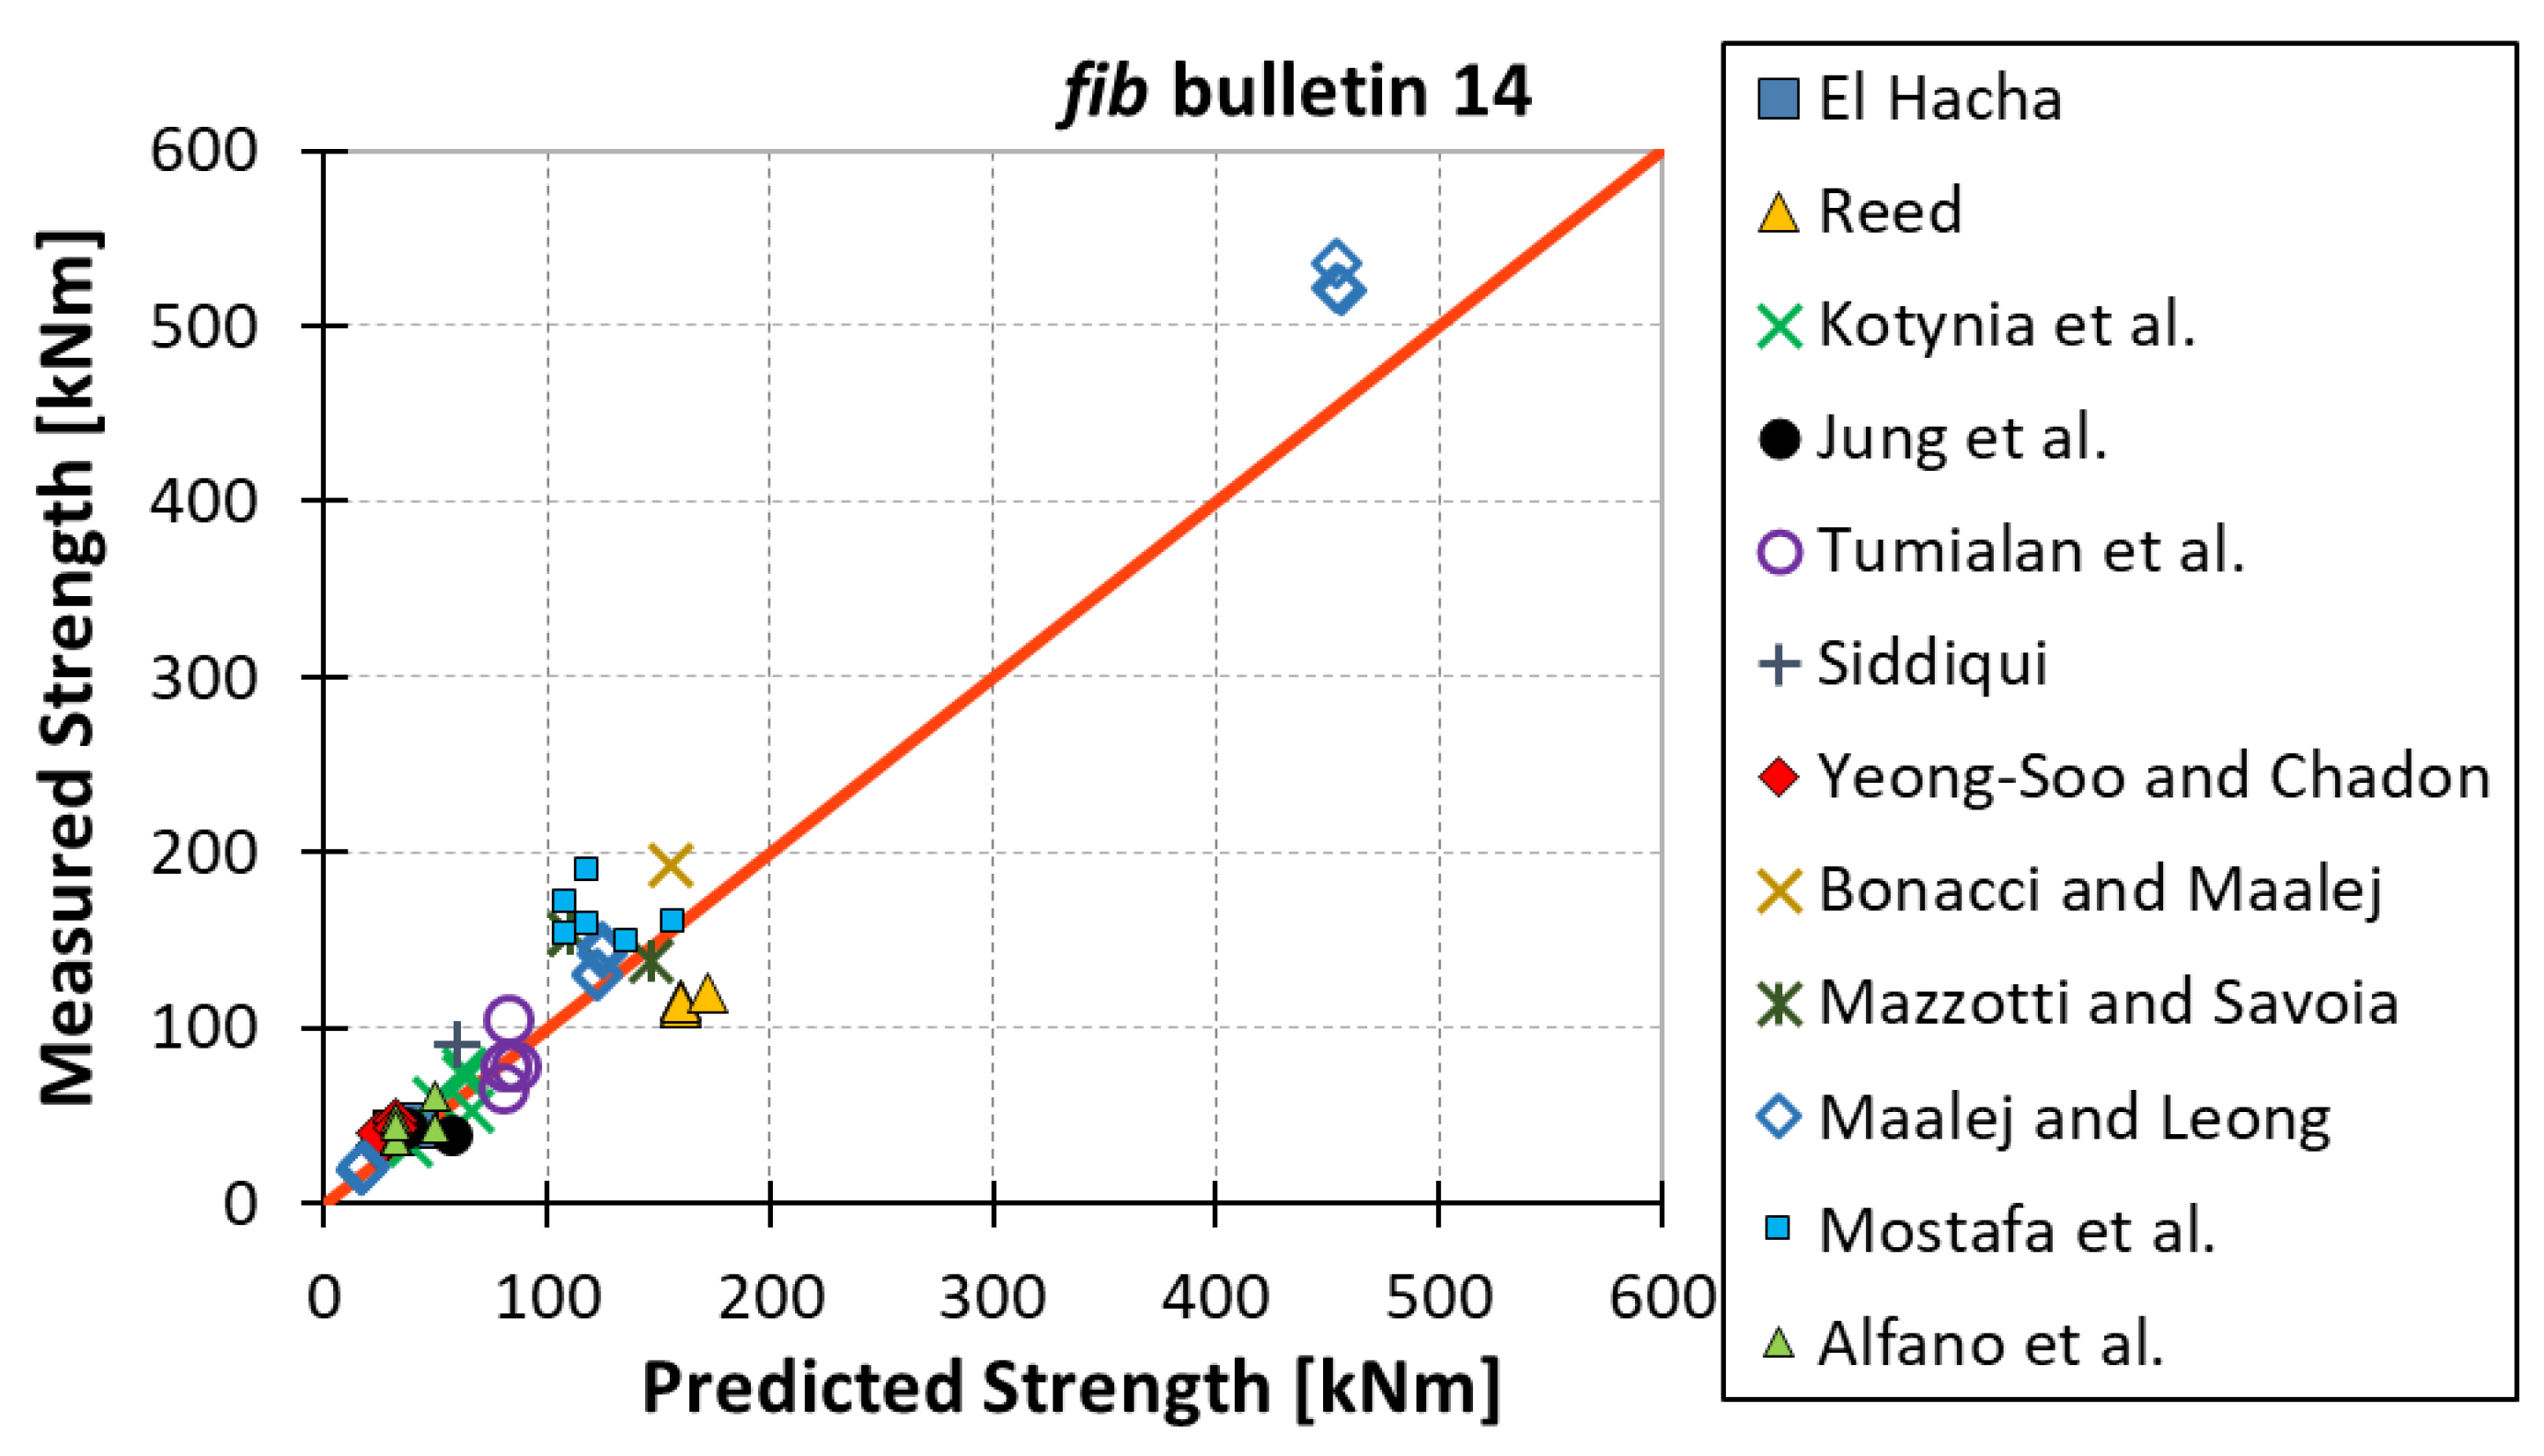
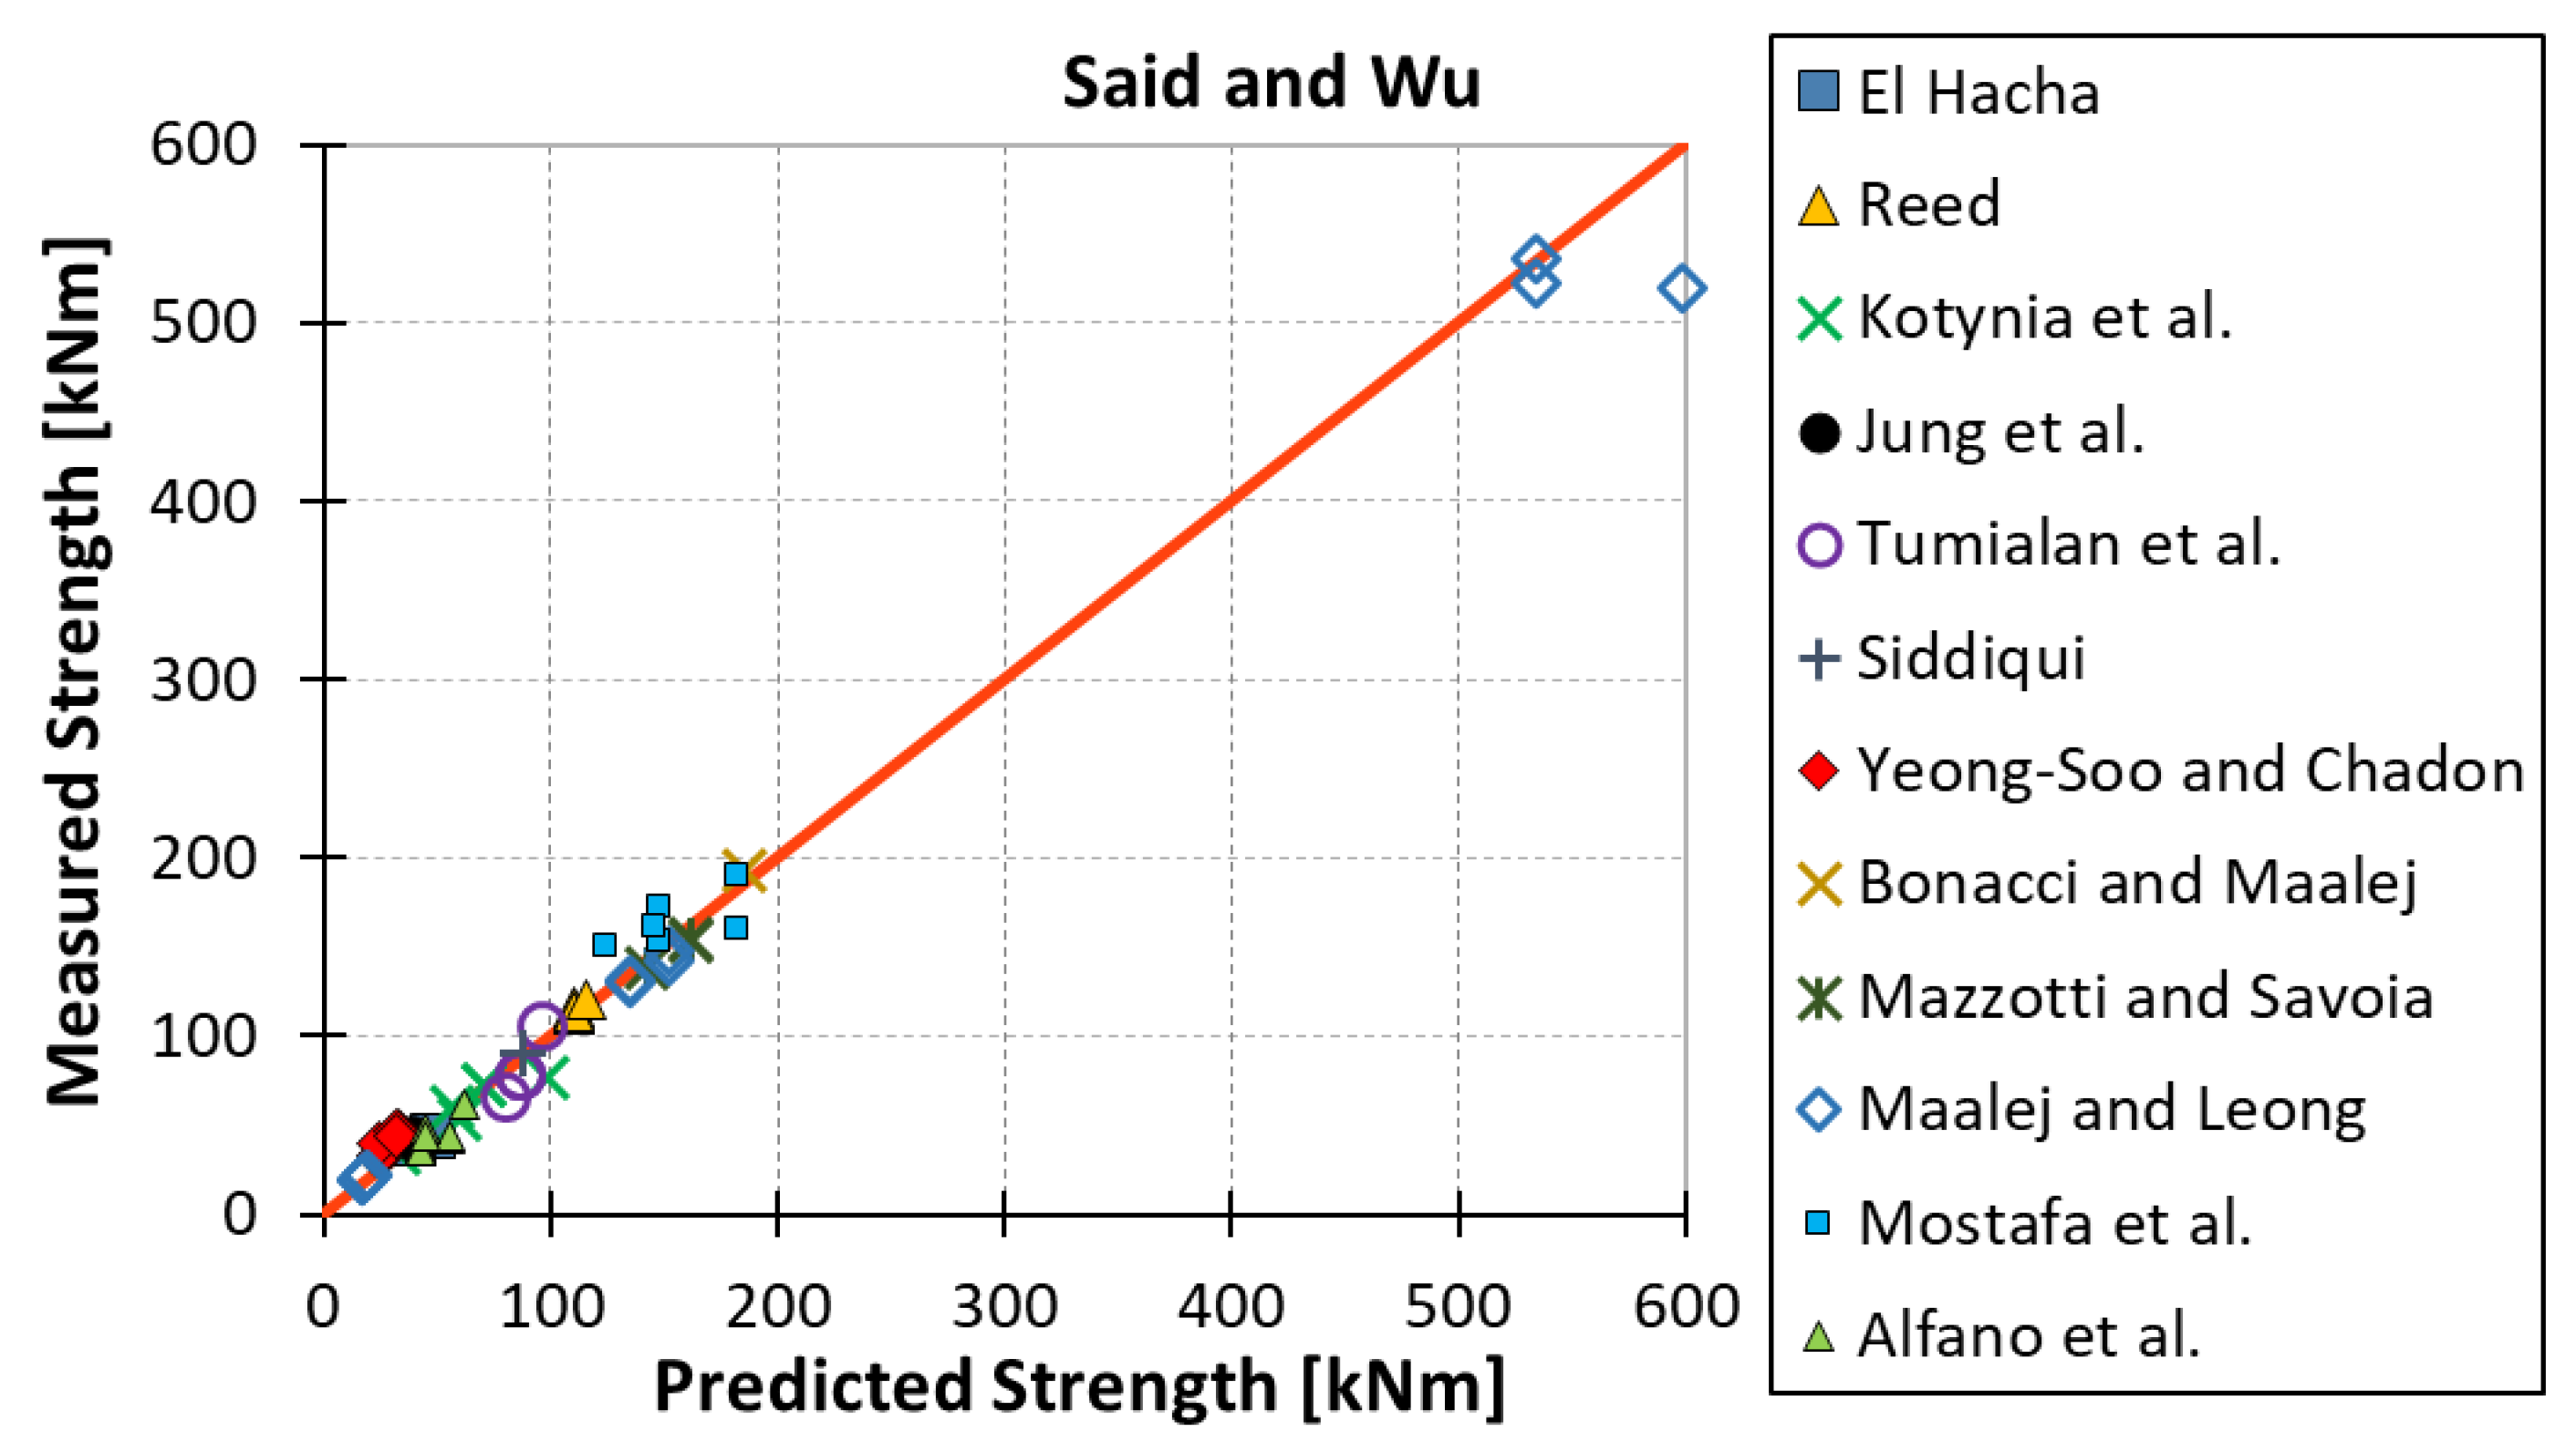
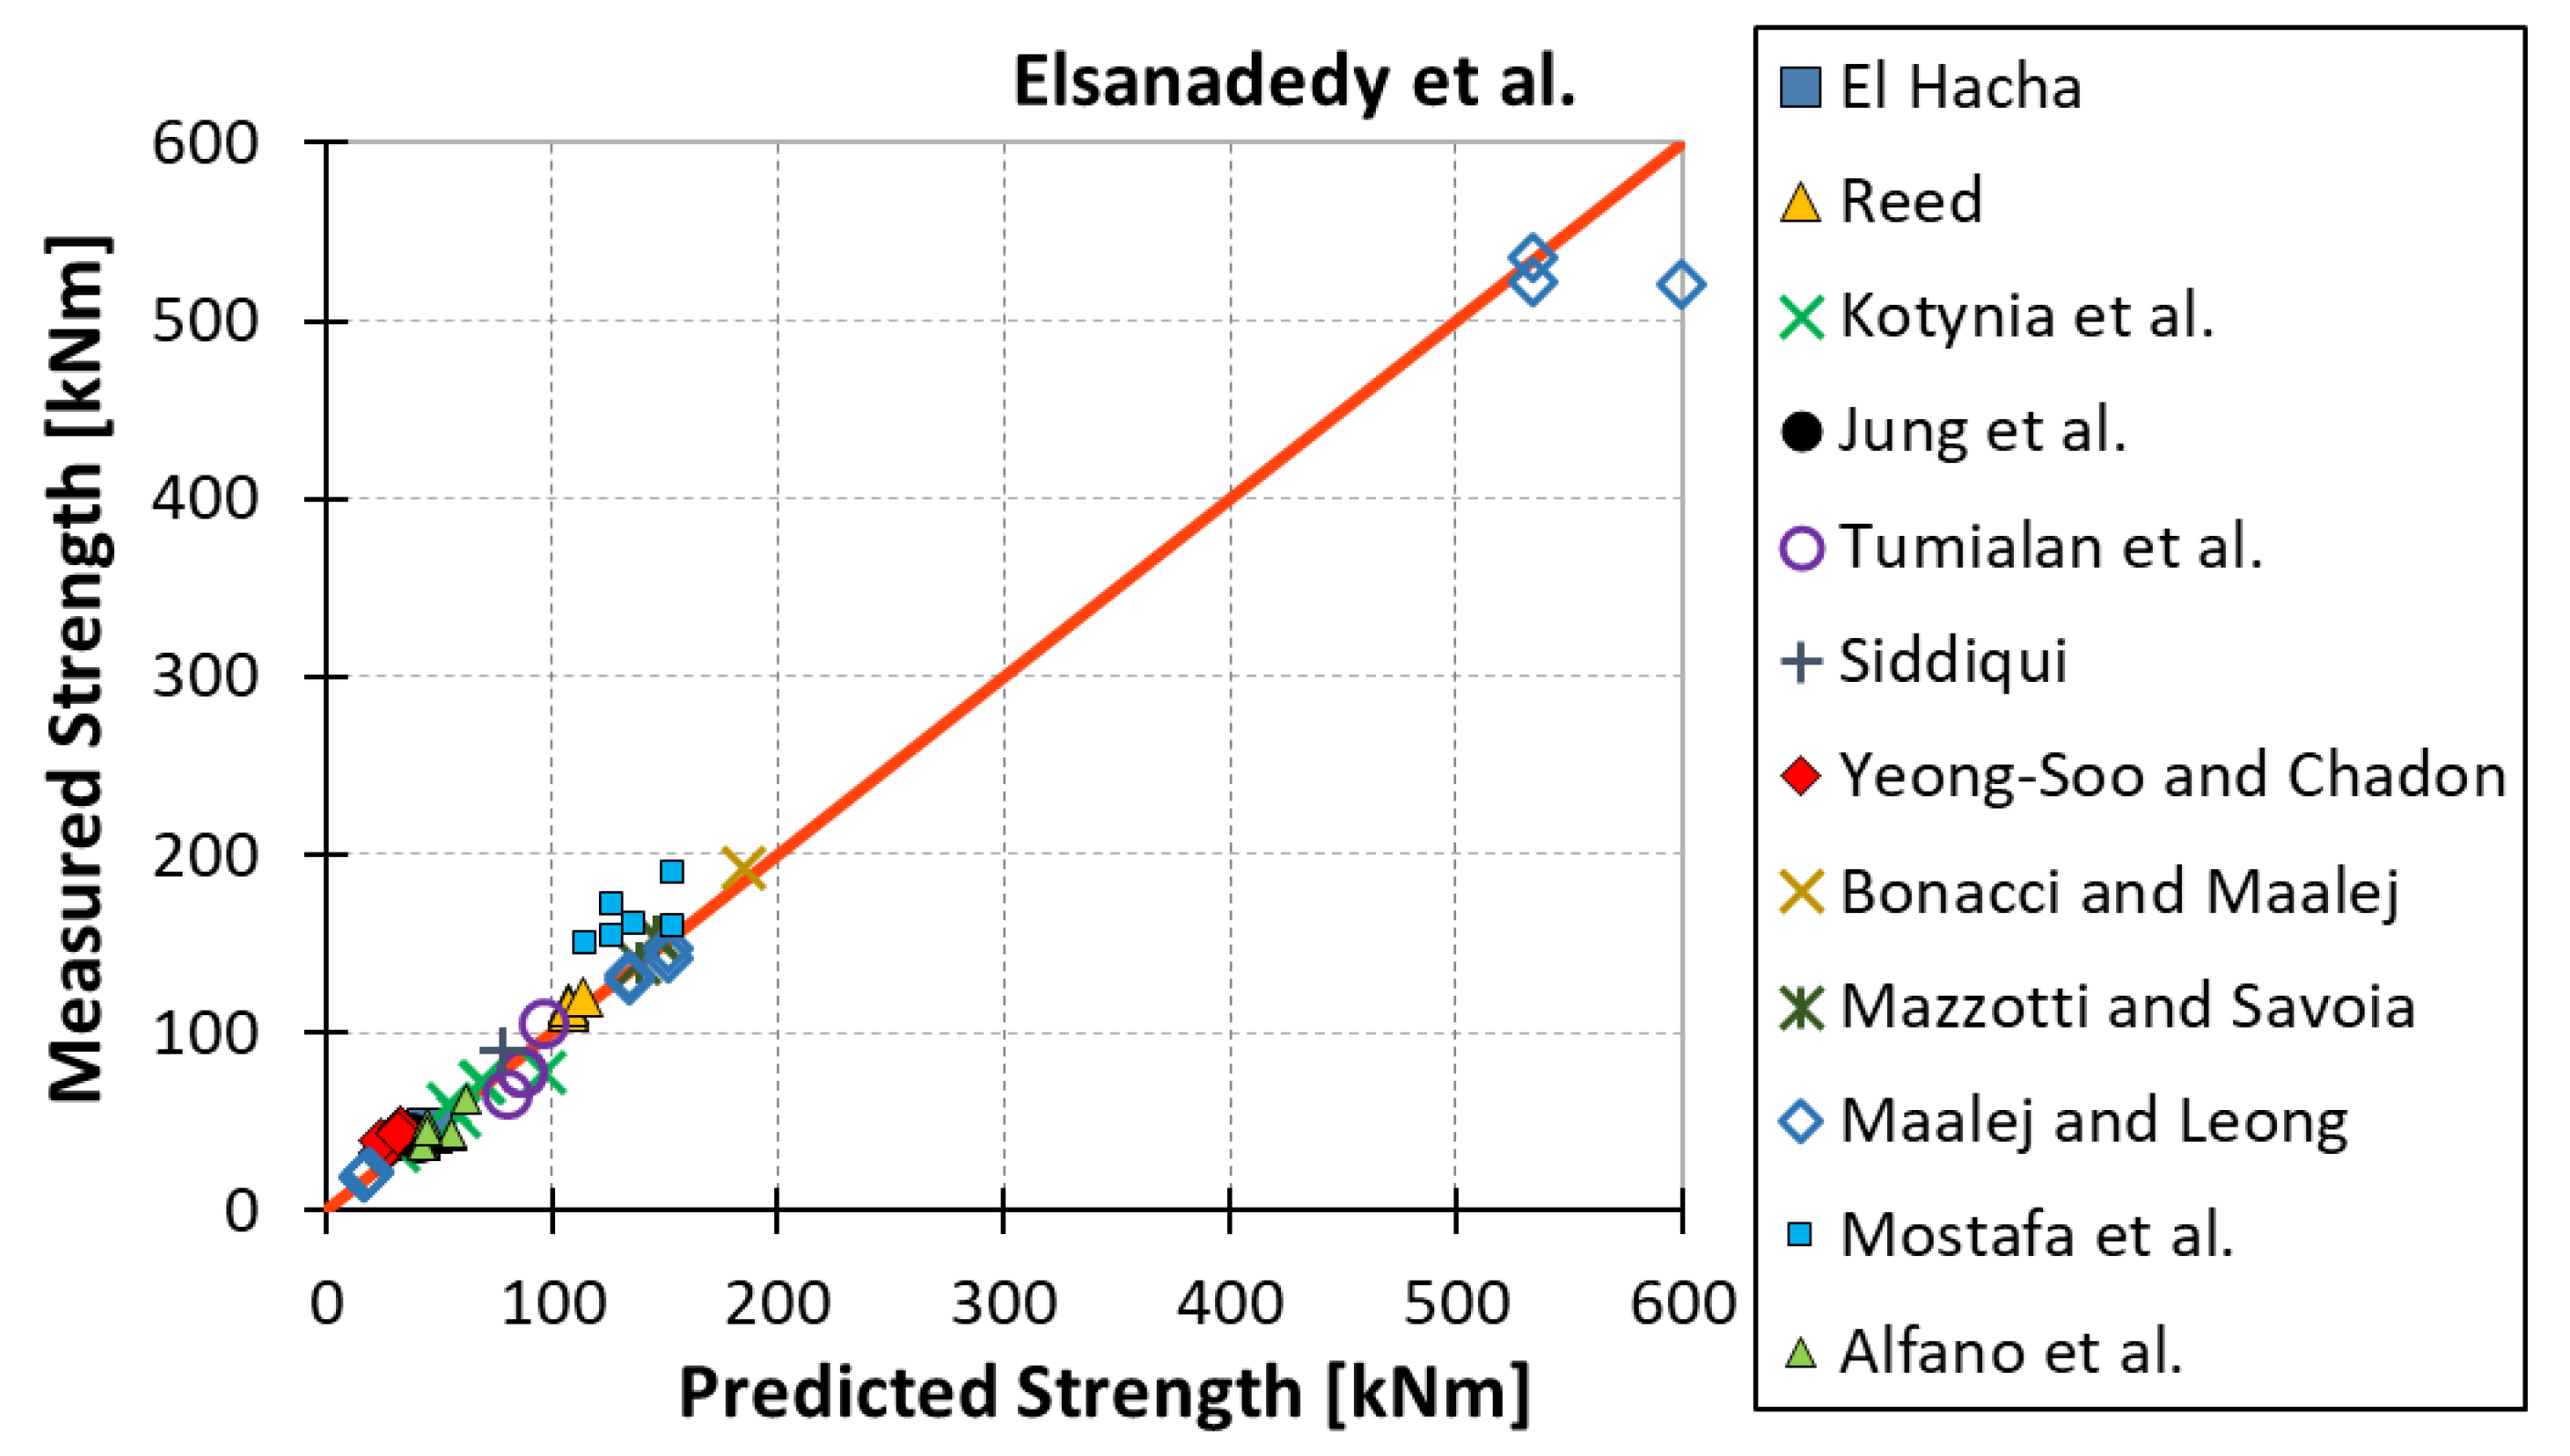
3. Results
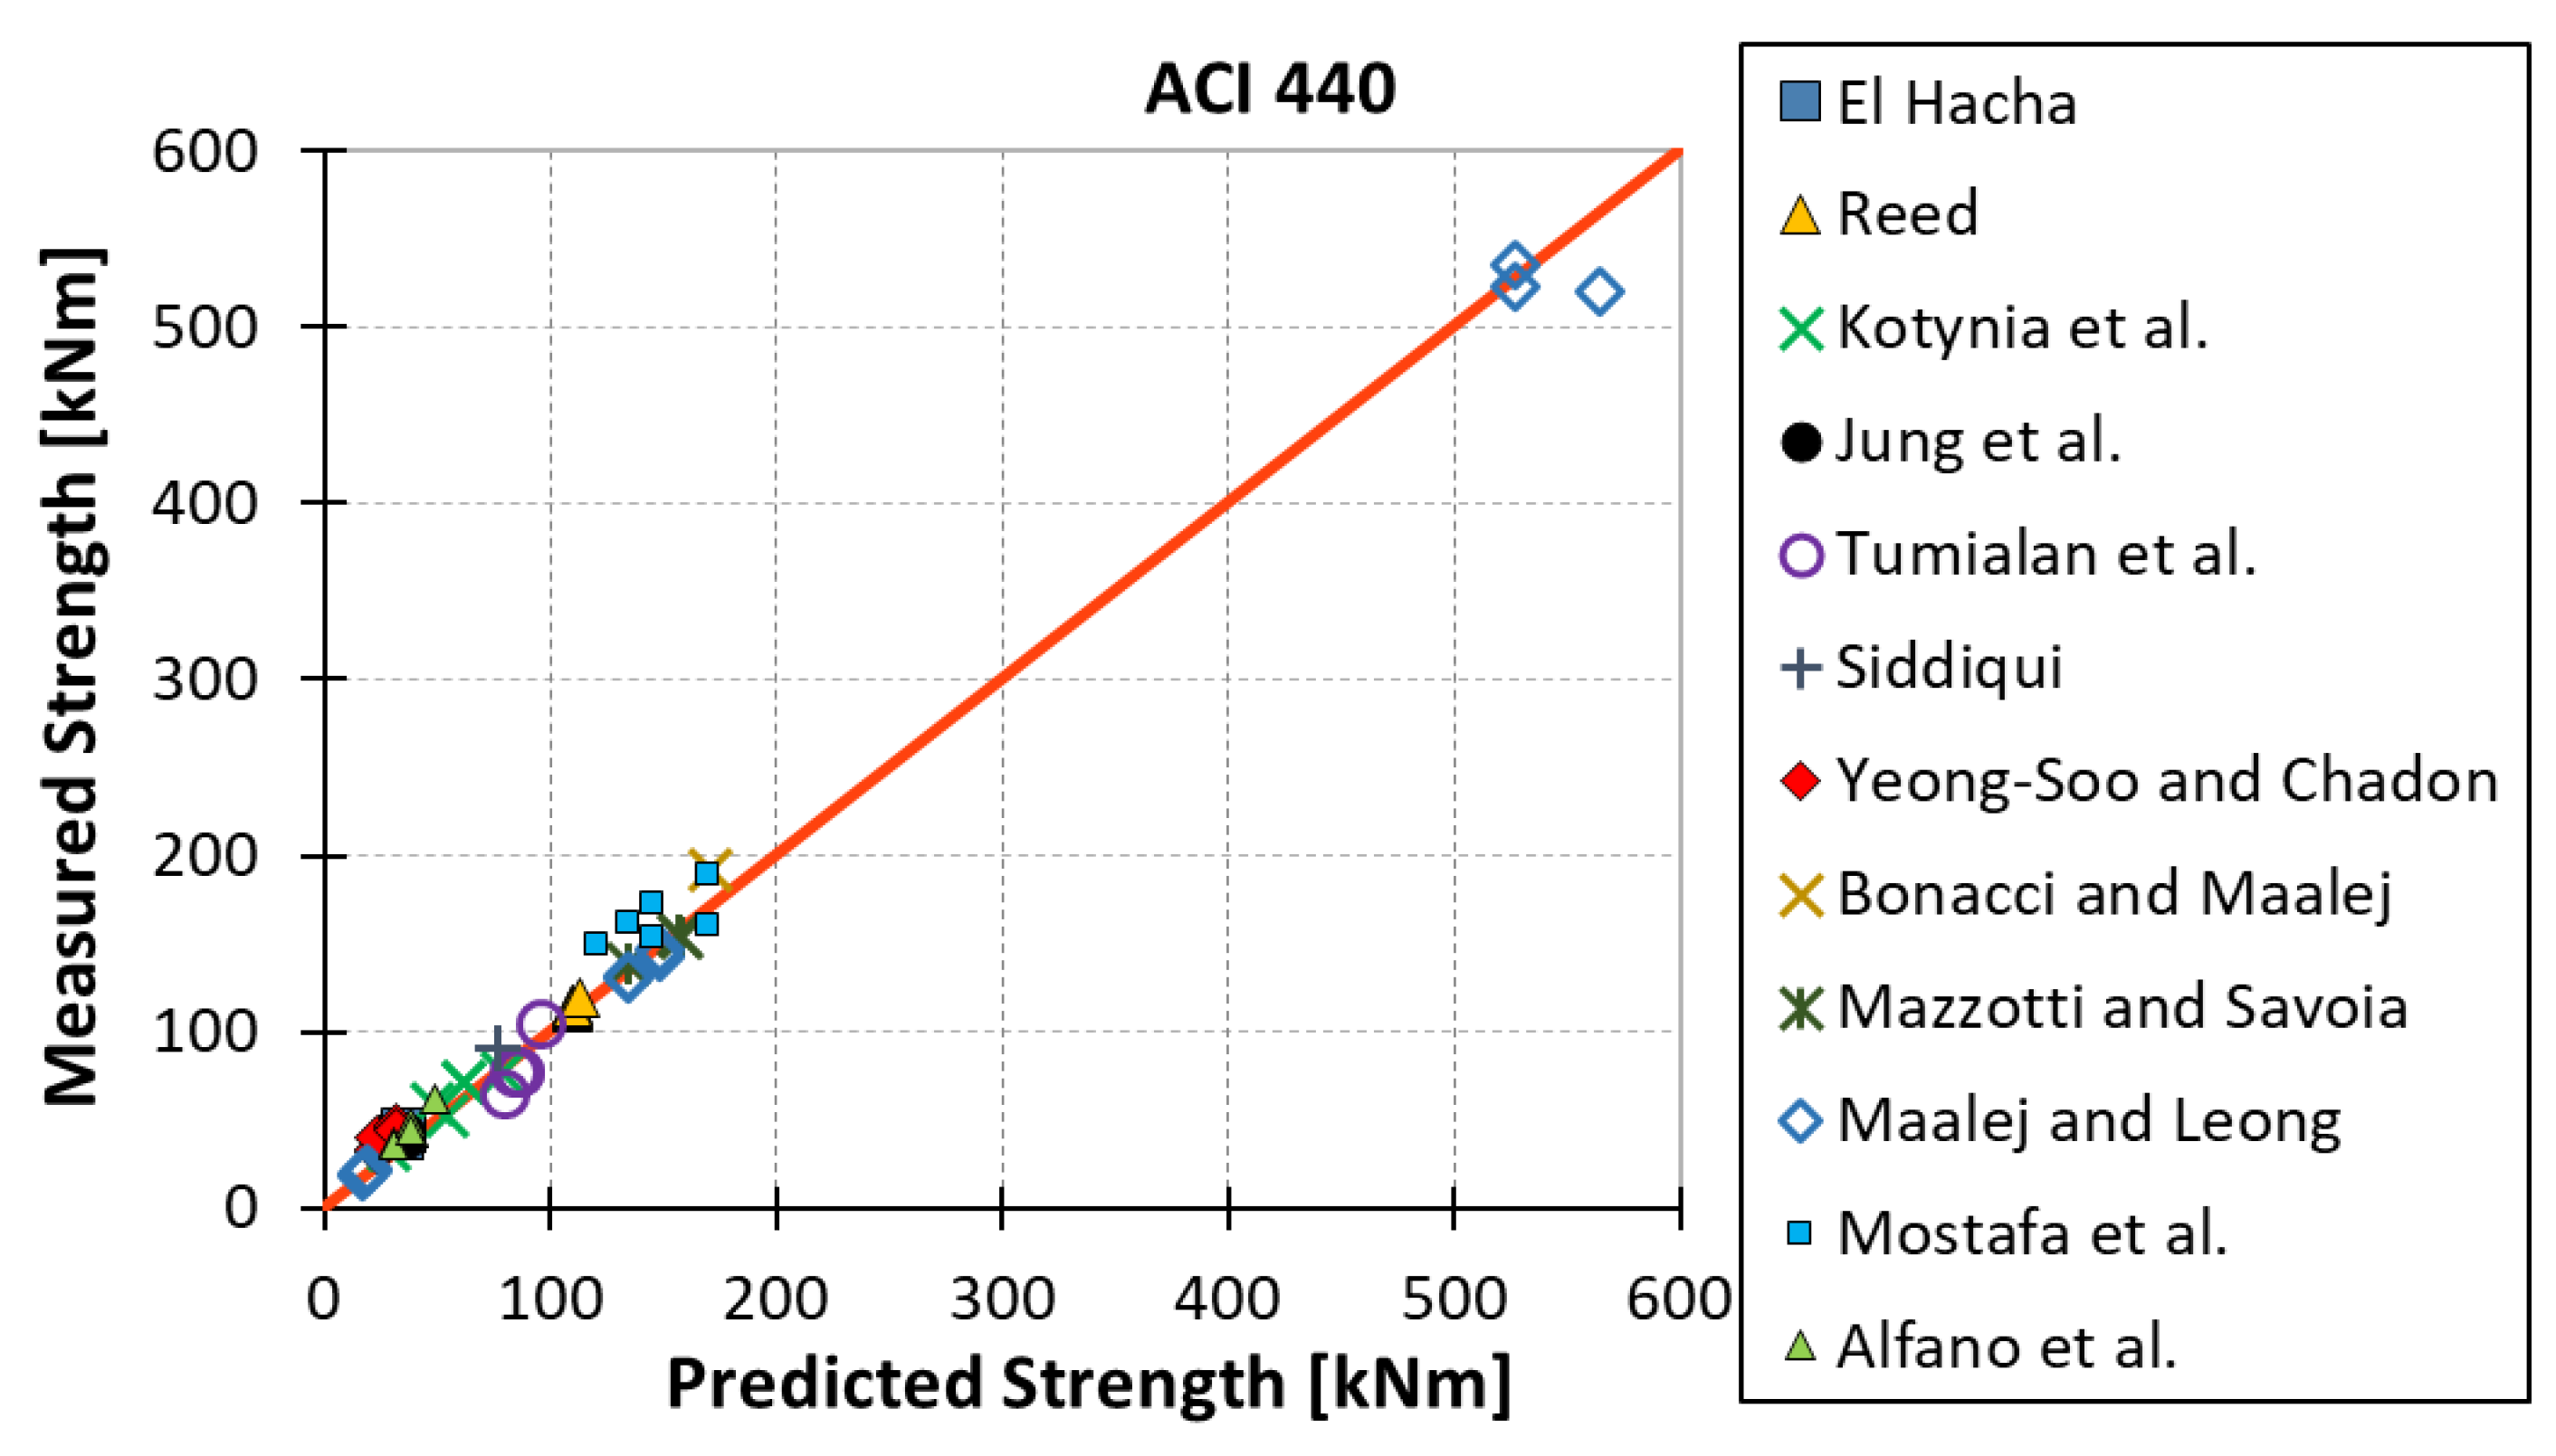
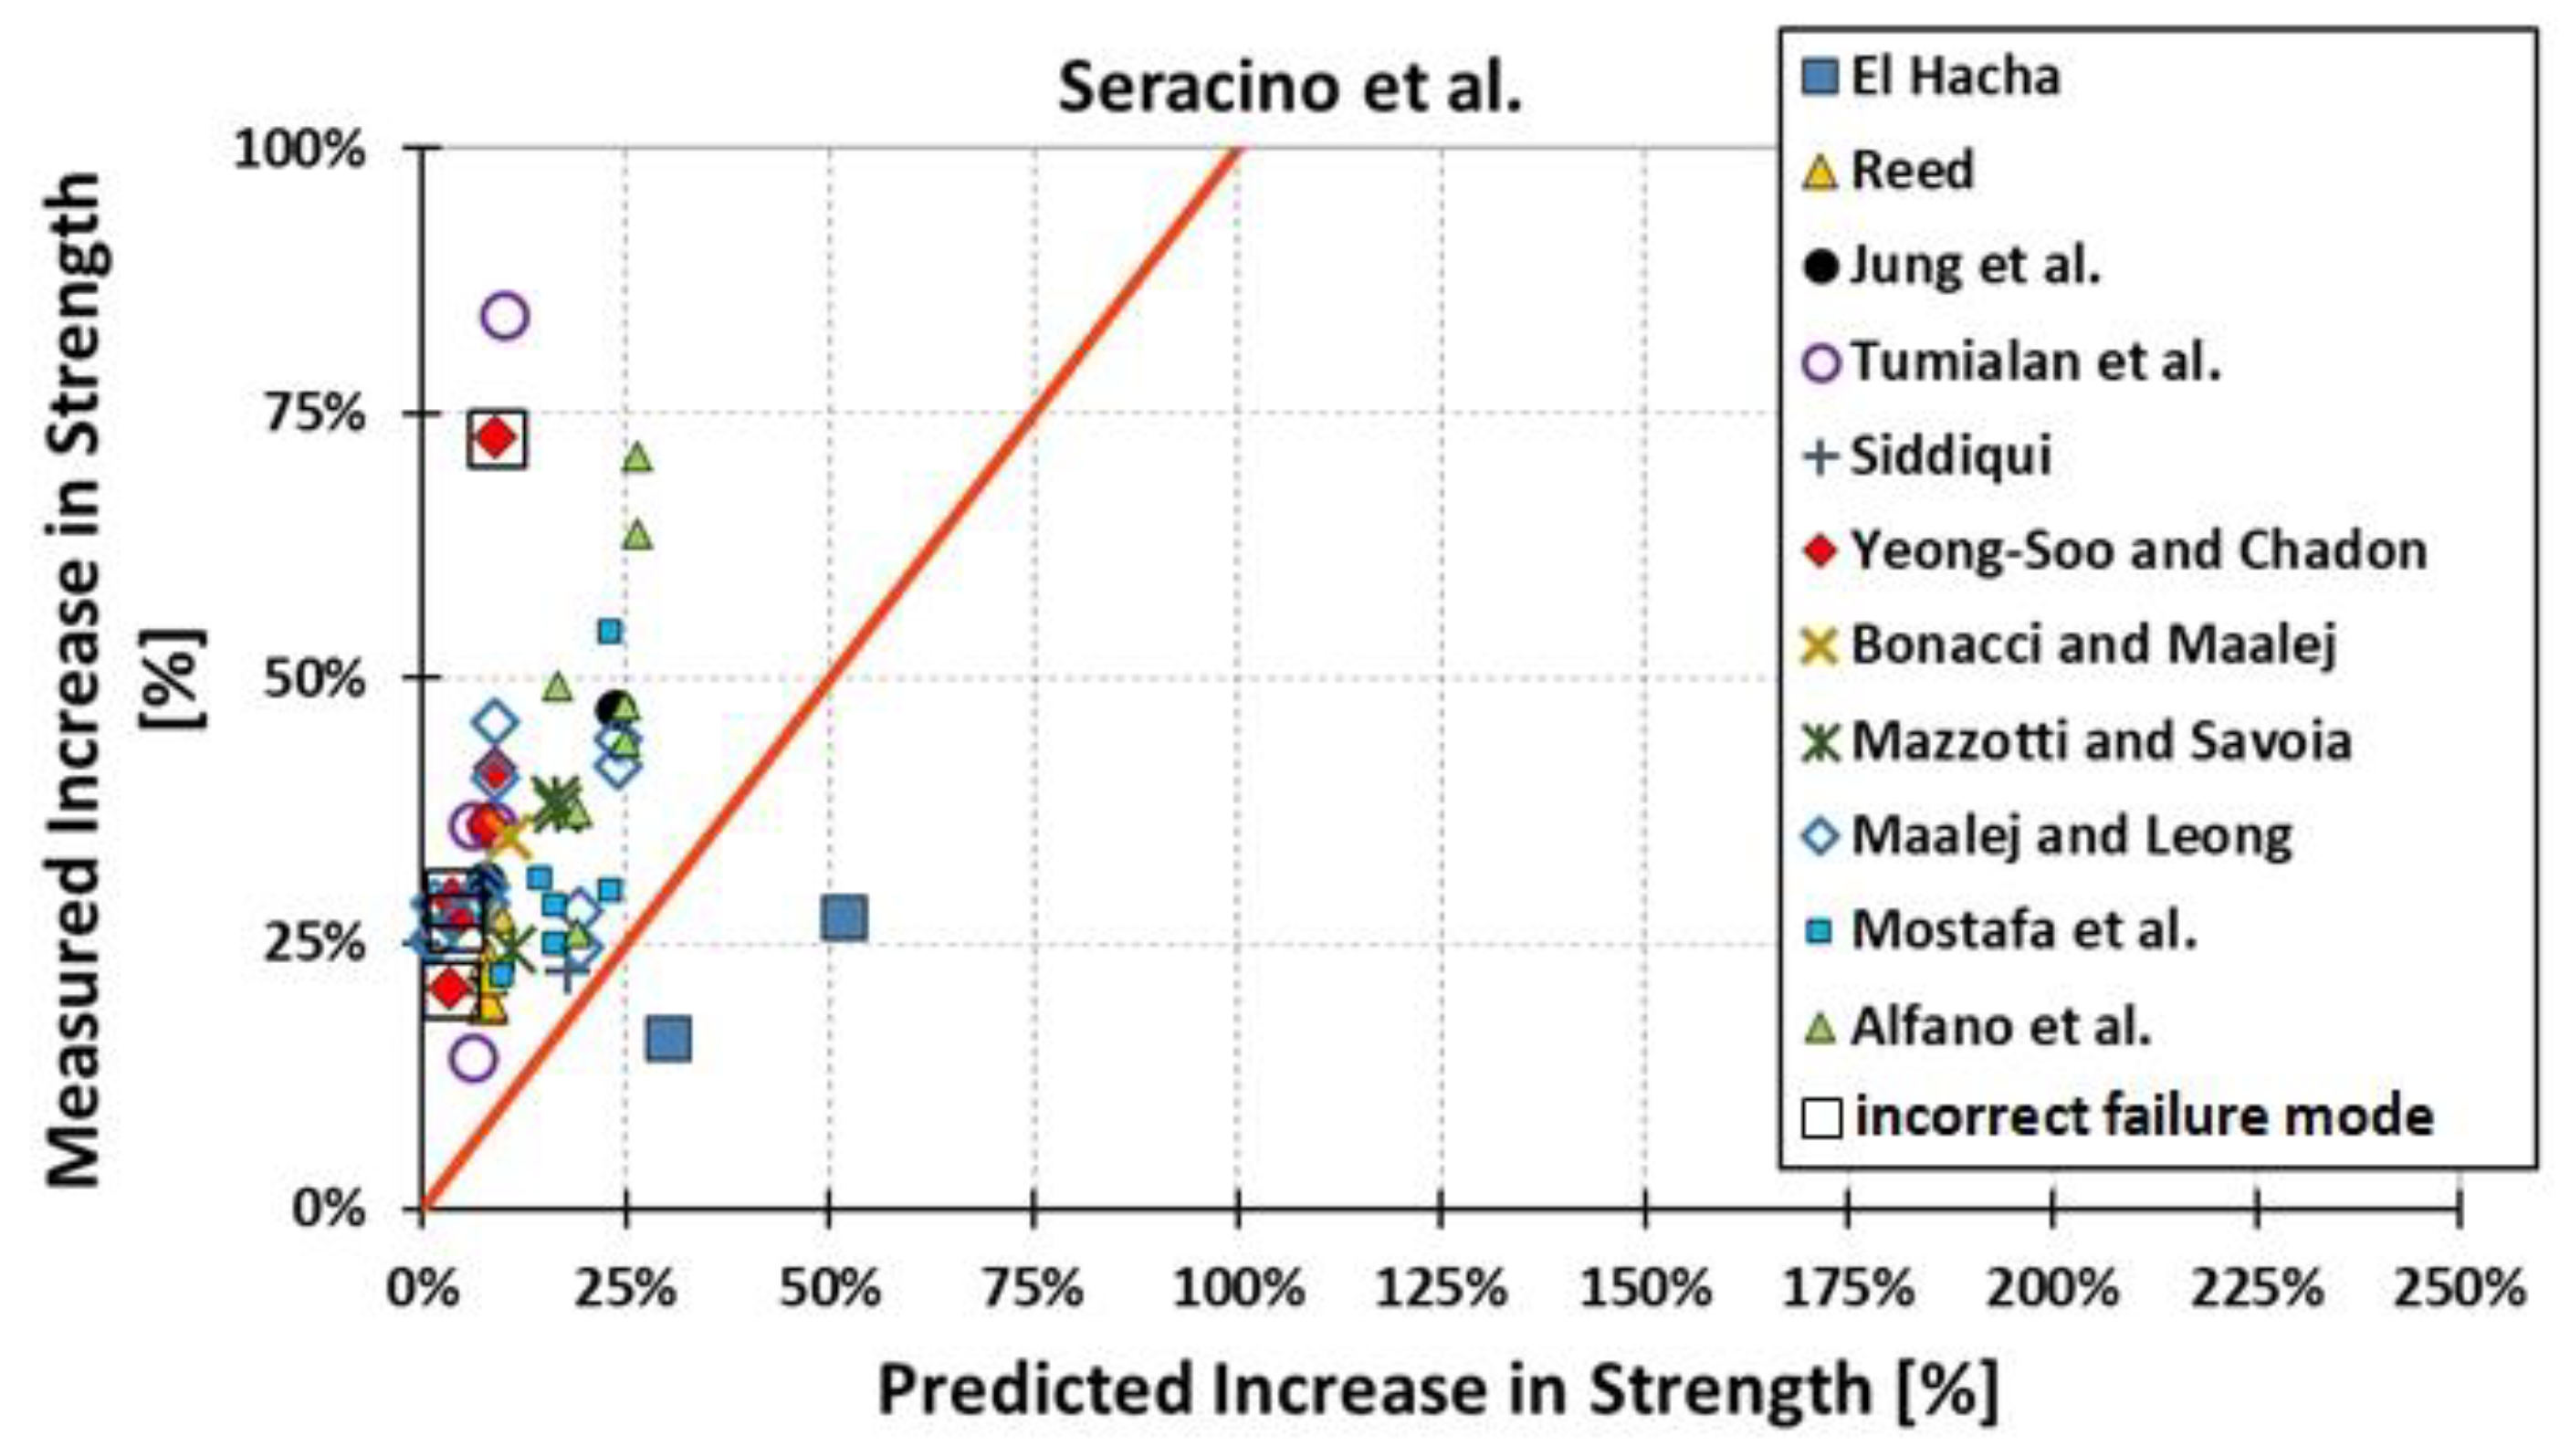
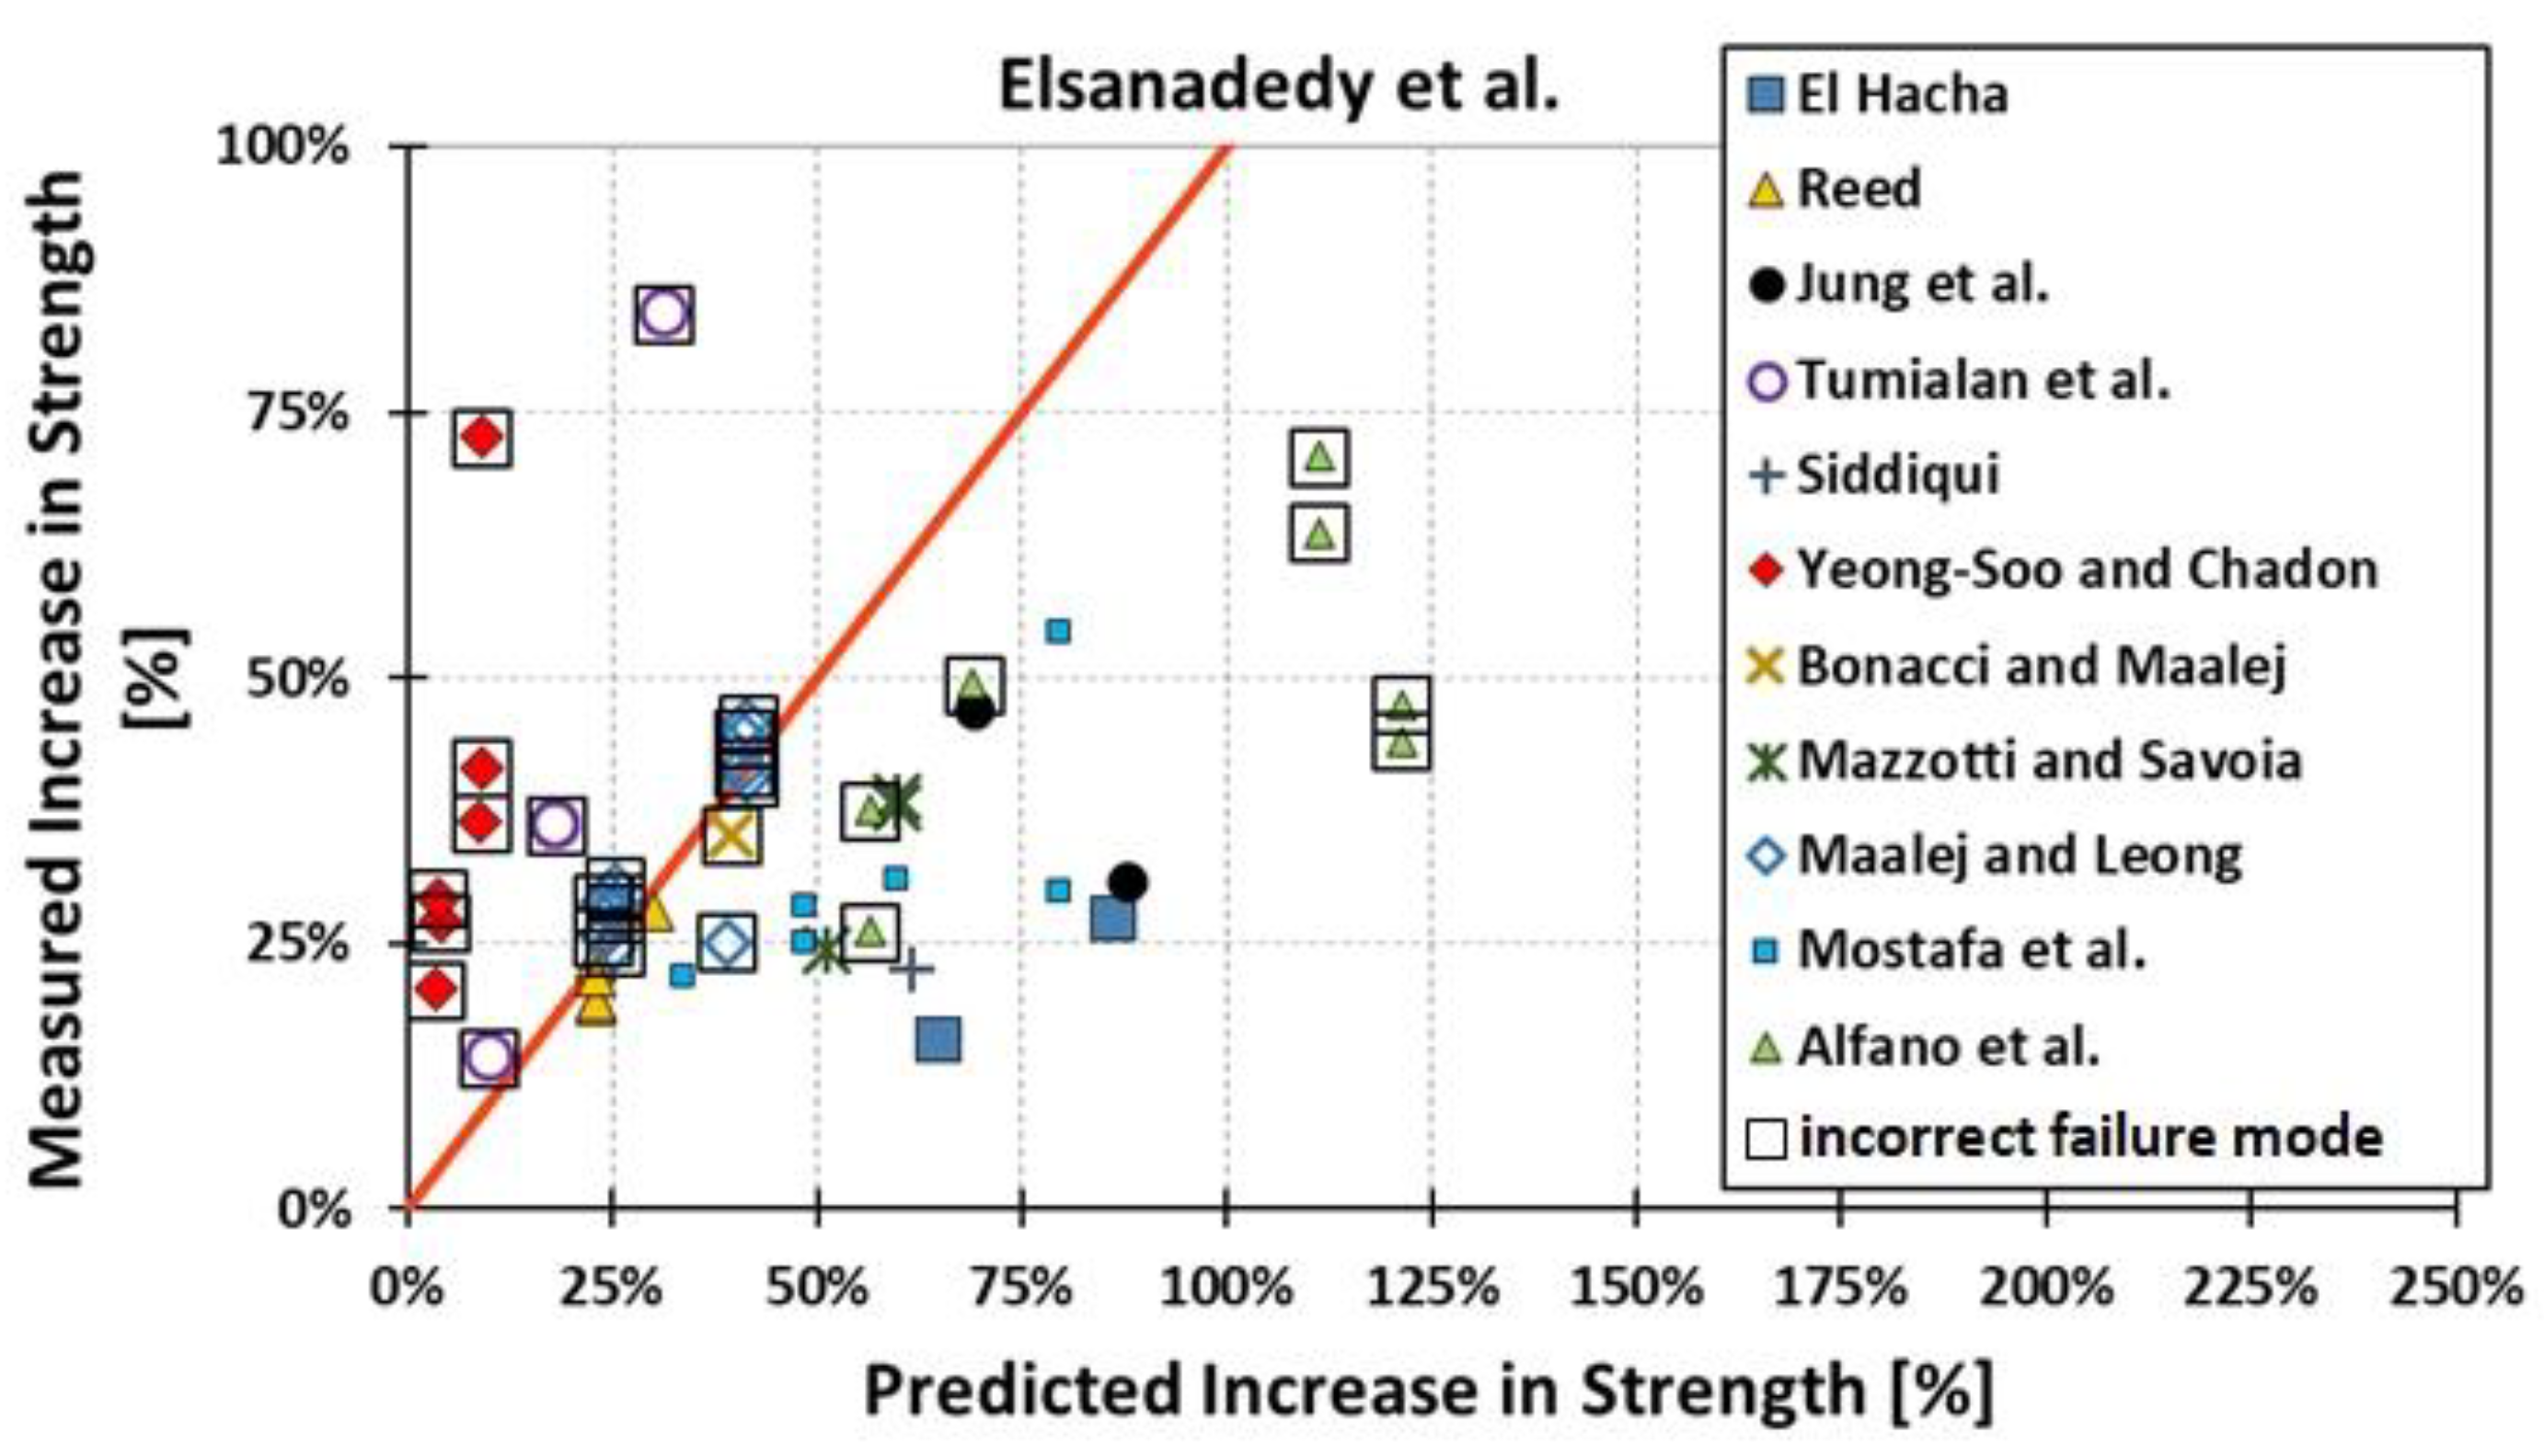
- Plots of measured versus predicted values (Figure 4, Figure 5, Figure 6, Figure 7, Figure 8, Figure 9, Figure 10, Figure 12, Figure 13, Figure 14, Figure 15, Figure 16, Figure 17 and Figure 18)—the greatest accuracy is achieved when the points are closest to the line of equality (red). Unconservative predictions are located below this line, while conservative predictions are above this line.
- It is readily apparent that the fib bulletin 14 approach shows a wide dispersion (greatest standard deviation, 24.4%) of predictions relative to measured values (Figure 5) and a large proportion of highly overestimated results, which can be unsafe. The interquartile range is the largest. Similar problems with all fib bulletin 14 approaches were reported by others [8,20]. The Teng et al. and Lu models give similar results and have a slightly greater proportion of values on the conservative side. However, these two models are less accurate than the Elsanadedy et al. and Said and Wu models. The Seracino et al. model was calibrated based on push–pull tests. Such tests were meant to study the performance of the strength of the bond and transfer of the force at the FRP–concrete interface, which can also be called the shear method of testing. The results obtained in this way differ from those obtained in the tests of actual reinforced flexural elements, resulting in the Seracino et al. model being very conservative. Based on the mean value (1.1%) and median (1.6%), the best predictability was obtained from the Said and Wu model; the dispersion as measured by the standard deviation is slightly greater than several others, but the interquartile range is one of the smallest. Furthermore, 48% of the predicted values were higher than the measured capacity, including those for which crushing of concrete (CC) or rupture (R) of the FRP plate was predicted to be the failure mode. Similar behavior can be observed in the case of the Elsanadedy et al. model because IC debonding failure often occurred at almost the same load as the other failure modes. The strength values calculated for the various failure modes can be very similar. It can be assessed that the Elsanadedy et al. model takes second place after the Said and Wu model. The simple ACI 440 model is more conservative than the two mentioned above but exhibits a smaller relative error (standard deviation 12.1%). The accuracy of this model is slightly worse than that of the Teng et al. and Lu et al. models.
4. Conclusions
- If the mean values of the deviation of the predicted load capacity from the measured value are compared, the Said and Wu (2008) model gives the best results (mean error value 1.1%), but compared to most other methods, the standard deviation is quite high. The Elsanadedy et al. model, which is one of the most complex compared to other investigated models, is next best (mean error value 3.5%). The authors of both models also provide modified versions that include appropriate safety margins. Therefore, both models are ready to be implemented in the standards and are noteworthy.
- The newer models (Said and Wu and Elsanadedy et al.), despite employing quite different approaches, provide very similar results and accuracy.
- Two models distinguished by their simplicity and ease of application—the ACI 440 and the Said and Wu model—give good results compared to other more complex models.
- The best match between the predicted and measured increase in strength was obtained using the ACI 440 method application (mean error value 1.0%).
- The fib bulletin 14 (fib 2001) approach features a wide dispersion and a large share of highly overestimated results, which can be unsafe.
- The largest share of incorrect failure mode predictions was observed for the Elsanadedy et al. model (52%) and the Said and Wu model (48%). This means that the values of the load capacity estimated with the use of these models exceeded those determined for flexural failures. The limitations of the calculated value of the load capacity introduced on this basis affect the results of the model accuracy analysis.
- Most studies presented in the literature do not give full results of materials testing. This mainly applies to FRP plate strength parameters or even test results for unreinforced beams. Therefore, the available results database is still not sufficient for the creation of a fully effective IC debonding model. More complex tests of strengthened RC beams are needed. The article indicates sources with flexural test data collected from the existing literature, which can be used in other works to test and calibrate debonding models.
- The analysis presented in the article was carried out with the use of models in design in mind. Therefore, a broader study of the parameters that appear in individual models has not been undertaken. The focus is on accuracy and simplicity, which are the two most important guidelines for standard development.
Author Contributions
Funding
Institutional Review Board Statement
Informed Consent Statement
Data Availability Statement
Conflicts of Interest
References
- Schiebel, S.; Parretti, R.; Nanni, A.; Huck, M. Strengthening and Load Testing of Three Bridges in Boone County, Missouri. Pract. Period. Struct. Des. Constr. 2002, 7, 156–163. [Google Scholar] [CrossRef]
- Carmichael, B.W.; Barnes, R.W. Repair of the Uphapee Creek Bridge with FRP Laminates; No. RP-930-466-2; Highway Research Center, Auburn University: Auburn, AL, USA, 2005. [Google Scholar]
- International Federation for Structural Concrete (FIB). Externally Bonded FRP Reinforcement for RC Structures; Bulletin 14; International Federation for Structural Concrete (FIB): Lausanne, Switzerland, 2001. [Google Scholar]
- Tworzewski, P.; Bacharz, K.; Michałowska-Maziejuk, D. Anchorage Systems in FRP-Strengthened Reinforced Concrete. JCEEA 2018, 65, 101–110. [Google Scholar]
- McGuirk, G.N.; Breña, S.F. Development of Anchorage System for FRP Strengthening Applications Using Integrated FRP Composite Anchors; Report Submitted to the Concrete Research Council of the ACI Foundation; Department of Civil and Environmental Engineering, University of Massachusetts: Amherst, MA, USA, 2012. [Google Scholar]
- Mostofinejad, D.; Mahmoudabadi, E. Grooving as Alternative Method of Surface Preparation to Postpone Debonding of FRP Laminates in Concrete Beams. J. Compos. Constr. 2010, 14, 804–811. [Google Scholar] [CrossRef]
- Ye, L.P.; Lu, X.Z.; Chen, J.F. Design Proposals for the Debonding Strengths of FRP Strengthened RC Beams in the Chinese Design Code. In Proceedings of the International Symposium on Bond Behaviour of FRP in Structures (BBFS 2005), Hong Kong, China, 7–9 December 2005; pp. 45–54. [Google Scholar]
- Said, H.; Wu, Z. Evaluating and Proposing Models of Predicting IC Debonding Failure. J. Compos. Constr. 2008, 12, 284–299. [Google Scholar] [CrossRef]
- Teng, J.G.; Smith, S.T.; Yao, J.; Chen, J.F. Intermediate crack-induced debonding in RC beams and slabs. Constr. Build. Mater. 2003, 17, 447–462. [Google Scholar] [CrossRef]
- Standards Australia. Design Handbook for RC Structures Retrofitted with FRP and Metal Plates: Beams and Slabs; HB 305-2008; Standards Australia: Sydney, Australia, 2008. [Google Scholar]
- Reed, M.W.; Barnes, R.W.; Schindler, A.K.; Lee, H.-W. Fiber-Reinforced Polymer Strengthening of Concrete Bridges that Remain Open to Traffic. ACI Struct. J. 2005, 102, 823–831. [Google Scholar]
- Thamrin, R.; Zaidir, Z.; Desharma, S. Debonding Failure Analysis of Reinforced Concrete Beams Strengthened with CFRP Plates. Polymers 2021, 13, 2738. [Google Scholar] [CrossRef]
- Abed, R.J.; Mashrei, M.A.; Sultan, A.A. Evaluating Flexural Strength of RC Beams Strengthened by CFRP using Different Analytical Models. Civ. Environ. Eng. 2021, 17, 465–475. [Google Scholar] [CrossRef]
- Al-Saawani, M.A.; Al-Negheimish, A.I.; El-Sayed, A.K.; Alhozaimy, A.M. Finite Element Modeling of Debonding Failures in FRP-Strengthened Concrete Beams Using Cohesive Zone Model. Polymers 2022, 14, 1889. [Google Scholar] [CrossRef]
- Milani, G.; Grande, E.; Bertolesi, E.; Rotunno, T.; Fagone, M. Debonding mechanism of FRP strengthened flat surfaces: Analytical approach and closed form solution. Constr. Build. Mater. 2021, 302, 124144. [Google Scholar] [CrossRef]
- Berardi, V.P. Fracture Failure Modes in Fiber-Reinforced Polymer Systems Used for Strengthening Existing Structures. Appl. Sci. 2021, 11, 6344. [Google Scholar] [CrossRef]
- Sayed, A.M. Modelling of bond strength of FRP-concrete interface on the basis of a comprehensive experimental database. J. Eng. Sci. Technol. 2019, 14, 3309–3326. [Google Scholar]
- Min, X.; Zhang, J.; Wang, C.; Song, S.; Yang, D. Experimental Investigation of Fatigue Debonding Growth in FRP-Concrete Interface. Materials 2020, 13, 1459. [Google Scholar] [CrossRef] [PubMed]
- Elsanadedy, H.M.; Abbas, H.; Al-Salloum, Y.A.; Almusallam, T.H. Prediction of Intermediate Crack Debonding Strain of Externally Bonded FRP Laminates in RC Beams and One-Way Slabs. J. Compos. Constr. 2014, 18, 04014008. [Google Scholar] [CrossRef]
- Alfano, G.; Cicco, F.D.; Prota, A. Intermediate Debonding Failure of RC Beams Retrofitted in Flexure with FRP: Experimental Results versus Prediction of Codes of Practice. J. Compos. Constr. 2012, 16, 185–195. [Google Scholar] [CrossRef][Green Version]
- Lu, X.Z.; Teng, J.G.; Ye, L.P.; Jiang, J.J. Intermediate Crack Debonding in FRP-Strengthened RC Beams: FE Analysis and Strength Model. J. Compos. Constr. 2007, 11, 161–174. [Google Scholar] [CrossRef]
- Teng, J.G.; Chen, J.F.; Smith, S.T.; Lam, L. FRP Strengthening RC Structures; John Wiley and Sons Ltd.: Chichester, UK, 2002. [Google Scholar]
- Lu, X.Z. Studies of FRP-Concrete Interface. Ph.D. Thesis, Tsinghua University, Beijing, China, 2004. [Google Scholar]
- Seracino, R.; Raizal Saifulnaz, M.R.; Oehlers, D.J. Generic Debonding Resistance of EB and NSM Plate-to-Concrete Joints. J. Compos. Constr. 2007, 11, 62–70. [Google Scholar] [CrossRef]
- ACI Committee 440. Guide for the Design and Construction of Externally Bonded FRP Systems for Strengthening Concrete Structures; ACI 440.2R-17; American Concrete Institute (ACI): Farmington Hills, MI, USA, 2017. [Google Scholar]
- China Association for Engineering Construction Standardization (CECS146). Technical Specification for Strengthening Concrete Structure with Carbon Fiber Reinforced Polymer Laminate; China Planning Press: Beijing, China, 2003. [Google Scholar]
- Seracino, R.; Jone, N.M.; Ali, M.S.M.; Page, M.W.; Oehlers, D.J. Bond Strength of Near-Surface Mounted FRP Strip-to-Concrete Joints. J. Compos. Constr. 2007, 11, 401–409. [Google Scholar] [CrossRef]
- Benjamin, Z.R. Effect of Adhesive Stiffness and CFRP Geometry on the Behavior of Externally Retrofit Measures Subject to Monotonic Loads. Master’s Thesis, Pittsburgh University, Pittsburgh, PA, USA, 2005. [Google Scholar]
- El-Hacha, R.; Rizkalla, S.H. Near-Surface-Mounted Fiber-Reinforced Polymer Reinforcements for Flexural Strengthening of Concrete Structures. ACI Struct. J. 2004, 101, 717–726. [Google Scholar]
- Jung, W.-T.; Park, Y.-H.; Park, J.-S.; Kang, J.-Y.; You, Y.-J. Experimental Investigation on Flexural Behavior of RC Beams Strengthened by NSM CFRP Reinforcements. In Proceedings of the 7th International Symposium on Fiber-Reinforced Polymer (FRP) Reinforcement for Concrete Structures, Kansas City, MI, USA, 6–9 November 2005; pp. 795–806. [Google Scholar]
- Kotynia, R.; Kaminska, M.E. Experimental Research on RC Beams Strengthened with CFRP Strips; Report No. 9; Department of Concrete Structures, Technical University of Lodz: Lodz, Poland, 2000. [Google Scholar]
- Kotynia, R.; Kaminska, M.E. Ductility and Failure Mode of RC Beams Strengthened for Flexure with CFRP; Report No. 13; Department of Concrete Structures, Technical University of Lodz: Lodz, Poland, 2003. [Google Scholar]
- Tumialan, G.; Serra, P.; Nanni, A.; Belarbi, A. Concrete Cover Delamination in RC Beams Strengthened with FRP Sheets. SP-188. In Proceedings of the 4th International Symposium on FRP for Reinforcement of Concrete Structures (FRPRCS4), Baltimore, MD, USA, 31 October–5 November 1999; American Concrete Institute: Farmington Hills, MI, USA, 1999; pp. 725–735. [Google Scholar]
- Siddiqui, N.A. Experimental investigation of RC beams strengthened with externally bonded FRP composites. Lat. Am. J. Solids Struct. 2009, 6, 343–362. [Google Scholar]
- Yeong-Soo, S.; Chadon, L. Flexural Behavior of Reinforced Concrete Beams Strengthened with Carbon Fiber-Reinforced Polymer Laminates at Different Levels of Sustaining Load. ACI Struct. J. 2003, 100, 231–239. [Google Scholar]
- Bonacci, J.F.; Maalej, M. Externally Bonded Fiber-Reinforced Polymer for Rehabilitation of Corrosion Damaged Concrete Beams. ACI Struct. J. 2000, 97, 703–711. [Google Scholar]
- Mazzotti, C.; Savoia, M. Experimental Tests on Intermediate Crack Debonding Failure in FRP—Strengthened RC Beams. Adv. Struct. Eng. 2009, 12, 701–713. [Google Scholar] [CrossRef]
- Maalej, M.; Leong, K.S. Effect of beam size and FRP thickness on interfacial shear stress concentration and failure mode of FRP-strengthened beams. Compos. Sci. Technol. 2005, 65, 1148–1158. [Google Scholar] [CrossRef]
- Mostafa, A.; Razaqpur, G.A. CFRP Anchor for Preventing Premature Debonding of Externally Bonded FRP Laminates from Concrete. J. Compos. Constr. 2013, 17, 641–650. [Google Scholar] [CrossRef]


| L | L/d | fc | ff | Ef | fy | Es | ρs | ρf | bf/b | |
|---|---|---|---|---|---|---|---|---|---|---|
| (mm) | (MPa) | (MPa) | (MPa) | (MPa) | (MPa) | |||||
| Mean value | 3156 | 11.45 | 39.1 | 2852 | 224,000 | 446 | 197,600 | 0.011 | 0.0012 | 0.54 |
| Median value | 3000 | 11.11 | 42.8 | 2915 | 227,000 | 435 | 200,000 | 0.008 | 0.0011 | 0.45 |
| Standard deviation | 1068 | 2.00 | 13.3 | 821 | 80,600 | 75.4 | 9005 | 0.006 | 0.0009 | 0.36 |
| Maximum value | 4800 | 15.56 | 57.7 | 3900 | 400,000 | 552 | 207,500 | 0.025 | 0.0044 | 1.00 |
| Minimum value | 1500 | 7.55 | 18 | 846 | 45,000 | 330 | 180,000 | 0.004 | 0.0001 | 0.09 |
| References | Specimen ID | Experimental | fib | Teng et al. | Lu | Seracino et al. | Said and Wu | Elsanadedy et al. | ACI 440 | ||||||||
|---|---|---|---|---|---|---|---|---|---|---|---|---|---|---|---|---|---|
| Mexp | ΔMexp | Mpred | ΔMpred | Mpred | ΔMpred | Mpred | ΔMpred | Mpred | ΔMpred | Mpred | ΔMpred | Mpred | ΔMpred | Mpred | ΔMpred | ||
| (kNm) | (kNm) | (kNm) | (kNm) | (kNm) | (kNm) | (kNm) | (kNm) | (kNm) | (kNm) | (kNm) | (kNm) | (kNm) | (kNm) | (kNm) | (kNm) | ||
| El Hacha and Rizkalla [29] | B2a | 40.3 | 5.6 | 32.3 | 7.6 | 38.8 | 14.1 | 39.9 | 15.3 | 32.1 | 7.5 | 39.9 | 15.2 | 40.6 | 16.0 | 33.8 | 9.1 |
| B2b | 40.3 | 5.6 | 32.3 | 7.6 | 38.8 | 14.1 | 39.9 | 15.3 | 32.1 | 7.5 | 39.9 | 15.2 | 40.6 | 16.0 | 33.8 | 9.1 | |
| B4a | 44.2 | 9.5 | 40.4 | 15.7 | 49.2 | 24.5 | 53.0 | 28.4 | 37.4 | 12.7 | 47.8 | 23.2 | 45.9 | 21.3 | 34.8 | 10.2 | |
| Jung et al. [30] | CPL-50-BOND | 38.5 | 9.1 | 57.2 | 34.8 | 36.9 | 14.5 | 37.0 | 14.6 | 24.1 | 1.8 | 41.4 | 19.1 | 42.0 | 19.7 | 36.1 | 13.7 |
| SH-BOND | 43.3 | 13.8 | 37.3 | 14.9 | 33.9 | 11.5 | 37.3 | 14.9 | 27.7 | 5.3 | 40.0 | 17.7 | 37.9 | 15.5 | 36.2 | 13.8 | |
| Reed et al. [10] | B1 | 111.7 | 18.0 | 159.7 R | 72.4 | 108.3 | 21.0 | 111.8 | 24.5 | 94.2 | 6.9 | 110.2 | 22.9 | 107.5 | 20.2 | 109.7 | 22.4 |
| B2 | 115.5 | 21.8 | 159.7 R | 72.4 | 108.3 | 21.0 | 111.8 | 24.5 | 94.2 | 6.9 | 110.2 | 22.9 | 107.5 | 20.2 | 109.7 | 22.4 | |
| B3 | 112.1 | 18.4 | 159.7 R | 72.4 | 108.3 | 21.0 | 111.8 | 24.5 | 94.2 | 6.9 | 110.2 | 22.9 | 107.5 | 20.2 | 109.7 | 22.4 | |
| B4 | 115.8 | 22.1 | 159.7 R | 72.4 | 108.3 | 21.0 | 111.8 | 24.5 | 94.2 | 6.9 | 110.2 | 22.9 | 107.5 | 20.2 | 109.7 | 22.4 | |
| B5 | 112.1 | 18.4 | 159.7 R | 72.4 | 108.3 | 21.0 | 111.8 | 24.5 | 94.2 | 6.9 | 110.2 | 22.9 | 107.5 | 20.2 | 109.7 | 22.4 | |
| B6 | 114.2 | 20.5 | 159.7 R | 72.4 | 108.3 | 21.0 | 111.8 | 24.5 | 94.2 | 6.9 | 110.2 | 22.9 | 107.5 | 20.2 | 109.7 | 22.4 | |
| B7 | 119.7 | 26.2 | 172.4 | 85.0 | 111.7 | 24.3 | 115.4 | 27.9 | 95.4 | 8.0 | 115.5 | 28.1 | 113.7 | 26.3 | 113.5 | 26.0 | |
| Kotynia et al. [31,32] | B-08/s | 72.0 | - | 63.2 | 21.5 | 61.5 | 19.8 | 60.4 | 18.8 | 48.1 | 6.4 | 70.4 | 28.8 | 68.8 | 27.1 | 61.4 | 19.8 |
| B0-08/s | 72.0 | - | 63.8 | 22.0 | 62.0 | 20.1 | 61.5 | 19.6 | 48.5 | 6.6 | 71.0 | 29.1 | 69.2 | 27.3 | 62.3 | 20.4 | |
| BF-06/s | 59.9 | - | 49.7 | 21.3 | 48.2 | 19.7 | 48.3 | 19.9 | 35.4 | 7.0 | 57.0 | 28.5 | 55.1 | 26.6 | 48.1 | 19.7 | |
| BF-04/0.5s | 33.6 | - | 39.2 R | 20.7 | 30.4 | 11.9 | 30.2 | 11.7 | 22.8 | 4.4 | 32.6 | 14.1 | 31.8 | 13.3 | 28.6 | 10.2 | |
| B-08S | 52.8 | - | 66.6 | 25.1 | 56.0 | 14.5 | 55.4 | 13.9 | 46.0 | 4.5 | 59.7 | 18.2 | 59.4 | 17.8 | 54.0 | 12.5 | |
| B-08M | 77.0 | - | 63.3 | 21.4 | 72.2 | 30.2 | 74.0 | 32.0 | 53.6 | 11.6 | 98.5 | 56.5 | 97.0 | 55.0 | 78.9 | 36.9 | |
| Tumialan et al. [33] | A1 | 77.6 | 20.6 | 81.2 | 7.9 | 86.6 CC | 13.3 | 86.6 CC | 13.3 | 79.8 | 6.4 | 86.6 CC | 13.3 | 86.6 CC | 13.3 | 86.6 CC | 13.3 |
| A2 | 104.9 | 48.0 | 82.6 | 9.3 | 91.7 | 18.4 | 96.1 | 22.7 | 80.8 | 7.4 | 96.2 CC | 22.9 | 96.2 CC | 22.9 | 96.1 | 22.8 | |
| A6 | 65.1 | 8.1 | 80.6 CC | 7.3 | 80.6 CC | 7.3 | 80.6 CC | 7.3 | 77.9 | 4.6 | 80.6 CC | 7.3 | 80.6 CC | 7.3 | 80.6 CC | 7.3 | |
| A7 | 77.6 | 20.6 | 86.6 CC | 13.3 | 86.6 CC | 13.3 | 86.6 CC | 13.3 | 78.1 | 4.7 | 86.6 CC | 13.3 | 86.6 CC | 13.3 | 84.9 | 11.6 | |
| C1 | 77.6 | 20.6 | 81.2 | 7.9 | 86.6 CC | 13.3 | 86.6 CC | 13.3 | 79.8 | 6.4 | 86.6 CC | 13.3 | 86.6 CC | 13.3 | 86.6 CC | 13.3 | |
| Siddiqui [34] | BFS1 | 90.6 | 16.6 | 59.7 | 11.5 | 70.9 | 22.7 | 73.0 | 24.8 | 56.8 | 8.6 | 87.8 | 39.5 | 78.0 | 29.7 | 77.3 | 29.1 |
| Yeong-Soo and Chadon [35] | R20 | 31.5 | 8.4 | 24.4 R | 2.0 | 24.4 R | 2.0 | 24.4 R | 2.0 | 24.2 | 1.8 | 24.4 R | 2.0 | 24.4 R | 2.0 | 23.6 | 1.2 |
| R2L | 32.7 | 9.6 | 24.4 R | 2.0 | 24.4 R | 2.0 | 24.4 R | 2.0 | 24.4 | 2.0 | 24.4 R | 2.0 | 24.4 R | 2.0 | 23.6 | 1.2 | |
| R2H | 39.9 | 16.8 | 24.4 R | 2.0 | 24.4 R | 2.0 | 24.4 R | 2.0 | 24.4 R | 2.0 | 24.4 R | 2.0 | 24.4 R | 2.0 | 23.6 | 1.2 | |
| R30 | 46.0 | 9.8 | 32.6 CC | 1.3 | 32.6 CC | 1.3 | 32.6 CC | 1.3 | 32.6 CC | 1.3 | 32.6 CC | 1.3 | 32.6 CC | 1.3 | 32.4 | 1.0 | |
| R3L | 46.8 | 10.6 | 32.5 CC | 1.1 | 32.5 CC | 1.1 | 32.5 CC | 1.1 | 32.5 CC | 1.1 | 32.5 CC | 1.1 | 32.5 CC | 1.1 | 32.4 | 1.0 | |
| R3H | 43.7 | 7.5 | 32.4 CC | 1.1 | 32.4 CC | 1.1 | 32.4 CC | 1.1 | 32.4 CC | 1.1 | 32.4 CC | 1.1 | 32.4 CC | 1.1 | 32.4 | 1.0 | |
| Bonacci and Maalej [36] | B2 | 192.4 | 50.0 | 155.1 | 22.3 | 174.9 | 42.1 | 171.3 | 38.5 | 146.7 | 13.9 | 185.4 CC | 52.6 | 185.4 CC | 52.6 | 170.9 | 38.1 |
| Mazzotti and Savoia [37] | TN3 | 138.5 | 27.2 | 146.9 | 55.6 | 131.4 | 40.1 | 138.3 | 47.0 | 101.4 | 10.1 | 142.5 | 51.2 | 138.1 | 46.8 | 134.8 | 43.5 |
| TN5 | 153.3 | 42.0 | 110.8 | 19.4 | 132.7 | 41.4 | 144.7 | 53.4 | 106.4 | 15.1 | 162.0 | 70.7 | 145.9 | 54.6 | 158.4 | 67.0 | |
| TN8 | 154.4 | 43.1 | 110.5 | 19.3 | 132.3 | 41.0 | 143.7 | 52.5 | 106.1 | 14.9 | 161.4 | 70.2 | 145.7 | 54.4 | 156.9 | 65.7 | |
| Maalej and Leong [38] | A3 | 19.4 | 4.2 | 16.9 CC | 3.4 | 16.9 CC | 3.4 | 16.9 CC | 3.4 | 16.1 | 2.6 | 16.9 CC | 3.4 | 16.9 CC | 3.4 | 16.9 CC | 3.4 |
| A4 | 18.9 | 3.7 | 16.9 CC | 3.4 | 16.9 CC | 3.4 | 16.9 CC | 3.4 | 16.1 | 2.6 | 16.9 CC | 3.4 | 16.9 CC | 3.4 | 16.9 CC | 3.4 | |
| A5 | 21.9 | 6.7 | 17.7 | 4.3 | 19.0 CC | 5.5 | 19.0 CC | 5.5 | 16.7 | 3.2 | 19.0 CC | 5.5 | 19.0 CC | 5.5 | 19.0 CC | 5.5 | |
| A6 | 21.5 | 6.3 | 17.7 | 4.3 | 19.0 CC | 5.5 | 19.0 CC | 5.5 | 16.7 | 3.2 | 19.0 CC | 5.5 | 19.0 CC | 5.5 | 19.0 CC | 5.5 | |
| B3 | 131.8 | 30.7 | 122.1 | 14.8 | 134.6 CC | 27.3 | 134.6 CC | 27.3 | 115.7 | 8.3 | 134.6 CC | 27.3 | 134.6 CC | 27.3 | 134.6 CC | 27.3 | |
| B4 | 130.2 | 29.1 | 122.1 | 14.8 | 134.6 CC | 27.3 | 134.6 CC | 27.3 | 115.7 | 8.3 | 134.6 CC | 27.3 | 134.6 CC | 27.3 | 134.6 CC | 27.3 | |
| B5 | 147.4 | 46.3 | 125.2 | 17.9 | 143.2 | 35.9 | 150.2 | 42.8 | 116.9 | 9.6 | 151.8 CC | 44.4 | 151.8 CC | 44.4 | 148.4 | 41.1 | |
| B6 | 142.2 | 41.1 | 125.2 | 17.9 | 143.2 | 35.9 | 150.2 | 42.8 | 116.9 | 9.6 | 151.8 CC | 44.4 | 151.8 CC | 44.4 | 148.4 | 41.1 | |
| C3 | 522.3 | 106.7 | 454.7 | 23.5 | 514.1 | 82.9 | 533.9 CC | 102.6 | 438.1 | 6.9 | 533.9 CC | 102.6 | 533.9 CC | 102.6 | 526.8 | 95.6 | |
| C4 | 535.4 | 119.8 | 454.7 | 23.5 | 514.1 | 82.9 | 533.9 CC | 102.6 | 438.1 | 6.9 | 533.9 CC | 102.6 | 533.9 CC | 102.6 | 526.8 | 95.6 | |
| C5 | 520.1 | 104.4 | 456.6 | 25.4 | 533.4 | 102.2 | 560.0 | 128.8 | 436.3 | 5.1 | 599.3 CC | 168.0 | 599.3 CC | 168.0 | 564.4 | 133.2 | |
| Mostafa and Razaqpur [39] | B1-F2-N | 172.5 | 38.3 | 108.4 | 22.8 | 125.7 | 40.1 | 135.4 | 49.8 | 99.6 | 14.0 | 147.4 | 61.8 | 127.1 | 41.5 | 145.5 | 59.9 |
| B2-F2-N | 153.8 | 30.8 | 108.4 | 22.8 | 125.7 | 40.1 | 135.4 | 49.8 | 99.6 | 14.0 | 147.4 | 61.8 | 127.1 | 41.5 | 145.5 | 59.9 | |
| B1-F4-N | 189.8 | 66.8 | 117.7 | 32.1 | 141.6 | 56.0 | 154.0 | 68.4 | 105.5 | 19.9 | 182.2 | 96.6 | 153.9 | 68.3 | 170.0 | 84.4 | |
| B2-F4-N | 159.8 | 36.8 | 117.7 | 32.1 | 141.6 | 56.0 | 154.0 | 68.4 | 105.5 | 19.9 | 182.2 | 96.6 | 153.9 | 68.3 | 170.0 | 84.4 | |
| B1-F4-N b90 | 150.0 | 27.0 | 136.0 | 50.4 | 118.2 | 32.6 | 123.3 | 37.7 | 94.1 | 8.5 | 124.1 | 38.5 | 114.4 | 28.7 | 120.4 | 34.8 | |
| B1-F8-N b90 | 161.3 | 38.3 | 156.2 | 70.5 | 131.3 | 45.7 | 137.1 | 51.4 | 98.1 | 12.4 | 146.1 | 60.5 | 136.8 | 51.2 | 134.8 | 49.2 | |
| Alfano et al. [20] | S1 | 42.5 | 13.0 | 50.0 | 24.8 | 45.2 | 20.0 | 38.9 | 13.7 | 31.5 | 6.3 | 55.5 | 30.3 | 55.8 R | 30.6 | 39.1 | 13.9 |
| S2 | 43.5 | 14.0 | 50.0 | 24.8 | 45.2 | 20.0 | 38.9 | 13.7 | 31.5 | 6.3 | 55.5 | 30.3 | 55.8 R | 30.6 | 39.1 | 13.9 | |
| S3 | 62.0 | 20.5 | 50.0 | 13.4 | 57.0 | 20.4 | 50.5 | 13.9 | 42.6 | 6.0 | 61.9 CC | 25.3 | 61.9 CC | 25.3 | 49.2 | 12.6 | |
| S5 | 37.6 | 15.6 | 32.6 | 12.4 | 36.9 | 16.7 | 31.0 | 10.9 | 25.5 | 5.3 | 42.6 CC | 22.4 | 42.6 CC | 22.4 | 31.2 | 11.1 | |
| S6 | 36.0 | 14.0 | 32.6 | 12.4 | 36.9 | 16.7 | 31.0 | 10.9 | 25.5 | 5.3 | 42.6 CC | 22.4 | 42.6 CC | 22.4 | 31.2 | 11.1 | |
| S7 | 48.4 | 13.2 | 32.6 | 3.6 | 46.4 | 17.4 | 40.3 | 11.4 | 34.4 | 5.5 | 45.3 CC | 16.3 | 45.3 CC | 16.3 | 38.7 | 9.7 | |
| S8 | 44.4 | 9.2 | 32.6 | 3.6 | 46.4 | 17.4 | 40.3 | 11.4 | 34.4 | 5.5 | 45.3 CC | 16.3 | 45.3 CC | 16.3 | 38.7 | 9.7 | |
| (Mexp − Mpred)/Mexp (%) | fib | Teng et al. | Lu et al. | Seracino et al. | Said and Wu | Elsanadedy et al. | ACI 440 |
|---|---|---|---|---|---|---|---|
| Mean value | 6.0% | 8.1% | 7.7% | 23.7% | 1.1% | 3.5% | 8.7% |
| Median | 12.9% | 6.4% | 8.5% | 23.6% | 1.6% | 4.1% | 10.2% |
| Maximum value | 38.9% | 38.9% | 38.9% | 44.4% | 38.9% | 38.9% | 41.0% |
| Minimum value | −48.5% | −23.9% | −23.9% | −19.8% | −30.7% | −31.3% | −23.9% |
| Standard deviation | 24.4% | 12.3% | 12.3% | 12.0% | 14.2% | 14.8% | 12.1% |
| Incorrect failure mode prediction | 29% | 28% | 31% | 7% | 48% | 52% | 16% |
| (ΔMexp − ΔMpred)/ΔMexp (%) | fib | Teng and Cheng | Lu et al. | Seracino et al. | Said an Wu | Elsanadedy et al. | ACI 440 |
|---|---|---|---|---|---|---|---|
| Mean value | −16.6% | −2.0% | −6.7% | 61.3% | −25.7% | −15.4% | 1.0% |
| Median | 33.5% | 4.8% | −0.1% | 66.9% | −17.5% | −5.8% | 0.5% |
| Maximum value | 89.3% | 89.3% | 89.3% | 95.2% | 89.3% | 89.3% | 92.9% |
| Minimum value | −301.5% | −158.6% | −198.9% | −34.3% | −173.4% | −187.3% | −129.7% |
| Standard deviation | 118.2% | 54.8% | 60.2% | 27.9% | 69.0% | 64.1% | 48.6% |
| Incorrect failure mode prediction | 29% | 28% | 31% | 7% | 48% | 52% | 16% |
Publisher’s Note: MDPI stays neutral with regard to jurisdictional claims in published maps and institutional affiliations. |
© 2022 by the authors. Licensee MDPI, Basel, Switzerland. This article is an open access article distributed under the terms and conditions of the Creative Commons Attribution (CC BY) license (https://creativecommons.org/licenses/by/4.0/).
Share and Cite
Tworzewski, P.; Alexy, J.K.; Barnes, R.W. Intermediate Crack Debonding of Externally Bonded FRP Reinforcement—Comparison of Methods. Materials 2022, 15, 7390. https://doi.org/10.3390/ma15207390
Tworzewski P, Alexy JK, Barnes RW. Intermediate Crack Debonding of Externally Bonded FRP Reinforcement—Comparison of Methods. Materials. 2022; 15(20):7390. https://doi.org/10.3390/ma15207390
Chicago/Turabian StyleTworzewski, Paweł, Jeffrey K. Alexy, and Robert W. Barnes. 2022. "Intermediate Crack Debonding of Externally Bonded FRP Reinforcement—Comparison of Methods" Materials 15, no. 20: 7390. https://doi.org/10.3390/ma15207390
APA StyleTworzewski, P., Alexy, J. K., & Barnes, R. W. (2022). Intermediate Crack Debonding of Externally Bonded FRP Reinforcement—Comparison of Methods. Materials, 15(20), 7390. https://doi.org/10.3390/ma15207390