Abstract
The use of Ultra-High-Performance Concrete (UHPC) in beams has been growing rapidly in the past two decades due to its superior mechanical and durability properties compared to conventional concrete. One of the areas of interest to designers is the elimination of transverse reinforcement as it simplifies beam fabrication/construction and could result in smaller and lighter beams. UHPC has a relatively high post-cracking tensile strength due to the presence of steel fibers, which enhance its shear strength and eliminate the need for transverse reinforcement. In this paper, UHPC shear test data were collected from the literature to study the effect of the following parameters on the shear strength of UHPC beams without transverse reinforcement: compressive strength, tensile strength, level of prestressing, longitudinal reinforcement ratio, and fiber volume fraction. Statistical analysis of test data indicated that level of prestressing and tensile strength are the most significant parameters for prestressed UHPC beams, whereas longitudinal reinforcement ratio and tensile strength are the most significant parameters for non-prestressed UHPC beams. Additionally, shear strength of the tested UHPC beams was predicted using five models: RILEM TC 162-TDF, 2003, fib Model Code, 2010, French Standard NF P 18-710, 2016, PCI-UHPC Structures Design Guide, 2021, and Draft of AASHTO Guide Specification for Structural Design with UHPC, 2021. Comparing measured against predicted shear strength indicated that the French Standard model provides the closest prediction with the least scatter, where the average measured-to-predicted strength was 1.1 with a standard deviation of 0.38. The Draft of AASHTO provided the second closest prediction where the average measured-to-predicted strength was 1.3 with a standard deviation of 0.64. The other three models underestimated the shear strength.
1. Introduction
Ultra-high-performance concrete (UHPC) is a relatively new class of concrete that has superior mechanical and durability properties compared to conventional concrete. This is primarily due to its very dense matrix of particles and presence of high strength steel fibers. The stress-strain behavior of UHPC in tension and compression is significantly different than that of conventional concrete [1,2]. Limited experimental investigations were conducted to evaluate the shear capacity of UHPC beams when transverse reinforcement is removed. The elimination of transverse reinforcement greatly simplifies beam fabrication and construction and results in thinner webs and lighter sections. The addition of steel fibers in UHPC beams significantly increases the post-cracking tensile strength that typically controls the shear strength in beams (i.e., diagonal tension). Shear strength of UHPC is influenced by several parameters, such as fiber content, concrete compressive and tensile strengths, longitudinal reinforcement ratio, and level of prestressing. Currently, there are limited prediction models that estimate the shear strength of UHPC beams; moreover, there are relatively high margins of safety used in these models due to the limited amount of shear test data [3,4].
This paper presents a database of UHPC beam shear tests available in the literature to study the effect of various parameters on the shear strength when transverse reinforcement is eliminated. Then, five of the popular prediction models, namely RILEM TC 162-TDF, 2003 [5], fib Model Code, 2010 [6], French Standard NF P 18-710, 2016 [7], PCI-UHPC Structures Design Guide, 2021 [8], and Draft of AASHTO Guide Specification for Structural Design with UHPC, 2021 [9] are evaluated by comparing measured against predicted shear strength to determine their accuracy and consistency. The work done in this study is considered the first attempt to collect test data of UHPC beams without shear reinforcement failing in diagonal tension mode.
2. Materials and Methods
This section presents an overview on the UHPC beam shear prediction models and the experiments done on prestressed and non-prestressed UHPC beams.
2.1. Prediction Models
Five prediction models are presented in this section: RILEM TC 162-TDF, 2003 [5], fib Model Code, 2010 [6], French standard, NF P 18-710, 2016 [7], PCI-UHPC Structures Design Guide, 2021 [8], and Draft of AASHTO Guide Specification for Structural Design with UHPC, 2021 [9]. The first three models represent the historical evolution of shear strength prediction approaches from conventional concrete to fiber-reinforced concrete to UHPC internationally, whereas the last two models are recently published in the United States to promote the implementation of UHPC in structural applications. The main differences among these models are the terms that account for the post-cracking tensile strength of UHPC and safety factors.
2.1.1. RILEM TC 162-TDF, 2003
The prediction model of shear strength of conventional concrete beams given in the Eurocode 2 part 1, 1991 [10] was used as the main framework in developing this prediction model [11]. Eurocode 2 only considers the pre-peak behavior of conventional concrete in tension, whereas the effect of steel fibers on the post-peak behavior of fiber-reinforced concrete is considered in this model. This leads to the consideration of the tensile stress-strain behavior of fiber-reinforced concrete in this model. The ultimate shear resistance of a section is estimated as the algebraic sum of contributions of concrete (), stirrups and/or inclined bars, and steel fibers (). Fiber contribution is estimated according to the following equation:
where is a factor that accounts for the flanges contribution in T-shaped sections and recommended to be taken as 1.0 for other shapes. Flange contribution is typically neglected in most shear strength prediction models for simplicity and due to the fact that diagonal tension failure starts at the web of flanged sections. is calculated as follows:
where is the flanges width [mm]; is the minimum cross-section web width [mm] over [mm]; is the effective depth of the section [mm]; is the flanges height [mm]; is a factor to account for the size of the section taken as 1 + ≤ 2; is the design value of increase in shear capacity due to steel fibers taken as () [MPa]; is the residual flexural tensile strength of the prism corresponding to the crack mouth opening displacement (CMOD) of 3.5 mm [MPa]. Residual flexural tensile strengths () are estimated by a three-point bending test on a 150 × 150 × 550 mm notched prism. The stress versus strain behavior is obtained from the load-deflection or load-CMOD relation of the prism. The load-CMOD curve is defined using four points ( = 1 through 4) that corresponds to the CMOD of 0.5, 1.5, 2.5, and 3.5 mm, respectively. is calculated as follows:
where is the measured load at (CMODi) [N]; is the prism span [mm]; is the prism width [mm]; is the depth between the notch tip to the extreme compression fibers of the prism cross-section [mm].
The concrete contribution is calculated according to Equation (5).
where is the ratio of longitudinal reinforcement (recommended not to be taken greater than 2%); is the area of tension reinforcement extending at least ( + anchorage length) beyond the considered section [mm2]; is the cylinder characteristic compressive strength [MPa]; is the factor to account for the level of axial loading or prestressing in the beam [MPa]; is the axial force in the section due to loading or prestressing (positive for compression) [N]; is the area of the beam cross-section [mm2].
2.1.2. Fib Model Code, 2010
This prediction model is developed for steel fiber-reinforced conventional concrete and is not validated yet for UHPC. The approach bears some similarities to the RILEM TC 162-TDF, 2003 [5] prediction model with the exception of having the steel fibers contribution coupled with the concrete contribution in one term ( as follows:
where terms such as , , , , and are defined similar to RILEM TC 162-TDF, 2003 [5]; is a partial safety factor for concrete with no fibers (recommended to be taken as 1.5); is the characteristic value of ultimate residual tensile strength calculated as follows:
Similar to the RILEM TC 162-TDF, 2003 [5] model, and are the residual flexural tensile strengths corresponding to CMOD of 0.5 mm and 3.5 mm, respectively [MPa]; is the characteristic residual tensile strength (post-cracking strength at serviceability crack opening) [MPa]; is the maximum crack opening that is acceptable in structural design (recommended to be taken as 1.5 mm); is determined according to the rigid-plastic model Equation (9), or the linear model based on Equations (10) and (11); is the characteristic tensile strength of concrete containing no fibers [MPa] and can be determined as follows:
where is the cylinder characteristic compressive strength [MPa]. The residual flexural tensile strengths are determined experimentally according to the EN 14,651 [12], where a three-point bending test is performed on a 150 × 150 × 550 mm notched prism.
2.1.3. French Standard, NF P 18-710, 2016
Based on the AFGC, 2013 [13], this model was developed and calibrated for UHPC. The basis of this model is similar to the AASHTO LRFD [14] simplified version of the Modified Compression Field Theory (MCFT) procedure, where the shear strength of a beam consists of a concrete contribution term (), and a shear reinforcement contribution term (). Then, the tensile strength of UHPC is represented by the addition of a fiber contribution term () [15]. The concrete contribution is calculated according to Equations (13) and (14) for prestressed and non-prestressed beam sections, respectively.
The terms , , , and are defined similarly to the terms in the previous models; The partial safety factors and are recommended to be taken as 1.5 after being multiplied; is a factor for UHPC in tension recommended to be taken as 1.3, and is a factor to account for the uncertainty in extrapolating the model developed for high performance concrete to UHPC; () is the lever arm of the internal moment in the cross-section (typically taken as 90% of the section depth). A larger number of test data is required to lower the safety factors used in the calculation of concrete contribution. The contribution term of fibers is calculated by quantifying the post-crack residual tensile strength resisting the main crack across the angle across as shown in Figure 1 [16].
Figure 1.
Tensile stresses carried by steel fibers in a beam cross-section according to the Modified Compression Field Theory [16].
Fiber contribution term is calculated as follows:
where is the area where the fibers are effective () [mm2]; is the residual tensile strength of the fiber-reinforced member [MPa]; is the angle between the principal compression stress and beam axis in degrees, and is recommended not to be taken less than 30 degrees; is estimated as the area under the stress-crack width curve of a 3-point bending test; is a reduction factor to account for the difference between fibers orientation of the prism and that of the structure; the factor is recommended to be taken between 1.0 to 1.4; is the maximum crack width reached at the ultimate bending moment, or the admissible crack width (recommended as 0.3 mm). The dimensions of the flexure test prism depend on the length of fibers (lf). For (lf ≤ 15 mm), 70 × 70 × 280 mm prisms are recommended, and for (15 mm < lf ≤ 20 mm), 100 × 100 × 380 mm prisms are recommended to be used. The depth of the notch is equal to 10% of the prism height to allow for an efficient localization of the crack, and to minimize the risk of cracking outside the notch location. The distance between the two bearing points must be three times the depth of the prism. The residual tensile strength can be also calculated from direct tension tests on un-notched prisms.
2.1.4. PCI-UHPC Structures Design Guide, 2021
The Precast/Prestressed Concrete Institute (PCI) recently published Phase II report for the implementation of using UHPC in precast bridges and buildings. The report provides guidelines for the design of UHPC members, as well as acceptance criteria for PCI-UHPC material mechanical properties and production. The model presented in the report is based on the MCFT and A AASHTO LRFD [14]. The ultimate shear load carrying capacity () is taken as the sum of the contributions of UHPC tensile strength (), shear reinforcement (), and the component of prestressing force resisting vertical shear (). is calculated according to the following equation:
where is the residual tensile strength of UHPC and recommended to be taken as 5.2 MPa for UHPC meeting minimum PCI-UHPC tensile properties requirements; this value was calculated based on the minimum required peak flexural strength according to ASTM C1609 [17] of 13.8 MPa multiplied by a 0.375 conversion factor according to [18,19]. Other parameters are similar to what was described in the previous models. The crack angle is estimated according to the following equations:
where is the strain at the level of tension reinforcement and calculated as follows for positive values of :
where and are the applied factored moment and vertical shear at the critical section under consideration; is the effective axial prestressing force acting on the section; and are the moduli of elasticity of reinforcing and prestressing steel, respectively; and are the area of reinforcing and prestressing steel, respectively. For negative values of the equation becomes as follows:
where is the UHPC modulus of elasticity, and is the area of UHPC on the flexural tension side of the member measured from the mid-height of the section. The upper and lower bounds of are selected to provide an angle between 27.6 and 50.0 degrees. It should be noted that this model is based on the load and resistance factor design which utilizes a strength reduction factor and a load magnification factor. Strength reduction factors were not considered when the shear strength was predicted using the model in that paper. Furthermore, the model assumes proper reinforcement is provided and developed in the flexural tension side of the critical section to achieve the full diagonal tension strength.
2.1.5. Draft of AASHTO Guide Specification for Structural Design with UHPC, 2021
A draft guide specification for the design of concrete elements fabricated with UHPC is currently being considered by the AASHTO CBS T-10 committee to be included in the next revision of the AASHTO LRFD [14]. The document was developed by the Federal Highway Administration (FHWA) Turner-Fairbank Highway Research Center. Similar to the French standard [7] and AASHTO LRFD [14], the model is based on the MCFT with the analysis of the principal strains at critical sections. The nominal shear resistance of a member () is taken as the sum of the contributions of UHPC tensile strength (), shear reinforcement (), and component of prestressing force resisting vertical shear (). is calculated according to the following equation:
where is a reduction factor to account for the variability of tensile stresses carried by UHPC (recommended not to exceed 0.85), is the localization tensile strength of UHPC estimated by means of direct tension testing on 50 × 50 mm2 prisms, and other parameters are similar to what was described before. The crack angle in this model is limited to a range from 25 to 45 degrees, and is estimated according to the following equations:
where is the localization strain obtained by the direct tension testing when the tensile stresses carried by the UHPC prism start to decrease consistently, and recommended to be taken between 0.004 to 0.010 [20,21,22]; is longitudinal strain at the level of reinforcement calculated as follows:
where is the absolute value of the factored moment at the design section, not to be taken as less than ; is the factored axial force at the design section, taken as positive if tension and negative if compression; is the factored shear force at the design section; and are the area of prestressing steel and non-prestressed steel, respectively, in the flexural tension side of the member; is the parameter taken as modulus of elasticity of prestressing steel multiplied by the locked-in difference in strain between the prestressing steel and surrounding UHPC and could be taken as 70% of the ultimate tensile strength of the strands for appropriate levels of prestressing; is the area of UHPC in the flexural tension side of the member; and are the moduli of elasticity of non-prestressed and prestressing steel respectively; is the transverse reinforcement ratio calculated as the area of transverse reinforcement divided by bar spacing and web width; is the stress in transverse reinforcement; is the diagonal compressive strain in the section; and is the vertical strain in transverse reinforcement at the design section. Similar to the PCI-UHPC model, this model is based on the load and resistance factor design and the model also assumes proper reinforcement is provided and developed in the flexural tension side of the critical section.
2.2. Shear Experiments
Table A1 and Table A2 present a summary of the shear experiments conducted on prestressed and non-prestressed UHPC beams, respectively. All test data were conducted on beams without transverse reinforcement. Figure 2 shows a schematic of the cross-sections of the prestressed beams, whereas Figure 3 shows that of non-prestressed beams. This data was collected from 16 research programs conducted on UHPC beams reinforced longitudinally with mild reinforcement (yield strength ranging from 400 to 600 MPa or prestressing strands (tensile strength ranging from 1700 to 1860 MPa). All UHPC mixes in these experiments had straight fibers that have a tensile strength ranging from 1800 to 2600 MPa, except for Voo et al., 2006 [23] who used a mix of straight- and end-hooked fibers in some tests.


Figure 2.
Girder cross-sections of the shear test data of prestressed beams (units in millimeter). (a) Hegger et al., 2004 [24]. (b) Voo et al., 2006 [23]. (c) Graybeal, 2006 [27]. (d) Hegger and Bertram, 2008 [25]. (e) Graybeal, 2009 [28]. (f) Wipf et al., 2009 [29]. (g) Voo et al., 2010 [30]. (h) Crane, 2010 [15]. (i) Tadros et al., 2021 [8]. (j) Tadros et al., 2021 [8].
Figure 3.
Girder cross-sections of the shear test data of non-prestressed beams (units in millimeter). (a) Baby et al., 2010 [31,32]. (b) Fehling et al., 2012 [33]. (c) Lim et al., 2016 [26]. (d) Pourbaba et al., 2018 [34,35]. (e) Pansuk et al., 2017 [36]. (f) Meszoly et al., 2018 [37]. (g) Ridha et al., 2018 [38].
Hegger et al., 2004 [24], performed one test on an I-shaped beam to investigate the bond anchorage behavior and shear strength of the section. Some slippage occurred at the bottom strands and the utilization of the prestressing force was nearly 80% at failure. Voo et al., 2006 [23] conducted seven tests where the combined fiber volume fraction was 2.5% for all beams except SB4 which had 1.25%. The used fibers were a combination of straight- (type I) and end-hooked (type II) types. Specimens SB1, SB2, and SB3 only contained type I fibers, whereas specimens SB4, SB5, and SB7 contained 1.25%, 1%, 0.62% type II fibers, respectively, and specimen SB6 contained only type II fibers. Hegger and Bertram, 2008 [25], conducted shear tests on prestressed I-shaped beams to estimate the bond anchorage of strands and the shear capacity of the section with and without openings in the web. Five beams without web openings were only considered in this study.
Crane, 2010 [15], conducted six tests on bulb-tee girders having a depth of 835 mm, and a 200 mm cast in place of a high-performance concrete deck having a compressive strength of 84 MPa was placed on the beams. Because of the significant differences in concrete properties between the deck and UHPC girder, the effective shear depth was based only on the girder and not the composite section. Lim et al., 2016 [26], conducted shear tests on rectangular beams and the primary test variable was the shear reinforcement ratio. Only one specimen (out of four) that did not contain any shear reinforcement and failed in diagonal tension was included in this study.
All the specimens had a shear span to depth ratio of at least 2.3 and experienced a diagonal tension failure. Diagonal tension failure in UHPC beams typically starts with several narrow and closely spaced cracks parallel to the failure crack angle. One of these cracks starts to grow wider and longer with the increase of load until failure [27]. The unreported crack angles () were reasonably estimated based on failure photos, whereas post-cracking residual tensile strengths () were reasonably estimated based on flexural or direct tension test results.
3. Results
This section presents the parametric study done on the shear experiments discussed earlier. Then comparison against prediction models is presented for the five models.
3.1. Shear Strength Parameters
Test data listed in Table A1 were used to evaluate the effect of key parameters, such as compressive strength, fiber content, tensile strength, and level of prestressing, on the shear strength of prestressed UHPC beams. Figure 4a–d plots , , , and , respectively, versus measured shear strength. These plots indicate there is no strong correlation between any of these parameters and the shear strength of prestressed UHPC beams. Correlation coefficients were calculated using the Pearson correlation test and were found to be 0.05, 0.36, 0.44, and 0.33 for , , , and , respectively. These coefficients indicate that there is only a moderate correlation between and the shear strength, which is in agreement with the prediction models presented earlier in Section 2. In addition, to test for the statistical significance of these key parameters on the shear strength of prestressed beams, a multiple regression analysis was performed for shear strength as the dependent variable and , , , and as the independent variables using 5% significance level. Only , and were found to have significant effects as their p-values were 0.019, and 0.001, respectively, whereas and had p-values of 0.43, and 0.69, respectively, which indicate that their effects are statistically insignificant.

Figure 4.
Effect of key parameters on shear strength of prestressed UHPC beams. (a) effect of the square root of UHPC compressive strength (). (b) effect of fiber volume fraction ( ). (c) effect of UHPC post-cracking tensile strength ( ). (d) effect of level of prestressing ( ).
In order to have a more homogenous group of test data, specimens with a fiber volume fraction less than 2% ( < 2.0%) were omitted since the commonly used in UHPC mixtures is at least 2% [39]. In addition, the Hegger et al., 2004, specimen was omitted as the prestressing force was not fully utilized due to strand slippage [24]. The remaining specimens yielded a strong correlation between level of prestressing ( and the shear strength (Vu/bwd) as shown in Figure 5. Multiple regression analysis was done on that group and resulted in and being statistically significant as their p-values were 1 × 10⁻⁷, and 6 × 10⁻⁵, respectively, whereas and had p-values of 0.96, and 0.86, respectively. The resulting relation between the shear strength and was very weak which is in agreement with the Pearson correlation test results of the multiple regression analysis. The standard error of the model containing all data points was 3.56, whereas the standard error value for the ( > 2.0%) group was 2.90. This indicates that the ( > 2.0%) regression model provides higher accuracy than model containing all data points.
Figure 5.
Effect of the level of prestressing () on the shear strength for prestressed beam with ≥ 2.0%.
Test data listed in Table A2 were used to evaluate the effect of key parameters, such as compressive strength, fiber content, tensile strength, and reinforcement ratio, on the shear strength of non-prestressed UHPC beams. Figure 6a–d plots , , , and , respectively, versus measured shear strength. These plots indicate no strong correlation between any of these parameters and the shear strength of non-prestressed UHPC beams. Correlation coefficients were calculated using the Pearson correlation test and were found to be 0.49, −0.05, 0.60, and 0.43 for , , , and , respectively. These coefficients indicate that there is only a moderate correlation between and the shear strength, which is in agreement with the prediction models presented earlier in Section 2. In addition, to test for the statistical significance of these key parameters on the shear strength of non-prestressed beams, a multiple regression analysis was performed for shear strength as the dependent variable and , , , and as the independent variables using 5% significance level. Only was found to have a significant effect, where the p-value was 0.024, whereas , , and had p-values of 0.22, 0.92, and 0.90, which indicate that their effects are statistically insignificant.

Figure 6.
Effect of key parameters on shear strength of non-prestressed UHPC beams. (a) effect of the square root of UHPC compressive strength (). (b) effect of fiber volume fraction ( ). (c) effect of UHPC post-cracking tensile strength ( ). (d) effect of longitudinal reinforcement ratio ().
In order to have a more homogenous group of test data, specimens with a fiber volume fraction of less than 2% ( < 2.0%) were omitted since the commonly used in UHPC mixtures is at least 2% [39]. The remaining specimens yielded a strong correlation between reinforcement ration () and the shear strength as shown in Figure 7. Multiple regression analysis was done on that group and resulted in being statistically significant as the p-value was 0.024, whereas , , and had p-values of 0.82, 0.89, and 0.49, respectively, which is in agreement with the Pearson correlation test results. The standard error of the model containing all data points was 6.27, whereas the standard error value for the ( > 2.0%) group was 2.80. This indicates that the ( > 2.0%) regression model provides higher accuracy than models containing all data points.
Figure 7.
Effect of the longitudinal reinforcement ratio () on the shear strength of non−prestressed UHPC beams with ≥ 2.0%.
3.2. Comparison to Model Predictions
Prediction models were evaluated by comparing measured versus predicted shear strength for the test data presented earlier. Safety factors were set to 1.0 when calculating the predicted shear strength of UHPC beams. Crack angles that were not reported for some tests were assumed based on shear failure photos. The tensile strength that was not reported for some tests was assumed based on direct tension or flexural test results. A conversion factor was used to convert the tensile strength obtained from flexure testing to that obtained from the direct tension test. This conversion factor was found to be 0.377 based on the average of the German guidelines for UHPC [18] and the Swiss standard [19]. The conversion factor is multiplied by the post-cracking flexural tensile strength to get the axial tensile strength and is based on having the neutral axis located at a distance of about 82% of the prism height from the extreme tension surface. Table 1 presents three-point bending tests conducted in the literature to quantify the residual tensile strength of UHPC. It shows that the size of the prism has a significant effect on the measured tensile strength. Average values from this table were used to estimate the residual tensile strength of UHPC in the terms , , , , or in the five considered prediction models, respectively. For example, for a fiber volume fraction of 2%, would be 29.6 MPa, whereas for mixes with 2.5% and 1% fiber volume fractions, would be to use the 40.0 and 2.8 MPa, respectively. For mixes with different fiber volume fractions, values are estimated by interpolation. A prediction example of Tadros et al., 2021 [8], IA1 data point is presented in the Appendix A section to show how the calculation procedure is performed for the five models.
Table 1.
UHPC residual tensile strength reported in the literature.
3.2.1. RILEM TC 162-TDF, 2003
Reasonable assumptions for unreported values of were made according to Table 1. For example, was assumed as 29.6 MPa for test data having = 2.0%. Figure 8 plots the measured versus predicted shear strength using RILEM TC 162-TDF model. The average was 2.7, with a standard deviation of 0.88. It can be noticed that the underestimation increases with the increase of the measured shear strength.
Figure 8.
Measured versus predicted shear strength according to RILEM TC 162-TDF, 2003 (Equations (1) and (5)).
3.2.2. Fib Model Code, 2010
Reasonable assumptions for unreported values of were made according to Table 1. For example, was assumed as 11.0 MPa for test data having = 2.0%. This assumption is based on Equations (10) and (11) and having the flexural tensile strengths () according to Table 1. Figure 9 plots the measured versus the predicted shear strength fib Model Code. The average was 2.4, with a standard deviation of 0.74. It can be noticed that the predicted shear strength is close to what the RILEM TC 162-TDF, 2003 5 provides.
Figure 9.
Measured versus predicted shear strength according to the fib Model Code, 2010 (Equation (8)).
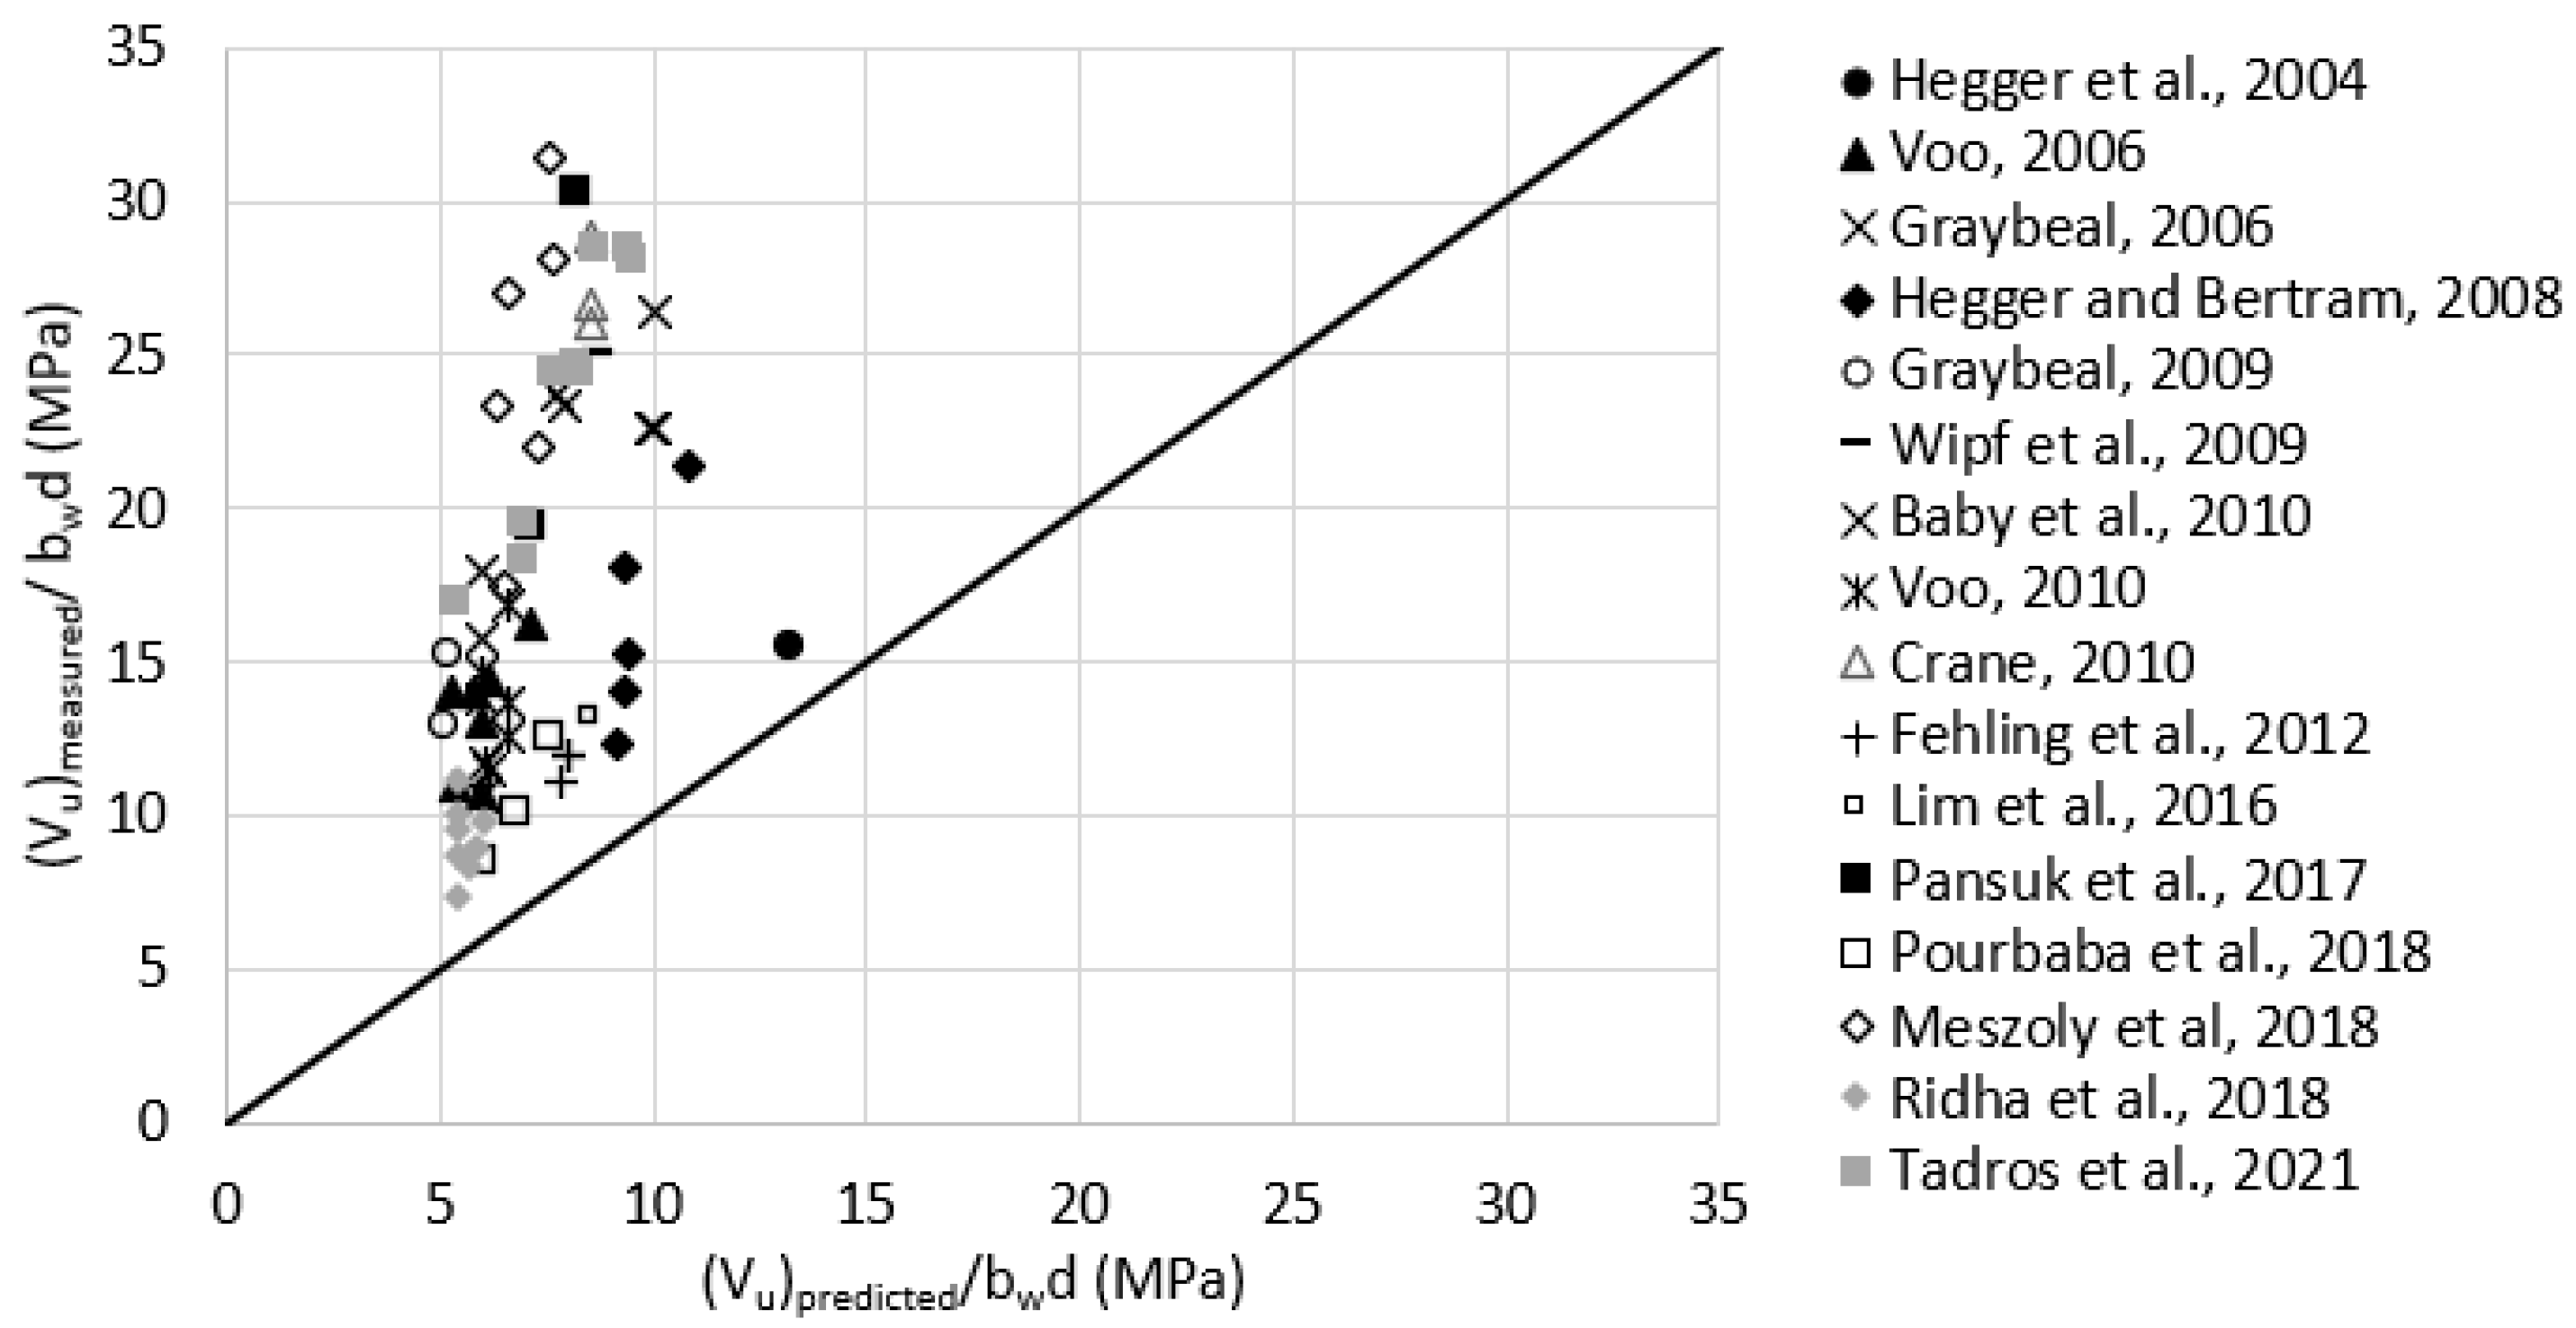
3.2.3. French Standard, NF P 18-710, 2016
Reasonable assumptions for unreported values of were made according to Table 1. For example, was assumed as 11.0 MPa for test data having = 2.0%. Figure 10 plots the measured versus predicted shear strength using the French standard model. The average was 1.1, with a standard deviation of 0.38. It can be noticed that the data are well distributed around the 45-degree angle line indicating a reasonable consistency in the prediction accuracy.
Figure 10.
Measured versus predicted shear strength according to French Standard NF P 18-710, 2016 (Equations (13) or (14), and (16)).
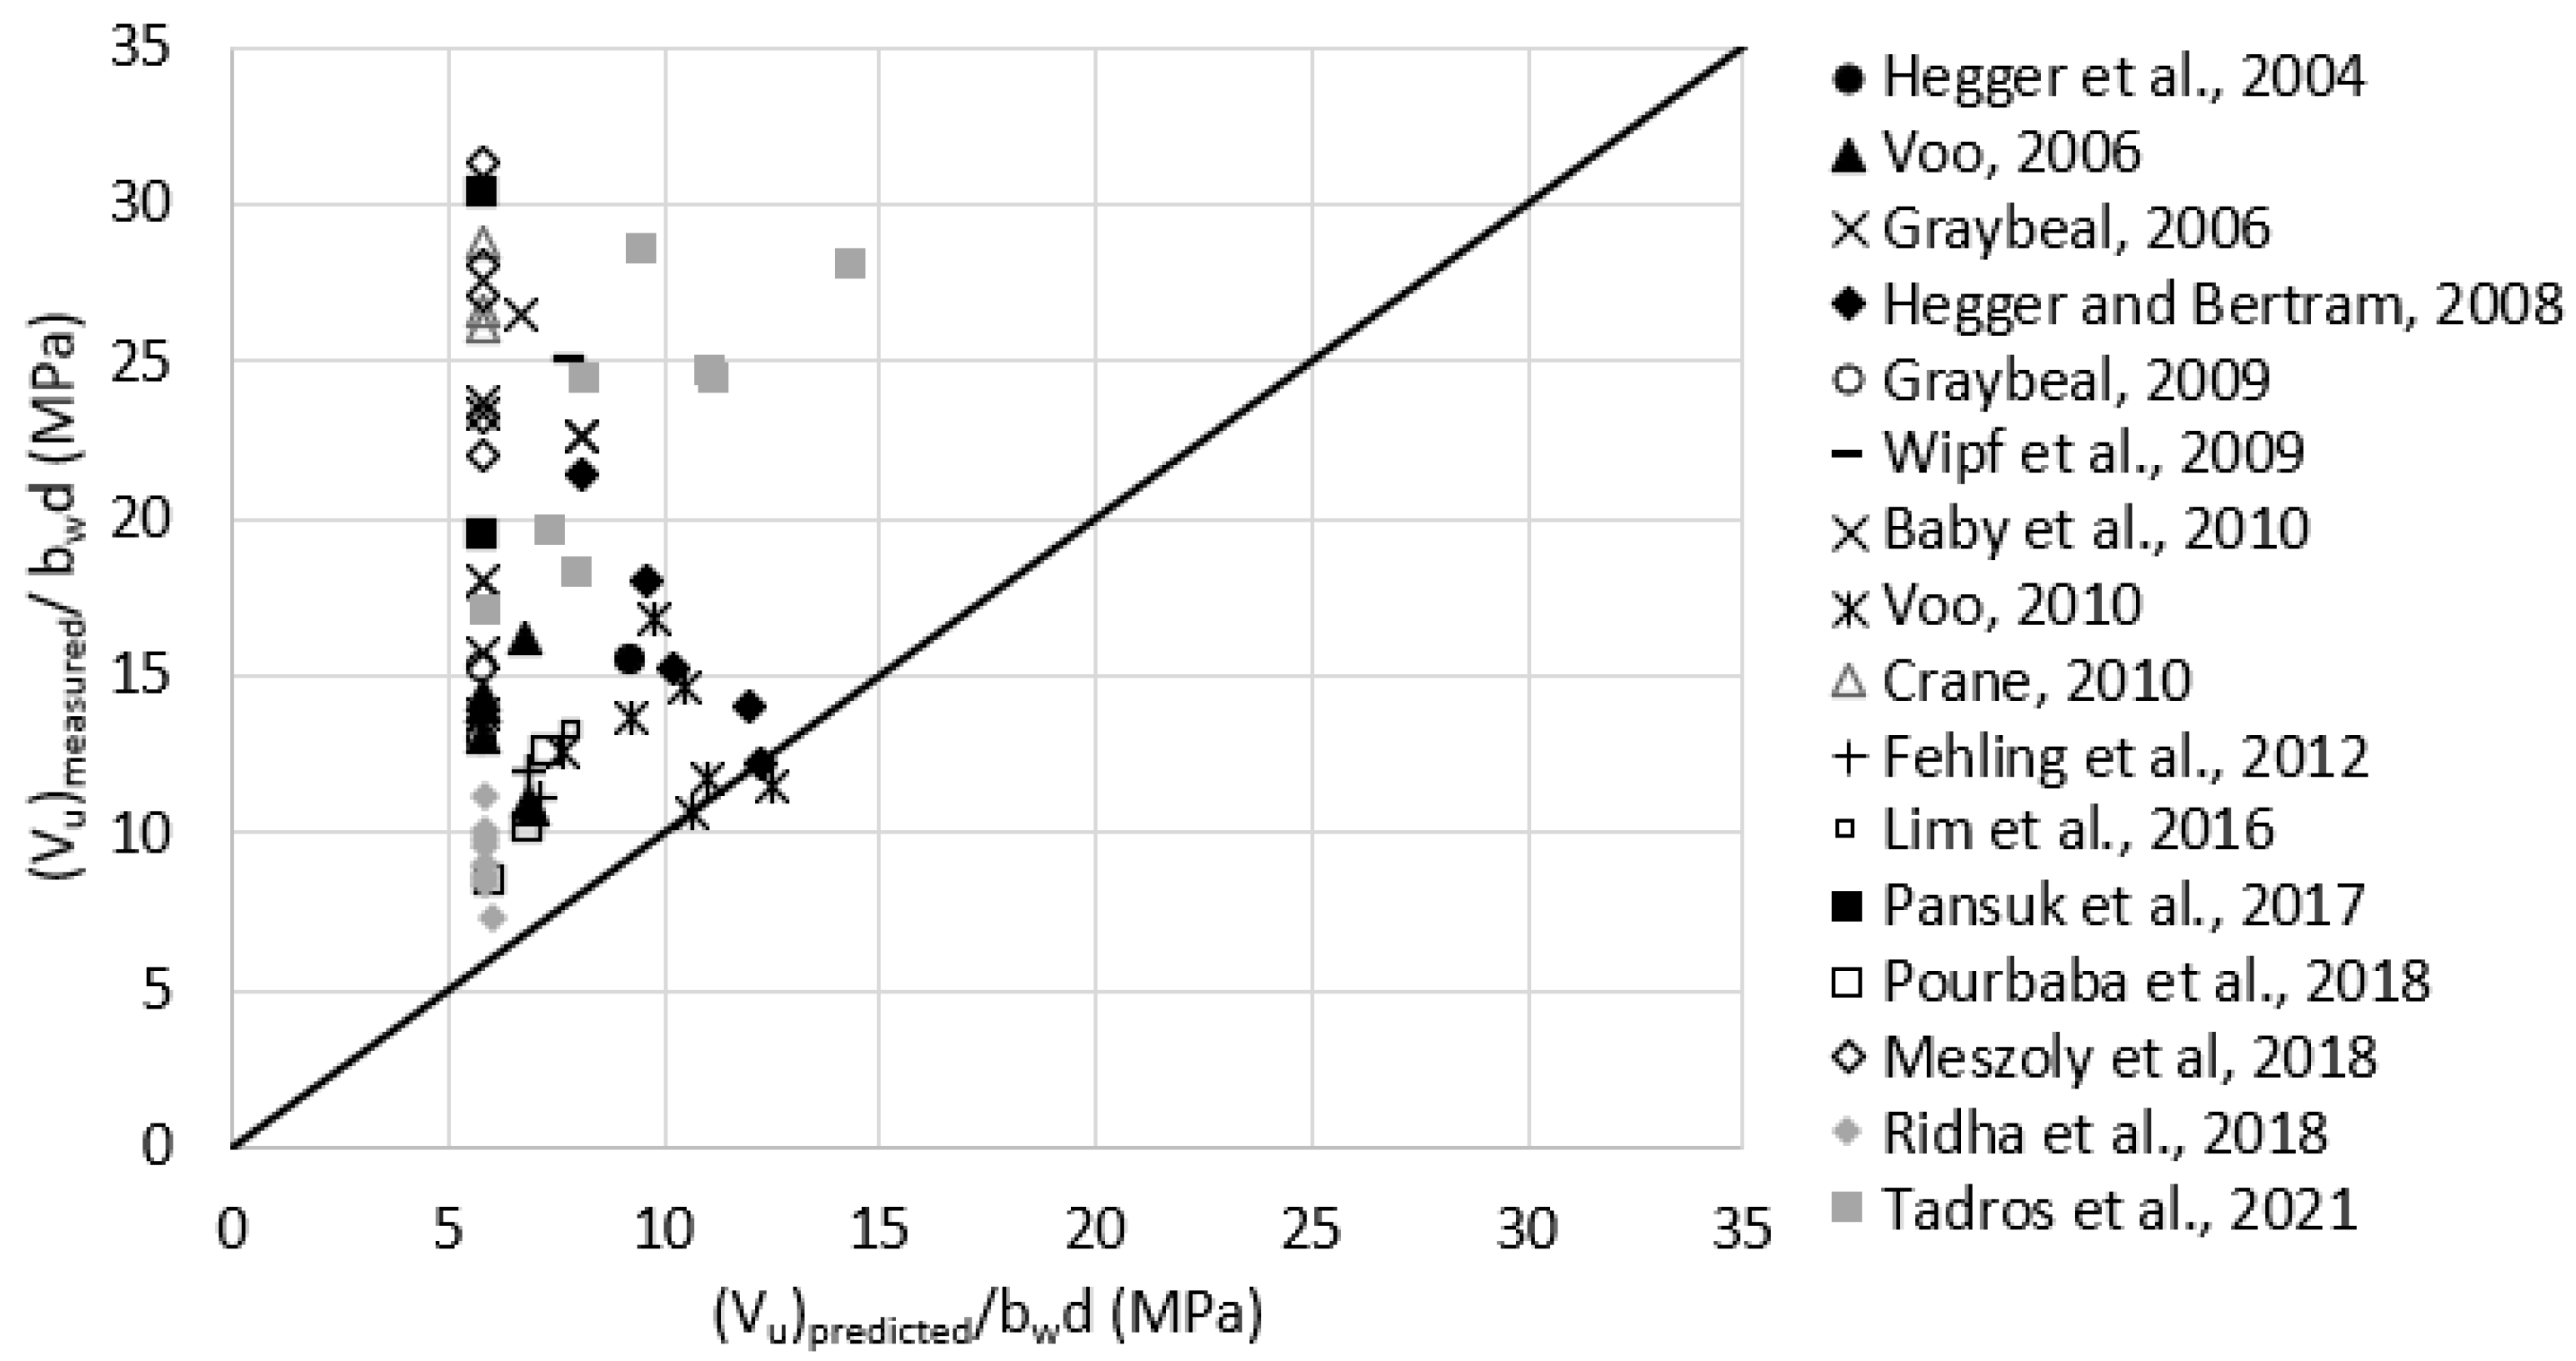
3.2.4. PCI-UHPC Structures Design Guide, 2021
The assumed value of was limited to 5.2 MPa as recommended by the model. This value is significantly lower than what is typically achieved by commonly used UHPC mixes, which caused the predicted shear strengths to be significantly underestimated. The crack angle was calculated according to the suggested procedure of the model and was limited to range between 27.6 and 50.0 degrees as recommended. Figure 11 plots the measured versus predicted shear strength using the PCI-UHPC Structures Design Guide model. The average was 2.5, with a standard deviation of 1.14. It should be noted that the French Standard takes into account the level of prestressing whereas the PCI-UHPC model does not consider the level of prestressing term for simplicity. The effect of prestressing is only considered in that model when estimating the crack angle.
Figure 11.
Measured versus predicted shear strength according to PCI-UHPC Structures Design Guide, 2021 (Equation (18)).
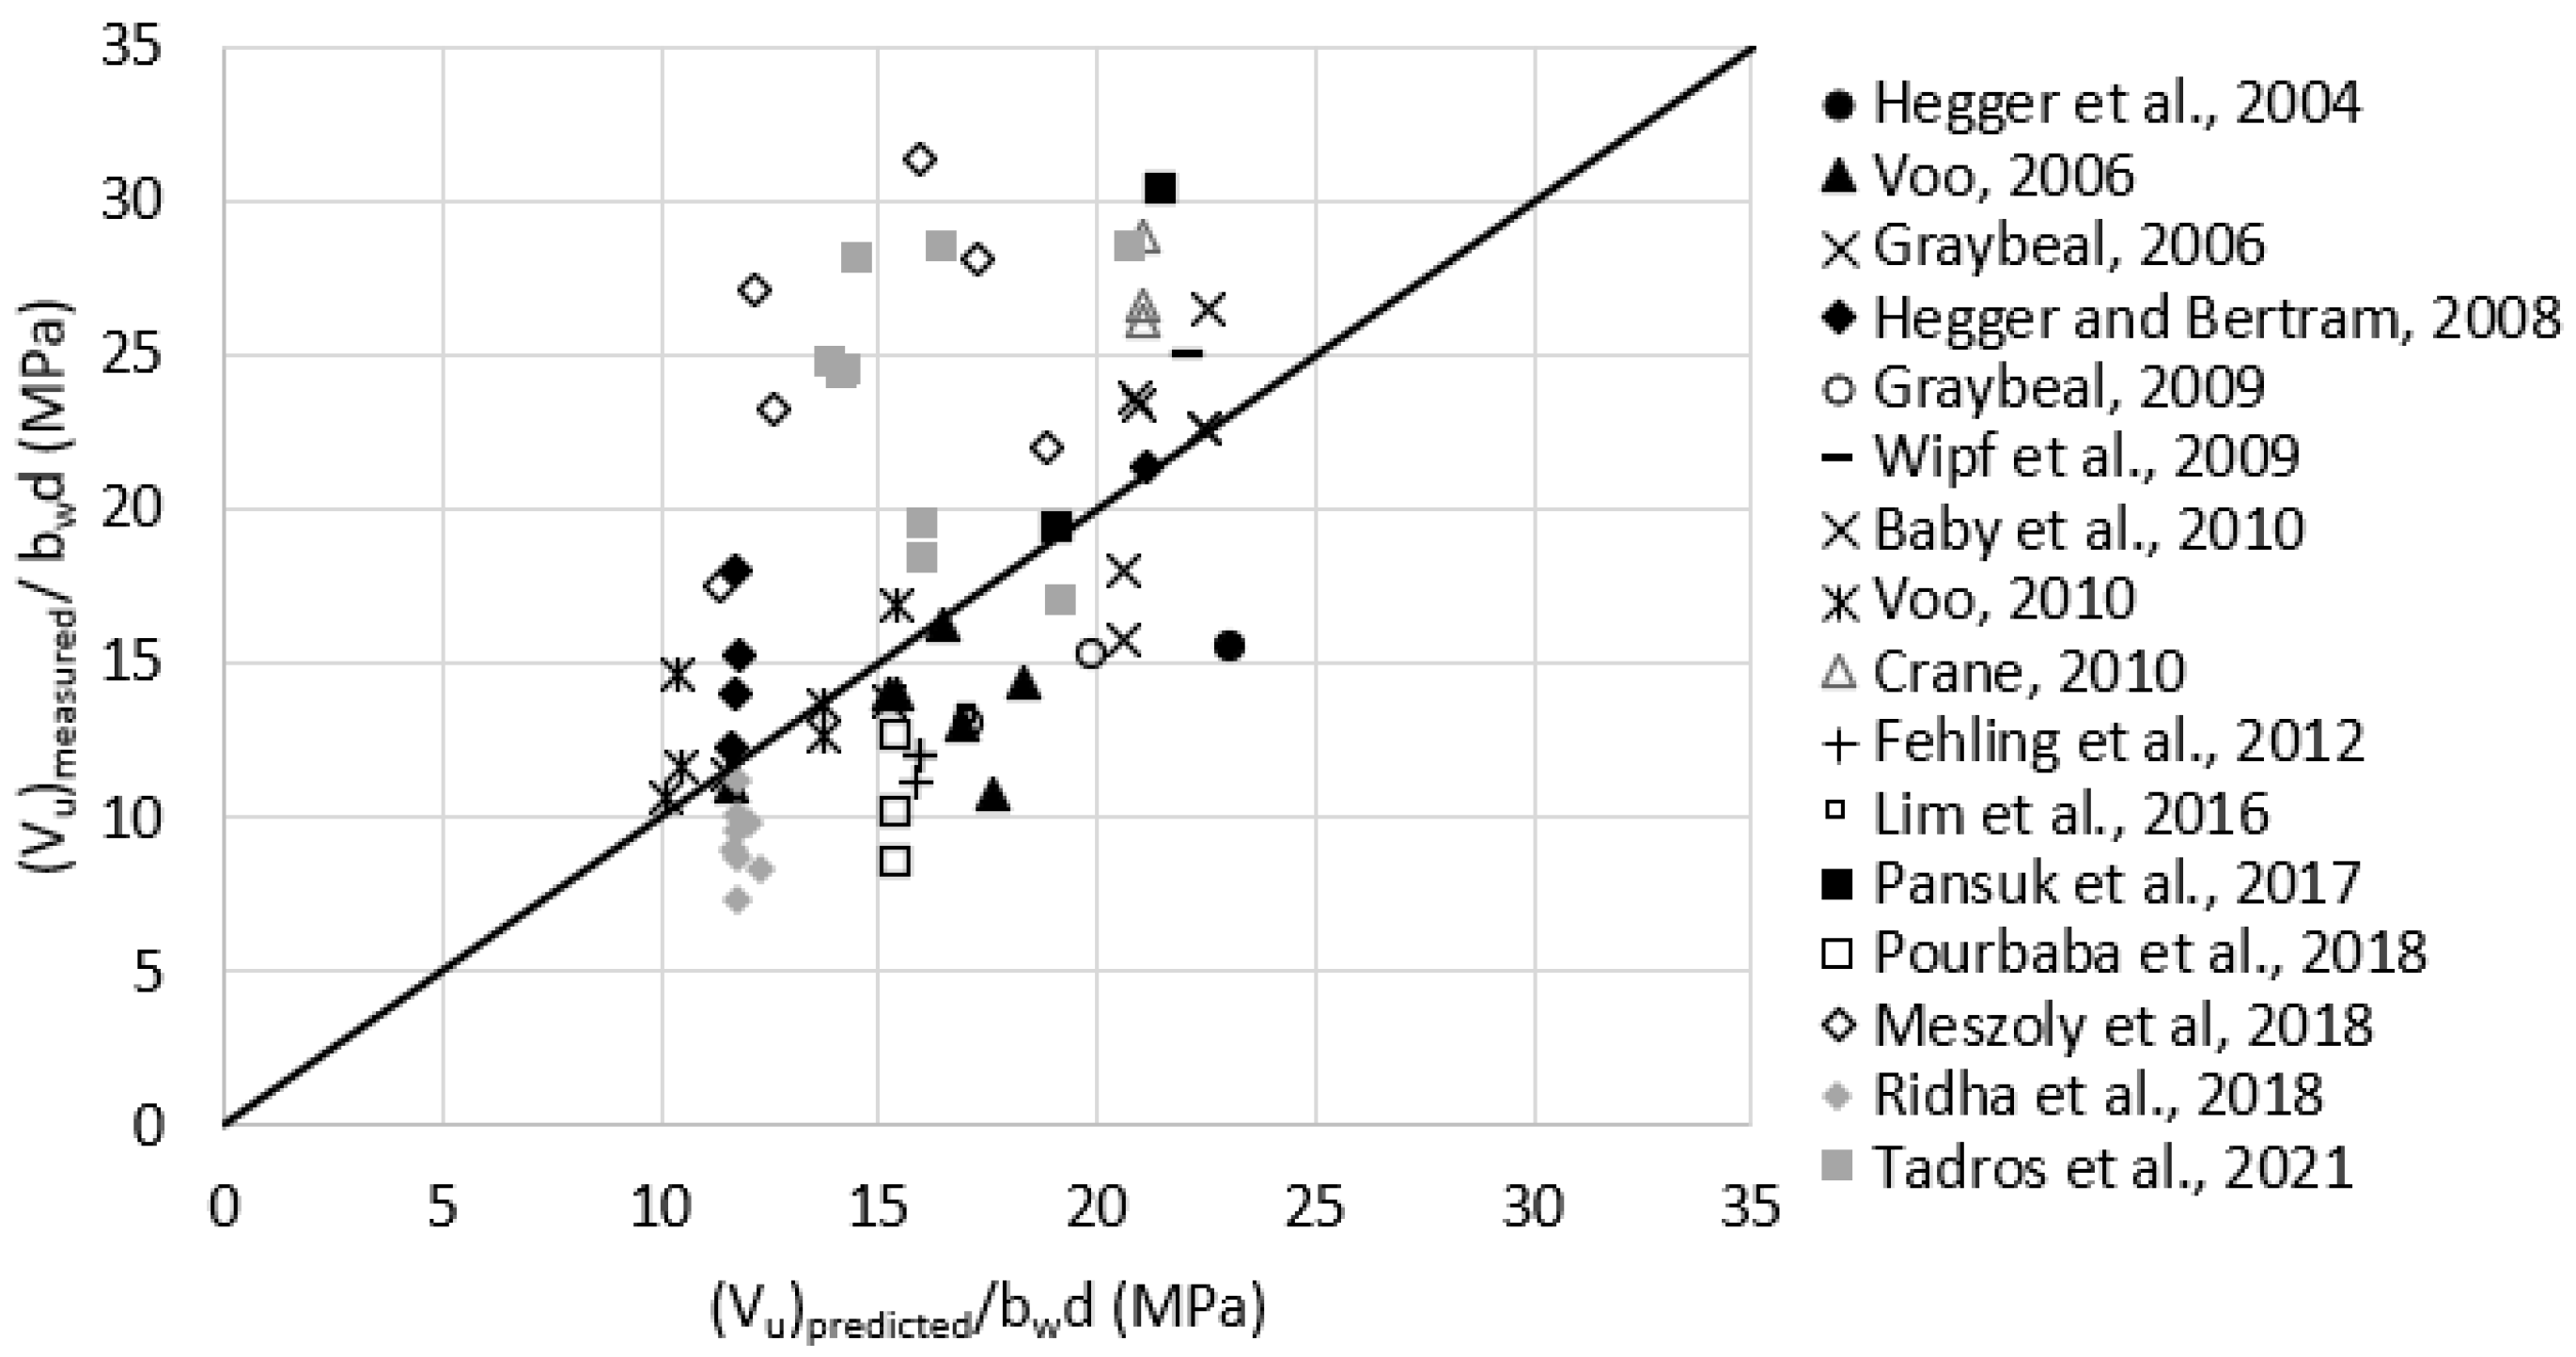
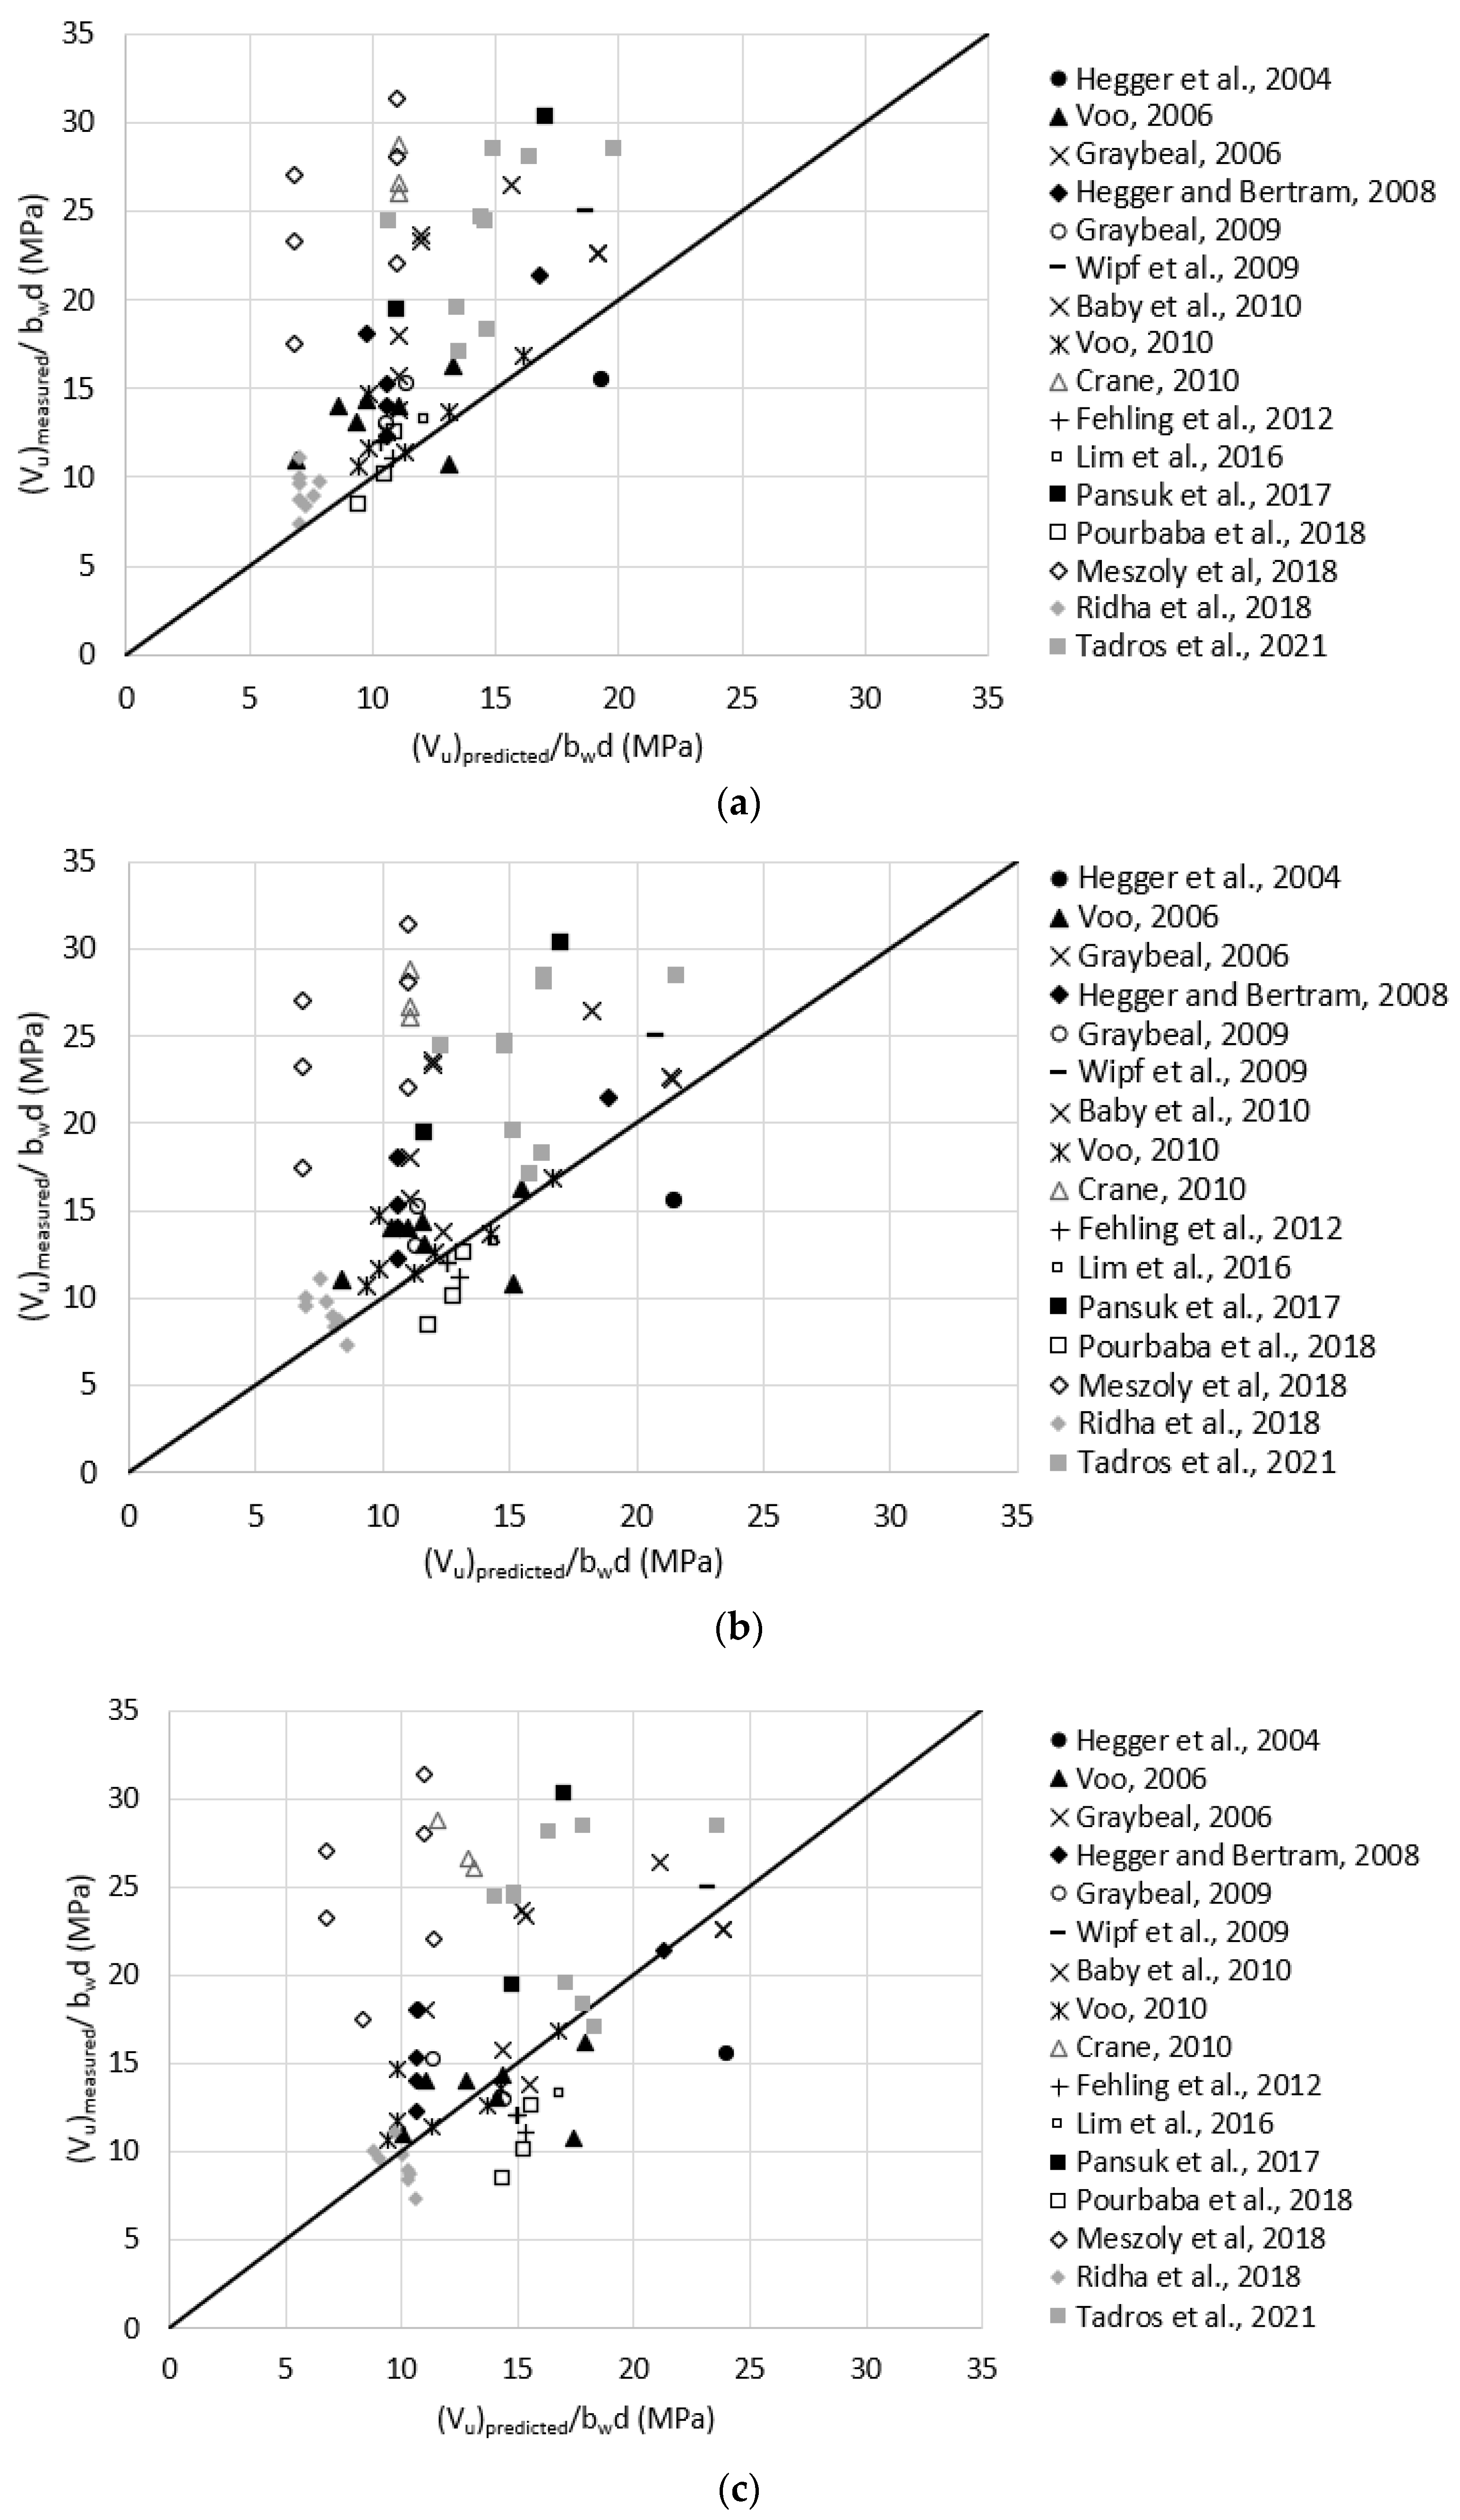
3.2.5. Draft of AASHTO Guide Specification for Structural Design with UHPC, 2021
Reasonable assumptions for unreported values of were made according to Table 1. For example, was assumed as 11.0 MPa for test data having = 2.0%. The comparison to this model prediction was done for three cases (a to c) where the localization strain () was considered as 0.005, 0.007, and 0.010, respectively, for all test data based on the recommended range of 0.004 and 0.010 [20,21]. Figure 12 plots the measured versus predicted shear strength using Draft AASHTO model for the three cases. The average were 1.6, 1.5, and 1.3 with a standard deviation of 0.60, 0.63, and 0.64 for cases a through c, respectively. This indicates that the prediction provided by this model is not very sensitive to , and doubling from 0.005 to 0.010 resulted in an increase of 23% of the average prediction. Additionally, the prediction provided by that model is slightly more conservative than the one provided by the French Standard and is closest to the measured shear strength compared to all other prediction models.
Figure 12.
Measured versus predicted shear strength according to Draft of AASHTO Guide Specification for Structural Design with UHPC, 2021; (a) = 0.005; (b) = 0.007; (c) = 0.010 (Equation (22)).
4. Discussion and Recommendation
Table 2 summarizes the outcomes of model evaluation. The table shows that the French Standard NF P 18-710, 2016 [7] provided the closest estimation of the shear strength followed by the Draft of AASHTO Guide Specification for Structural Design with UHPC, 2021 [9]. The PCI-UHPC Structures Design Guide, 2021 [8], underestimated the predicted shear strength significantly due to assuming a constant conservative value of UHPC tensile strength. The fib Model Code, 2010 [6], and RILEM TC 162-TD, 2013 [5], models provided significantly conservative prediction as they were developed for steel fiber-reinforced concrete. The French Standard NF P 18-710, 2016 [7] also provided the least standard deviation, which indicates the highest consistency in the shear strength prediction. Furthermore, the PCI-UHPC and Draft AASHTO models do not consider explicitly the level of prestressing in the fiber contribution term as the French Standard does. The prestressing effect is only considered in the crack angle estimation equations. This is one of the major factors that causes the French Standard to provide higher consistency in the shear strength prediction.
Table 2.
Summary of evaluation of prediction models.
Based on the findings of this study, it is recommended to use the French Standard prediction model to estimate the shear strength of UHPC beams if the closest prediction is required. The PCI-UHPC and Draft AASHTO models can also be used but the designer should be aware of increased conservatism.
5. Conclusions
The paper presented five prediction models for the shear strength of prestressed and non-prestressed UHPC beams without transverse reinforcement. Available test data in the literature were used to evaluate these models and identify the key parameters that affect the shear strength of UHPC beams. Despite the limited size of published test data, this investigation yielded the following conclusions:
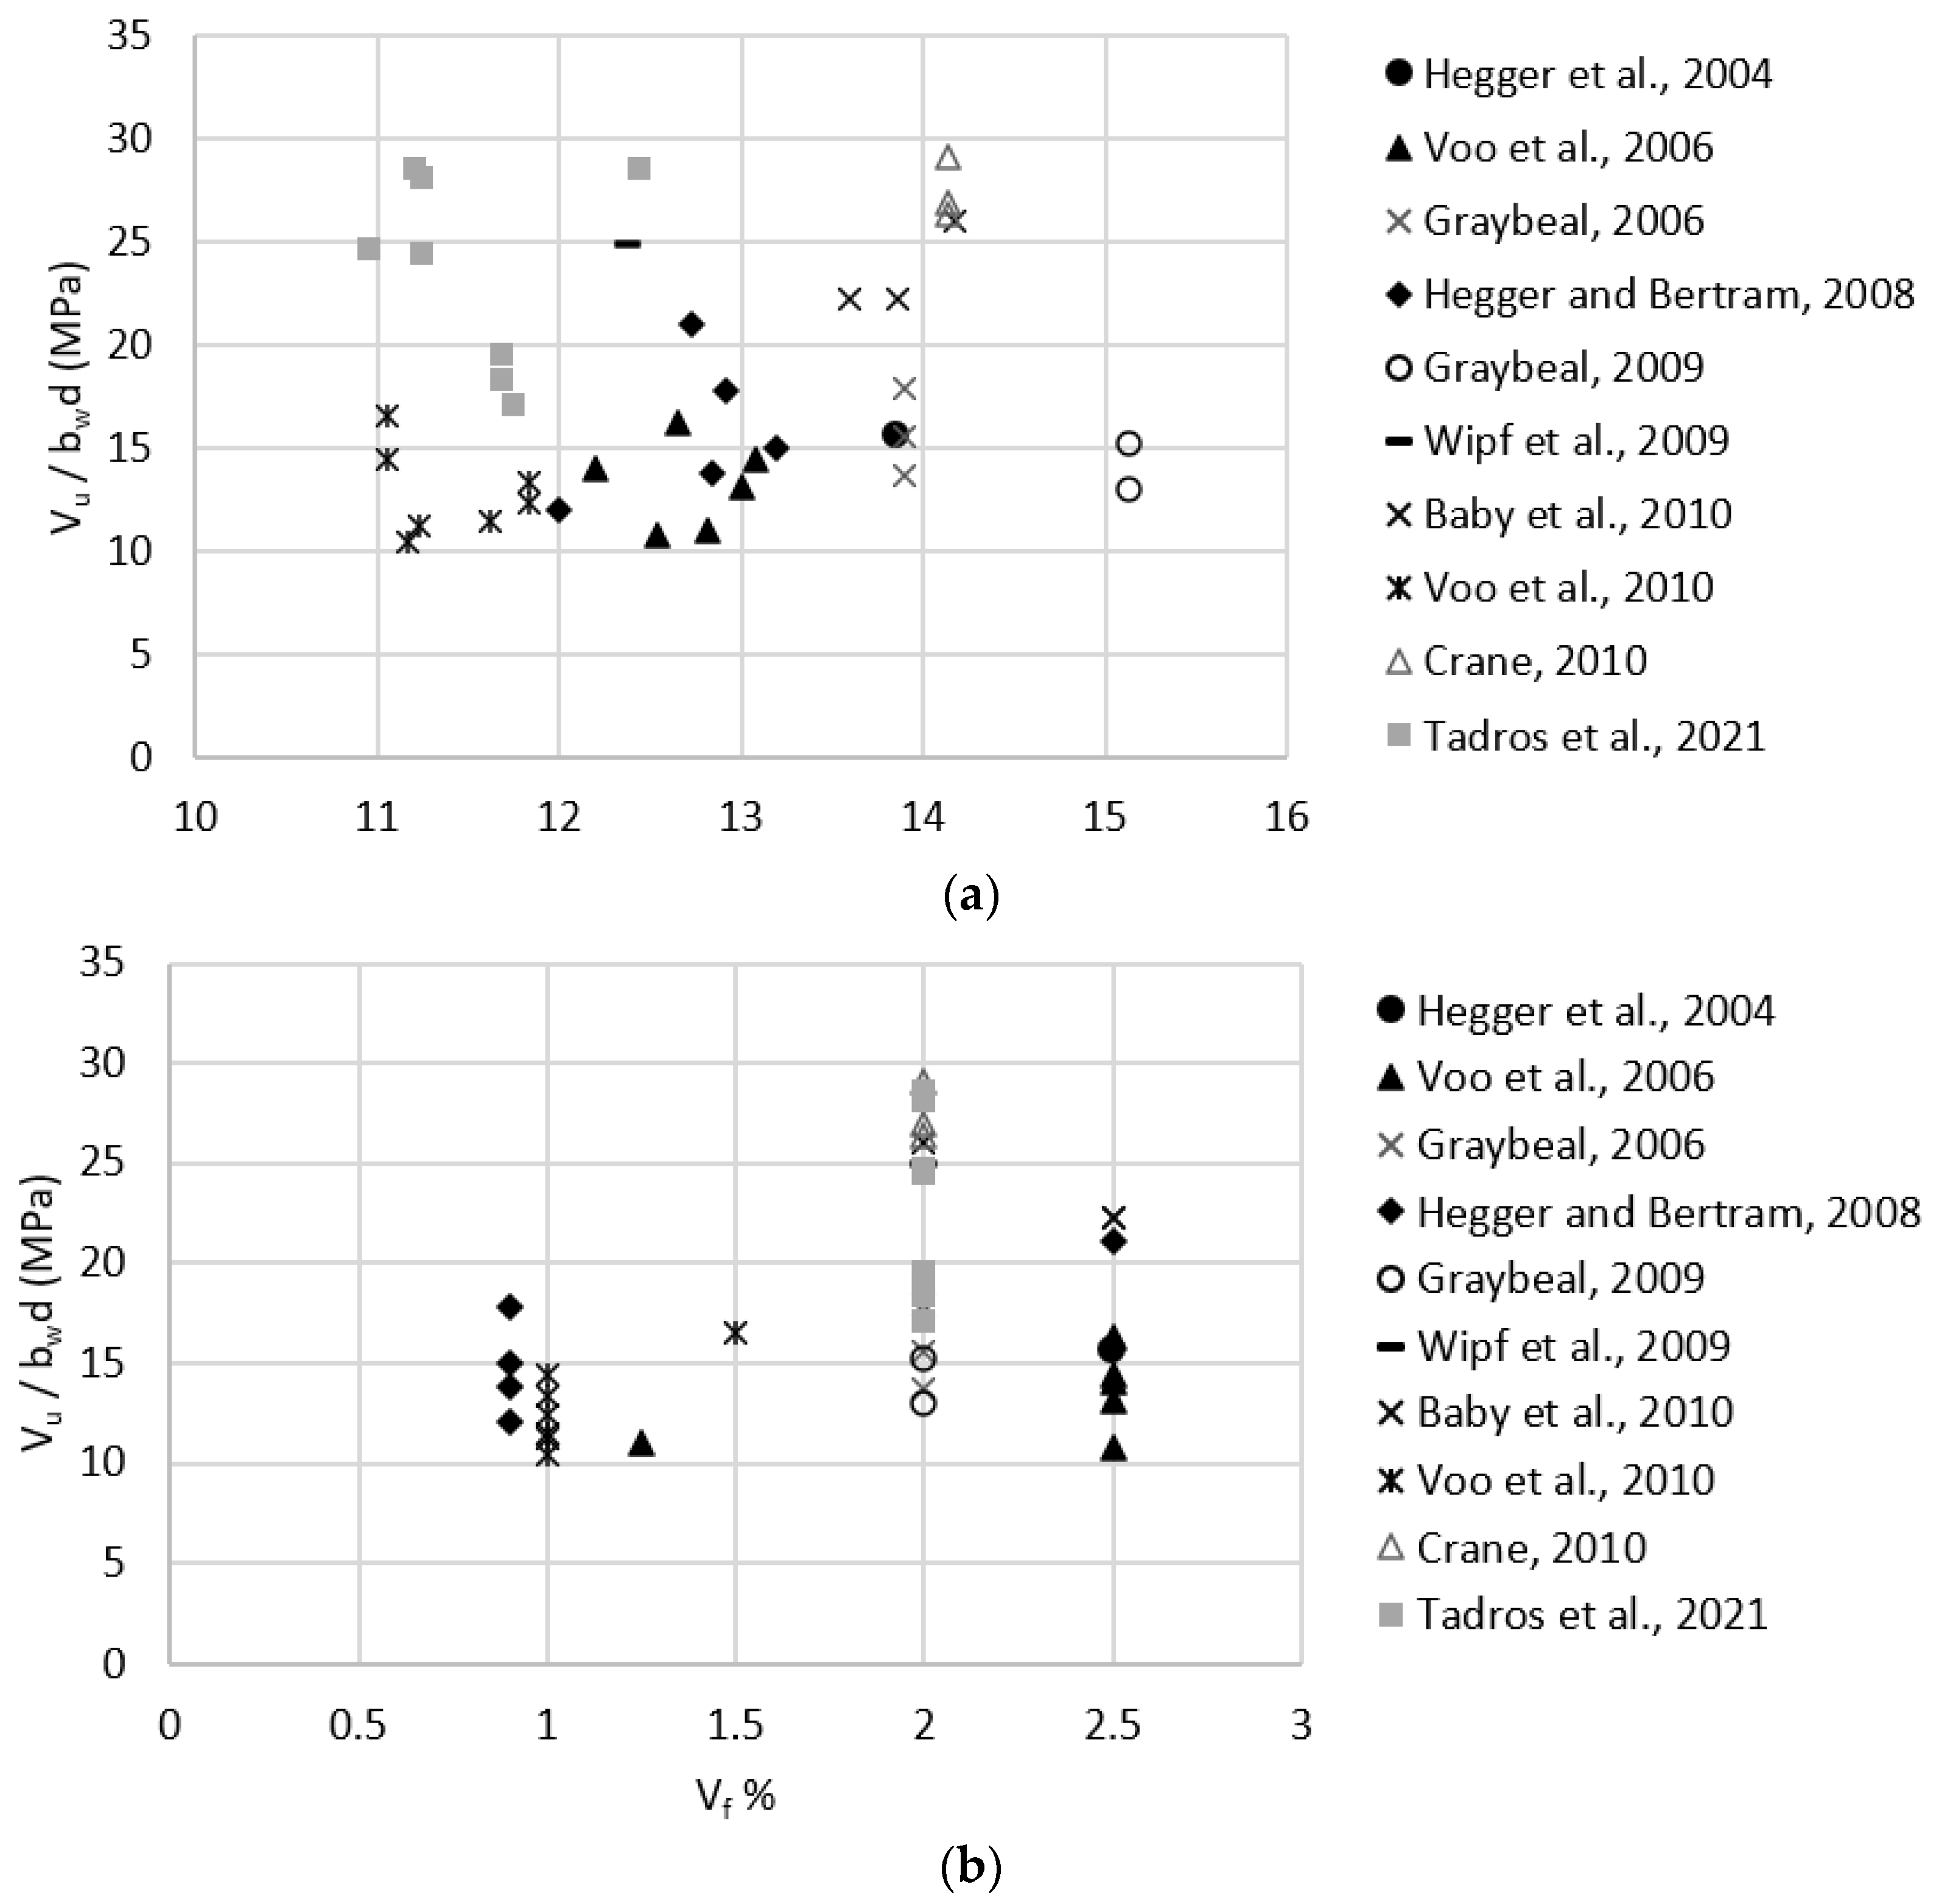
- Among the parameters affecting the shear strength of prestressed and non-prestressed beams, the tensile strength of UHPC () was found to have a significant positive correlation with the shear strength of UHPC beams.
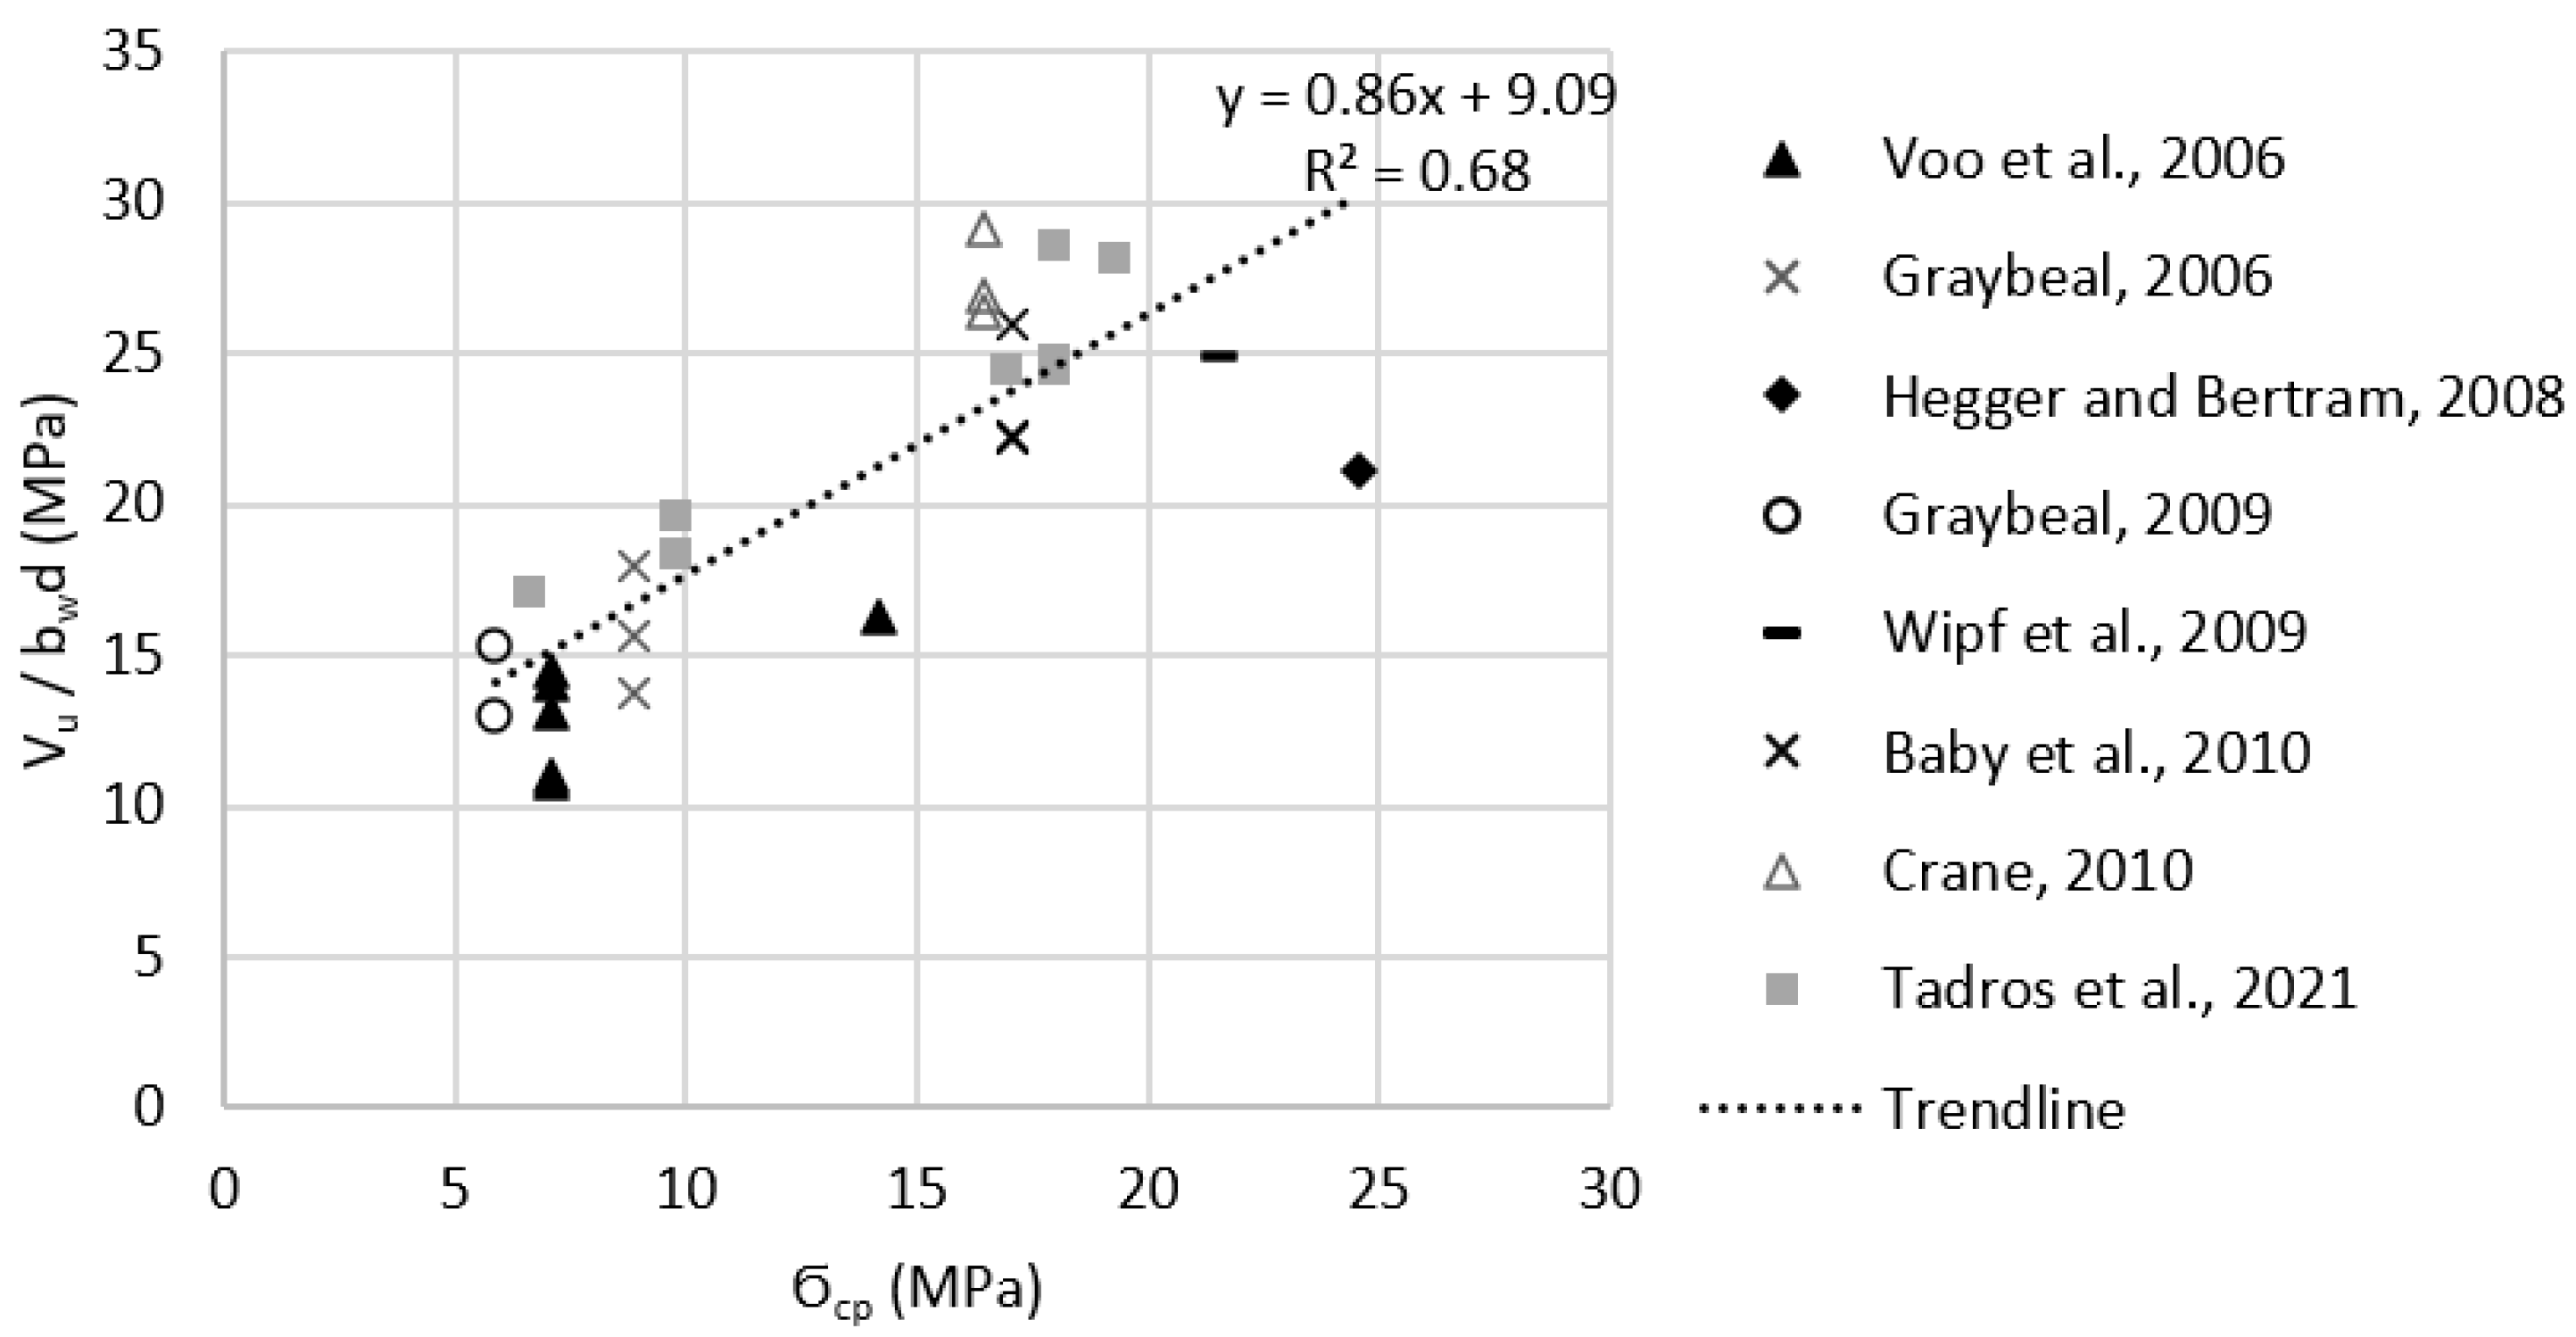
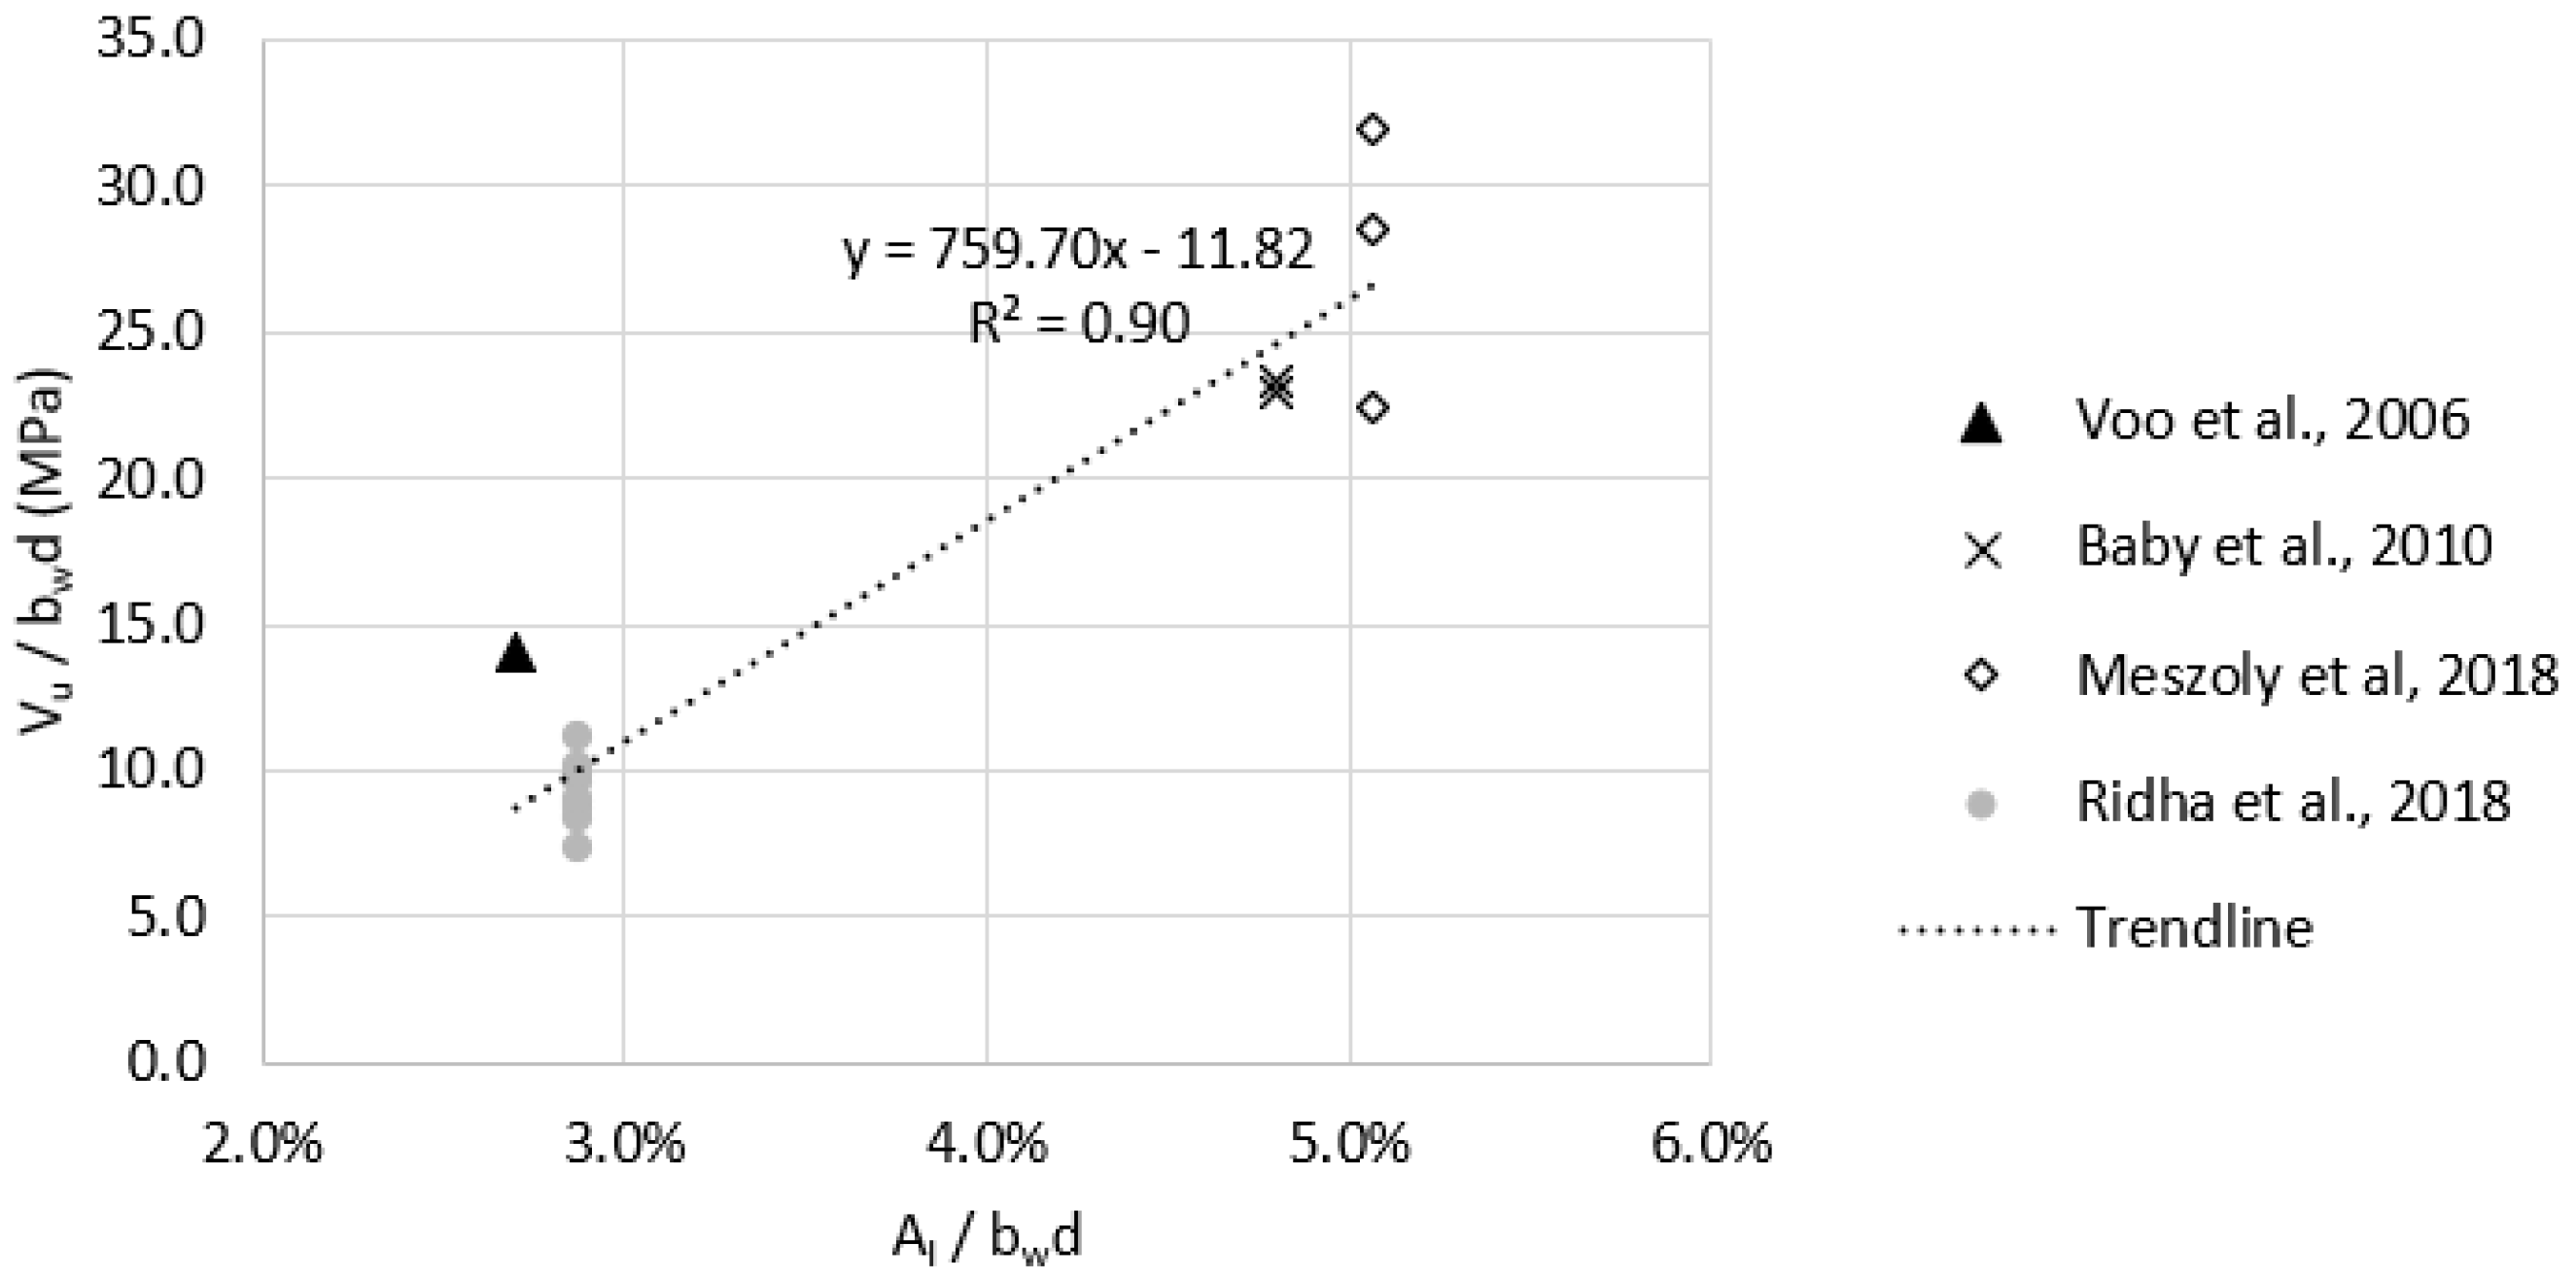
- For UHPC beams with a fiber volume fraction of at least 2%, the level of prestressing () and longitudinal reinforcement ratio () were found to have a significant effect on the shear strength of prestressed and non-prestressed beams, respectively.
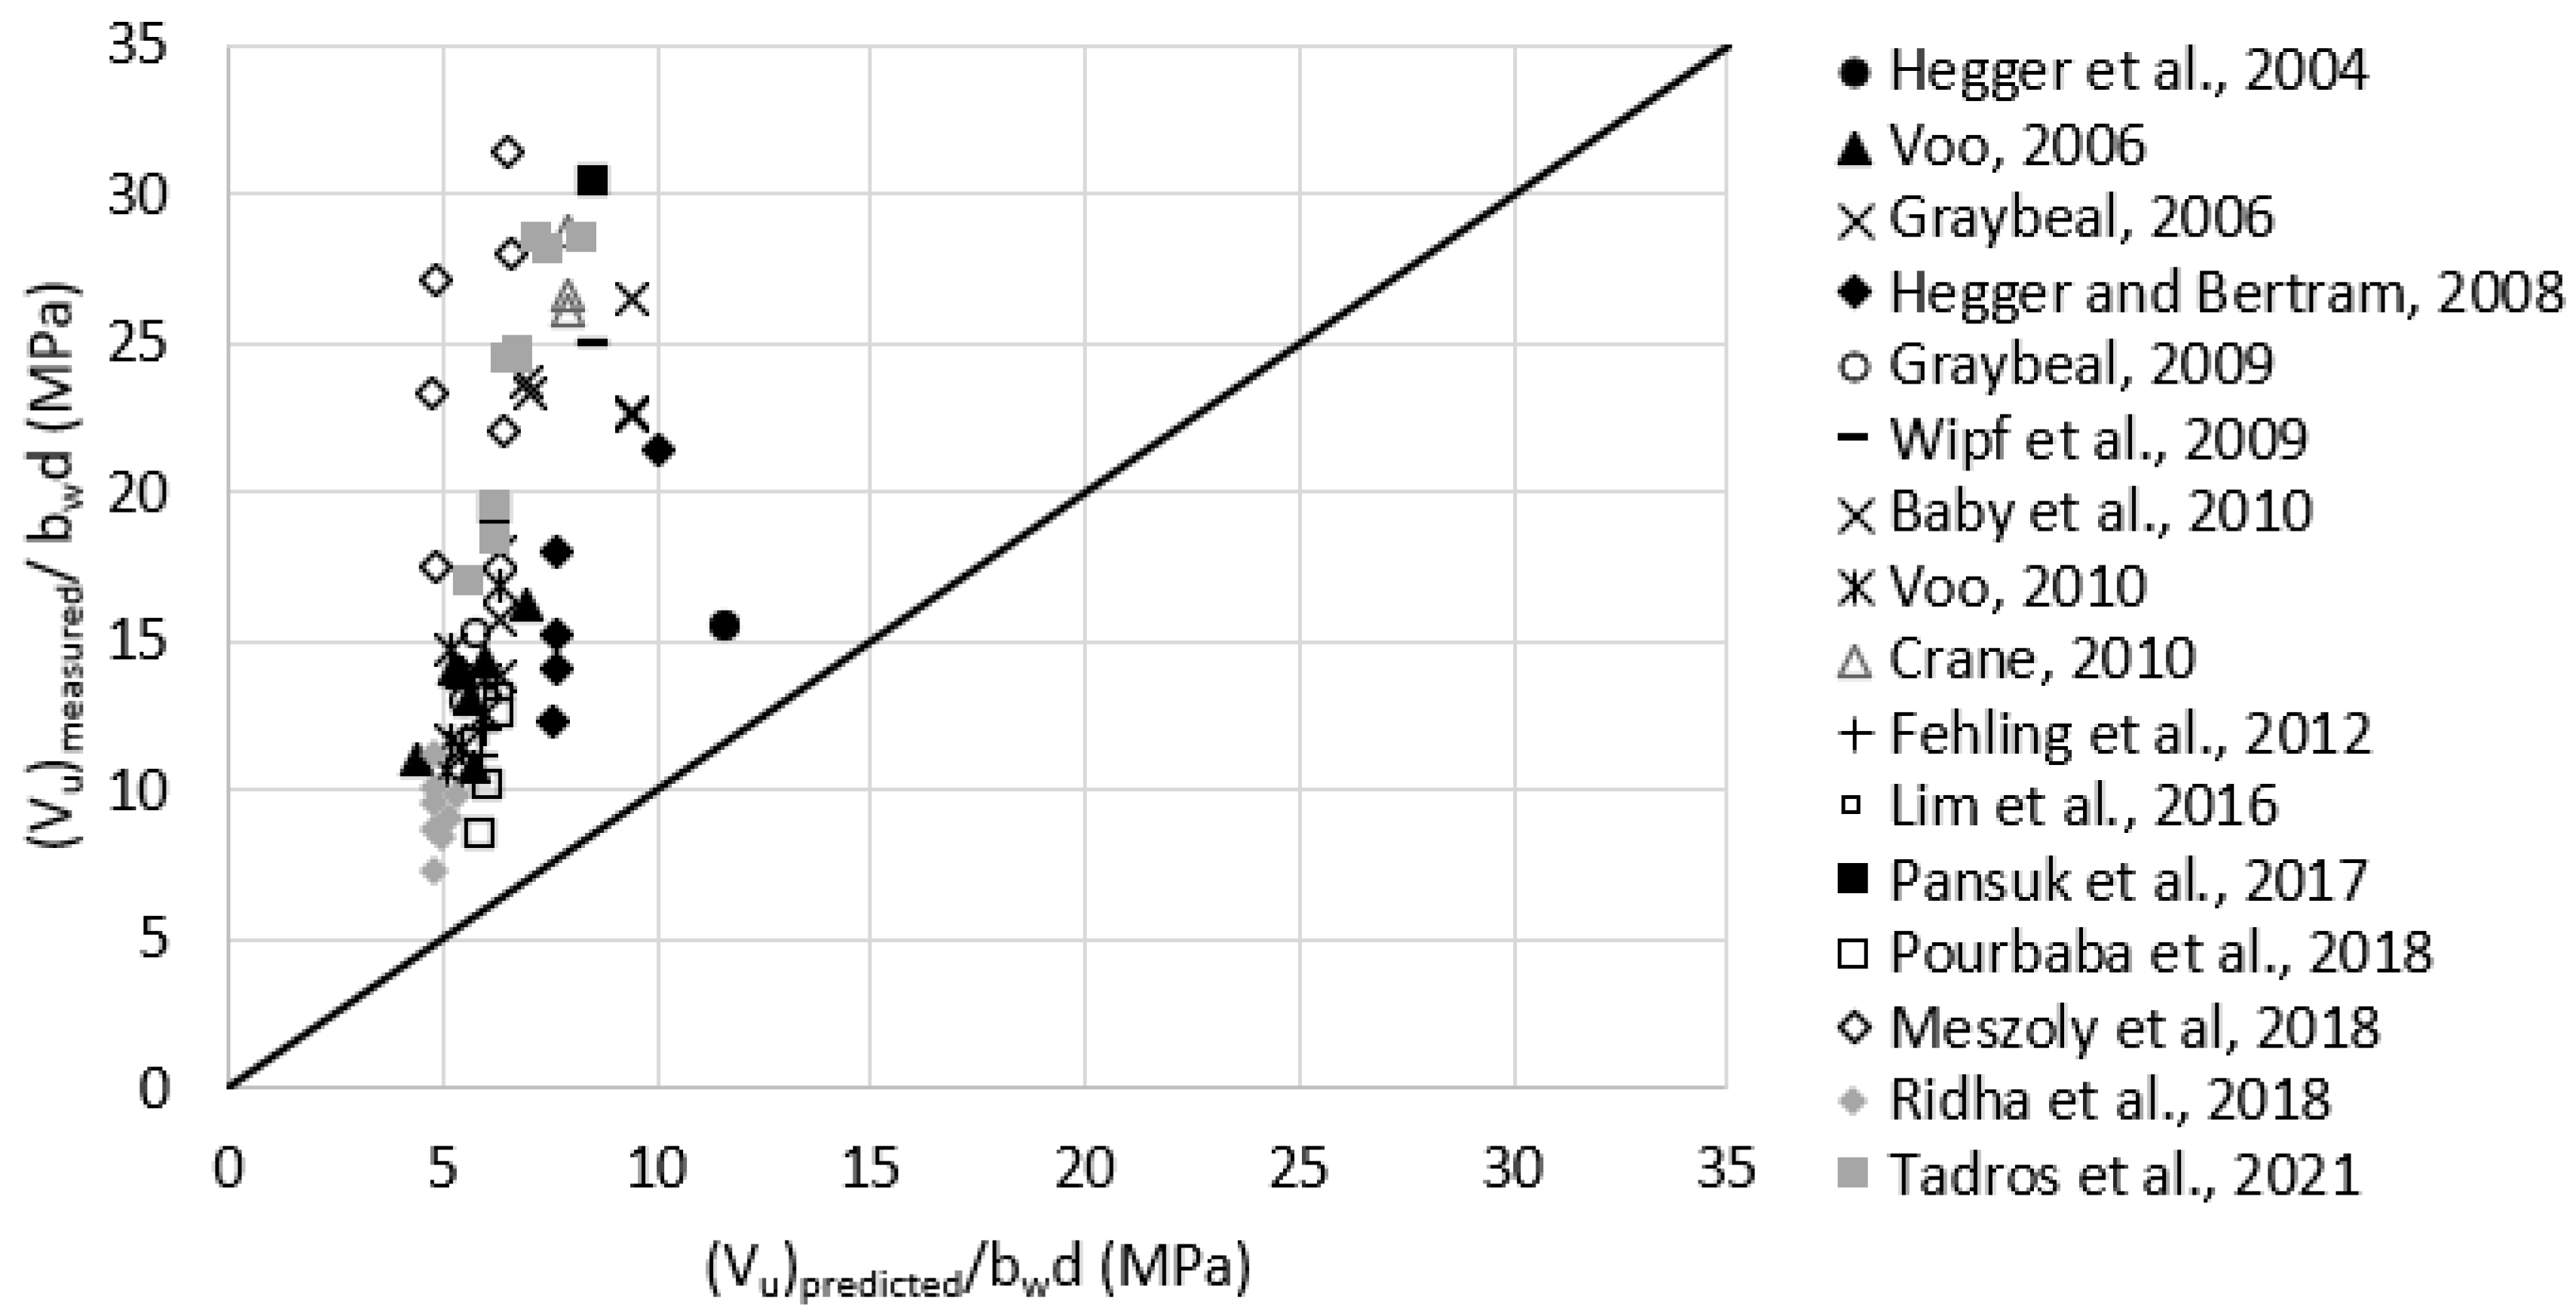
- The French Standard model provided the closest prediction to the measured shear strength of UHPC beams with the highest consistency of prediction, followed by the Draft of AASHTO model.
- The PCI-UHPC Structures Design Guide prediction model significantly underestimates the shear strength due to the limitation of UHPC residual tensile strength to 5.2 MPa. This value is significantly smaller than what is typically achieved by the commonly used UHPC mixes. However, the model procedure is much simpler compared to the other models.
- The RILEM and fib Model Code, 2010 prediction models were developed primarily for fiber-reinforced concrete and significantly underestimate the shear strength of UHPC beams.
- Residual tensile strength of UHPC is an essential parameter in all UHPC prediction models. The method of its determination is not unified between the shear experiments and prediction models. Moreover, the variability in residual tensile strength among specimens is large, which requires several direct tension or flexure tests to yield reliable predictions.
Author Contributions
Data curation, A.K.; Funding acquisition, G.M.; Supervision, G.M.; Validation, A.K.; Writing—original draft, A.K.; Writing—review & editing, G.M. All authors have read and agreed to the published version of the manuscript.
Funding
The research received no external funding.
Conflicts of Interest
The authors declare no conflict of interest. The funders had no role in the design of the study; in the collection, analyses, or interpretation of data; in the writing of the manuscript, or in the decision to publish the results.
Appendix A
Table A1.
Shear experiments review on prestressed UHPC beams.
Table A1.
Shear experiments review on prestressed UHPC beams.
| Reference | Specimen ID | Specimen Shape | bw (mm) | d (mm) | h (mm) | a/d | Aps/bwd | (MPa) | lf (mm) | Φf (mm) | (MPa) | Vu (kN) | (MPa) | |||
|---|---|---|---|---|---|---|---|---|---|---|---|---|---|---|---|---|
| Hegger et al., 2004 [24] | 1 | I-beam | 70 | 250 | 300 | 2.5 | 5.4 | 6.80% | 26.9 | 192 | 13 | 0.15 | 12.1 | 31 | 271.3 | 15.9 |
| Voo et al., 2006 [23] | SB2 | I-beams | 50 | 600 | 650 | 2.5 | 3.3 | 2.70% | 14.5 | 160 | 13 (Type I) 30 (Type II) | 0.20 (Type I) 0.50 (Type II) | 9.8 | 34 | 496.8 | 16.6 |
| SB3 | 6.9 | 149 | 8.6 | 32 | 427.9 | 13.8 | ||||||||||
| SB4 | 1.25 | 164 | 5.5 | 26 | 336.3 | 11.0 | ||||||||||
| SB5 | 2.5 | 171 | 9.7 | 29 | 439.9 | 14.5 | ||||||||||
| SB6 | 157 | 9.3 | 24 | 330 | 11.0 | |||||||||||
| SB7 | 169 | 8.8 | 21 | 399.9 | 13.1 | |||||||||||
| Graybeal, 2006 [27] | 28S | AASHTO Type II | 155 | 803 | 910 | 2.0 | 2.5 | 1.90% | 9.0 | 193 | 13 | 0.20 | 11.0 | 40 | 1707.6 | 13.8 |
| 24S | 2.8 | 11.0 | 28 | 2232.5 | 17.9 | |||||||||||
| 14S | 2.3 | 11.0 | 25 | 1946.9 | 15.9 | |||||||||||
| Hegger and Bertram, 2008 [25] | T1a | I-beams | 60 | 318 | 400 | 0.9 2.5 0.9 | 3.8 | 4.60% | 24.8 | 144 | 18 | 0.15 | 5.0 | 30 | 234 | 12.4 |
| T1b | 165 | 5.0 | 30 | 266.9 | 13.8 | |||||||||||
| T3b | 162 | 9 | 11.0 | 30 | 407.9 | 21.4 | ||||||||||
| T4a | 167 | 18 | 5.0 | 30 | 343.8 | 17.9 | ||||||||||
| T4b | 4.4 | 174 | 5.0 | 30 | 290.9 | 15.2 | ||||||||||
| Graybeal, 2009 [28] | P 2-21S | Pi-girders | 170 | 750 | 838 | 2.0 | 2.9 | 1.73% | 6.2 | 229 | 13 | 0.20 | 11.4 | 32 | 1912.6 | 15.2 |
| P4-57SH | 2.4 | 10.6 | 35 | 1628.0 | 13.1 | |||||||||||
| Wipf et al., 2009 [29] | 1 | I-beams | 115 | 927 | 1067 | 2.0 | 2.5 | 5.6% | 21.4 | 153 | 13 | 0.20 | 11.7 | 25 | 2642.1 | 24.8 |
| Baby et al., 2010 [31] | Beam 1-A | I-beams | 65 | 305 | 380 | 2.5 | 2.5 | 4.10% | 17.2 | 185 | 20 | 0.30 | 12.0 | 30 | 441.2 | 22.1 |
| Beam 1-A-bis | 192 | 12.0 | 30 | 440.4 | 22.1 | |||||||||||
| Beam 1-B | 2.0 | 201 | 13 | 0.20 | 12.0 | 30 | 515.5 | 26.2 | ||||||||
| Voo et al., 2010 [30] | X-B1 | I-beams with Symmetric Prestressing | 50 | 620 | 650 | 1.0 | 3.2 | 2.60% | 15.2 | 125 | 15 | 0.20 | 4.4 | 26 | 330.0 | 10.4 |
| X-B2 | 126 | 5.3 | 24 | 355.0 | 11.0 | |||||||||||
| X-B3 | 135 | 4.6 | 22 | 362.1 | 11.7 | |||||||||||
| X-B4 | 2.5 | 122 | 4.6 | 26 | 455.5 | 14.5 | ||||||||||
| X-B5 | 3.5 | 140 | 6.6 | 24 | 422.6 | 13.1 | ||||||||||
| X-B6 | 4.5 | 140 | 6.6 | 24 | 390.5 | 12.4 | ||||||||||
| X-B7 | 1.5 | 2.5 | 122 | 7.8 | 29 | 521.3 | 16.6 | |||||||||
| Crane, 2010 [15] | 1-2 | Bulb-Tee Girders | 101 | 720 | 835 | 2.0 | 3.4 | 3.90% | 16.5 | 200 | 13 | 0.20 | 11.0 | 26 | 1917.1 | 26.9 |
| 2-1 | 23 | 2072.8 | 29.0 | |||||||||||||
| 3-1 | 25 | 1877.1 | 26.2 | |||||||||||||
| Tadros et al., 2021 [8] | IA1 | I-beams | 76.2 | 734.0 | 863.6 | 2% | 2.9 | 6.5% | 18.0 | 154.6 | 13 | 0.20 | 11.0 | 26.8 | 1596.9 | 28.3 |
| IA2 | 120.1 | 6.9 | 30.8 | 1383.4 | 24.8 | |||||||||||
| IA3 | 126.3 | 6.9 | 28.3 | 1370.0 | 24.8 | |||||||||||
| IA8 | 125.6 | 8.3 | 28.0 | 1596.9 | 28.3 | |||||||||||
| IA13 | 50.8 | 9.8% | 19.3 | 126.3 | 7.6 | 32.0 | 1049.8 | 28.3 | ||||||||
| IA14 | 101.6 | 4.9% | 16.9 | 126.3 | 6.9 | 28.0 | 1823.8 | 24.2 | ||||||||
| DIB—Test 1 | Decked I-Beam | 100 | 924.0 | 1000 | 2.7 | 2.2% | 6.4 | 138.0 | 10.4 | 28.0 | 1579.1 | 17.3 | ||||
| BX-1 | Box Section | 152.4 | 406.4 | 457.2 | 2.8 | 3.5% | 9.8 | 136.6 | 8.3 | 25.0 | 1214.4 | 19.3 | ||||
| BX-2 | 1138.7 | 18.4 | ||||||||||||||
| Maximum | 170 | 927 | 1067 | 2.5 | 5.4 | 9.80% | 26.9 | 229 | 30 | 0.50 | 12.1 | 40 | 2642.1 | 29.0 | ||
| Minimum | 50 | 250 | 300 | 0.9 | 2.3 | 1.73% | 6.2 | 122 | 9 | 0.15 | 4.4 | 22 | 234 | 10.4 |
Table A2.
Shear experiments review on non-prestressed UHPC beams.
Table A2.
Shear experiments review on non-prestressed UHPC beams.
| Reference | Specimen ID | Specimen Shape | bw (mm) | d (mm) | h (mm) | % | a/d | (MPa) | lf (mm) | Φf (mm) | (MPa) | Vu (kN) | (MPa) | ||
|---|---|---|---|---|---|---|---|---|---|---|---|---|---|---|---|
| Voo et al., 2006 [23] | SB1 | I-beams | 50 | 600 | 650 | 2.5 | 3.3 | 2.70% | 161 | 13(Type I) 30 (Type II) | 0.20 (Type I) 0.50 (Type II) | 11.0 | 37 | 430.1 | 13.8 |
| Baby et al., 2010 [31] | Beam 3-A | I-beams | 65 | 305 | 380 | 2.5 | 2.5 | 4.80% | 185 | 20 | 0.30 | 12.0 | 30 | 461.3 | 23.5 |
| Beam 3-B | 2.0 | 2.5 | 4.80% | 201 | 13 | 0.20 | 12.0 | 30 | 455.0 | 22.8 | |||||
| Fehling et al., 2012 [33] | Q-F1-2 | Shear span was I-shaped | 30 | 295 | 320 | 1.0 | 4.1 | 6.60% | 201 | 13 | 0.18 | 8.7 | 30 | 108.1 | 12.4 |
| Q-F1-3 | 207 | 8.7 | 30 | 108.1 | 12.4 | ||||||||||
| Q2-F1-1 | 185 | 8.7 | 30 | 100.1 | 11.0 | ||||||||||
| Lim et al., 2016 [26] | SB1 | Rectangular Beams | 150 | 240 | 290 | 1.5 | 2.8 | 7.30% | 167 | 16 and 19 | 0.20 | 9.6 | 27 | 475.9 | 13.1 |
| Pourbaba et al., 2018 [34] | B35 | Rectangular Beams | 152 | 56 | 76 | 1.5 | 2.7 | 5.60% | 125 | 13 | 0.18 | 9.4 | 32 | 105.9 | 12.4 |
| B36 | 4.00% | 9.4 | 32 | 85.0 | 9.7 | ||||||||||
| B37 | 2.70% | 9.4 | 32 | 71.2 | 8.3 | ||||||||||
| Pansuk et al., 2017 [36] | NS08 | I-beams | 50 | 350 | 400 | 0.8 | 2.9 | 5.50% | 141 | 13 | 0.20 | 11.0 | 30 | 339.8 | 19.3 |
| NS16 | 1.6 | 140 | 17.0 | 38 | 531.1 | 30.4 | |||||||||
| Meszoly et al., 2018 [37] | B19 | I-beams | 60 | 295 | 350 | 2.0 | 3.7 | 5.06% | 152 | 15 | 0.20 | 11.0 | 30 | 396.8 | 22.8 |
| B20 | 1.0 | 154 | 6.8 | 29 | 419.0 | 23.5 | |||||||||
| B24 | 166 | 6.8 | 34 | 314.9 | 17.9 | ||||||||||
| B25 | 2.0 | 179 | 11.0 | 33 | 504.8 | 28.3 | |||||||||
| B29 | 177 | 6.8 | 31 | 487.1 | 27.6 | ||||||||||
| B30 | 2.0 | 169 | 11.0 | 36 | 564.9 | 31.7 | |||||||||
| Ridha et al., 2018 [38] | B5 | Rectangular Beams | 100 | 112 | 140 | 2.0 | 3.5 | 2.90% | 110 | 13 | 0.20 | 7.0 | 32 | 82.3 | 7.6 |
| B6 | 7.0 | 32 | 107.6 | 9.7 | |||||||||||
| B7 | 7.0 | 32 | 112.5 | 10.4 | |||||||||||
| B10 | 2.5 | 7.0 | 32 | 125 | 11.0 | ||||||||||
| B11 | 3.0 | 7.0 | 32 | 97.4 | 9.0 | ||||||||||
| B16 | 3.5 | 125 | 7.3 | 32 | 93.9 | 8.3 | |||||||||
| B17 | 142 | 7.6 | 35 | 101.0 | 9.0 | ||||||||||
| B18 | 151 | 7.8 | 35 | 109.9 | 9.7 | ||||||||||
| Maximum | 152 | 600 | 650 | 2.5 | 4.1 | 7.30% | 207 | 30 | 0.50 | 17.0 | 38 | 564.9 | 30.4 | ||
| Minimum | 30 | 56 | 76 | 0.8 | 2.5 | 2.70% | 110 | 9 | 0.15 | 6.8 | 27 | 71.2 | 7.6 |
References
- Kodsy, A.M. Repair and Strengthening of Concrete Bridges Using Ultra-High-Performance Concrete (UHPC). Ph.D. Thesis, The University of Nebraska-Lincoln, Lincoln, NE, USA, 2022. [Google Scholar]
- Wang, C.; Xiao, J.; Liu, W.; Ma, Z. Unloading and reloading stress-strain relationship of recycled aggregate concrete reinforced with steel/polypropylene fibers under uniaxial low-cycle loadings. Cem. Concr. Compos. 2022, 131, 104597. [Google Scholar] [CrossRef]
- Graybeal, B.A. Material Property Characterization of Ultra-High Performance Concrete; Publication No. FHWA-HRT-06-United States; Federal Highway Administration, Office of Infrastructure Research and Development: Washington, DC, USA, 2006. [Google Scholar]
- Florent, B.; Marchand, P.; Toutlemonde, F. Shear behavior of ultrahigh performance fiber-reinforced concrete beams. I: Experimental investigation. J. Struct. Eng. 2013, 140, 04013111. [Google Scholar]
- Lucie, V. Recommendations of RILEM TC 162-TDF: Test and design methods for steel fibre reinforced concrete. Mater. Struct./Mater. Constr. 2000, 33, 3–5. [Google Scholar]
- International Federation for Structural Concrete CEB-fib. CEB-FIP Model Code 2010, Final Draft; International Federation for Structural Concrete CEB-fib: Lausanne, Switzerland, 2012; Volume 1. [Google Scholar]
- NF P 18-710; National Addition to Eurocode 2—Design of Concrete Structures: Specific Rules for Ultra-High Performance Fibre-Reinforced Concrete (UHPFRC). French Standard: Metropolitan, French, 2016.
- Tadros, M.; Lawler, J.; Abo El-Khier, M.; Gee, D.; Kurt, A.; Lucier, G.; Wagner, E. Implementation of Ultra-High Performance Concrete in Long-Span Precast Pretensioned Elements for Concrete Buildings and Bridges; Phase II Report; Precast/Prestressed Concrete Institute: Chicago, CA, USA, 2021. [Google Scholar] [CrossRef]
- American Association of State Highway and Transportation Officials. Structural Design with Ultra-High Performance Concrete. In AASHTO Guide Specification; Document developed for consideration by AASHTO CBS T-10 committee (Structural Concrete Design), Draft; American Association of State Highway and Transportation Officials: Washington, DC, USA, 2021. [Google Scholar]
- ENV 1992-1-1; Eurocode 2: Design of Concrete Structures—Part 1: General Rules and Rules for Buildings. European Pre-Standard: Brussels, Belgium, 1991.
- Vandewalle, L. Design method for steel fiber reinforced concrete proposed by RILEM TC 162-TDF. In Proceedings of the Fifth International RILEM Symposium on Fibre-Reinforced Concrete (FRC), Lyon, France, 13–15 September 2000; RILEM Publications SARL: Reykjavik, Iceland, 2000; pp. 51–64. [Google Scholar]
- 14651; Test Method for Metallic Fibre Concrete-Measuring the Flexural Tensile Strength (Limit of Proportionality (LOP), Residual). EN, BS: London, UK, 2007; pp. 1–20.
- AFGC (Association Francaise de Génie Civil). Ultra High Performance Fibre-Reinforced Concretes, Recommendations; AFGC Publication: Paris, France, 2013. [Google Scholar]
- AASHTO LRFD. Bridge Design Specifications, 8th ed.; American Association of State Highway and Transportation Officials: Washington, DC, USA, 2017. [Google Scholar]
- Crane, C.K. Shear and Shear Friction of Ultra-High Performance Concrete Bridge Girders; Georgia Institute of Technology: Atlanta, GA, USA, 2010. [Google Scholar]
- Degen, B.E. Shear Design and Behavior of Ultra-High Performance Concrete. Master’s Thesis, Iowa State University, Ames, IA, USA, 2006. [Google Scholar]
- ASTM C1609/C1609M-19; Standard Test Method for Flexural Performance of Fiber-Reinforced Concrete (Using Beam with Third-Point Loading). ASTM International: West Conshohocken, PA, USA, 2019. Available online: www.astm.org (accessed on 30 May 2021).
- Ultra-High Performance Concrete. DAfStb-Guideline; Draft; German Committee for Structural Concrete: Berlin, Germany, 2017. [Google Scholar]
- SIA 2052; Standard: Ultra-High Performance Fibre Reinforced Cement-Based Composites (UHPFRC) Construction Material, Dimensioning and Application. EPFL-Swiss Federal Institute of Technology: Vaud, Switzerland, 2016.
- El-Helou, R.G.; Graybeal, B.A. The ultra girder: A design concept for a 300-foot single span prestressed ultra-high performance concrete bridge girder. In International Interactive Symposium on Ultra-High Performance Concrete; Iowa State University Digital Press: Ames, IA, USA, 2019; Volume 2. [Google Scholar]
- Graybeal, B.A. Flexural behavior of an ultra high-performance concrete I-girder. J. Bridge Eng. 2008, 13, 602–610. [Google Scholar] [CrossRef]
- Kodsy, A.; Morcous, G. Flexural strength prediction models of non-prestressed Ultra-High Performance Concrete (UHPC) components. Structures 2021, 34, 4532–4547. [Google Scholar] [CrossRef]
- Voo, Y.L.; Foster, S.J.; Gilbert, R.I. Shear Strength of Fiber Reinforced Reactive Powder Concrete Prestressed Girders without Stirrups. J. Adv. Concr. Technol. 2006, 4, 123–132. [Google Scholar] [CrossRef] [Green Version]
- Josef, H.; Tuchlinski, D.; Kommer, B. Bond anchorage behavior and shear capacity of ultra high performance concrete beams. In Proceedings of the International Symposium on Ultra High Performance Concrete, Kassel, Germany, 13–15 September 2004. [Google Scholar]
- Hegger, J.; Bertram, G. Shear carrying capacity of Ultra-High Performance Concrete beams. In Proceedings of the International FIB Symposium 2008—Tailor Made Concrete Structures: New Solutions for Our Society, 96, Amsterdam, The Netherlands, 7 May 2008. [Google Scholar]
- Lim, W.-Y.; Hong, S.-G. Shear Tests for Ultra-High Performance Fiber Reinforced Concrete (UHPFRC) Beams with Shear Reinforcement. Int. J. Concr. Struct. Mater. 2016, 10, 177–188. [Google Scholar] [CrossRef] [Green Version]
- Graybeal, B.A. Structural Behavior of Ultra-High Performance Concrete Prestressed I-Girders; Publication No. FHWA-HRT-06-United States; Federal Highway Administration, Office of Infrastructure Research and Development: Washington, DC, USA, 2006. [Google Scholar]
- Graybeal, B.A. Structural Behavior of a Prototype UHPC Pi-Girder. In TechBrief FHWA; Turner-Fairbank Highway Research Center: McLean, VA, USA, 6 November 2009; pp. 1–4. [Google Scholar] [CrossRef]
- Wipf, T.; Phares, B.; Sritharan, S.; Degen, B.; Giesmann, M.T. Design and Evaluation of a Single-Span Bridge Using Ultra-High Performance Concrete; Institute for Transportation, Iowa State University: Ames, IA, USA, 2009. [Google Scholar]
- Voo, Y.L.; Poon, W.K.; Foster, S.J. Shear Strength of Steel Fiber-Reinforced Ultrahigh-Performance Concrete Beams without Stirrups. J. Struct. Eng. 2010, 136, 1393–1400. [Google Scholar] [CrossRef]
- Baby, F.; Marchand, P.; Toutlemonde, F.; Billo, J.; Simon, A. Shear resistance of ultra high performance fibre-reinforced concrete I-beams. In Fracture Mechanics of Concrete and Concrete Structures-High Performance, Fiber Reinforced Concrete, Special Loadings and Structural Application; Korea Concrete Institute: Seoul, Korea, 2010; pp. 1411–1417. [Google Scholar]
- Baby, F.; Marchand, P.; Toutlemonde, F. Shear behavior of ultrahigh performance fiber-reinforced concrete beams. II: Analysis and design provisions. J. Struct. Eng. 2013, 140, 04013112. [Google Scholar] [CrossRef]
- Fehling, E.; Thiemicke, J. Experimental investigations on I-Shaped UHPC-Beams with combined reinforcement under shear load. In Ultra High Performance Concrete and Nanotechnology in Construction, 3rd Intl. Symp. on Ultra High Performance Concrete and Nanotechnology for High Performance Construction Materials; Kassel University Press GmbH: Kassel, Germany, 2012. [Google Scholar]
- Pourbaba, M.; Joghataie, A.; Mirmiran, A. Shear behavior of ultra-high performance concrete. Constr. Build. Mater. 2018, 183, 554–564. [Google Scholar] [CrossRef]
- Pourbaba, M.; Joghataie, A. Determining Shear Capacity of Ultra-high Performance Concrete Beams by Experiments and Comparison with Codes. Sci. Iran. 2019, 26, 273–282. [Google Scholar] [CrossRef] [Green Version]
- Pansuk, W.; Nguyen, T.N.; Sato, Y.; Uijl, J.D.; Walraven, J. Shear capacity of high performance fiber reinforced concrete I-beams. Constr. Build. Mater. 2017, 157, 182–193. [Google Scholar] [CrossRef]
- Mészöly, T.; Randl, N. Shear behavior of fiber-reinforced ultra-high performance concrete beams. Eng. Struct. 2018, 168, 119–127. [Google Scholar] [CrossRef]
- Ridha, M.M.S.; Al-Shaarbaf, I.A.S.; Sarsam, K.F. Experimental study on shear resistance of reactive powder concrete beams without stirrups. Mech. Adv. Mater. Struct. 2018, 27, 1006–1018. [Google Scholar] [CrossRef]
- Haber, Z.B.; De la Varga, I.; Graybeal, B.A.; Nakashoji, B.; El-Helou, R. Properties and Behavior of UHPC-Class Materials (No. FHWA-HRT-18-036); Federal Highway Administration, Office of Infrastructure Research and Development: Washington, DC, USA, 2018. [Google Scholar]
- Prem, P.R.; Bharatkumar, B.H.; Iyer, N.R. Mechanical properties of ultra high performance concrete. World Acad. Sci. Eng. Technol. 2012, 68, 1969–1978. [Google Scholar]
- Yang, I.H.; Joh, C.; Kim, B.-S. Structural behavior of ultra high performance concrete beams subjected to bending. Eng. Struct. 2010, 32, 3478–3487. [Google Scholar] [CrossRef]
- Zagon, R.; Matthys, S.; Kiss, Z. Shear behaviour of SFR-UHPC I-shaped beams. Constr. Build. Mater. 2016, 124, 258–268. [Google Scholar] [CrossRef]
Publisher’s Note: MDPI stays neutral with regard to jurisdictional claims in published maps and institutional affiliations. |
© 2022 by the authors. Licensee MDPI, Basel, Switzerland. This article is an open access article distributed under the terms and conditions of the Creative Commons Attribution (CC BY) license (https://creativecommons.org/licenses/by/4.0/).