Two-Scale Tomography Based Finite Element Modeling of Plasticity and Damage in Aluminum Foams


Abstract
:1. Introduction
2. Materials and Experimental Procedures
2.1. Tomography
2.2. In Situ Tensile Test
3. Model
3.1. Gurson–Tvergaard–Needleman Damage Model
3.2. Mesh Generation
3.3. Identification of the Constitutive Model Parameters
3.4. Simulation Conditions
4. Results and Discussion
5. Conclusions
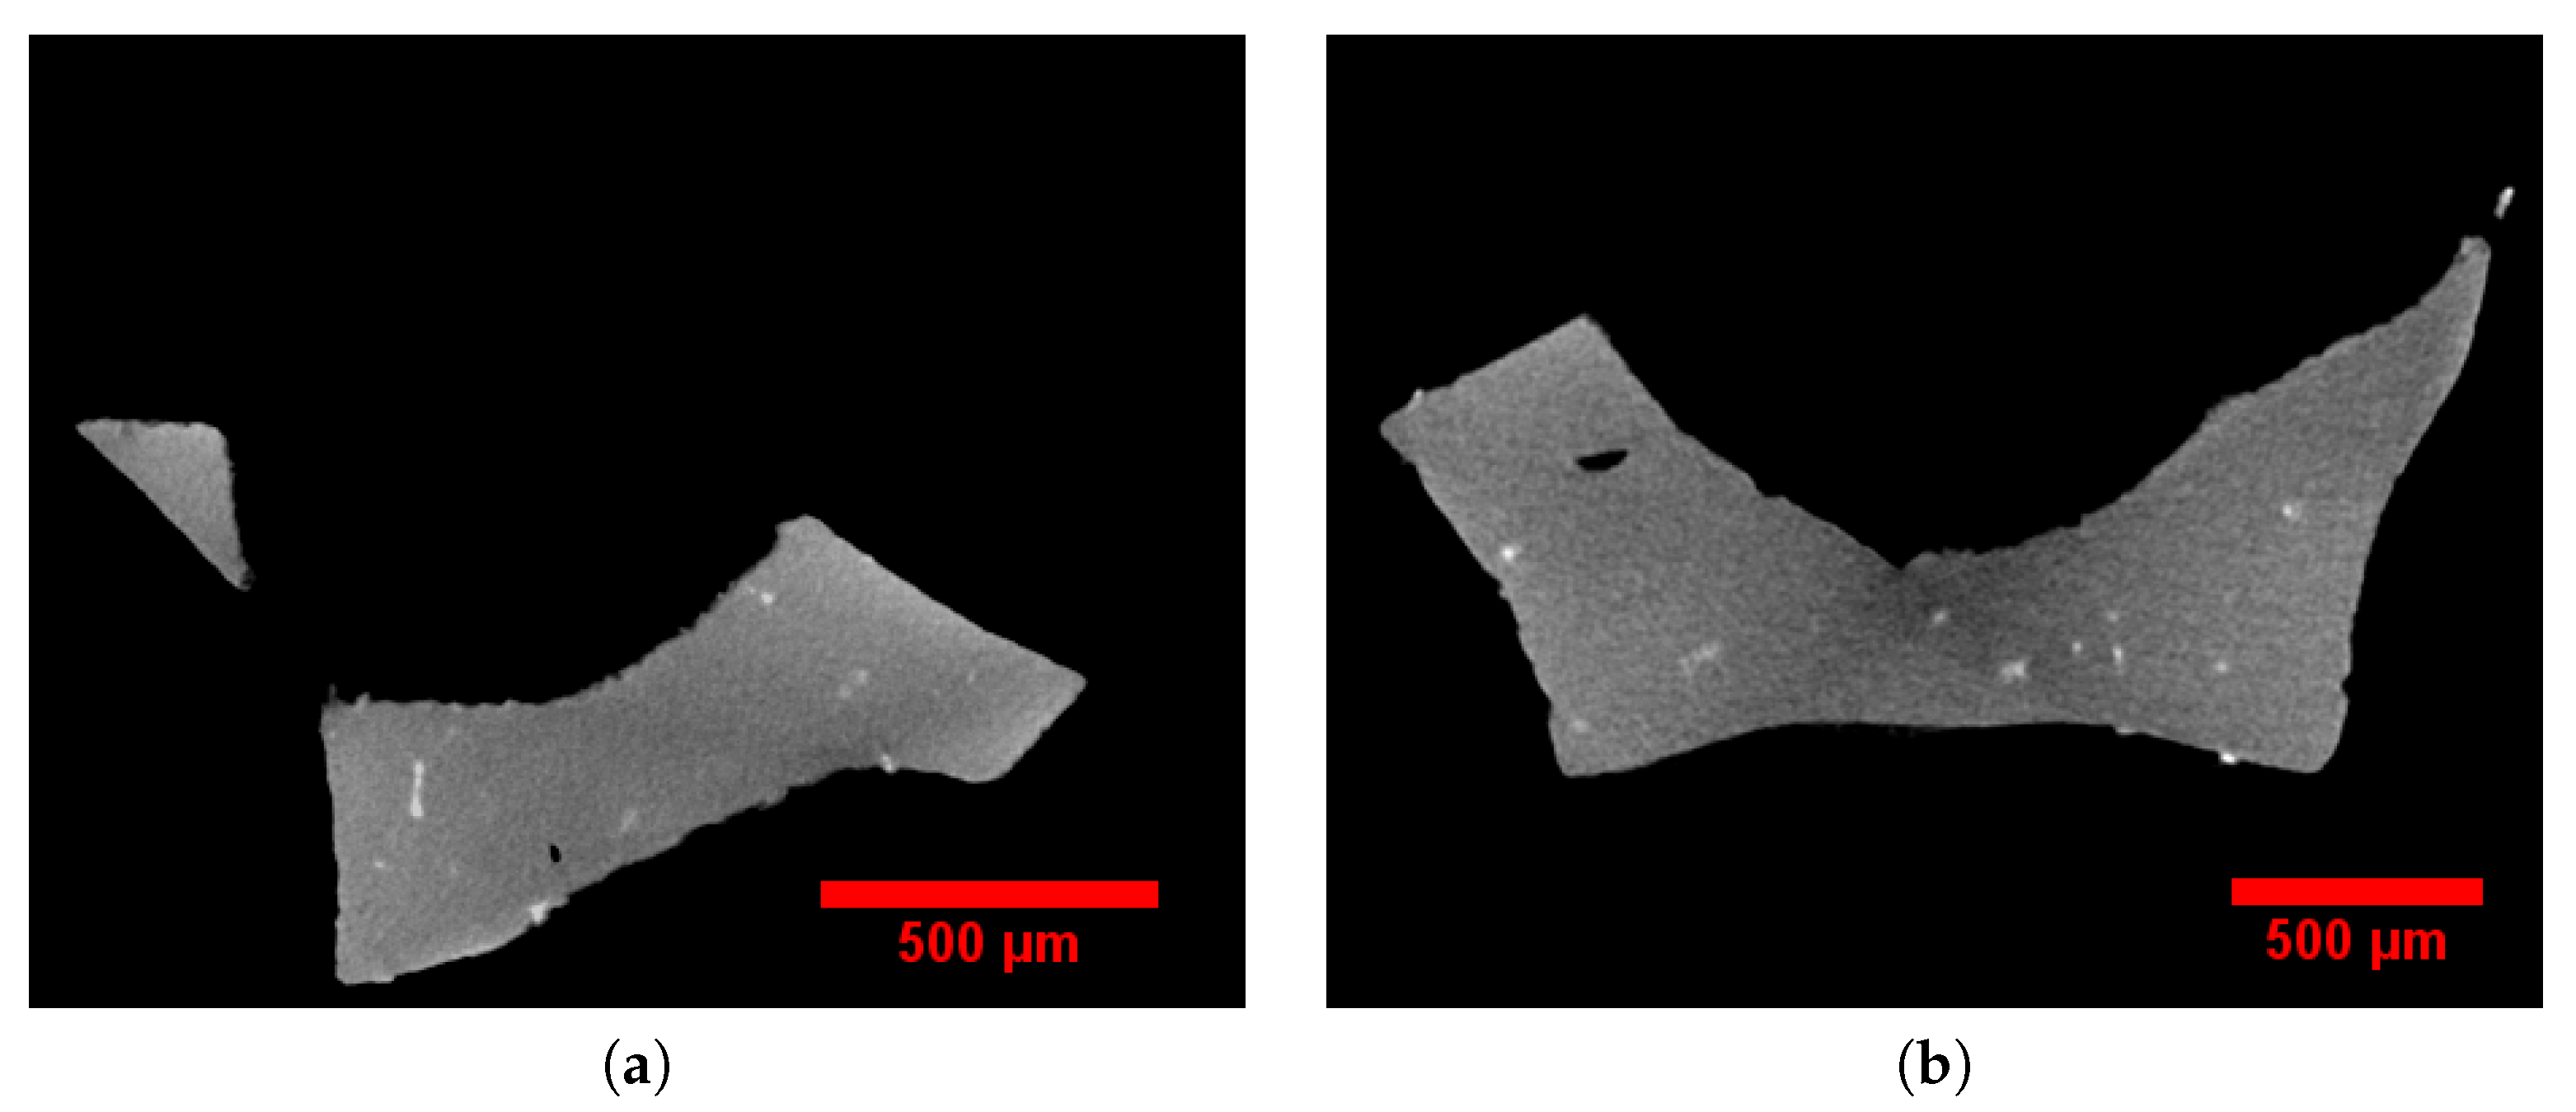
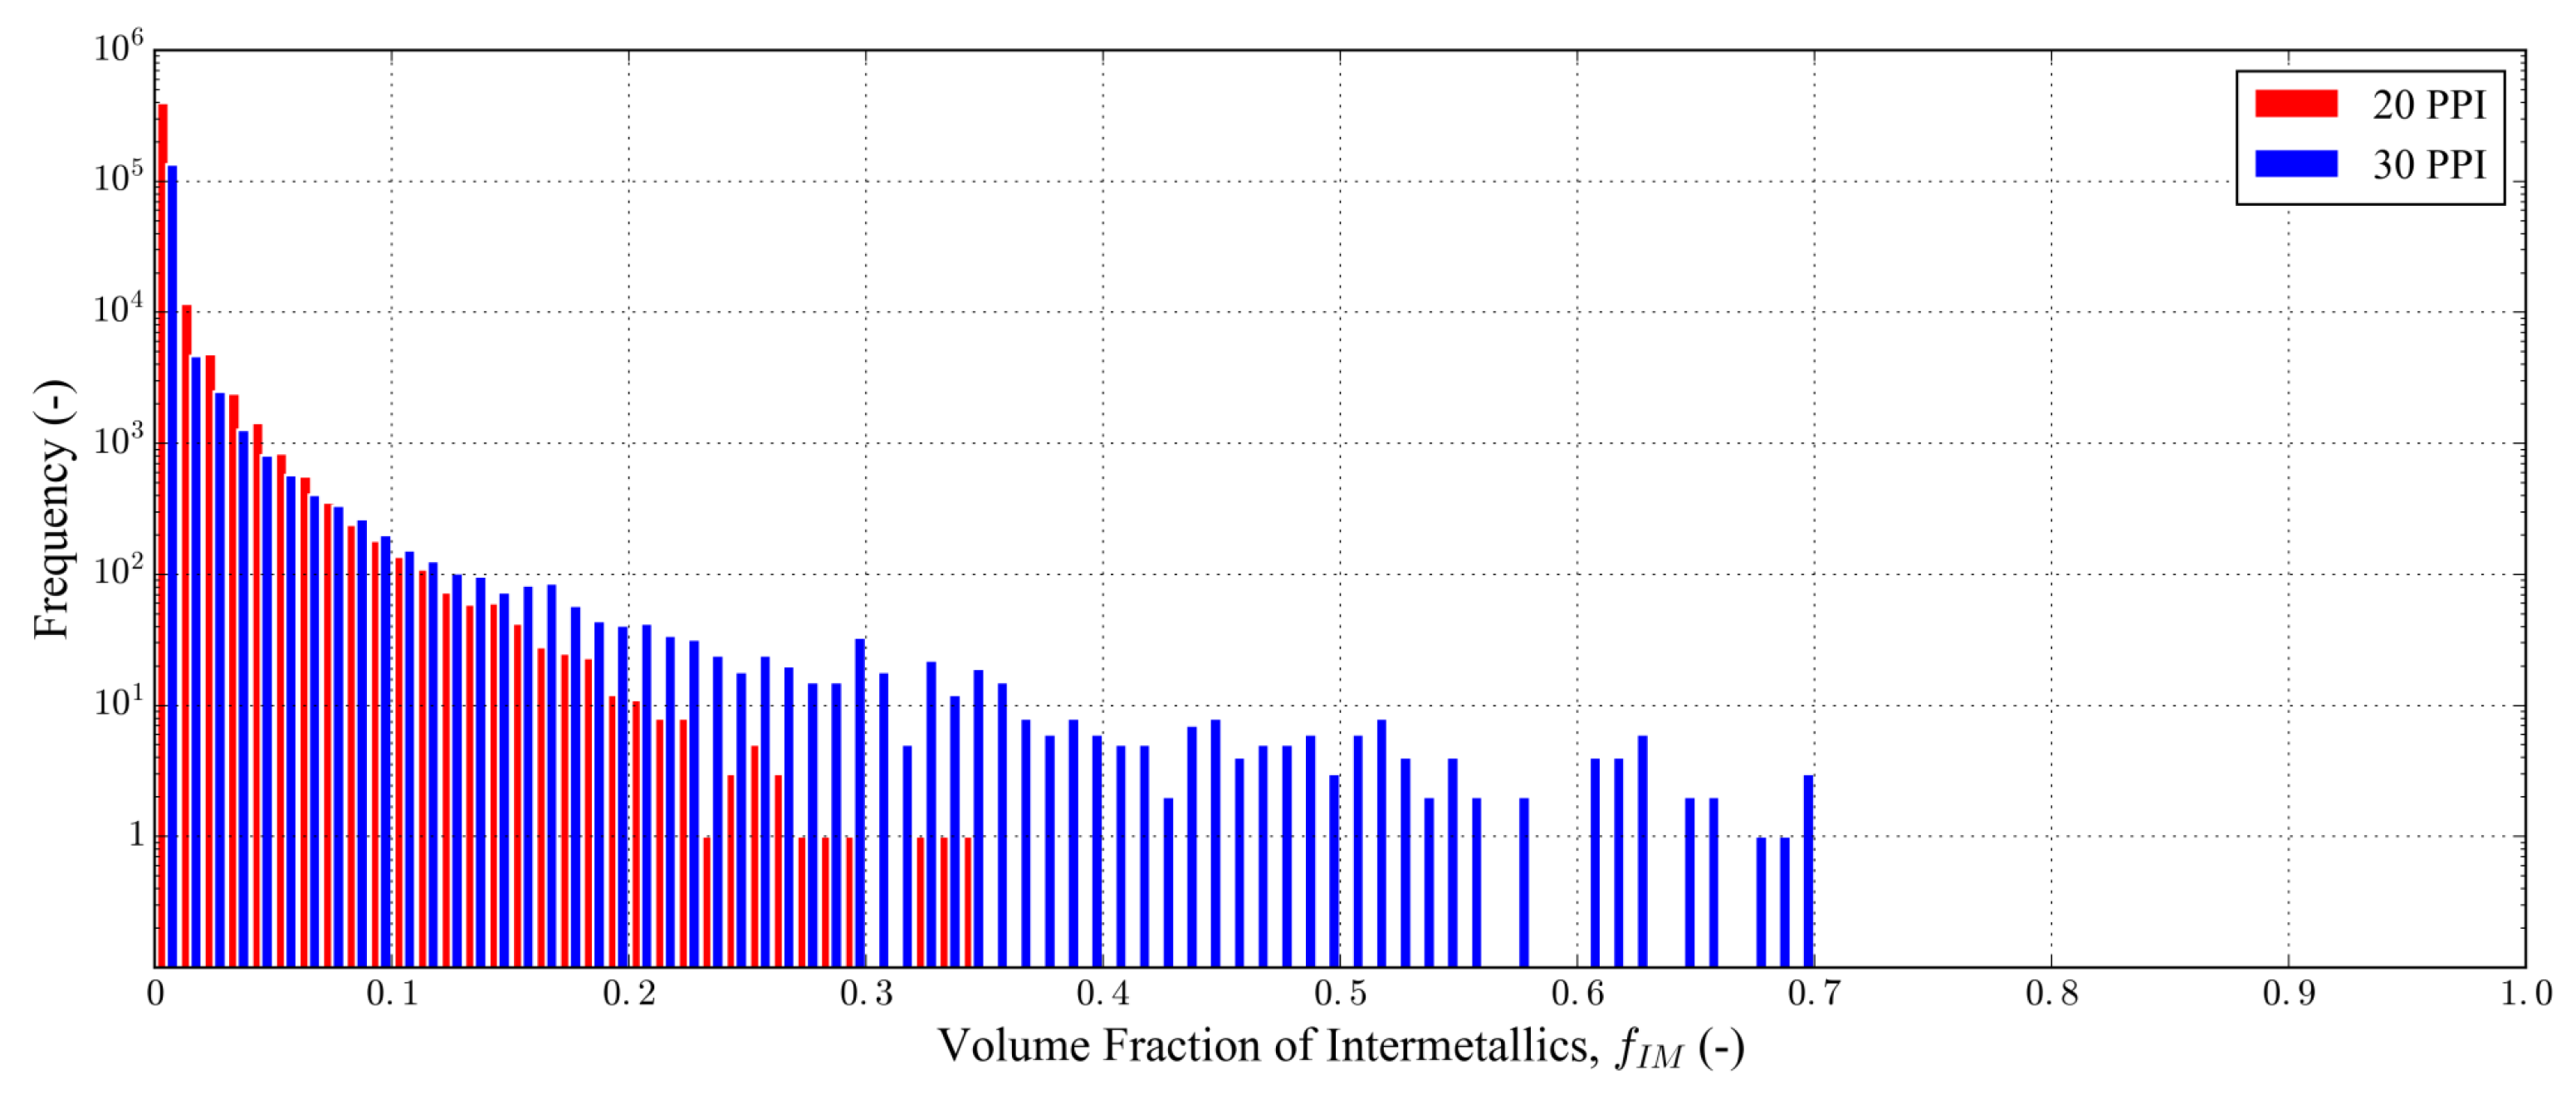
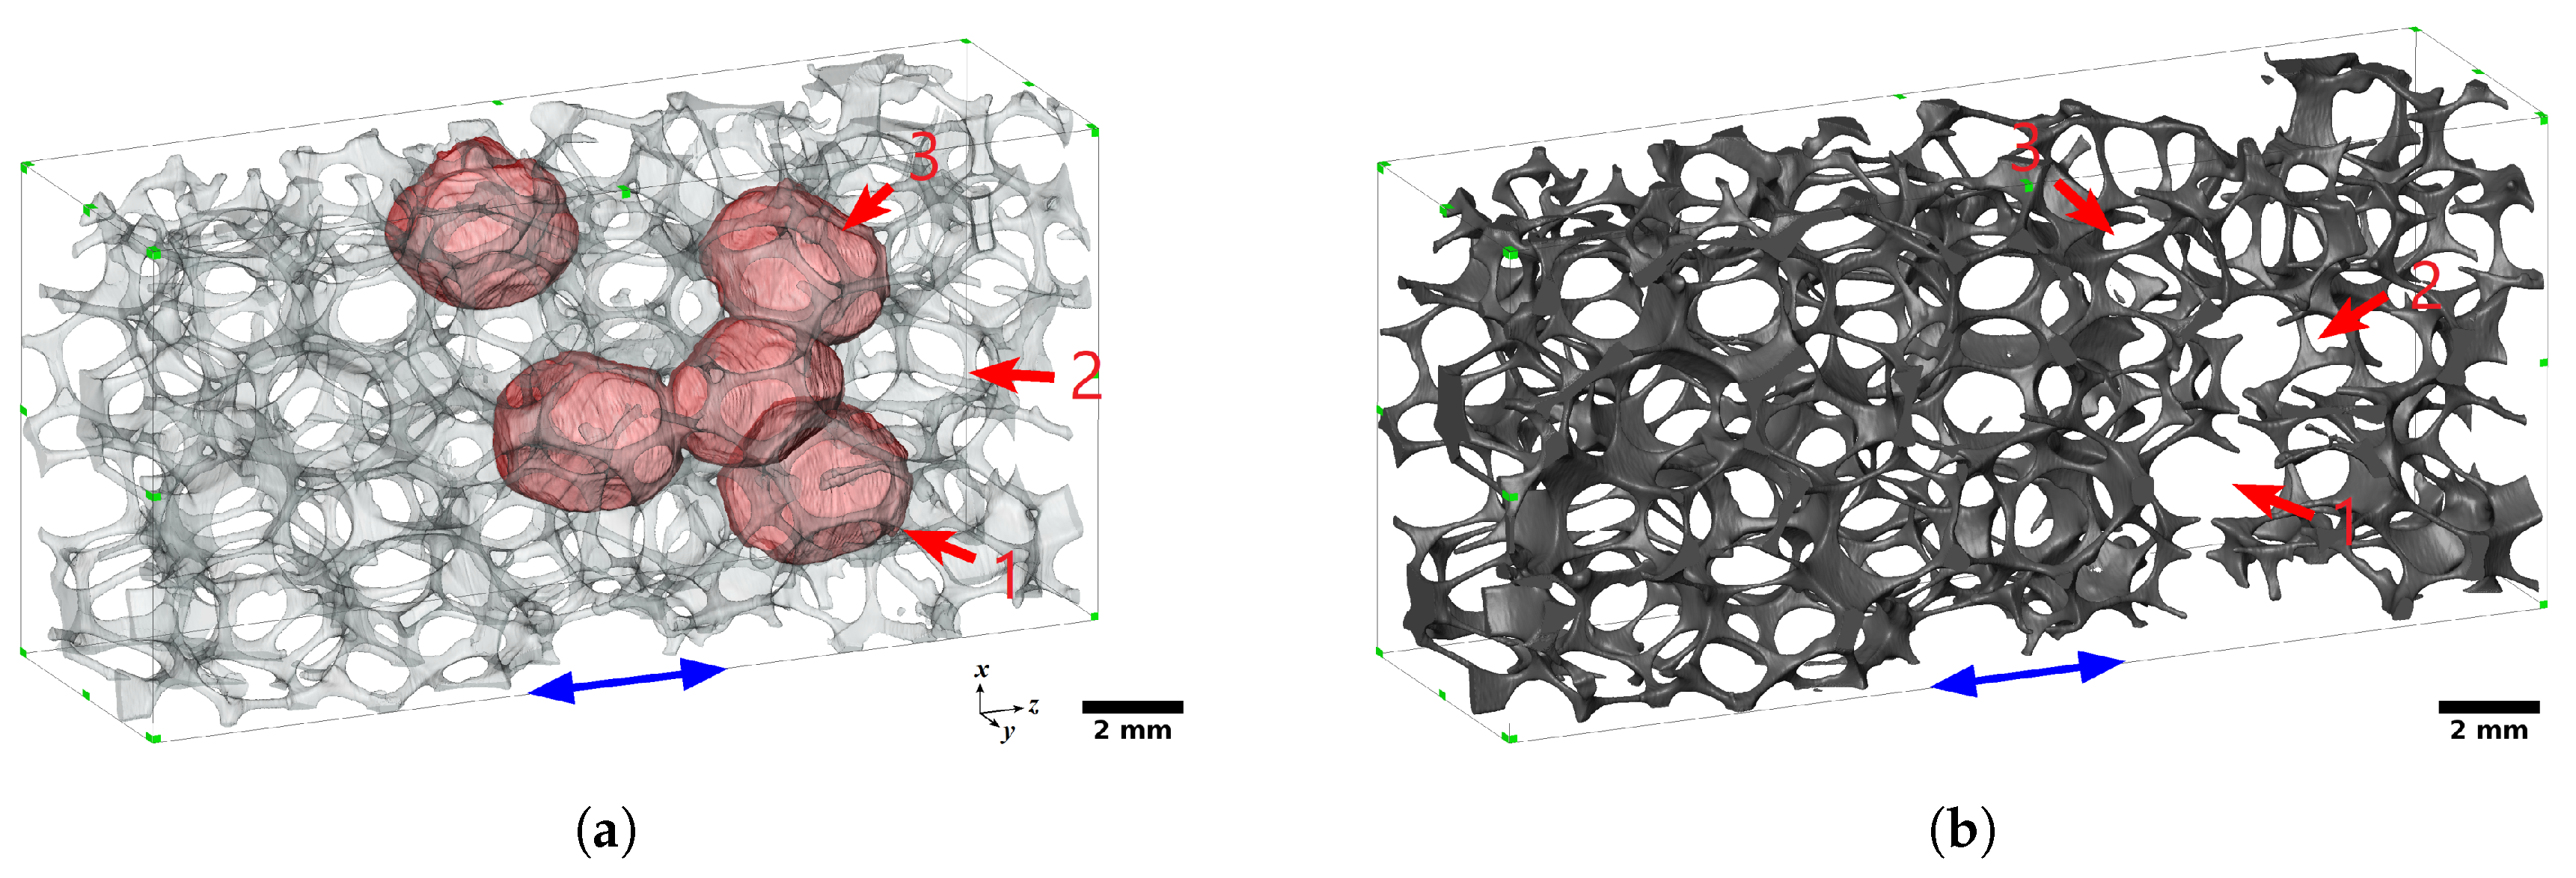
- The internal architecture of the solid phase of the foam was analyzed using high-resolution local tomography, providing elaborate quantitative data of the location of internal defects (e.g., internal microvoids and intermetallic particles inside the sample).
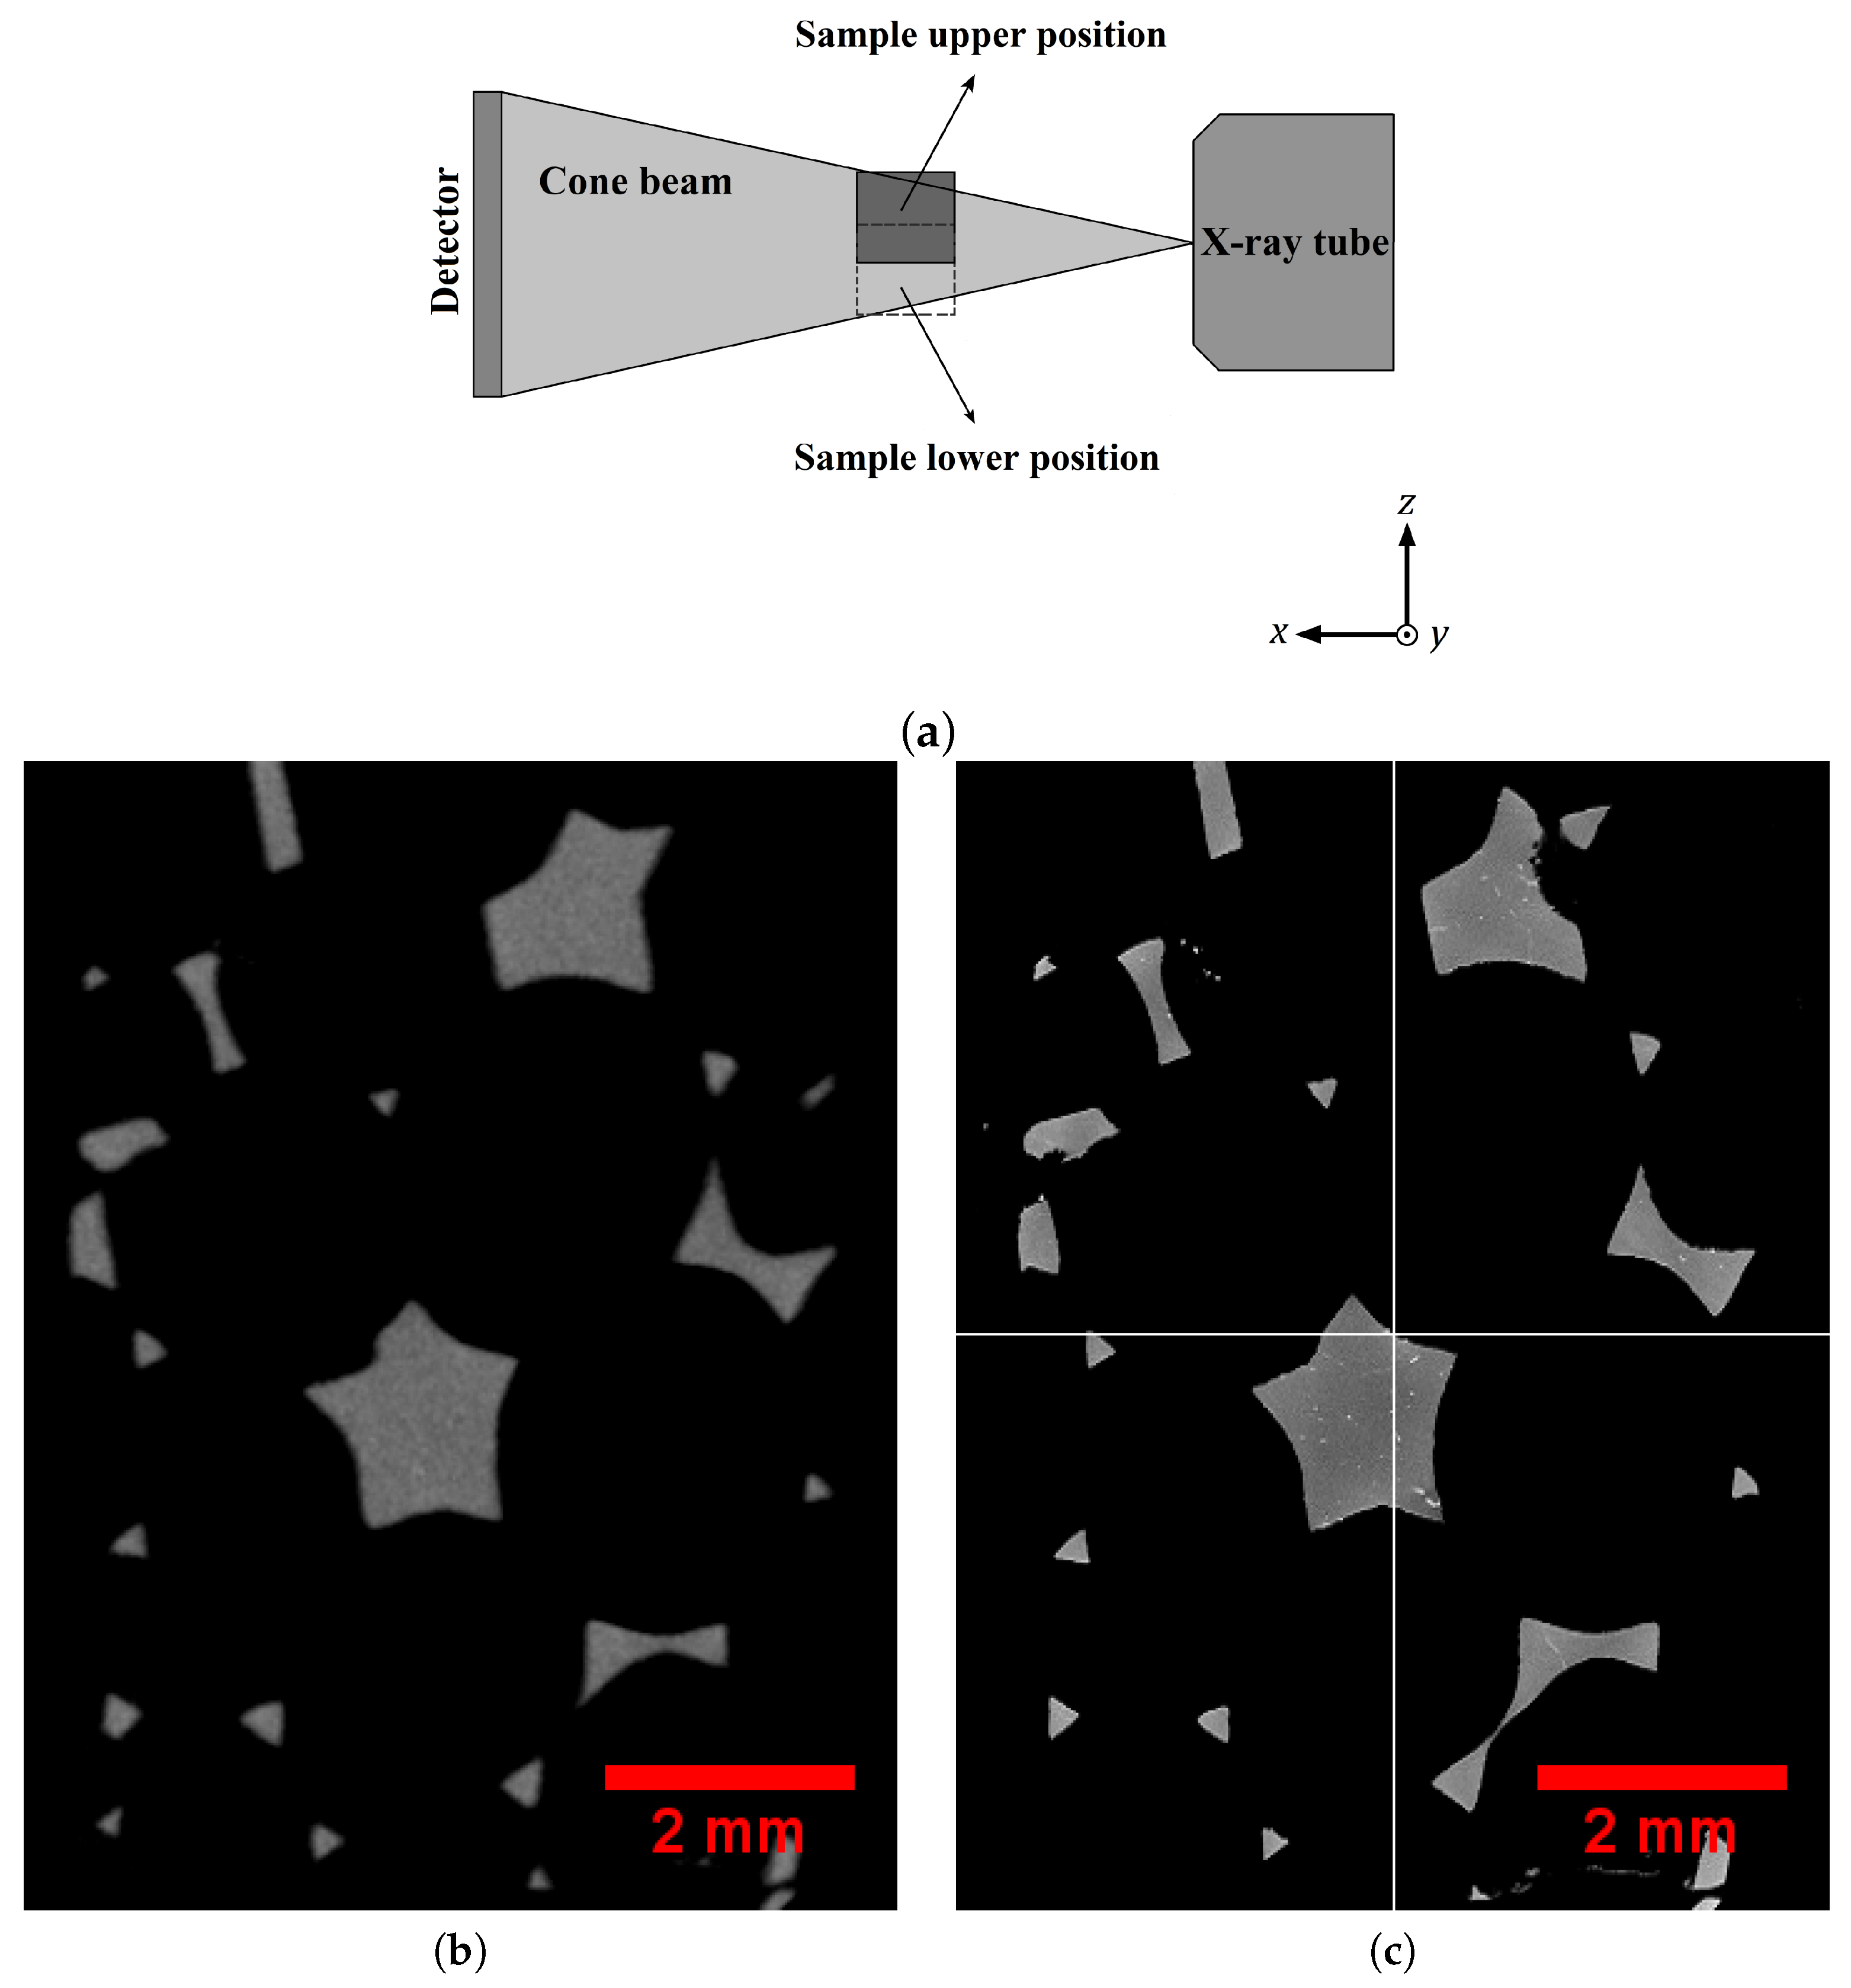
- The deformation and fracture mechanisms of the foam were studied in situ in tension using lower-resolution scans.
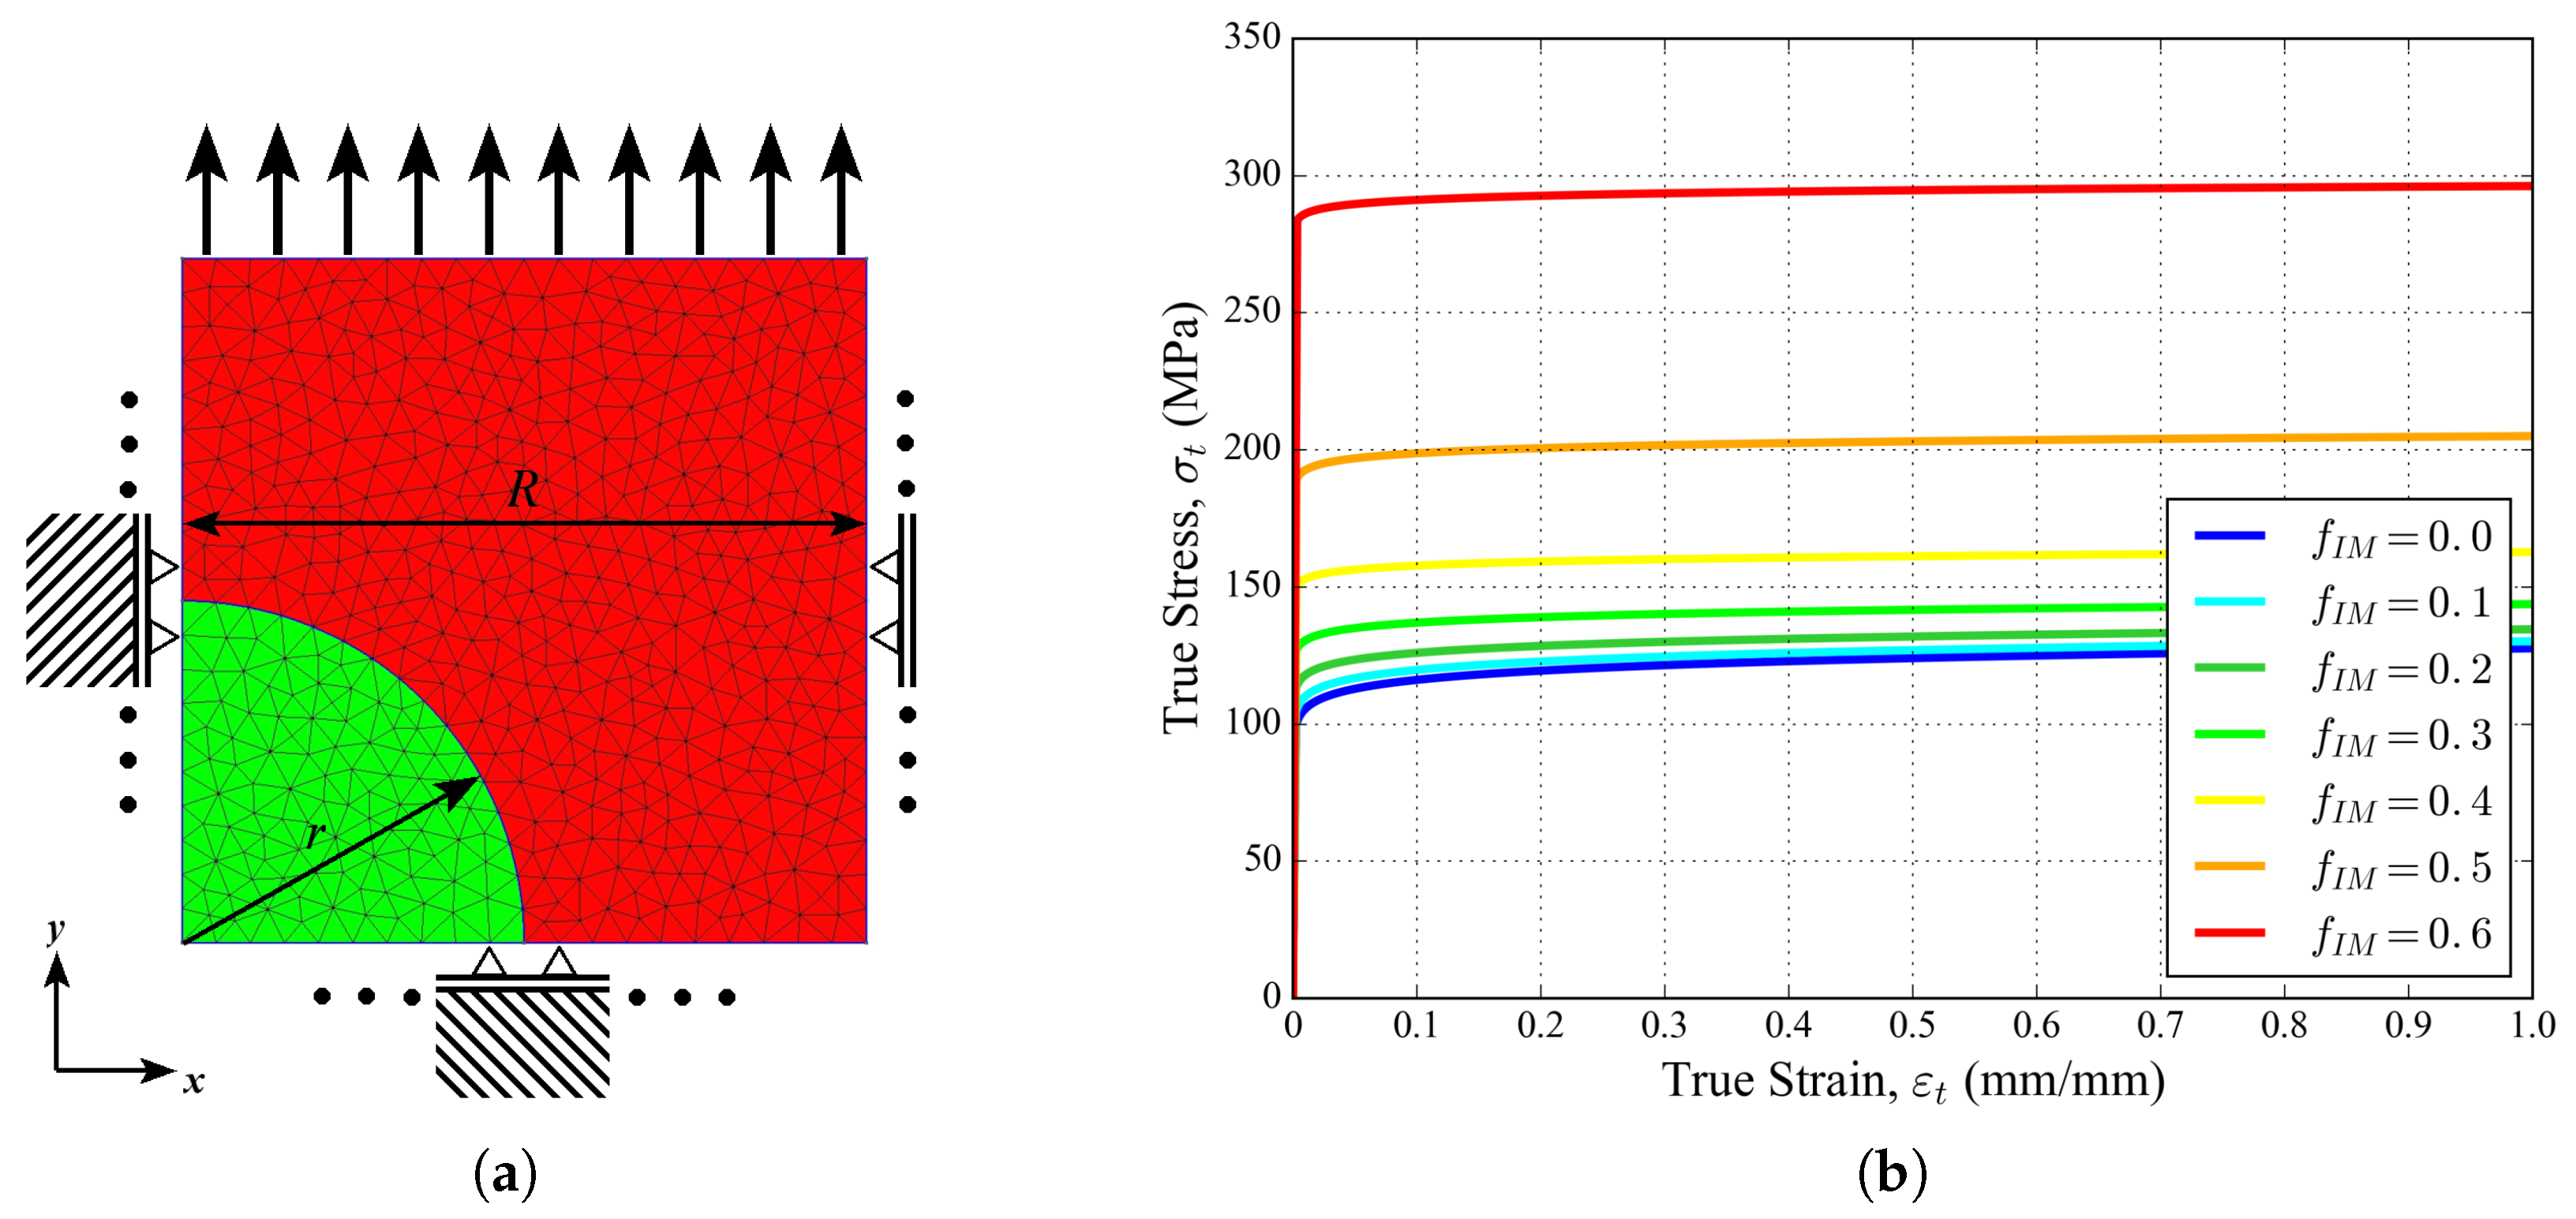
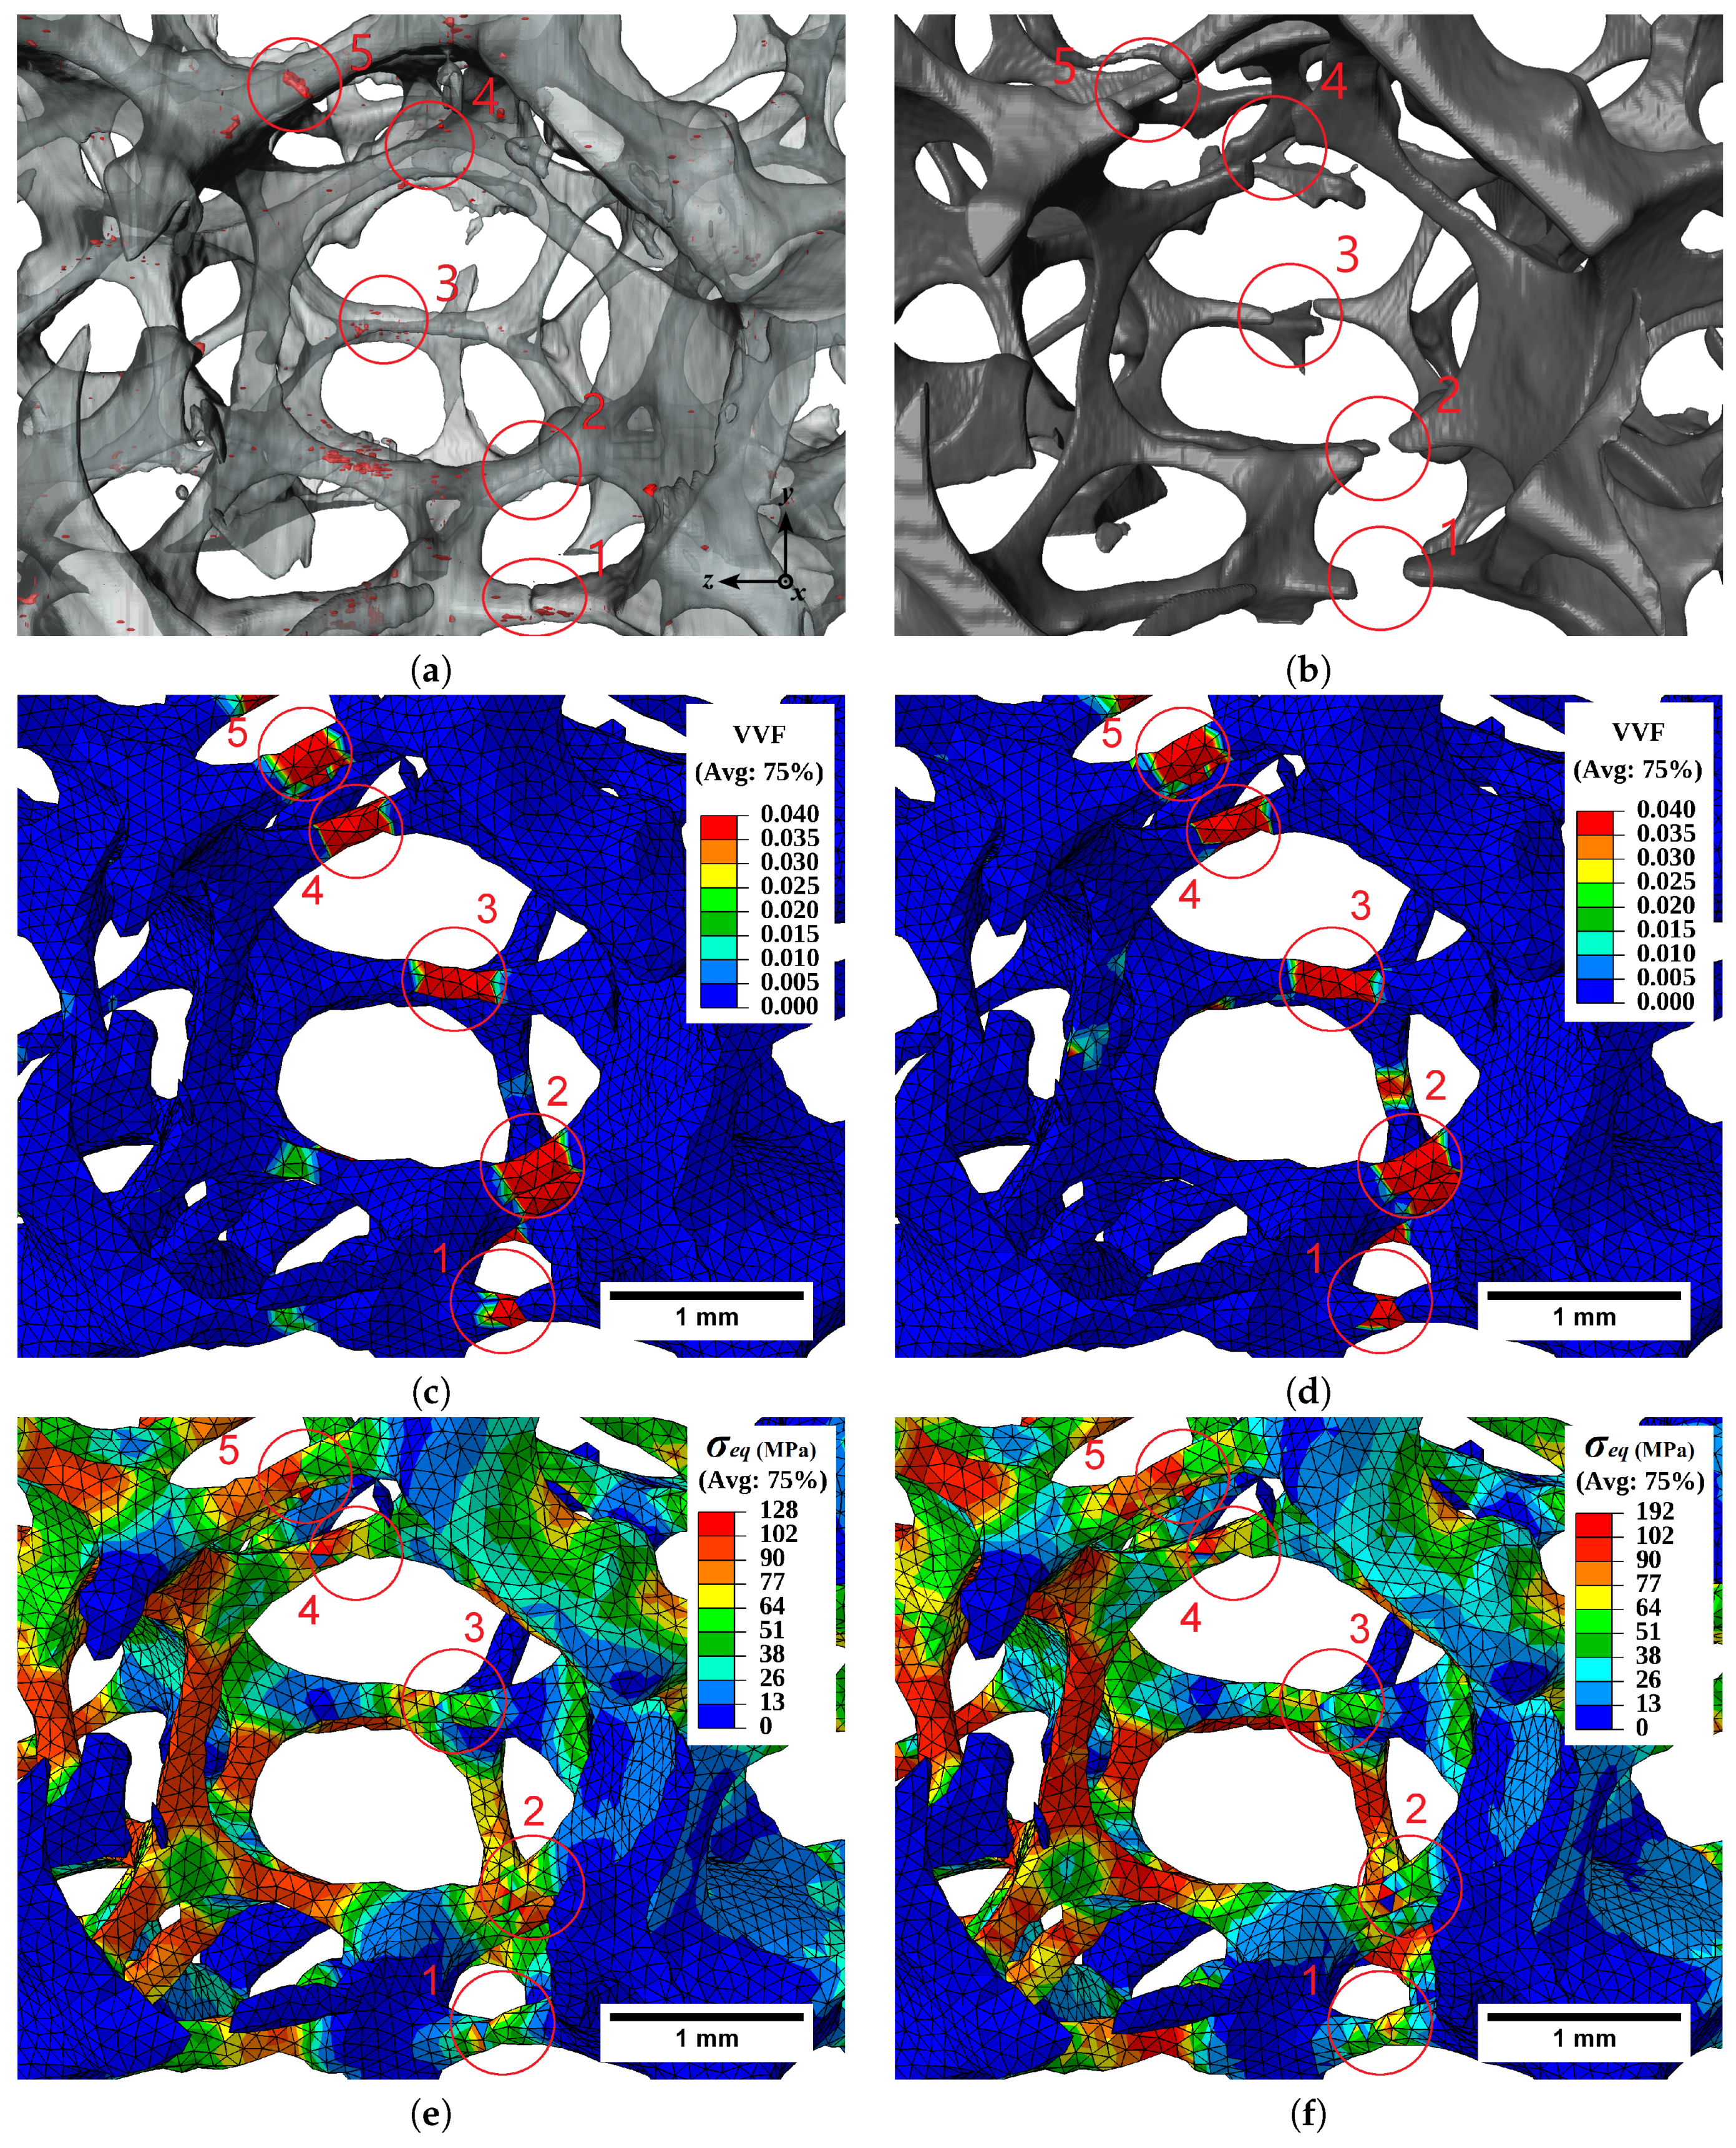
- Image-based FE simulation of the tests was performed using a microstructure-informed porous plasticity (Gurson–Tvergaard–Needleman, GTN) model, quantitatively taking the local presence of brittle intermetallic particles into account (the so-called heterogeneous GTN model).
- The heterogeneous model performed well in the discrimination of potential fracture zones, but did not perform better than the corresponding homogeneous (or microstructure “blind”) model in the prediction of global stress–strain curves.
- The procedure can be easily utilized for the investigation of other types of architectured materials where both the macroscopic architecture and local microstructural details are expected to be required in order to understand and predict the material behavior.
Author Contributions
Funding
Acknowledgments
Conflicts of Interest
Abbreviations
| FE | Finite Element |
| GTN | Gurson–Tvergaard–Needleman |
| PPI | Pores Per Inch |
| VVF | Void Volume Fraction |
References
- Gibson, L.J.; Ashby, M.F. Cellular Solids: Structure and Properties, 2nd ed., 1st pbk. ed. with corr ed.; Cambridge Solid State Science Series; Cambridge University Press: Cambridge, UK, 1999. [Google Scholar]
- Ashby, M.F. Metal Foams: A Design Guide; Butterworth-Heinemann: Boston, MA, USA, 2000. [Google Scholar]
- Scheffler, M.; Colombo, P. Cellular Ceramics: Structure, Manufacturing, Properties and Applications; John Wiley: Hoboken, NJ, USA, 2005. [Google Scholar]
- Harte, A. The fatigue strength of sandwich beams with an aluminium alloy foam core. Int. J. Fatigue 2001, 23, 499–507. [Google Scholar] [CrossRef]
- Ashby, M.F. The properties of foams and lattices. Phil. Trans. R. Soc. 2006, 364, 15–30. [Google Scholar] [CrossRef] [PubMed]
- Gibson, L.J.; Ashby, M.F.; Zhang, J.; Triantafillou, T.C. Failure surfaces for cellular materials under multiaxial loads—I. Modelling. Int. J. Mech. Sci. 1989, 31, 635–663. [Google Scholar] [CrossRef]
- Andrews, E.; Sanders, W.; Gibson, L.J. Compressive and tensile behaviour of aluminum foams. Mater. Sci. Eng. A 1999, 270, 113–124. [Google Scholar] [CrossRef]
- Maire, E.; Withers, P.J. Quantitative X-ray tomography. Int. Mater. Rev. 2014, 59, 1–43. [Google Scholar] [CrossRef]
- Bart-Smith, H.; Bastawros, A.F.; Mumm, D.; Evans, A.; Sypeck, D.; Wadley, H. Compressive deformation and yielding mechanisms in cellular Al alloys determined using X-ray tomography and surface strain mapping. Acta Mater. 1998, 46, 3583–3592. [Google Scholar] [CrossRef]
- Caty, O.; Ibarroule, P.; Herbreteau, M.; Rebillat, F.; Maire, E.; Vignoles, G.L. Application of X-ray computed micro-tomography to the study of damage and oxidation kinetics of thermostructural composites. Nucl. Instrum. Methods Phys. Res. Sect. B 2014, 324, 113–117. [Google Scholar] [CrossRef]
- Ulrich, D.; van Rietbergen, B.; Weinans, H.; Rüegsegger, P. Finite element analysis of trabecular bone structure: A comparison of image-based meshing techniques. J. Biomech. 1998, 31, 1187–1192. [Google Scholar] [CrossRef]
- Maire, E. X-ray tomography applied to the characterization of cellular materials. Related finite element modeling problems. Compos. Sci. Technol. 2003, 63, 2431–2443. [Google Scholar] [CrossRef]
- Youssef, S.; Maire, E.; Gaertner, R. Finite element modelling of the actual structure of cellular materials determined by X-ray tomography. Acta Mater. 2005, 53, 719–730. [Google Scholar] [CrossRef]
- Caty, O.; Maire, E.; Youssef, S.; Bouchet, R. Modeling the properties of closed-cell cellular materials from tomography images using finite shell elements. Acta Mater. 2008, 56, 5524–5534. [Google Scholar] [CrossRef]
- Lacroix, D.; Chateau, A.; Ginebra, M.P.; Planell, J.A. Micro-finite element models of bone tissue-engineering scaffolds. Biomaterials 2006, 27, 5326–5334. [Google Scholar] [CrossRef] [PubMed]
- Jeon, I.; Asahina, T.; Kang, K.J.; Im, S.; Lu, T.J. Finite element simulation of the plastic collapse of closed-cell aluminum foams with X-ray computed tomography. Mech. Mater. 2010, 42, 227–236. [Google Scholar] [CrossRef]
- Michailidis, N.; Stergioudi, F.; Omar, H.; Papadopoulos, D.; Tsipas, D.N. Experimental and FEM analysis of the material response of porous metals imposed to mechanical loading. Colloids Surf. A 2011, 382, 124–131. [Google Scholar] [CrossRef]
- D’Angelo, C.; Ortona, A.; Colombo, P. Finite element analysis of reticulated ceramics under compression. Acta Mater. 2012, 60, 6692–6702. [Google Scholar] [CrossRef]
- Zhang, T.; Maire, E.; Adrien, J.; Onck, P.R.; Salvo, L. Local tomography study of the fracture of an ERG metal foam. Adv. Eng. Mater. 2013, 15, 767–772. [Google Scholar] [CrossRef]
- Petit, C.; Maire, E.; Meille, S.; Adrien, J. Two-scale study of the fracture of an aluminum foam by X-ray tomography and finite element modeling. Mater. Des. 2017, 120, 117–127. [Google Scholar] [CrossRef]
- Zhou, J.; Mercer, C.; Soboyejo, W.O. An investigation of the microstructure and strength of open-cell 6101 aluminum foams. Metall. Mater. Trans. A 2002, 33, 1413–1427. [Google Scholar] [CrossRef]
- Herman, G.T. Fundamentals of Computerized Tomography: Image Reconstruction from Projections; Springer Science & Business Media: Berlin, Germany, 2009. [Google Scholar]
- Buffiere, J.Y.; Maire, E.; Adrien, J.; Masse, J.P.; Boller, E. In situ experiments with X-ray tomography: An attractive tool for experimental mechanics. Exp. Mech. 2010, 50, 289–305. [Google Scholar] [CrossRef]
- Stock, S.R. MicroComputed Tomography: Methodology and Applications; CRC Press: Boca Raton, FL, USA, 2009. [Google Scholar]
- Amsterdam, E.; Onck, P.R.; Hosson, J.T.M.D. Fracture and microstructure of open cell aluminum foam. J. Mater. Sci. 2005, 40, 5813–5819. [Google Scholar] [CrossRef]
- Schindelin, J.; Arganda-Carreras, I.; Frise, E.; Kaynig, V.; Longair, M.; Pietzsch, T.; Preibisch, S.; Rueden, C.; Saalfeld, S.; Schmid, B.; et al. Fiji: An open-source platform for biological-image analysis. Nat. Methods 2012, 9, 676–682. [Google Scholar] [CrossRef] [PubMed]
- Amani, Y.; Takahashi, A.; Chantrenne, P.; Maruyama, S.; Dancette, S.; Maire, E. Thermal conductivity of highly porous metal foams: Experimental and image based finite element analysis. Int. J. Heat Mass Transf. 2018, 122, 1–10. [Google Scholar] [CrossRef]
- Nieh, T.G.; Higashi, K.; Wadsworth, J. Effect of cell morphology on the compressive properties of open-cell aluminum foams. Mater. Sci. Eng. A 2000, 283, 105–110. [Google Scholar] [CrossRef]
- Andrews, E.W.; Gioux, G.; Onck, P.; Gibson, L.J. Size effects in ductile cellular solids. Part II: Experimental results. Int. J. Mech. Sci. 2001, 43, 701–713. [Google Scholar] [CrossRef]
- Sadowski, T.; Samborski, S. Modeling of Porous Ceramics Response to Compressive Loading. J. Am. Ceram. Soc. 2003, 86, 2218–2221. [Google Scholar] [CrossRef]
- Ferre, A.; Dancette, S.; Maire, E. Damage characterisation in aluminium matrix composites reinforced with amorphous metal inclusions. Mater. Sci. Technol. 2015, 31, 579–586. [Google Scholar] [CrossRef]
- Martin, C.F.; Josserond, C.; Salvo, L.; Blandin, J.J.; Cloetens, P.; Boller, E. Characterisation by X-ray micro-tomography of cavity coalescence during superplastic deformation. Scr. Mater. 2000, 42, 375–381. [Google Scholar] [CrossRef]
- Gurson, A.L. Continuum theory of ductile rupture by void nucleation and growth: Part I—Yield criteria and flow rules for porous ductile media. J. Eng. Mater. Technol. 1977, 99, 2. [Google Scholar] [CrossRef]
- Chu, C.C.; Needleman, A. Void nucleation effects in biaxially stretched sheets. J. Eng. Mater. Technol. 1980, 102, 249. [Google Scholar] [CrossRef]
- Tvergaard, V. Influence of voids on shear band instabilities under plane strain conditions. Int. J. Fract. 1981, 17, 389–407. [Google Scholar] [CrossRef]
- Tvergaard, V. On localization in ductile materials containing spherical voids. Int. J. Fract. 1982, 18, 237–252. [Google Scholar]
- Tvergaard, V.; Needleman, A. Analysis of the cup-cone fracture in a round tensile bar. Acta Metall. 1984, 32, 157–169. [Google Scholar] [CrossRef]
- Abaqus Version 6.13 Documentation Collection; Dassault Systèmes: Vélizy-Villacoublay, France, 2013.
- Avizo® 9 User’s Guide; ThermoFisher Scientific: Waltham, MA, USA, 2016.
- Amani, Y.; Dancette, S.; Delroisse, P.; Simar, A.; Maire, E. Compression behavior of lattice structures produced by selective laser melting: X-ray tomography based experimental and finite element approaches. Acta Mater. 2018, 159, 395–407. [Google Scholar] [CrossRef]
- Zhou, J.; Allameh, S.; Soboyejo, W.O. Microscale testing of the strut in open cell aluminum foams. J. Mater. Sci. 2005, 40, 429–439. [Google Scholar] [CrossRef]
- Jung, A.; Wocker, M.; Chen, Z.; Seibert, H. Microtensile testing of open-cell metal foams—Experimental setup, micromechanical properties. Mater. Des. 2015, 88, 1021–1030. [Google Scholar] [CrossRef]
- Amani, Y. Modélisation Basée sur Données de Tomographie aux Rayons x de L’endommagement et de la Conductivité Thermique Dans les Matériaux Cellulaires Métalliques. Ph.D. Thesis, INSA Lyon, Université de Lyon, Lyon, France, 2018. [Google Scholar]
- Li, H.; Fu, M.; Lu, J.; Yang, H. Ductile fracture: Experiments and computations. Int. J. Plast. 2011, 27, 147–180. [Google Scholar] [CrossRef]
- Chan, S.H.; Ngan, A. Statistical distribution of forces in stressed 2-D low-density materials with random microstructures. Mech. Mater. 2006, 38, 1199–1212. [Google Scholar] [CrossRef]
- Dancette, S.; Browet, A.; Martin, G.; Willemet, M.; Delannay, L. Automatic processing of an orientation map into a finite element mesh that conforms to grain boundaries. Model. Simul. Mater. Sci. Eng. 2016, 24, 055014. [Google Scholar] [CrossRef]


| Element | Cu | Mg | Mn | Si | Fe | Zn | B |
|---|---|---|---|---|---|---|---|
| Content | 0.03 | 0.19 | 0.01 | 0.27 | 0.12 | 0.01 | 0.03 |
| Cell Size (PPI) | Void | Aluminium | Intermetallic Particles |
|---|---|---|---|
| 20 | 92.67 | 7.31 | 0.02 |
| 30 | 93.07 | 6.89 | 0.04 |
| Cell Size (PPI) | 20 | 30 |
|---|---|---|
| Strut thickness (mm) | 0.16 ± 0.04 | 0.16 ± 0.04 |
| Node thickness (mm) | 0.38 ± 0.10 | 0.36 ± 0.04 |
| Void-cell dimension in x (mm) | 2.60 ± 0.20 | 2.57 ± 0.49 |
| Void-cell dimension in y (mm) | 2.84 ± 0.23 | 2.36 ± 0.49 |
| Void-cell dimension in z (mm) | 3.04 ± 0.55 | 2.47 ± 0.32 |
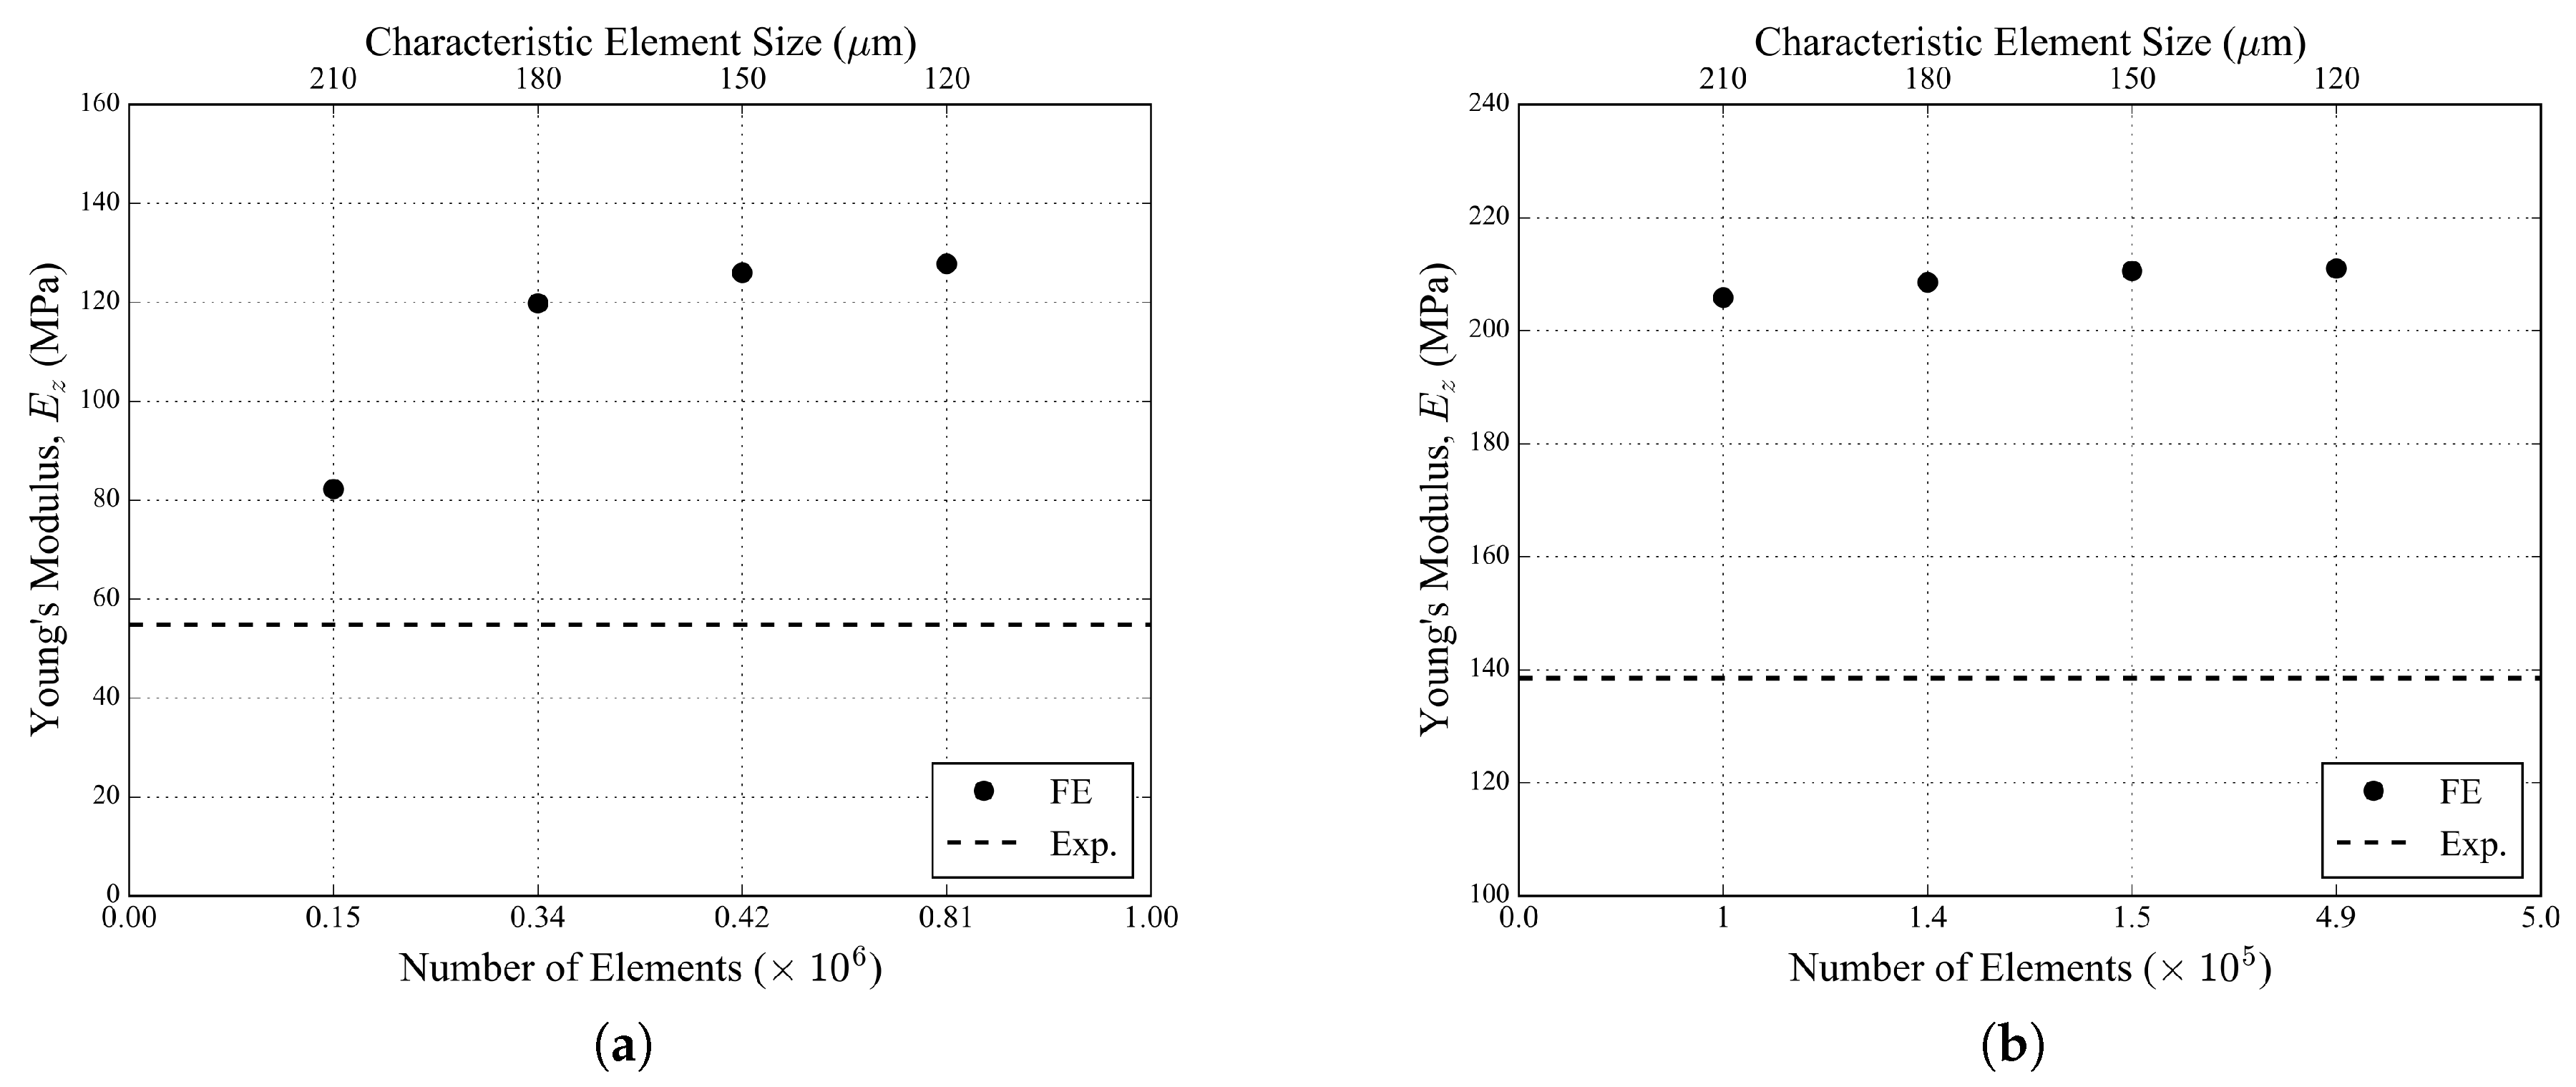
| Cell Size (PPI) | Number of Nodes | Number of Elements | Characteristic Element Size (microns) |
|---|---|---|---|
| 20 | 124,267 | 419,846 | 150 |
| 30 | 50,611 | 146,660 | 150 |
| Intermetallic Fraction | |||
|---|---|---|---|
| 0.0 | 0.18 | 0.06 | 0.04 |
| 0.1 | 0.16 | 0.05 | 0.04 |
| 0.2 | 0.13 | 0.04 | 0.04 |
| 0.3 | 0.10 | 0.03 | 0.04 |
| 0.4 | 0.08 | 0.03 | 0.04 |
| 0.5 | 0.05 | 0.02 | 0.04 |
| 0.6 | 0.03 | 0.01 | 0.04 |
© 2018 by the authors. Licensee MDPI, Basel, Switzerland. This article is an open access article distributed under the terms and conditions of the Creative Commons Attribution (CC BY) license (http://creativecommons.org/licenses/by/4.0/).
Share and Cite
Amani, Y.; Dancette, S.; Maire, E.; Adrien, J.; Lachambre, J. Two-Scale Tomography Based Finite Element Modeling of Plasticity and Damage in Aluminum Foams. Materials 2018, 11, 1984. https://doi.org/10.3390/ma11101984
Amani Y, Dancette S, Maire E, Adrien J, Lachambre J. Two-Scale Tomography Based Finite Element Modeling of Plasticity and Damage in Aluminum Foams. Materials. 2018; 11(10):1984. https://doi.org/10.3390/ma11101984
Chicago/Turabian StyleAmani, Yasin, Sylvain Dancette, Eric Maire, Jérôme Adrien, and Joël Lachambre. 2018. "Two-Scale Tomography Based Finite Element Modeling of Plasticity and Damage in Aluminum Foams" Materials 11, no. 10: 1984. https://doi.org/10.3390/ma11101984
APA StyleAmani, Y., Dancette, S., Maire, E., Adrien, J., & Lachambre, J. (2018). Two-Scale Tomography Based Finite Element Modeling of Plasticity and Damage in Aluminum Foams. Materials, 11(10), 1984. https://doi.org/10.3390/ma11101984