Abstract
Recently, the Korean government has enforced disclosure of building energy performance, so that such information can help owners and prospective buyers to make suitable investment plans. Such a building energy performance policy of the government makes it mandatory for the building owners to obtain engineering audits and thereby evaluate the energy performance levels of their buildings. However, to calculate energy performance levels (i.e., asset rating methodology), a qualified expert needs to have access to at least the full project documentation and/or conduct an on-site inspection of the buildings. Energy performance certification costs a lot of time and money. Moreover, the database of certified buildings is still actually quite small. A need, therefore, is increasing for a simplified and user-friendly energy performance prediction tool for non-specialists. Also, a database which allows building owners and users to compare best practices is required. In this regard, the current study developed a simplified performance prediction model through experimental design, energy simulations and ANOVA (analysis of variance). Furthermore, using the new prediction model, a related mobile application was also developed.
1. Introduction
1.1. Background
Energy performance certification is a key policy instrument, which assists governments in reducing energy consumption in buildings. It provides decision makers of buildings with objective information on a given building, such as level of energy consumption by the building itself or a comparison with similar other buildings [1].
In Korea, a building’s energy performance certification is the metric used to evaluate building performance in green building rating programs, such as the “G-SEED (green standard for energy and environmental design)” and the “BESS (building energy simulation for Seoul)”. A building’s energy performance certification also needs to be disclosed, either in a public database or directly to prospective buyers, lessees and lenders, before the closing of a real estate sale or transaction. This requires building owners and users to pay attention to building energy management [2]. Also, not only specialists in the architecture environment, but also the non-specialists are focusing on energy simulation tools that can be easily understood by non-specialists without prior knowledge of building energy performance [3].
However, to obtain sufficient information to calculate energy performance levels (i.e., asset rating methodology), a qualified expert needs to have access to at least the full project documentation and/or conduct an on-site inspection of the buildings. Energy performance certification costs a lot of time and money. Moreover, the energy performance certification, provided by the Korean government, has only been in place for a decade, which means that the data for those buildings built before the energy performance certification do not exist. Therefore, the database of certified buildings is actually quite small [4].
Such a complicated calculation process and small database of energy performance certification are key barriers to wider adoption of energy efficient measures in the built environment. Additionally, the insufficient building dataset has become an impediment to successfully tracking the progress of energy efficiency. These programs—such as G-SEED and BESS, which depend on a building’s energy performance certification—and tools help empower decision-makers, provide differentiation between buildings, and serve as a basis for rewarding high performance [5]. Data has the power to help in shaping markets, yet in Korea today, as in many countries around the world, high quality aggregated data is a scarce commodity.
The key, therefore, is to have the required data handy when the decision-maker must assess energy performance, and supply the data in an easy-to-understand format. This can be viewed as a conversion from a “data push” to a “data pull” system. In other words, instead of providing a huge amount of general data to the end users through various reports and formats, the users should be able to acquire data only when necessary in some useful formats [6]. Also, the development of a web application can allow for increasing disaggregation of data. One way to enable the “data pull” concept is disaggregation of a large data set, through development of some web applications, to smaller ones tailored for individual uses, for example, disaggregation of a building data down to the personal level so that the individual occupants can see the effect of their decisions on the building’s performance. These personal-level data can be stored in a web-server and shared with the building managers to compare the best practice [7].
The current study has developed an energy performance prediction model as a way to provide more information about building energy performance and to boost the relevant market. The prediction model developed in this study was designed to allow people to evaluate the energy performance with only a handful of basic information and also to minimize the error range with the performance evaluated by the building’s energy performance certification. The model was developed as a mobile application (app) in order to improve accessibility.
1.2. Study Method
The following table shows the methods applied in this study (Figure 1).
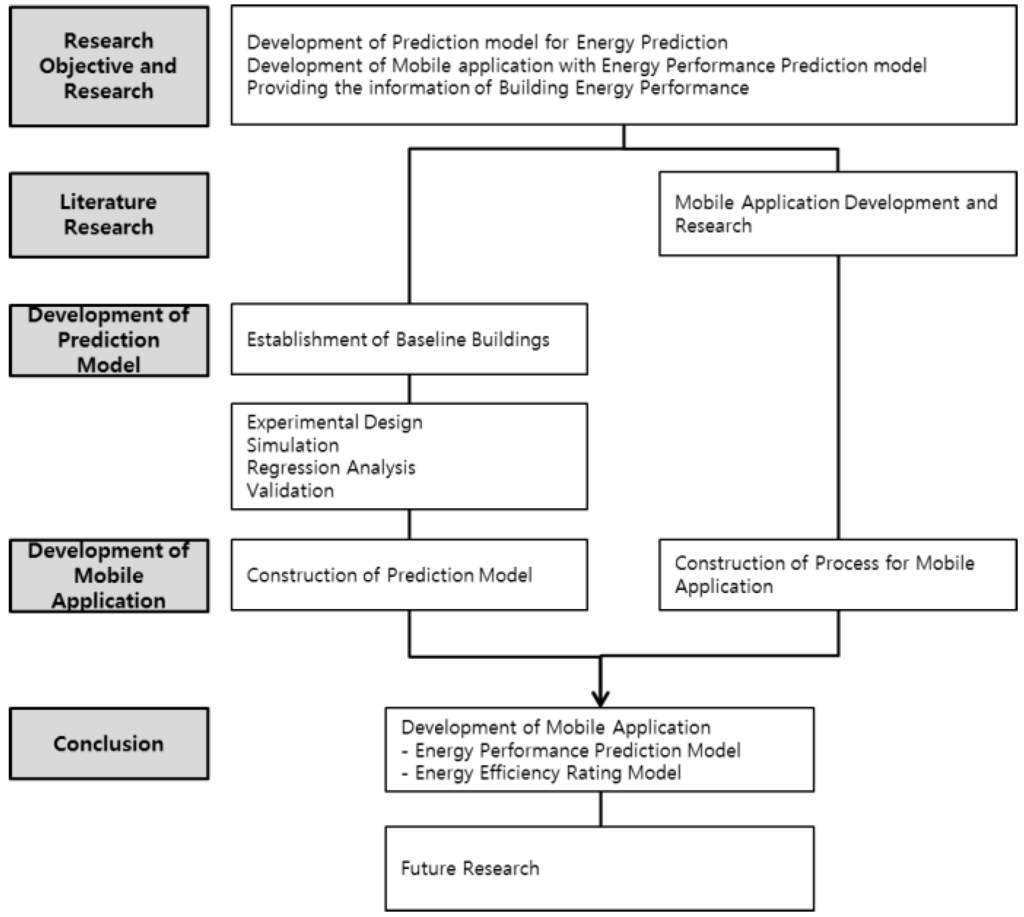
Figure 1.
The research flow chart.
2. Research and Development of Mobile Applications for Building Construction
Recent work that focuses on the fundamental differences between smartphone-based and Internet-based applications and how these might enhance sustainable strategies [8] suggests that U-commerce or Über-commerce can be used as a theoretical framework [9]. Therefore, many apps for smart phones and tablets have become available for business use as these devices are increasingly ubiquitous. Currently, the range of mobile applications is large and rapidly growing. The apps created for use in HVAC (heating, ventilating, and air conditioning), building energy performance and energy efficiency fields are no exception. During the past year, Commissioning associates staff informally field-tested apps for a variety of uses related to building work and found a range of potential applications for these apps. At present, building professionals use apps for “back-of-the-envelope” style calculations either in the field or for quick reference during desk-side analysis, but not for any critical and/or final calculations for their clients. Because of a general lack of transparency in the calculations performed by these apps, professional users do not rely on them for their core analysis work. In spite of this limitation, these apps are handy for quick day-to-day tasks which has increased the interest among professionals in improving the efficiency of these apps for their clients [10].
Also, the characteristics of network ubiquity, universality, uniqueness, and joint development by Ubiquitous-commerce enable the decision support systems running on smartphones to have a large impact on energy conservation on a broad scale. Smartphones have the potential to assist with some aspects of ECM (energy conservation management) use [11]. Unlike traditional ECMs, where professionals process the collected data off-site, data processing in a smartphone app can be done on-site even by common users. For a non-professional to perform the ECM, the user interface should be intuitive, seamless, and easy to use. Additionally, energy calculations through smartphones should be simple and easy so that any user can use it even in the absence of a professional auditor [12]. The ECMs for both solar array and whole building heating analyses that require large computing power could be run using cloud computing on off-site servers, although the basic solar applications have already been developed for the iPhone [13,14]. An app, such as HOT3000, can be used to calculate energy use in a home, estimate retrofit savings, identify certain architectural elements, and simulate heating and cooling conditions [15]. Additionally, with the RETScreen program, one can assess the application of renewable installations, such as solar arrays and small-scale wind power [16].
In Korea, most apps are developed by companies with the aim to promote certain products and enable users to see any change in energy consumption when, for example, a certain lighting system is adjusted. Besides, most of the ongoing studies [17,18,19,20] focus on efficient building maintenance and management. However, these studies fail to address how to use mobile applications for building energy assessments. On the other hand, a versatile, easy to use program designed to run on smartphones, and which can be widely distributed, can increase the effectiveness of government-sponsored energy efficiency programs and respond promptly to changing conditions within the home retrofitting market.
3. Required Conditions of Performance Prediction Model to Easily Make Smarter Day-to-Day Energy Management Decisions
3.1. Simplifying the Input Requirements
The user interface and data required by the prediction model referred to as an energy simulation tool form an important link between the users and the tools. An energy simulation tool that overwhelms users with the amount of input data or knowledge required will not be used. One of the main areas of development is improvements in computing power and graphic capabilities, which have resulted in far more “user-friendly” interfaces than before. However, a survey conducted on users of simulation tools indicated that this area requires further attention [21].
The use of default values and automatic generation of complex building models is an alternative means for simplifying the use of simulation tools. Default values can greatly aid users in obtaining useable values for parameters that are still unknown. However, they do not necessarily reduce the complexity of the input structure. To solve this problem, the number of input parameters must be restricted to a minimum. Several researchers indicated that, by using only a few parameters, it is possible to calculate the energy consumption. However, the accuracies of these applications are restricted due to a limited number of datum in the database [22]. A huge dataset is always a good indicator of a building performance and more critical elements can be selected.
3.2. Critical Input Parameters
There are two elements that need to be considered when establishing the critical input parameters for energy simulation. The first is determining whether the parameter has a significant effect on the energy consumption of the building. The second involves focusing on the parameters that are directly influenced by the architectural design. Identifying the important parameters, however, is not that simple, since they can influence each other.
A study of typical Israeli residential buildings [23] revealed that design parameters can be divided into three categories. The first category consists of parameters with a weak effect on the building energy, and such parameters are thus insensitive to other design parameters. Parameters that have a strong influence, but are not affected by other design parameters, form the second category. The third category consists of parameters that have a strong effect on building performance and are also sensitive to other parameters. Using the above categories as a basis, it is possible to reduce the input requirements for the energy simulation tool. Parameters of the first and second categories, such as the internal loads, ventilation, temperature set points and operating hours, can be modified easily without compromising other design features. They therefore require little attention and can be specified using default values. The third group comprises the critical input parameters for energy simulation.
3.3. Identification of the Key Variables
In order to establish the critical input parameters for the simulation tool, a sensitivity analysis was performed. This consisted of changing the parameters of interest and noting the effects that the changes had on the energy consumption. The average value of the data indicated the typical influence that the parameter had on the energy consumption [24]. The standard deviation of the data from the mean value showed how much the parameter was influenced by other parameters. Critical parameters would generally cause a large change in the energy consumption relative to a small change in the parameters. This relationship is referred to as the contribution rate. With the exception of the construction material, the contribution rate of the analyzed parameters was calculated as percentage change in the energy consumption divided by the percentage change in the parameter.
4. Development of the Energy Performance Prediction Model
Energy performance can be mainly divided into heating and cooling energy consumption and energy consumption by hot water/lighting/electricity devices. Heating and cooling load varies depending on building design characteristics such as building shape, orientation, envelope, etc., but energy consumption of hot water/lighting/electricity devices does not experience much change depending on building design. Therefore, a multiple regression equation was developed to calculate cooling and heating load, and the calculation of energy consumption by hot water/lighting/electricity was made based on the statistical values of existing buildings. Operation characteristics such as occupancy schedule, number of users, etc. should be reflected in energy consumption. However, input values of energy calculation become too complicated. Therefore, in this prediction model, SBOC (standard building operation conditions) [25] in Korea of each building use (multi-residential, office, school) are used. The prediction model was set to residents, offices, and schools which occupy 35.4%, 16.9% and 5.5% of Korean buildings [26], respectively.
4.1. Development of Building Load Prediction Formula
The study involved multiple-regressive analysis to understand how each design factor and its application affect the building energy load and evaluate the application of the factors. The multiple-regressive analysis is a method to understand the relationship between more than two independent and dependent variables using mathematical functions and is used to forecast changes of the dependent variables against the independent ones [27]. The present study designated final energy use as the dependent variable and the applied elements as the independent variables. Furthermore, experimental methods were employed using the orthogonal table for proper operation of the study and reducing simulations. The orthogonal table can systematically form combinations among variables without redundant experiment through variable-level array with rules and may induce the same results as the simulation by performing some experiments [28]. For development of building load prediction formula, a statistical approach was taken through experimental design, energy simulations and analysis of variance (ANOVA), thereby setting the range for the level of each design variable and establishing a building load prediction formula as in Figure 2.
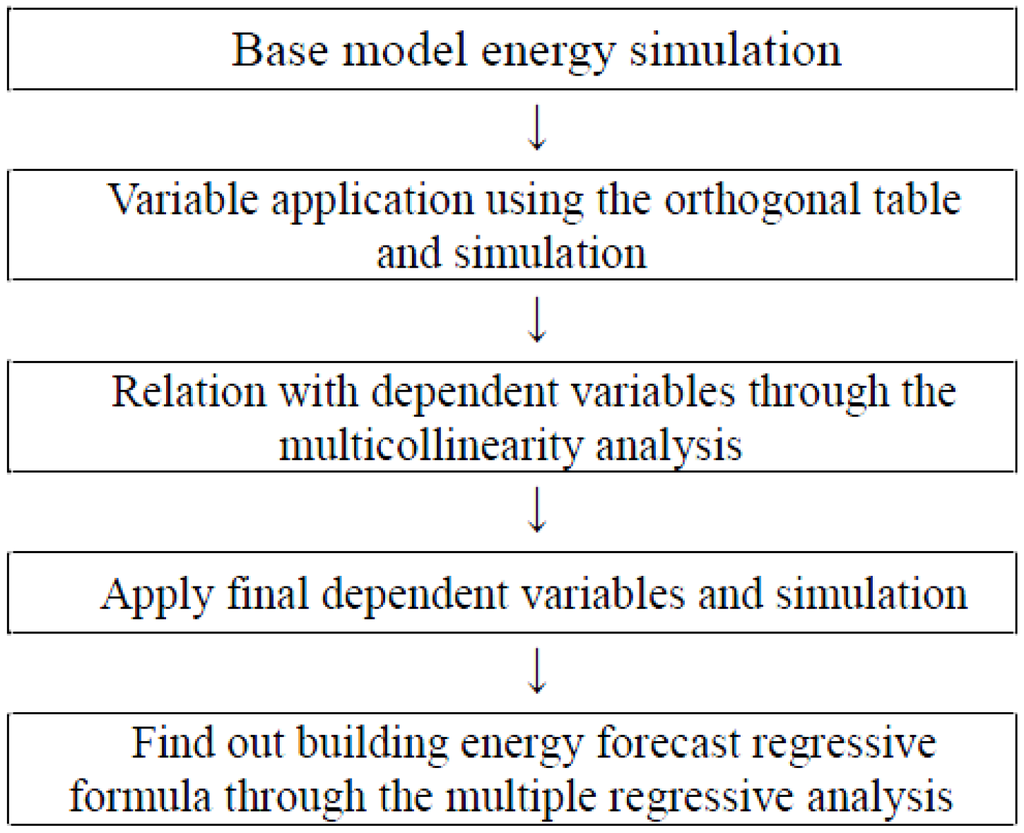
Figure 2.
Statistical approach process.
4.1.1. Baseline Model
The baseline building forms a very important part of the analysis because all of the subsequent calculations and analyses are based on a comparison with it. A baseline building has been established from a survey of 123 multi-residential buildings/70 offices/56 schools in Seoul [29]. The characteristics of the baseline building were determined by careful examination of a typical design (Table 1).

Table 1.
Brief description of baseline model. HVAC: heating, ventilating, and air conditioning; TMY2: typical meteorological year version 2.
The simulations for the cooling and heating energy consumption calculations were undertaken using the EnergyPlus program. Seoul weather data, obtained from KMA (Korea meteorological administration), was converted to TMY2 (typical meteorological year version 2) format, which is one of the Energy Plus weather data types. There are three distinct climatic zones in Korea, with the analysis being carried out for Seoul, the representative location for the “central climatic zone”.
4.1.2. Applicable Ranges of Each Parameter
Several parameters which are related with energy consumption were narrowed down to 10 (residential), 24 (office) and 18 (school) based on previous energy performance research. Also, the practically applicable ranges of each design in the building have been set. These ranges are based on the investigated data, which encompass the performances from the minimum level regulated by the building code to commercialized cutting edge technologies. The ranges of each parameter can be found in Table 2.
Table 2.
Performance levels of the parameters for orthogonal arrays.
4.1.3. Statistical Approach
The technique of arranging the experimental conditions consisting of multiple factors was first proposed [30] and is known as the “factorial design of experiments”. In a full factorial design, all possible combinations are evaluated for a given set of factors. For industries, experiments usually involve a large number of factors. Therefore, a full factorial design generates a large number of experiments. To reduce the number of such experiments to make them practically feasible, only a small set is chosen. This method of selecting a small number of experiments to acquire most of the information is known as a partial fraction experiment [31].
The partial fraction method uses a special set of arrays called orthogonal arrays. Using these orthogonal arrays, only a small number of experiments can be done to pull out full information of all the factors that affect the performance parameter. In an orthogonal array experiment, the independent variables’ columns are “orthogonal” to each another. If the experiment has four variables at three different levels. A full factorial experiment would require L81(340) = 81 experiments. We conducted a Taguchi experiment with a L9(327) orthogonal array (nine tests, four variables, three levels). The interaction and dummy variable columns were not considered for the experiment. The current study selected up to L81(340) (81 tests, 40 variables, three levels) to apply selected variables. The application level consisted of three levels for application to the orthogonal table.
Contribution rates and impact on each level can be calculated for design elements through final results from the regressive analysis and this may help configure element levels and select design concepts. Contribution rate from each design concept for energy loads, T, is percentage changes in a design variable that affect the changes in the total energy load. A large contribution rates signifies a more important energy load in the building. The formulas calculating contributions for each design variable are as follows. In addition, impacts of each level were evaluated to select the application of the design variables and the level which can save energy load was also determined.
The impact may be calculated as follows:
where PAi,Bi: contribution of each parameter on i level; Yi: energy consumption at each experiment; Tm: total average of energy consumption of 81 experiments.
4.1.4. Results
The factors have different impacts on cooling, heating and lighting energy. From the multi-regression analysis, a mathematical model was developed that can illustrate the relationship between the parameters and energy consumption. In the results from the multi-residential building model, the cooling energy consumption (R2 = 0.930) prediction was relatively more accurate than the heating energy consumption (R2 = 0.965) prediction. The model results of office buildings indicate that the model is significant. The R-value of heating and cooling consumptions was R2 = 0.780 and R2 = 0.666. Similar to the above ones, the model from the schools’ results indicated that the model is significant (Table 3).
Table 3.
Multi-regression analysis results.
4.2. Heating, Ventilating, Air Conditioning and Refrigerating System Energy Demand
A HVAC & R (heating, ventilating, air-conditioning, and refrigerating) system is a complex, nonlinear, discrete system containing numerous variables and constraints. The HVAC & R system is composed of an air-conditioning system, a plant system and a transport system. Similar to the three-axis coordinates, the HVAC & R system can be considered as a unified system, which is actually the combinations of each subsystem.
The HVAC & R system matrix combination comprised 16 air-conditioning, 15 plant, and four transport subsystem combinations for buildings. This gave rise to a total of 960 combinations of each component subsystem (16 air-conditioning × 15 plant × 4 transport systems), as shown in Figure 3. Among these, the combination identifies an open database of 33 basic HVAC & R [32] used in this study. The list of 33 basic HAVC & R in the database is shown in Figure 3.
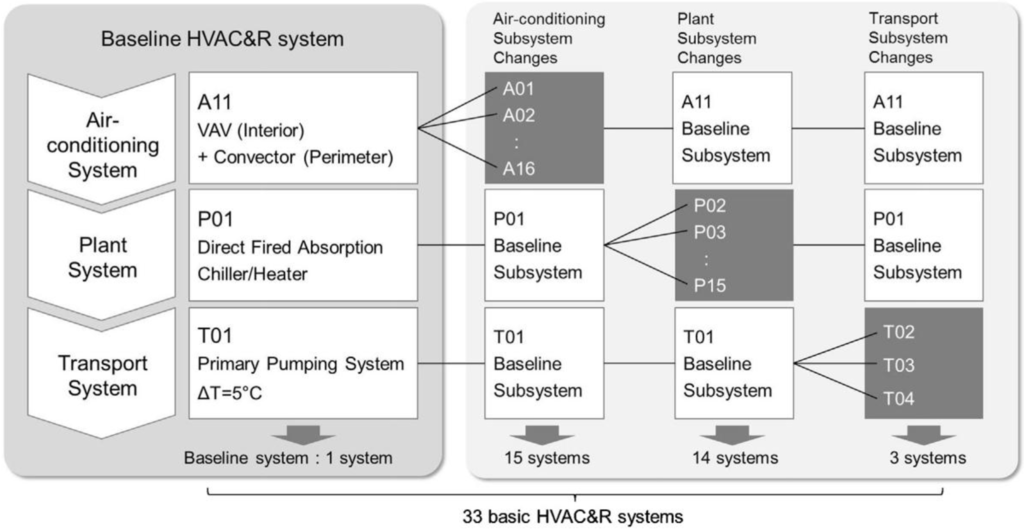
Figure 3.
A Method for evaluating energy consumption of basic HVAC & R (heating, ventilating, air-conditioning, and refrigerating) set.
4.3. Hotwater, Lighting, and Electricity Demand
For calculating the energy consumption for hot water, lighting and electricity, survey data of 56 multi-residential buildings, 40 office buildings and 10 school buildings were used with respect to energy consumption [33]. By correlation analysis of the database of energy and water consumption, a multi-regression equation for each building use was developed. For water usage, hot water usage was analyzed separately due to it having seasonal variations (Table 4).
Table 4.
Multi-regression equation for reference building performance calculation(x: Area (m2))
5. Development of Mobile Application
5.1. Mobile Application Process and Configuration
The mobile application created in the current study provides the building energy performance instantly based on the building information obtained through drawings by general users. This application can take the form of a smart phone application. The energy demand can be predicted by the energy performance prediction equation, which is used by the mobile application, followed by a stage that evaluates the energy demand. Figure 4 illustrates the application concept, with the development process. The user collects basic building and design information and enters the value for each item. The prediction equation is next inputted by the server and the cooling/heating energy demand is evaluated.
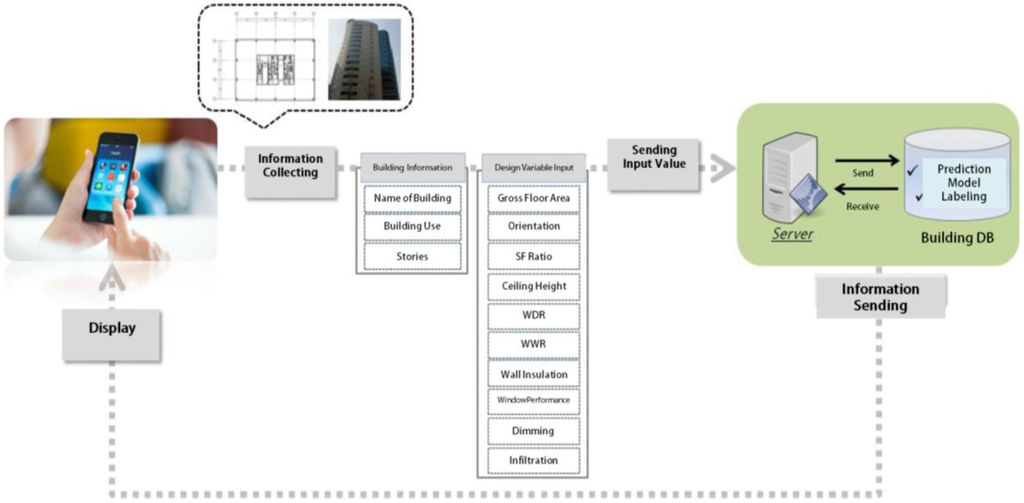
Figure 4.
Concept Diagram of Mobile Application.
The predicted energy demand means the sum of the cooling/heating and hot water/lighting/electricity energy demand per unit area. The mobile application is currently under verification for its feasibility and has not officially been launched in the market.
5.2. Mobile Application Process for the Sample Building
The mobile application developed in this study has five stages as shown by Figure 5: entering the basic building information, establishing prediction model, entering the design information, prediction of energy demand by calling the prediction model and displaying the building energy performance information.
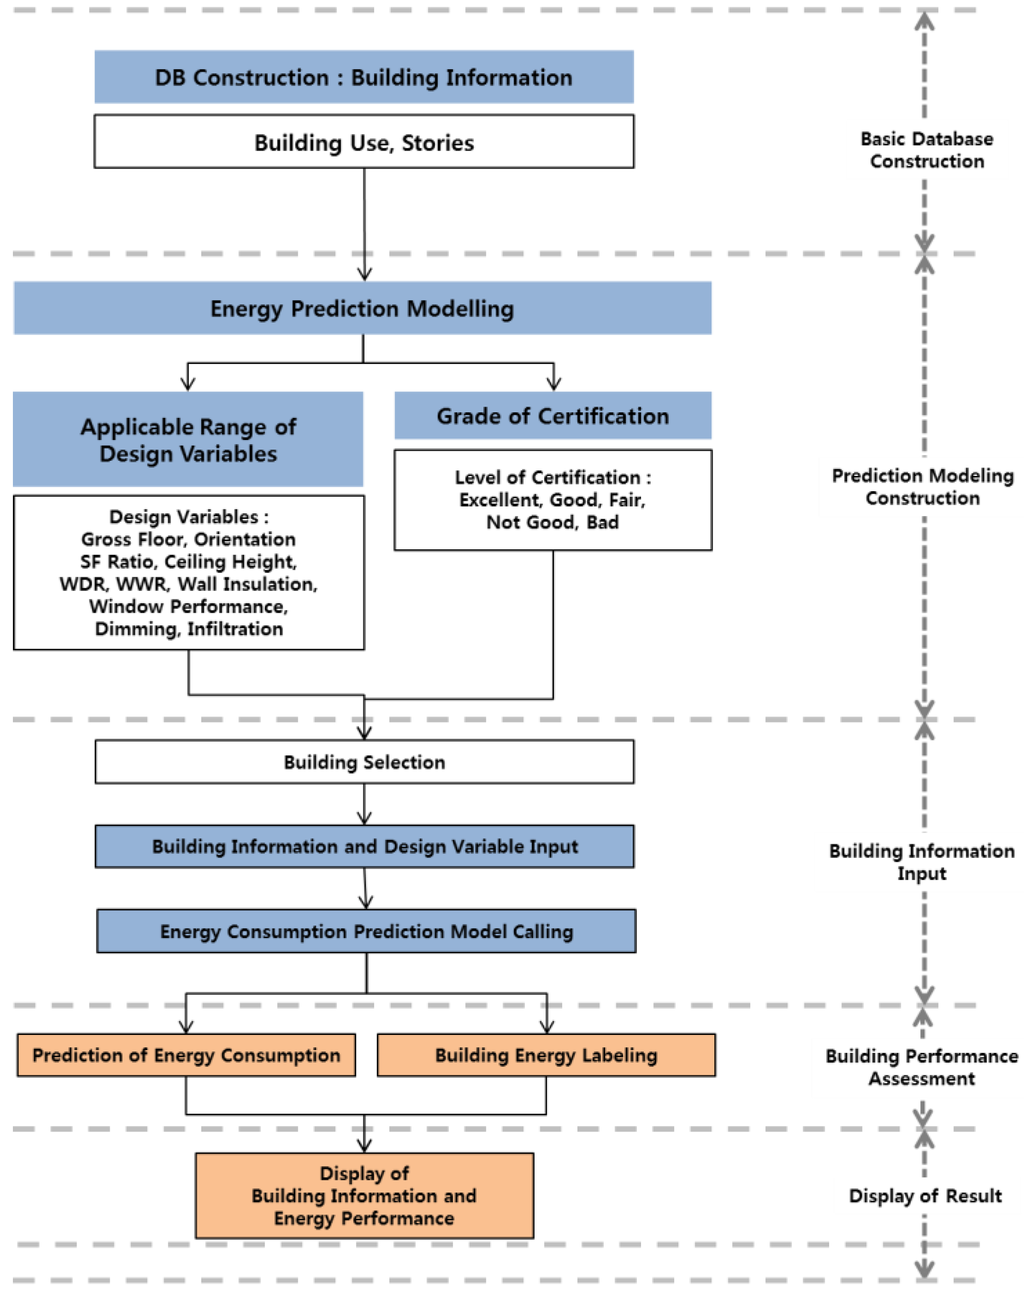
Figure 5.
Development process of mobile application.
5.3. Prediction of the Building Energy Performance with the Mobile Application
The mobile application will show the initial display image of the building energy performance prediction applications, and clicking the arrow will show the basic building information input image. Figure 6 shows the display containing the building overview information. In this study, the above-mentioned information from the sample building was entered. After saving the data, the user can move to the energy performance prediction stage to predict the building energy demand.
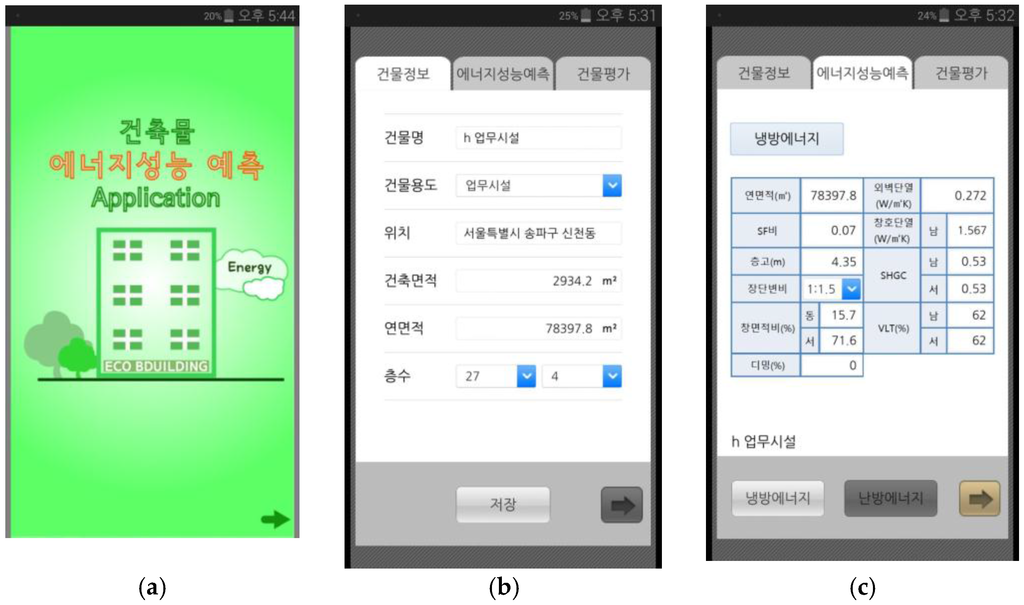
Figure 6.
(a) Intro; (b) basic; and (c) information.
5.4. Building Energy Performance Evaluation with the Mobile Application
The present study provided the cooling/heating energy demand immediately after entering the design information of the sample building in the mobile application. The evaluation was performed with five grades depending on the energy demand from the evaluation mode. Using this model, the user can check the entire building’s energy performance easily (Figure 7).
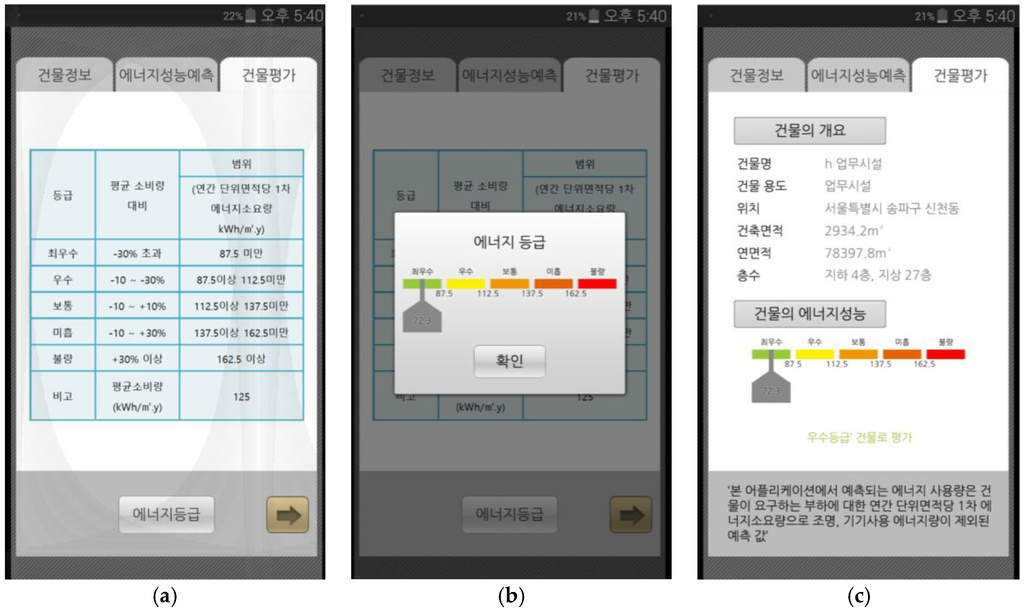
Figure 7.
(a) Energy total; (b) energy performance level; and (c) final result.
6. Conclusions
More regular and accurate data can improve building benchmarking. Relevant data can drive better energy performance prediction model-based management decisions if the right tools can be developed and users can access the right data at the right time. Furthermore, if the data are simple, easily accessible and user-specific, building owners and managers, who are reluctant toward energy management, can even be inspired. The minimized evaluation method and procedure enables users to select the architectural design elements and appropriate mechanical system with ease, as well as assess the SBOC to determine the operational characteristics of building, which is often difficult. Also, the calculated give a determination of the energy efficiency level and can then be saved in the web-server, so it is helpful for building the database and for easy comparison with the energy consumption of other buildings. If the easy and fast energy consumption data is provided to users, it will increase interest in energy management and contribute to effective energy use in the building. In this study, a review procedure is required. If each individual’s evaluation results are collected in the server, it will provide a contribution to the database. However, the reliability of the database may be decreased.
Acknowledgments
This research was supported by the Basic Science Research Program through the National Research Foundation of Korea (NRF) funded by the Ministry of Science, ICT & Future Planning (NRF-2013R1A1A3013119).
Author Contributions
Yuri Kim and Haejin Kang conceived and designed the experiments; Haejin Kang performed the experiments; Haejin Kang analyzed the data; Yuri Kim contributed to consist mobile app tools.
Conflicts of Interest
The authors declare no conflict of interest.
References
- International Energy Agency Energy Performance Certification of Buildings—A Policy Tool to Improve Energy Efficiency; OECD/IEA: Paris, France, 2010.
- Improving the Energy Efficiency of Our Buildings; Department for Communities and Local Government: London, UK, 2014.
- David, H. How much information disclosure of building energy performance is necessary? Energy Policy 2014, 1, 263–272. [Google Scholar]
- Shailendra, M.; Lorcan, L.; François, C.; Ronan, L.; Doreen, F. Energy Performance Certificates in Buildings and Their Impact on Transaction Prices and Rents in Selected EU Countries; European Commission (DG Energy 19): Brussels, Belgium, 2013. [Google Scholar]
- Nikhil, N.; Harvey, M. A New Model for Disclosing the Energy Performance of Residential Buildings; MIT Energy Efficiency Strategy Project: Cambridge, MA, USA, 2012. [Google Scholar]
- Andrew, B.; Cliff, M.; Nick, Z. The Future of Building Energy Rating and Disclosure What Europe Can Learn from the United States. Institute for Market Transformation, 2010. Available online: http://www.imt.org/uploads/resources/files/7.5IEECBPaper33.pdf (accessed on 5 July 2015).
- Asdrubali, F. Daylighting performance of sawtooth roofs of industrial buildings. Light. Res. Technol. 2003, 35, 343–359. [Google Scholar] [CrossRef]
- Pitt, L.F.; Parent, M.; Junglas, I.; Chan, A.; Spyropoulou, S. Integrating the smartphone into a sound environmental information systems strategy: Principles, practices and a research agenda. J. Strateg. Inf. Syst. 2011, 20, 27–37. [Google Scholar] [CrossRef]
- Watson, R.T.; Pitt, L.F.; Berthon, P.; Zinkhan, G.M. U-commerce: Expanding the universe of marketing. J. Acad. Mark. Sci. 2002, 30, 333–347. [Google Scholar] [CrossRef]
- Building Energy Resilience, Institute for Market Transformation, 2010. Available online: http://buildingenergy.cx-associates.com/2012/10/top-apps-for-hvac-and-energy-analysis/5IEECBPaper33.pdf (accessed on 5 July 2015).
- Patrick, L.; Joshua, M.P.; Rob, H.; Sylvie, D. The application of smartphone technology to economic and environmental analysis of building energy conservation strategies. Int. J. Sustain. Energy 2012, 31, 295–311. [Google Scholar]
- Corbett, J.; Webster, J.; Sayili, K.; Zelenika, I.; Pearce, J. Developing and Justifying Energy Conservation Measures: Green IT under Construction. In Proceedings of the 16th Americas Conference on Information Systems, Peru Atlanta, GA, USA, 12–15 August 2010; pp. 12–15.
- N J Solar, Solar PV. Available online http://greenpowerdevelopers.com (accessed on 16 June 2015).
- Solar Tools, Solar Tools for the iPhone. Available online: http://www.solartoolsapp.com/ (accessed on 16 June 2015).
- NRC, 2010. RETScreen International. Office of Energy Efficiency. Available online: http://www.retscreen.net/ang/home.php (accessed on 20 April 2015).
- Donn, M.R. A survey of users of thermal simulation programs. In Proceedings of the Fifth International IBPSA Conference, Prague, Czech Republic, 8–10 September 1997; Volume 3, pp. 65–72.
- Young, D.J. Facility Maintenance Management System Using a Mobile Application. J. Korea Inst. Electron. Commun. Sci. 2012, 7, 1145–1151. [Google Scholar]
- Park, B.R. Development of Resident-Based Energy Evaluation Model (REEM) for Implementation of Mobile Applications. J. Archit. Inst. Korea Plan. Des. 2013, 29, 251–261. [Google Scholar]
- Lee, B.Y. A Study on Building Energy Saving Strategies Using Mobile Application. Master’s Thesis, Chung Ang Univeristy, Seoul, Korea, 2014. [Google Scholar]
- Kang, D.M.; Kim, T.J.; Lee, C.K.; Park, T.K. Mobile application development of facility condition evaluation for maintenance efficiency. In Proceedings of architectural institute of Korea, Cheonan, Korea, 25 October 2013; Volume 33, pp. 717–718.
- Wittchen, K.B.; Jensen, S.I.; Thomsen, K.E. Automatic generation of complex simulation models of buildings with solar heating systems. In Proceedings of the Fourth International IBPSA Conference, Madison, WI, USA, 14–16 August 1995; pp. 403–409.
- Kosonen, R.; Shemeikka, J. The use of a simple simulation tool for energy analyses. Building Simulation 97. In Proceedings of the Fifth International IBPSA Conference, Prague, Czech Republic, 8–10 September 1997; Volume 2, pp. 369–376.
- Shaviv, E.; Peleg, U.J. An integrated KB-CAAD system for the design of solar and low energy buildings. In Proceedings of the CAAD Futures ’91, Zurich, Switzerland, 7–10 July 1991; pp. 465–484.
- Ellis, M.W.; Mathews, E.H. A new simplified thermal design tool for architects. Build. Environ. 2001, 36, 1009–1021. [Google Scholar] [CrossRef]
- Ho-Tae, S. A Study on the Development of Load Prediction Equation and Design Guidelines for the Energy Conservation of Office Buildings. Ph. D. Thesis, Seoul National University, Seoul, Korea, 1997. [Google Scholar]
- Kim, Y.R. A Development of a Mobile Application for Building Energy Prediction Using Performance Prediction Model. Master Thesis’s, Chung Ang Univeristy, Seoul, Korea, 2014. [Google Scholar]
- Yeom, B.J. Principles for constructing Taguchi Experimental Designs. Korean J. Appl. Stat. 1991, 4, 47–63. [Google Scholar]
- Hwan, J.J. A Study on the Development of Expert System for Selecting and Modifying Orthogonal Array in Taguchi Method. Korea Intell. Inf. Syst. Soc. 1997, 1, 350–361. [Google Scholar]
- Office of Energy Efficiency Natural Resource Canada. Survey of Commercial and institutional Energy Use—Building 2009; Detailed Statistical Report; Energy Publications Office of Energy Efficiency Natural Resources Canada: Ottawa, Canada, December 2012. [Google Scholar]
- Yates, F. Sir Ronald Fisher and the Design of Experiments. Biometrics 1964, 20, 307–321. [Google Scholar] [CrossRef]
- Andreas, K.; Balaji, K.; Sekhar, K.; Tham, K.W. A literature survey on measuring energy usage for miscellaneous electric loads in offices and commercial buildings. Renew. Sustain. Energy Rev. 2014, 4, 536–550. [Google Scholar]
- Cho, J.K. Development of an HVAC & R Systems Energy Evaluation Methodology and Simulation Program for Office Buildings. Korean J. Air Cond. Refrig. Eng. 2013, 25, 363–370. [Google Scholar]
- Lee, Y.Y.; Yun, G.Y.; Lee, G.H.Y.R. A Study on method of activating remodeling market of the existing building. J. Korean Soc. Living Environ. Syst. 2014, 21, 468–477. [Google Scholar]
© 2016 by the authors; licensee MDPI, Basel, Switzerland. This article is an open access article distributed under the terms and conditions of the Creative Commons by Attribution (CC-BY) license (http://creativecommons.org/licenses/by/4.0/).