Abstract
In the present work, we focus on long-term and permanent measurements of approximately two years on a 192 kWel Gas Otto CHP (combined heat and power) unit at a full-scale research biogas plant. In detail the influence of 600 h and 1800 h maintenance intervals on electrical efficiency consumption and exhaust gas emissions such as NOx and CO have been studied under real life conditions. Lubricating oil quality analyses throughout the CHP operation time are presented to show the destructive changes in property and its influence on condition based maintenance. The results confirm the well-known fact that after readjustment of the air-fuel ratio after 1800 h maintenance the emission values for NOx decline while CO increases. The emission-optimized operation mode leads to lower engine efficiency. The maintenance tasks carried out at 600 h intervals lead to lower NOx emissions in nine cases while in 14 cases the emissions remained unchanged. The permanent measurements proved their legitimacy showing various emission deviations from the limiting values prior and post maintenance. The results show that by monitoring the lubricating oil quality, the oil change intervals can be maximized while ensuring that engine performance is not endangered, and a longer engine lifespan can be expected. The oil analyses allow the operator to reduce maintenance expenditures while minimizing wear.
1. Introduction
1.1. General Introduction
The increased use of renewable energy sources for meeting the European [] and German [] political agenda has caused a massive growth in biogas production, especially in Germany. In 2011, approximately 7320 biogas plants were in operation, supplying the grid with 2997 MW of electrical power and providing heat as a secondary energy source. These figures include 80 units for biogas-upgrading and grid-injection, representing 1.09% of all biogas plants in Germany with an equivalent of 7.5% of the total electricity production from biogas []. Current forecasts for 2013 predict the number of biogas plants to increase up to 7874, with an increase in electrical power production of up to 3286 MW in Germany [].
More than 98% of the biogas plants are using combined heat and power units (CHP units) to convert the produced gas into electricity and useful heat. There is no information on hand about the actual number of CHP units in operation, as listed biogas plants may contain more than one CHP unit. CHP units are well established and have been used for more than 100 years for onsite energy production based on natural gas []. In general, a great variety of technologies are available [], but Gas Otto engines and dual-fuel engines are predominantly used for the conversion of biogas. As both systems offer advantages and disadvantages, biogas plant operators have to choose a type of engine depending on the size of the biogas plant, engine efficiency, engine availability, operating costs and potential revenues []. However, degradation in performance and maintenance expenditures during the lifetime of the engine is the big unknown in this calculation.
In order to provide more insight in this respect, experimental data collected over a period of more than two years at a 192 kWel Gas Otto CHP unit running at the research biogas plant “Unterer Lindenhof” located near Stuttgart/Germany [] was analyzed with regard to the schedule of maintenance. The goal of this study was to find a correlation between the efforts in maintenance and service performed at the unit, as well as the degradation in performance and emissions. Since prior studies dealing with this subject were mainly based on spot measurements [,,,], the contribution of the analysis presented in the following is its data basis taken from permanent and long-term measurements at a full scale biogas plant running under real-life conditions. The measurements of lubricating oil quality were also analyzed over this period, and results from that study are presented in this paper, as well.
1.2. Fundamentals
For economic and environmental reasons the performance of CHP units in terms of efficiency and emissions over its lifespan is of major importance for biogas plant (BGP) operators. High electrical efficiency is the key issue when choosing a CHP unit. However, operators are also forced to meet the limiting values for exhaust gas emissions given by the technical directives []. According to the German regulation TA Luft [], the limiting values for emissions from biogas CHP units of more than 1 MW total rated thermal input are 1000 mg/Nm3 CO and 500 mg/Nm3 NOx for gas engines, and 2000 mg/Nm3 CO and 1000 mg/Nm3 NOx for dual-fuel engines. In accordance to TA Luft, the limiting values for CHP units with less than 1 MW thermal input power are defined by the Bavarian State Office for Environment (Bayrisches Landesamt für Umwelt). This office also defines a higher limiting value of 1500 mg/m3 NOx for dual-fuel engines []. Note that all numbers for emissions referring to the operation of CHP units are based on a content of 5% oxygen remaining in the dry exhaust.
Gas Otto engines are able to run solely on biogas, providing high thermal efficiency and low emissions. In contrast, the dual-fuel engine is based on the principle of the diesel cycle, where the ignition is carried out by injection of a secondary fuel into the gas mixture. This type of engine is less sensitive to gas quality, and can run solely on the secondary fuel in part load operation, if necessary. Higher electrical efficiencies are typical for the dual-fuel engine as well as higher emissions, both due to the diesel cycle. Kampmann [] reports that Gas Otto engines can comply with the limiting values of German regulations regarding exhaust gas emissions TA Luft [], if homogenous gas qualities are applied and the timing of ignition is optimized. With respect to dual-fuel engines, Kampmann shows that higher concentrations of CO occur, especially during part-load operations.
The use of oxidation catalysts is not recommended for both types of engines, since the hydrogen sulfide concentrations in the biogas cause catalyst poisoning. To avoid this problem, biogas engines are operated at a lean burning mode, referring to a mass ratio of air to fuel, known as air-fuel ratio (AFR), higher than necessary for stoichiometric combustion. Hence, there is a high content of excess air in the gas-air mixture, which tends to cool the combustion, resulting in a significant reduction of NOx emissions. Unfortunately, engine efficiency is also reduced due to the lower temperatures of the heat supply to the thermodynamic cycle. Moreover, the excess air contributes to lower flame speed, causing incomplete combustion and the production of CO and unburned hydrocarbons (CnHm), e.g., formaldehyde (HCHO).
Emissions of formaldehyde from the exhaust gases of CHP units running on biogas are of special importance, since formaldehyde has been classified as a carcinogenic substance [].
For that reason, a reduction of the limiting value of 60 mg/Nm3 according to TA Luft was discussed. As a result, the issue 2009 of German Renewable Energy Sources Act (EEG) has been granting an anti-air pollution bonus if emissions of formaldehyde are kept below 40 mg/Nm3. Emissions of formaldehyde have been measured and discussed by several authors. Neumann and Hofmann measured 97 CHP units at full and part load by the year 2008. Some of the CHP units exceeded the limiting value of 60 mg/Nm3. The authors emphasize the importance of regular maintenance and exhaust treatment for a successful operation []. HCHO emissions exceeding the TA Luft limiting value of 60 mg/Nm3 (that applies to biogas plants >1 MW total rated thermal input) were measured at 25% of all units analyzed by Moczigemba []. Ebertsch and Fiedler [] measured the performance of various CHP units, partly equipped with oxidation catalysts. The results before and (after) 2009 showed that 30% (2%) of the Gas Otto engines comprised HCHO emissions >60 mg/Nm3, 50% (96%) of <40 mg/Nm3 and 20% (2%) between 40 and 60 mg/Nm3. 44% of the dual-fuel engines revealed HCHO emissions >60 mg/Nm3, 26% of <40 mg/Nm3 and 30% between 40 and 60 mg/Nm3 before the year 2009. After 2009, 100% of the dual-fuel engines showed formaldehyde emissions of <40 mg/Nm3, with 90% below 10 mg/Nm3. However, these low emissions were achieved at the expense of engine efficiency. A study by Bauer and Wachtmeister [], of two full-scale biogas plants, indicated that HCHO emissions in the exhaust gas could be reduced to a level far below the limiting value by using exhaust gas treatment systems such as an oxidation catalyst and a thermo reactor. The thermo reactor showed high conversion rates, higher operation complexity and required more intensive maintenance. The oxidation catalyst appeared to have a lower conversion rate, and is highly vulnerable to H2S and dust. The authors recommended further research to reduce the HCHO emissions by studying both the catalysts and the engine.
Evidently, there exists a direct connection between engine efficiency and environmental impact of CHP units, which is strongly affected by any efforts spent on maintenance and service of the unit. Gronauer et al. [] conducted one of the early measurement campaigns in this respect. The analysis of four dual-fuel engines (22 kWel, 50 kWel, 80 kWel, 132 kWel) and one Gas Otto engine (13 kWel), based on 4 spot-measurements over a period of 7 months, showed that four out of the five engines exceeded the limiting values of NOx and CO in every campaign. The authors found that emissions differed significantly due to a sensitivity caused by fluctuating gas quality, engine load and service conditions. Furthermore, it was found that engines at part load caused higher emissions. The authors conclude that the engines require optimal maintenance and engine adjustment to the gas quality, with respect to the content of methane, in order to reduce emissions to a minimum []. Aschmann et al. [,] analyzed the influence of different maintenance strategies by focusing on electrical efficiency and exhaust gas emissions for three dual-fuel and three Gas Otto engines. This study includes discontinuous measurements at full-load operation only. The results showed that in most cases the limiting value for NOx was exceeded. In one extreme case an engine showed emissions six times higher than the limiting value (500 mg/Nm3 NOx) stated in the TA Luft.
NOx-emissions below the limiting value could be measured for five engines only right after the manufacturer had serviced them. In some cases it was found that a compliance of emissions with the limiting values resulted in a lower engine efficiency. In general, the results revealed a strong impact of maintenance strategy, especially on engine efficiency depending on engine type and size. A study by Moczigemba [] showed that 60% out of 25 CHP units exceeded the limiting value of 500 mg/Nm3 for NOx-emissions.
The electrical efficiency of nine CHP units with a capacity ranging from 30 to 526 kWel was investigated by Aschmann and Effenberger [] over a period of 6 years. In this study, discontinuous measurements of four hours each were interpolated for the observation periods. The study showed that the electrical efficiency declined over the time of operation. The level of decline was hereby strongly affected by the maintenance strategy and engine overhauling. Maintenance and overhauling of the engine carried out by the engine manufacturer showed best results. The electrical efficiency of the investigated CHP units was on average found to be 3 percentage points lower (36.1%) than the manufacturer specifications (39.2%). Furthermore, exhaust gas emissions were measured for a 526 kWel engine, showing that NOx and CO values were above the limiting values before the maintenance intervals. A general engine overhaul showed a positive impact on exhaust gas emissions []. Effenberger [] indicated a decrease in efficiency of 0.5–0.6 percentage points every 10,000 h of operation for biogas engines under regular maintenance. Calculations showed that a decline in efficiency of one percentage point for a 526 kW engine (with a utilization rate of 97%) corresponds to an equivalent 6 ha Maize [].
From this outline, one may conclude that engine adjustments mainly focus on efficiency and profitability, and by this means to the expense of the environment due to increased exhaust gas emissions. In theory most CHP manufacturers comply with the standards regarding to emissions set by the directives. Regular service intervals and engine adjustments may ensure the completion of environmental directives and emission limits throughout the CHP lifetime. In practice, the efficiency of the CHP units is expected to decline over time, leading to lower profits []. This can be overcome, to a certain extent, by a consistent maintenance strategy [,,].
The extension of the lifetime of the lubricating oil is another key issue in CHP technology. Assessing the quality of the oil in the CHP unit ensures engine safety, and also keeps performance and operational costs at an economical level. The limiting values of lubricating oil for stationary gas engines (including special fuels such as biogas) are based on a guideline developed by lubricant and gas engine manufacturers as well as research laboratories and machinery insurers (Table 1).
The durability of the lubricating oil in a Gas Otto engine is heavily dependent on thermal and oxidative load, fuel quality (biogas composition) and reactions of combustion products with the oil, impact of acidic reaction products as well as the mode of engine operation. Those influences yield a change in oil properties, which can be determined by measuring characteristic parameters. General specifications are wear, soiling, oil condition, additives and additional tests as a sign of oil and engine aging and contamination with process media. The guideline mentioned above suggests additional measures to standardize sample collection, sample containers, sample labeling, sample quantity, sample-collection methods as well as sampling intervals. After laboratory tests the results are interpreted according to the limiting values by lubricant and gas engine manufacturers []. The intervals between oil checks depend on engine type, fuel and mode of operation and must be set individually for each engine, according to the manufacturer’s instructions []. Although there is no clear statement of when the oil should be changed, since many interactions of factors have to be taken into consideration, the experts rely primarily on oil condition and additional tests, then on soiling and finally on wear. The monitoring of the trend of all parameters within approximately 1000 operational hours is of major importance for ensuring an adequate quality of the lubricating oil.
Finally, it must be stated that most of the available data regarding the influence of maintenance on emissions, as well as the effects of lubricating oil quality on engine performance, was found in German literature, as there is still only a little international data available on the use of CHP units in the biogas sector, especially regarding the aforesaid topics. However, the economic, environmental and technical performance of CHP systems, and their use in industry and buildings, has been described by various authors [,,,,,]. Pourmovahed et al. [] tested the performance of 7 kWth and 1 kWel biogas CHP units in terms of thermal and electrical power output, individual and overall efficiencies, as well as exhaust gas emissions.

Table 1.
Limiting values for oil in stationary Gas Otto engines [,].
| Parameter | Unit | Limiting Value |
|---|---|---|
| Wear | ||
| Iron | mg/kg | 21 |
| Chrome | mg/kg | 5 |
| Tin | mg/kg | 5 |
| Aluminum | mg/kg | 10 |
| Nickel | mg/kg | 3 |
| Copper | mg/kg | 15 |
| Lead | mg/kg | 20 |
| Molybdenum | mg/kg | 5 |
| Soiling | ||
| Silicon/Dust | mg/kg | 4–7 |
| Potassium | mg/kg | 25 |
| Sodium | mg/kg | Fresh oil + 25 |
| Water | m% | 0.2 |
| Glycol | ppm | 500 (pos) |
| Oil-condition | ||
| Viscosity at 40°C | mm²/s | SAE 40: min. 12 max. 18SAE 30: min. 9 max. 15 |
| Viscosity at 100°C | mm²/s | |
| Viscosity index | – | increase max 3 |
| Oxidation | A/cm | 20 |
| Nitration | A/cm | 20 |
| Sulfurization | A/cm | 25 |
| Additives | ||
| Calcium | mg/kg | ±20% compared to fresh oil |
| Magnesium | mg/kg | |
| Boron | mg/kg | |
| Zinc | mg/kg | |
| Phosphorus | mg/kg | |
| Barium | mg/kg | |
| Additional tests | ||
| TBN | mg KOH/g | >50% of fresh oil but >2 |
| TAN | mg KOH/g | Fresh oil value + 2.5 |
| i-pH | – | >4 |
| SAN | mgKOH/g | unverifiable |
| Soot | % | 1.5 |
2. Materials and Methods
As outlined in the introduction, this study is based on experimental data from the operation of a 192 kWel Gas Otto CHP unit running at the “Unterer Lindenhof” biogas plant. The CHP unit started operation in August 2008; the measuring campaign started in March 2009 and it ran continuously over a period of more than two years until June 2011.
The “Unterer Lindenhof” research biogas plant consists of two digesters with concrete coating, which are connected to one post digester, fitted with a double membrane roof for gas storage during maintenance or CHP shut down. Digesters and post digester are of the same size, with a diameter of 14 m and a height of 6 m and a gross volume of 923 m3 each []. To run the CHP unit at full load, approximately eight tons of liquid and solid manure from cow, pig, sheep and poultry husbandry and another eight tons of renewable energy crops such as maize silage, grass silage, whole crop rye or wheat silage and ground grain are required for the daily biogas production in both digesters. The organic loading rate related to the organic dry matter (BrODM) equals 1.93 kg/(m3 d−1) with a hydraulic retention time (HRT) of 120 days in total. Under mesophilic conditions, approximately 96 Nm3/h of biogas are produced, at a quality of approximately 52% CH4, 48% CO2 and 500 ppm hydrogen sulfide (H2S) based on molar fractions. Hydrogen sulfide is reduced from the initial state by a biological desulfurization performed by ambient air injection into all three digesters. In addition, the biogas leaving the post digester is treated in a separate gas-conditioning module (Schnell Motoren AG, Amtzell, Germany). Here, the biogas is cooled by a double-pipe heat exchanger in order to reduce the contents of water vapour and other soluble impurities, such as ammonia or sulfur, and finally cleaned by an activated carbon filter for absorption of the remaining H2S to almost zero. In practice, not all CHP units are equipped with an effective purification technology. The results presented in this publication are only applicable to CHP units using such technology. After this treatment the biogas is converted in a CHP unit (MTU Onsite Energy GmbH, Augsburg, Germany). The CHP unit has an electrical power of 192 kW and a thermal power of 214 kW (nominal data). The main components are a 6-cylinder Gas Otto engine coupled with a synchronous-generator, the heat utilization unit and the switchboard. The electricity is completely fed into the local grid. Part of the useful heat is supplied to the digesters and the post digester in order to ensure an optimal process temperature of 40.5 °C. The remaining thermal energy is supplied to the district heating system of the research station. Any excess heat is rejected to the ambient by a cooler (Güntner AG & Co. KG, Fürstenfeldbruck, Germany). For engine lubrication Tectrol MethaFlexx HC PLUS (BayWa AG, München, Germany) is used in 1,000 liter batches. An oil laboratory regularly checks the lubricating oil (OILCHECK GmbH, Brannenburg, Germany). The analyzed result is then interpreted by experts from the lubricant supplier (BayWa AG) and from the engine manufacturer (MTU Onsite Energy GmbH, Augsburg, Germany). The biogas plant operator is provided with a diagnostic report of oil condition, contamination and equipment wear condition with recommendations for date of the next oil inspection and maintenance actions. The nominal data of the CHP unit based on the manufacturer’s specifications is summarized in Table 2.
The CHP unit is maintained every 600 h by in-house personnel according to a service schedule prescribing maintenance tasks from MTU Onsite Energy GmbH for this specific engine. The tasks include, e.g., replacement of sparkplugs and ignition cables check and adjustment of ignition timing, measurement and adjustment of valve clearance as well as replacement of the air filter cartridge. In addition, the engine manufacturer carries out further maintenance under a maintenance contract with the biogas plant operator. Additional maintenance is supplied to the engine in each level every 1800 h, which are graded in 3600, 5400, 7200 and 10,800 h. Some of the tasks include lambda probe replacement, turbo charger check or cooling water check. The exhaust gas values are checked every 1800 h and the air-fuel ratio is readjusted if the manufacturer maintenance personnel detects any emissions exceeding the limiting values. This indicates that every third service is a major service and the time between two services roughly equals the length of a month at continuous operation of the CHP unit.
Table 2.
Nominal data of the CHP unit at the “Unterer Lindenhof” research station.
| Technical specification | System specification | System parameter |
|---|---|---|
| Engine | CHP unit | MDE MB 3066 L4 |
| Engine type | 6 cylinder Gas Otto engine | |
| Electrical output power | 192 kW | |
| Thermal output power (engine + exhaust gas cooling) | 214 kW | |
| Thermal output power (gas mixture cooling) | 29 kW | |
| Biogas input power (at 55% CH4) | 499 kW | |
| Engine lubricating oil | Tectrol MethaFlexx HC Plus | |
| Emission limits | NOx-emissions (at 5% O2 in the dry exhaust) | <500 mg/Nm3 |
| CO2-emissions (at 5% O2 in the dry exhaust) | <1000 mg/Nm3 |
In order to gain as much knowledge as possible from the operation of the CHP unit, an extensive system for control and data acquisition was installed. In total 41 values, recorded every 5 min, are stored and saved each day in a selected file for further analysis. In detail, the data consists of
- electrical and thermal output of the CHP unit;
- utilization of thermal energy by the biogas plant and the district heating system;
- composition, flow, temperature and pressure of the biogas;
- composition and temperature of the exhaust gas;
- supplementary temperatures, pressures and further data from the CHP unit;
- additional data taken on demand for any extra information needed.
Since emissions are discussed in detail in the following, more information should be provided regarding the exhaust gas analysis. In the exhaust line of the CHP unit an exhaust gas analyzer testo 350 (Testo AG, Lenzkirch, Germany) is installed capable of measuring the contents of O2, CO, NO, NO2 and SO2. Additionally, the temperature of the exhaust gas after the exhaust gas heat exchanger is detected on its way to the chimney. The analyzer’s principle of operation is based on electrochemical cells for each component, and the analyzer can be equipped with 6 different cells. The measurements are performed continuously in a way that the analyzer takes continuous data during the first 10 min of every hour. The remaining 50 min are used for purging the analyzer with ambient air. This method for taking the data was specifically developed in order to ensure the durability of the device during the 2-year measurements. Moreover, the low content of H2S in the exhaust gas, due to the efforts for purification of the biogas entering the engine, helped to apply the analyzer at this site. In order to ensure a constant accuracy over the period of the measuring campaign, the exhaust gas analyzer was calibrated in intervals of approximately six months. Compared to the basic uncertainties, no major deviations of the device were observed; hence, there was no noticeable drift of the electrochemical cells. However, long-term measurements of hydrocarbons in the exhaust could not be performed by using the analyzer Testo 350, since the electrochemical cell for detecting HC revealed a significant drift over time.
3. Results and Discussion
First, the effects of maintenance on electrical efficiency and emissions are discussed. From the experimental data collected over the two-year campaign, the data of the days the unit was serviced was analyzed.
Table 3.
Effects of maintenance on electrical efficiency and emissions.
| Maintenance | Effects due to maintenance | ||
|---|---|---|---|
| Major/Minor | Concentration of NOx | Concentration of CO | Electrical efficiency |
| 8-Apr-09 | decrease (t) | increase (t) | ns |
| 7-May-09 | decrease | increase | decrease (PL) |
| 29-May-09 | decrease (t) | increase (t) | decrease (t) |
| 29-Jun-09 | nd | nd | constant |
| 27-Jul-09 | decrease | increase | decrease (little) |
| 20-Aug-09 | decrease (t) | increase (t) | ns |
| 23-Sep-09 | decrease | increase | nd |
| 14-Oct-09 | nd | nd | nd |
| 9-Nov-09 | constant | constant | nd |
| 3-Dec-09 | decrease (t) | increase (t) | nd |
| 22-Dec-09 | constant | constant | nd |
| 14-Jan-10 | increase | constant | nd |
| 3-Feb-10 | constant | constant | nd |
| 03-&04-Mar-10 | increase | constant | nd |
| 29-Mar-10 | constant | constant | nd |
| 29-Apr-10 | constant | constant | nd |
| 20-May-10 | constant | constant | increase (PL) |
| 15-Jun-10 | constant | constant | constant |
| 8-Jul-10 | decrease | increase | ns |
| 5-Aug-10 | constant | constant | increase |
| 1-Sep-10 | decrease (t) | constant | decrease (t) |
| 22-Sep-10 | constant | constant | constant (PL) |
| 20-Oct-10 | constant | constant | constant |
| 15-Nov-10 | constant | constant | constant |
| 3-Dec-10 | constant | constant | ns |
| 23-Dec-10 | constant | constant | ns |
| 24-Jan-11 | constant | constant | ns |
| 23-Feb-11 | decrease | increase | decrease |
| 22-Mar-11 | decrease | increase | decrease |
| 09-April-11(sp) | decrease | increase | decrease (little) |
| 15-Apr-11 | constant | constant | constant |
| 25-April-11(sp) | decrease | increase | ns |
| 9-May-11 | constant | constant | constant |
| 14-June-11 | nd | nd | constant (PL) |
nd: no data; ns: no statement possible due to part load; PL: part load may affect the results as well; t: small time lag between maintenance and effect; sp: additional change of spark plugs (no regular change of spark plugs during the next service).
Table 3 shows the effects of maintenance on the concentrations of NOx and CO in the exhaust gas as well as on electrical efficiency. In the left column of Table 3 the dates of the services are shown, and it is denoted, if a minor or a major service was scheduled. For a better understanding of the various effects, different colors are used in order to depict an increasing or a decreasing result. In detail, a full red box indicates a decrease, while a light red box is attributed to a decrease of little magnitude, a decrease partly affected by part-load operation or a decrease occurring with a time lag of one to three days before or after the date of the service. The same scheme is applied to indicate increasing values using full green and light green colors.
From Table 3, it can be seen that, that besides the service dates with no changes detectible in most cases a decrease of NOx-emissions is connected to an increase of CO-emissions and often connected to a decrease in electrical efficiency after service []. This result compares to the expectations and results published in the literature for Gas Otto engines running on a lean mixture, as stated previously. To be precise, the results are caused by an adjustment of air-fuel ratio (AFR) during service, which will be proved by the change of oxygen content in the exhaust gas in the following. An increase of AFR yields a reduction in temperature in the combustion zone due to the higher content of the inert gas nitrogen in the cylinder. By this means the formation of thermal NOx, which is the major path of NOx-production, is repressed. As a result, electrical power and efficiency of the CHP unit are also reduced; the first due to the smaller amount of fuel in the cylinder and the latter due to the lower temperature of heat supply to the thermodynamic cycle. However, the reduction in electrical power could be overcome by opening the throttle for fuel inlet a little more. In addition to Table 3 data of NOx and CO emissions for 5 days before and after every maintenance interval are presented in Figure 1. The evaluation shows that the majority of NOx values range between 350 and 600 mg/Nm3 with the total span ranging from 300 to 900 mg/Nm3. Maintenance has an effect of ±15% (50% of the data) on emissions with a slight trend to lower NOx values (−2.5%). However, the deviations after maintenance for all NOx data fluctuated in a very wide range from −50% to 40%. The majority of the values for CO ranged between 550 and 600 mg/Nm3 within a span of 460 to 650 mg/Nm3. After maintenance, a trend of a slight increase of 0.6% in CO was found. The results show that 50% of the data for CO range from −5% to +5% and from −14% to 24% for the total CO data set, after maintenance.
As previously mentioned these effects are well known from practical engines and published in the literature [,,]. However, the data presented in Table 3 proves this theory from practical experience over a 2-year period of continuous measurements, and it shows the evolution of the impact of maintenance for a longer period of operation of the CHP unit. A finding is that wide ranging fluctuations of emissions are found and that maintenance does not have the desired effect of lower emissions in every case.
Based on the assumption of a stochiometric air fuel mixture, an increase in AFR will lower CO-emissions, since there is more oxygen available helping to completely convert the hydrocarbons to CO2. On the other hand, an increase in AFR tends to lower the temperature in the combustion zone and therefore slows the speed of the chemical reaction for converting the hydrocarbons to CO2 and water. Evidently, this effect works against the higher concentration of oxygen in the combustion zone, and at a certain value any further increase in AFR yields an increase of CO-emissions, since the speed of the chemical reaction has become too small, resulting in incomplete combustion, as shown i.e., in []. Due to the fact that almost 50% of biogas is made up by CO2, which can be seen as an inert gas, the combustion of biogas is in principle slower compared to the combustion of pure methane. For that reason, the AFR applied for lean combustion of biogas in Gas Otto engines is already in the range where any further increase does not tend to lower CO-emissions, but on the contrary, yields an increase of CO-emissions. This is proven by the data collected from the CHP unit, as shown in Table 3 and Figure 1.
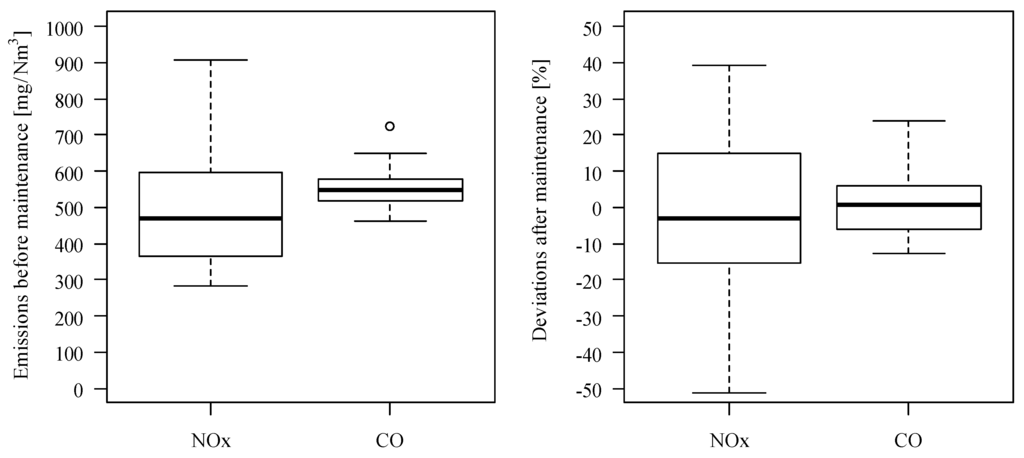
Figure 1.
Boxplot of NOx and CO emissions five days before maintenance and its change in percentage points five days after the maintenance over all maintenance intervals.
In order to provide more insight into the data collected during the measuring campaign and the evaluation around the dates of maintenance, Figure 2, Figure 3 and Figure 4 present electrical power, electrical efficiency and emissions plotted versus time. Due to the fact that it is not worthwhile to display the complete data of 2 years and 3 months in one diagram, a time span of 3 months, namely from mid March 2009 until mid June 2009, has been selected for presentation. For further discussion of the effects of maintenance, the relevant dates are marked in the diagrams. It can be seen that a major maintenance was performed on 8-Apr-09 and two minor maintenances were performed on 7-May-09 and 29-May-09. Evidently, the presentation in Figure 2, Figure 3 and Figure 4 is a compromise between the large amount of data available and a comprehensive description of the various effects. It should be noted that a more detailed discussion is given in Thomas and Wyndorps []. Here, the data is displayed around the major maintenance of 23-Feb-11, in high resolution.
From the diagram for electrical power (Figure 2) it can be seen that the nominal power of 192 kWel was not reached. Instead, a maximum electrical power of 186 kW could be achieved, which is attributed to the location of the biogas engine at the research station at a geodetic height of 440 m above sea level. This fact is not often taken into account for economic calculations even though the decline in electrical output might be quite significant, as shown here by a reduced power of at least 3 percentage points. Moreover Figure 2 displays that it was not possible to run the CHP unit on full load continuously. In particular, around 25-Mar-09, 24-Apr-09 and 9-May-09, significant phases of electrical power fell below 192 kW. This indicates part-load operation. Comparing this to the diagram of electrical efficiency (Figure 4) reveals that electrical efficiency drops during part-load operation from 38% to 39%, while a peak efficiency of 40% is reached during continuous periods of operation at full power, only. Unfortunately, this effect sometimes interferes with the influence of maintenance on electrical efficiency, preventing a clear evaluation for the decrease in electrical efficiency. All dates relevant to this situation are marked in Table 3 by “(PL)” or “ns” for part load.
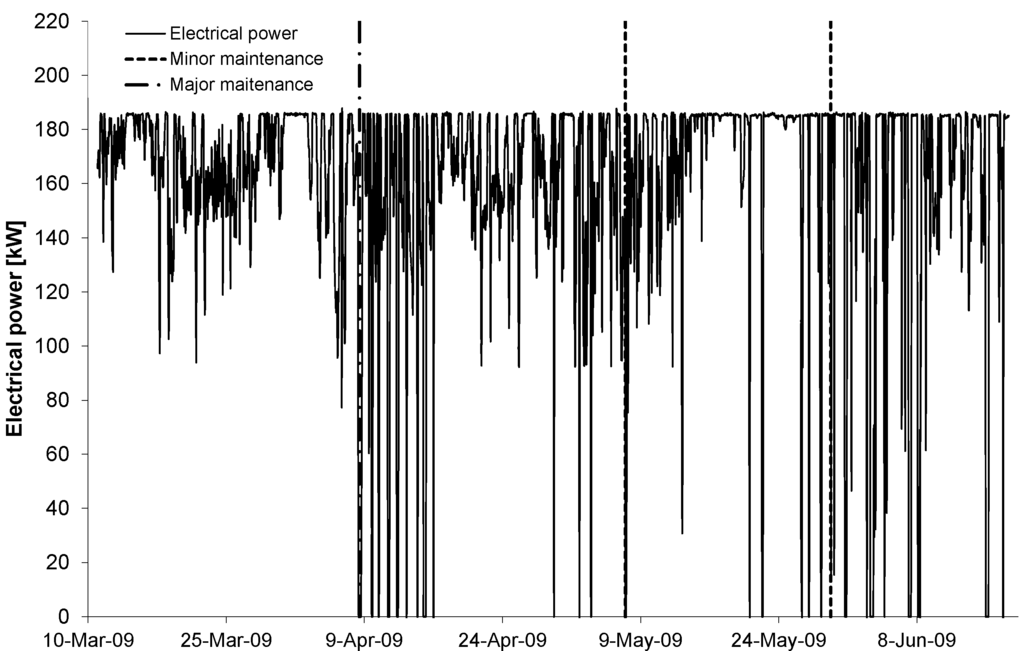
Figure 2.
Recorded data for electrical power from 10-Mar-09 to 17-Jun-09.
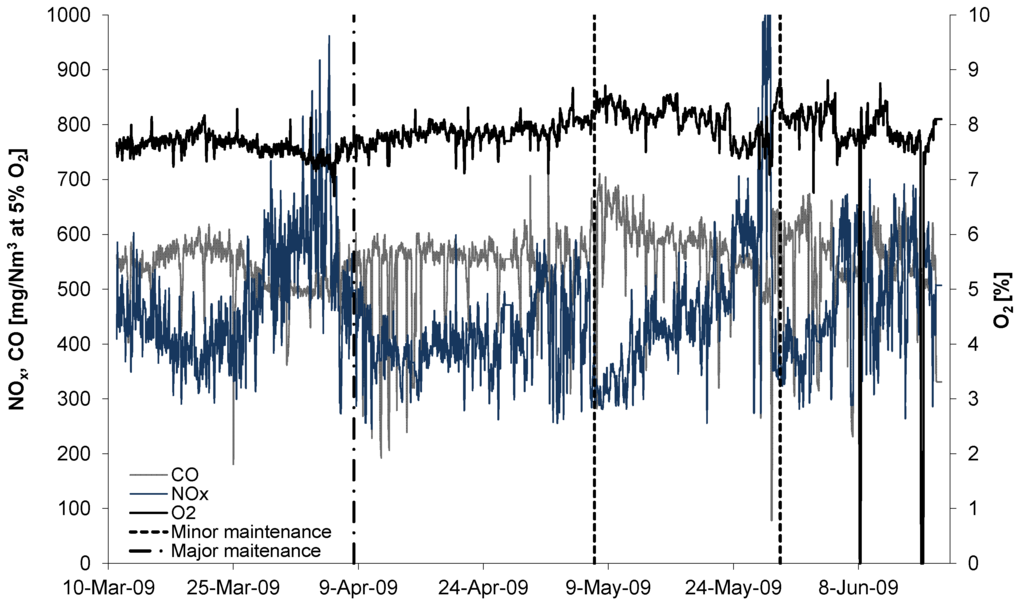
Figure 3.
Recorded data for emissions from 10-Mar-09 to 17-Jun-09.
Looking at the diagram for emissions (Figure 3), it is obvious that NOx-emissions always decrease around the three dates marked for maintenance. However, especially for the major maintenance on 07-Apr-09, there is a time lag visible between the drop of NOx-emissions and the date for maintenance. An exact reason for this time lag cannot be determined. However, the drop of NOx-emissions always coincides with an increase in oxygen concentration in the exhaust, as displayed in the diagram. This clearly indicates an increase in AFR proving the previously stated theory that an increase in AFR tends to lower NOx-emissions. For the two minor maintenances depicted in Figure 3, the associated drop in electrical efficiency can be observed and it also coincides with the increase in oxygen content in the exhaust, which proves the theory with regard to the effect of AFR on electrical efficiency. Finally, the increase of CO-emissions also corresponds to the increase in oxygen concentration. Hence, the data presented in Figure 3 proves the fact that for Gas Otto engines running on biogas in lean mode, an increase in AFR yields higher CO-emissions, as shown by Zacharias for an AFR above 1.6 [].
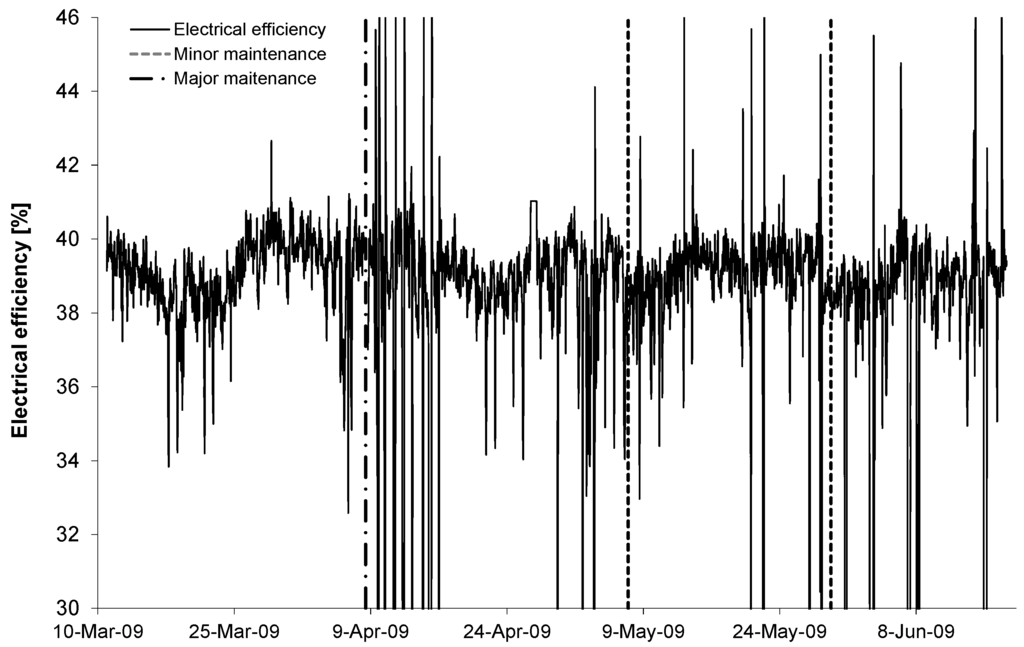
Figure 4.
Recorded data for electrical efficiency from 10-Mar-09 to 17-Jun-09.
For evaluation of the global trend of electrical efficiency over time all data points need to be fitted by a linear function in order to level out any effect by part load or adjustment of AFR as described before. However, due to various changes in the measurements of the biogas volume flow rate between August 2009 and April 2010 consistent data in this respect is available for the time between May 2010 and June 2011, only. For this period of 13 months net electrical efficiency shows a decline of 0.76% absolute, which is a bit higher compared to 0.5%–0.6% per 10,000 h of operation as published by Effenberger [].
Regarding oil quality the complete results are presented in Table 4 complemented by fresh oil values, as well as limiting values. The data is taken from the inspection records and it covers the entire period of operation of the CHP unit. Figure 5 and Figure 6 and Table 4 show that the first batch of oil lasted for more than 13,600 h with the first oil check after 6103 h. Until the first oil change after 19 months the oil was checked regularly in six intervals between 900 and 1800 h according to expert recommendations. The second oil change was completed 17 months later, after an operation time of more than 11,500 h. In the second period the first oil check was carried out after 6549 h with three additional checks before the oil was changed. The intervals for the check were set between 1285 and 1827 operation hours. In the third period the first check was carried out after 7616 h with an additional check after 2273 h of operation. The last check conducted for this study was carried out on 10-Aug-12 at a total CHP unit operation time of 34,186 h.
Table 4.
Summary of oil inspection records.
| Number of analyses | 1 | 2 | 3 | 4 | 5 | 6 | 7 | 8 | 9 | 10 | 11 | 12 | |||
|---|---|---|---|---|---|---|---|---|---|---|---|---|---|---|---|
| Unit | Fresh oil values | Limiting values | |||||||||||||
| Date of laboratory analyses | – | – | – | 17-Apr-09 | 30-Jun-09 | 31-Aug-09 | 16-Nov-09 | 23-Dec-09 | 15-Feb-10 | 07-Dec-10 | 27-Jan-11 | 15-Apr-11 | 10-Jun-11 | 04-May-12 | 10-Aug-12 |
| Date of sample taking | – | – | – | 08-Apr-09 | 29-Jun-09 | 28-Aug-09 | 13-Nov-09 | 22-Dec-09 | 11-Feb-10 | 26-Nov-10 | 25-Jan-11 | 13-Apr-11 | 09-Jun-11 | 02-May-12 | 08-Aug-12 |
| Date of last oil change | – | – | – | – | – | – | – | – | – | 03-Mar-10 | 03-Mar-10 | 03-Mar-10 | 03-Mar-11 | 18-Jul-11 | 18-Jul-11 |
| Operation time since last oil change | h | – | – | 6,103 | 7,921 | 9,299 | 11,113 | 12,014 | 13,226 | 6,112 | 7,512 | 9,339 | 10,634 | 6,695 | 8,968 |
| Total CHP operation time | h | – | – | 6,103 | 7,921 | 9,299 | 11,113 | 12,014 | 13,226 | 19,775 | 21,175 | 23,002 | 24,297 | 31,913 | 34,186 |
| Oil change | – | – | – | No | No | No | No | No | No | Yes | No | No | No | Yes | No |
| Fresh oil supply | – | – | – | No | No | No | No | No | No | Yes | No | No | No | Yes | No |
| Wear | |||||||||||||||
| Iron | mg/kg | 0 | 21 | 3 | 2 | 2 | 3 | 3 | 3 | 2 | 2 | 2 | 3 | 2 | 3 |
| Chrome | mg/kg | 0 | 5 | 0 | 0 | 0 | 0 | 0 | 0 | 0 | 0 | 0 | 0 | 0 | 0 |
| Tin | mg/kg | 0 | 5 | 0 | 0 | 0 | 0 | 0 | 0 | 0 | 0 | 0 | 0 | 0 | 0 |
| Aluminium | mg/kg | 0 | 10 | 4 | 4 | 4 | 5 | 5 | 5 | 2 | 2 | 2 | 3 | 3 | 4 |
| Nickel | mg/kg | 0 | 3 | 0 | 0 | 0 | 0 | 0 | 0 | 0 | 0 | 0 | 0 | 0 | 0 |
| Copper | mg/kg | 0 | 15 | 3 | 4 | 5 | 7 | 7 | 8 | 2 | 2 | 2 | 4 | 2 | 3 |
| Leald | mg/kg | 0 | 20 | 1 | 0 | 1 | 0 | 1 | 1 | 0 | 0 | 0 | 1 | 0 | 0 |
| Molybdenum | mg/kg | 0 | 5 | 0 | 0 | 0 | 0 | 0 | 0 | 0 | 0 | 0 | 0 | 0 | 0 |
| PQ-Index | – | OK | – | OK | OK | OK | OK | OK | OK | OK | – | – | – | – | – |
| Soiling | |||||||||||||||
| Silicon/Dust | mg/kg | 7 | 4-7 | 2 | 2 | 2 | 2 | 2 | 1 | 2 | 3 | 3 | 4 | 2 | 3 |
| Potassium | mg/kg | 22 | 25 | 29 | 26 | 25 | 26 | 22 | 26 | 24 | 25 | 24 | 27 | 21 | 20 |
| Sodium | mg/kg | 3 | 28 | 1 | 2 | 2 | 3 | 1 | 4 | 5 | 6 | 5 | 4 | 9 | 6 |
| Water | % | 0.1 | 0.2 | 0.1 | 0.1 | 0.1 | 0.1 | 0.1 | 0.1 | 0.1 | 0.1 | 0.1 | 0.1 | 0.1 | 0.1 |
| Diesel fuel | % | 0 | 0 | 0 | 0 | 0 | 0 | 0,3 | 0 | 0 | 0 | 0 | 0 | 0 | |
| Biodiesel | % | 0 | 0 | 0 | 0 | 0 | 0 | 0,3 | 0 | 0 | 0 | 0 | 0 | 0 | |
| Vegetable oil | % | 0 | 0 | 0 | 0 | 0 | 0 | 1 | 0 | 0 | 0 | 0 | 0 | 0 | |
| Soot | % | 0.1 | 1.5 | 0.1 | 0.1 | 0.1 | 0.1 | 0.1 | 0.1 | 0.1 | 0.1 | 0.1 | 0.1 | 0.1 | 0.1 |
| Date of laboratory analyses | – | – | – | 17-Apr-09 | 30-Jun-09 | 31-Aug-09 | 16-Nov-09 | 23-Dec-09 | 15-Feb-10 | 07-Dec-10 | 27-Jan-11 | 15-Apr-11 | 10-Jun-11 | 04-May-12 | 10-Aug-12 |
| Date of sample taking | – | – | – | 08-Apr-09 | 29-Jun-09 | 28-Aug-09 | 13-Nov-09 | 22-Dec-09 | 11-Feb-10 | 26-Nov-10 | 25-Jan-11 | 13-Apr-11 | 09-Jun-11 | 02-May-12 | 08-Aug-12 |
| Date of last oil change | – | – | – | – | – | – | – | – | – | 03-Mar-10 | 03-Mar-10 | 03-Mar-10 | 03-Mar-11 | 18-Jul-11 | 18-Jul-11 |
| Operation time since last oil change | h | – | – | 6,103 | 7,921 | 9,299 | 11,113 | 12,014 | 13,226 | 6,112 | 7,512 | 9,339 | 10,634 | 6,695 | 8,968 |
| Total CHP operation time | h | – | – | 6,103 | 7,921 | 9,299 | 11,113 | 12,014 | 13,226 | 19,775 | 21,175 | 23,002 | 24,297 | 31,913 | 34,186 |
| Oil change | – | – | – | No | No | No | No | No | No | Yes | No | No | No | Yes | No |
| Fresh oil supply | – | – | – | No | No | No | No | No | No | Yes | No | No | No | Yes | No |
| Oil-condition | |||||||||||||||
| Viscosity at 40 °C | mm²/s | 134.33 | min 9; max 18 | 147.1 | 152.1 | 155.4 | 165.67 | 171.26 | 175.8 | 164.06 | 169.02 | 178.02 | 185.66 | 164.09 | 172.05 |
| Viscosity at 100 °C | mm²/s | 14.34 | 16.38 | 15.53 | 16.08 | 16.56 | 16.68 | 17.36 | 16.39 | 16.62 | 17.69 | 17.8 | 16.19 | 16.88 | |
| Viscosity index | 105 | max increase 3 | 118 | 104 | 108 | 105 | 104 | 106 | 105 | 103 | 108 | 104 | 102 | 104 | |
| Oxidation | A/cm | 0 | 20 | 12 | 15 | 14 | 15 | 21 | 18 | 9 | 14 | 18 | 18 | 16 | 10 |
| Nitration | A/cm | 0 | 20 | 1 | 1 | 1 | 2 | 1 | 1 | 1 | 1 | 1 | 1 | 1 | 1 |
| Sulfurization | A/cm | 0 | 25 | 0 | 0 | 0 | 3 | 0 | 0 | 0 | 0 | 0 | 0 | 0 | 0 |
| Phenolic anti-oxidant | % | 127.37 | – | 0 | 60.67 | 43.09 | 30.03 | 28.09 | 19.36 | 49.39 | 42.62 | 30.19 | 23.59 | 59.58 | 38.36 |
| Addivtives | |||||||||||||||
| Calcium | mg/kg | 2,594 | 2,075–3,112 | 2,515 | 2,416 | 2,397 | 2,549 | 2,498 | 2,517 | 2,530 | 2,767 | 2,841 | 3,147 | 2,813 | 2,995 |
| Magnesium | mg/kg | 1 | 0.8–1.2 | 3 | 3 | 2 | 3 | 3 | 2 | 0 | 3 | 3 | 5 | 6 | 7 |
| Boron | mg/kg | 1 | 0.8–1.2 | 1 | 1 | 0 | 1 | 1 | 1 | 1 | 1 | 1 | 1 | 2 | 2 |
| Zinc | mg/kg | 5 | 4–6 | 4 | 4 | 5 | 5 | 2 | 7 | 4 | 4 | 6 | 7 | 10 | 11 |
| Phosporus | mg/kg | 564 | 451–676 | 517 | 496 | 478 | 487 | 482 | 488 | 531 | 550 | 569 | 617 | 558 | 581 |
| Barium | mg/kg | 0 | 0 | 0 | 0 | 0 | 0 | 0 | 0 | 0 | 0 | 0 | 0 | 0 | 0 |
| Sulfat | mg/kg | 5,001 | 4,480 | 4,048 | 4,429 | 4,378 | 4,063 | 4,273 | 6,145 | 6,522 | 6,580 | 7,217 | 6,776 | 6,507 | |
| Additional tests | |||||||||||||||
| Base number (BN) | mgKOH/g | 9.44 | 4.72 | 8.01 | 6.69 | 7.3 | 7.49 | 6.83 | 6.89 | 8.22 | 8.18 | 8.23 | 8.1 | 8.12 | 7.88 |
| Acid number (AN) | mgKOH/g | 1.47 | 3.97 | 1.5 | 1.68 | 1.91 | 2.18 | 2.79 | 4.53 | 1.97 | 1.92 | 1.61 | 2.72 | 2.38 | 2.26 |
| i-pH-value | – | 6.67 | >4 | 5.96 | 4.76 | 5.08 | 5.27 | 4.74 | 4.99 | 5.66 | 5.77 | 5.53 | 5.28 | 5.67 | 5.88 |
In Figure 5 selected results for oil condition and additional tests are shown, which explain some important factors for oil quality and oil-change schedule decision making. In addition, three fresh oil values are added to show the changes after the new oil was supplied. As already discussed, the decision for an oil change depends on various factors. Viscosity at 100 °C as an indicator for oil condition and acid number (AN) as well as base number (BN) from additional tests were chosen to highlight the decision making for an oil change in Figure 5. The viscosity describes the fluidity of the oil, and it increases due to oil aging, nitration, soot and evaporation of light volatile components. The AN increases due to a reaction of the oil with oxygen. The oxidation products may build organic acids that can lead to corrosion or deposits even if a base buffer is found. Acids are reaction products of the combustion process that are formed by aging and nitration. The buffer of bases is described by BN and characterizes the capacity for neutralization in the oil. Through reaction with acids, this capacity declines over time, especially if the engine runs contaminated gases such as biogas. Figure 5 shows that the viscosity slightly increases during operation. The oil was changed for the first time after the limiting values for viscosity and AN were almost reached after six analyses. Due to a lower AN found in analysis five, the oil was kept for another 1200 operating hours. After the first oil change the viscosity increased again until it reached its limiting value. However, the oil was kept another 2295 h due to an AN well below the limiting value. The BN decreased over the operating time, but it was measured always well above its limiting value. This implies that viscosity and AN are the most important parameters for oil change decisions.
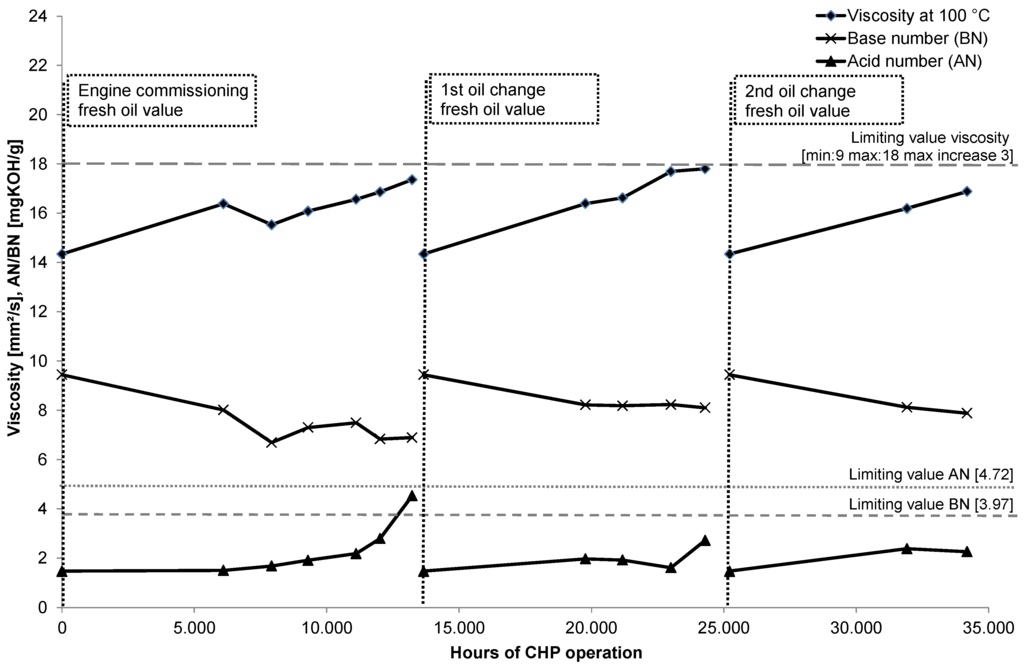
Figure 5.
Results for viscosity, base (BN) and acid number (AN) complemented by fresh oil values at times of oil changes.
The value i-pH for additional tests and the content of aluminum for indication of wear are presented in Figure 6. Because the BN does not give complete information about the neutralization capacity of the oil, the i-pH value supplies essential information in this respect, especially for lubricating oils in biogas engines about the load with corrosive acids []. Any aluminum found in the oil indicates engine wear, since aluminum is a typical element in pistons and plain bearings or it is found in contaminated inlet air.
The results presented in Figure 6 show a declining i-pH value with operating time, as expected. In addition, it can be seen that the i-pH value always stays well above the limiting value of 4. The results show that the content of aluminum in the oil increased over operating time to a level between two and five mg/kg and did not reach the limiting value of 10. Both i-pH value and content of aluminum were not responsible for any oil-change decisions. The content of aluminum in the oil is still low due to the comparably short lifetime of the engine. It can be presumed that the fast increase of aluminum from zero to four in the first period was due to the startup phase, when oil in the engine was soiled with production residues from engine commissioning. However, the fast increase of aluminum concentration in the third period may be a sign of engine aging.
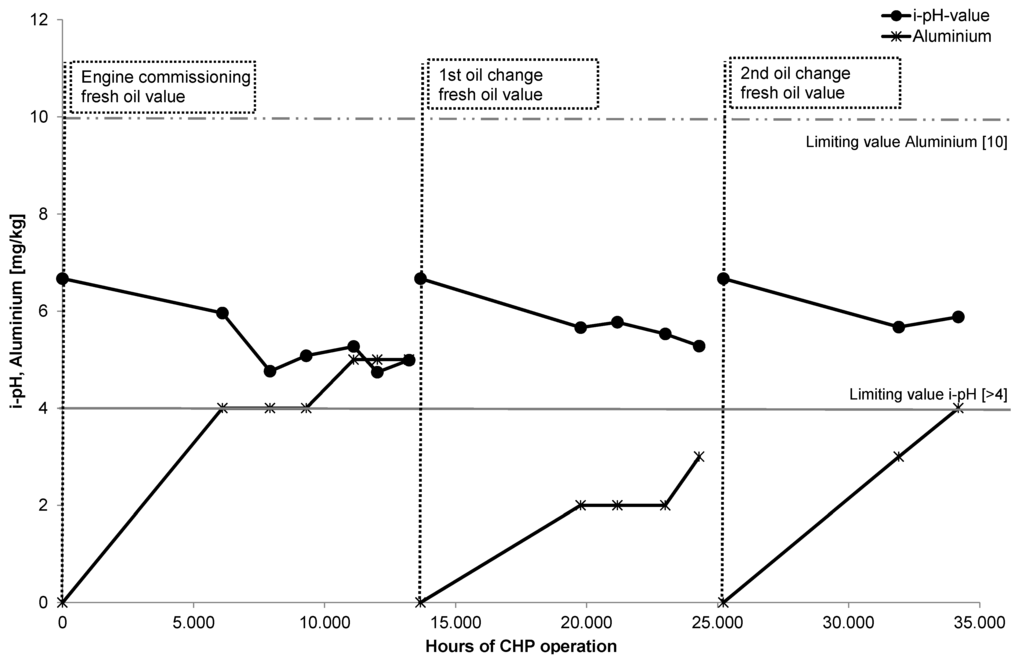
Figure 6.
Results for i-pH and content of aluminum complemented by fresh oil values at times of oil changes.
4. Conclusions
The results from the 2-year measuring campaign regarding effects of maintenance on emissions and electrical efficiency coincide with common knowledge from the literature. It must be stated that due to the effective gas purification installed at the research biogas plant, the results of this study are only applicable to installations using such technology. In 2008, such units were not standard, but over the past years many biogas plants retrofitted such systems. Nevertheless, the results gained in this study prove that the use of effective gas purification technology can be highly recommended and currently the use of a gas purification unit is compulsory for some CHP units.
It was found that any increase in AFR during a service, which could be detected by an increased content of oxygen in the exhaust gas, yields a reduction in NOx-emissions, but an increase in CO-emissions and a reduced electrical efficiency. In addition, the results proved the decline in electrical efficiency at part-load operation. This drawback should be kept in mind when discussing the operation of biogas CHP units for balancing production and demand of electricity in smart grids.
Moreover, the continuously collected data revealed that even after adjusting AFR during a service, a decline in oxygen content right after the service is not unlikely. Evidently, this indicates a decrease of AFR and, consequently, an increase in NOx-emissions again, which was also detected from the experimental data. This emphasizes the need for a service of CHP units on a regular and professional basis, in order to prevent unacceptable exhaust gas emissions. This request can be found in the literature, as well. However, it will be most consequential to call for an online monitoring, in order to prevent any emissions beyond the limiting values between the services. Based on the results from the measuring campaign, this request can easily be fulfilled by monitoring the AFR of the CHP unit, which must be detected for lambda control anyway, since there is a direct connection between NOx-emissions and oxygen content in the exhaust gas. Nevertheless, the results from this paper demand an improvement of lambda control. Even though the quality of the control may be sufficient for the operation of the Gas Otto engine in lean mode, the risk for excessive NOx-emissions due to the remaining variations in AFR are is still too high. The results of the oil inspections prove that on-demand oil change intervals based on regular oil checks are in favor of fixed, time-based intervals. As the oil quality declines in dependence on gas purity, and full or part load of the engine over its lifetime, the appropriate time for the oil change cannot be precisely predicted. The assessment of the oil parameters revealed whether the oil was ready to be changed, or if it was suitable for further operation. The analysis provided the confidence that maximizing the oil change intervals did not endanger system performance. This saves maintenance costs and simultaneously minimizes wear. The frequency of oil analyses as carried out for this Gas Otto CHP unit proves to be the right strategy as unscheduled downtime due to unexpected changes in the oil was avoided and the engine equipment reliability improved. The oil analyses allowed a monitoring of the engine components with respect to wear of metal. As metal components in CHP units differ depending on the manufacturer and are difficult to distinguish, as they occur several times in an engine, a close consultation with the specific CHP manufacturer is required to evaluate the data and to precisely detect component failure. Taking into consideration that the engine will be operated for a long time, component failure may be detected in advance. This will allow maintenance to be scheduled in advance and thus reduce engine downtime in case of a component failure. Currently, no online measurement equipment for oil quality is available for biogas CHP units that allows the parameters to be measured permanently.
Acknowledgments
This project was funded by the Ministry of Rural Areas and Consumer Protection (Ministerium für Ländlichen Raum und Verbraucherschutz Baden-Württemberg), with financial resources from the “Baden-Württemberg Stiftung gGmbH”, as part of the bioenergy research platform.
Conflict of Interest
The authors declare no conflict of interest.
References
- Renewable Energy Technology Roadmap—20% by 2020; European Renewable Energy Council (EREC): Brussels, Belgium, 2008; Available online: http://www.erec.org/fileadmin/erec_docs/Documents/Publications/Renewable_Energy_Technology_Roadmap.pdf (accessed on 10 October 2012).
- Klimaziele im Blick. Available online: http://www.bundestag.de/dokumente/textarchiv/2010/29574565_kw18_sp_klimaschutzgesetz/index.html (accessed on 8 October 2012).
- Branchenzahlen 2011 und Branchenentwicklung 2012/2013. German Biogas Association: Freising, Germany, 2012. Available online: http://www.biogas.org/edcom/webfvb.nsf/id/DE_Branchenzahlen/$file/12-11-29_Biogas%20Branchenzahlen%202011-2012-2013.pdf (accessed on 14 December 2012).
- Wu, D.W.; Wang, R.Z. Combined cooling, heating and power: A review. Prog. Energy Combus. Sci. 2006, 32, 459–495. [Google Scholar] [CrossRef]
- Kazemi-Beydokhti, A.; Heris, S.Z. Thermal optimization of combined heat and power (CHP) systems using nanofluids. Energy 2012, 44, 241–247. [Google Scholar] [CrossRef]
- Aschmann, V.; Kissel, R.; Effenberger, M.; Eichelser, R.; Gronauer, A. Effizienzsteigerung, Emissionsminderung und CO2-Einsparung durch optimierte Motoreinstellungen bei Biogas-Blockheizkraftwerken zur dezentralen Stromversorgung [in German]; Bayerisches Landesamt für Umwelt (LfU): Augsburg, Germany, 2007; Available online: http://uok.bayern.de/portal/internalfile/download/EULV26_Endbericht_BHKW-Emis_1227178761128.pdf (accessed on 14 December 2012).
- Thomas, B.; Wyndorps, A. Efficiencies and emissions of a 192 kWel Otto engine CHP-unit running on biogas at the research station “Unterer Lindenhof”. Eng. Life Sci. 2012, 12, 306–312. [Google Scholar] [CrossRef]
- Aschmann, V.; Kissel, R.; Gronauer, A. Effizienz und Abgasverhalten von Biogasbetriebenen BHKW [in German]; Bayerische Landesanstalt für Landwirtschaft (LfL): Freising-Weihenstephan, Germany, 2007; Available online: http://www.biogas-infoboard.de/pdf/T-Band_Aschmann.pdf (accessed on 14 December 2012).
- Bauer, M.; Wachtmeister, G. Formaldehyd-Emissionen in Biogas-Verbrennungsmotoranlagen; Technische Universität München: München, Germany, 2010; Available online: http://www.lvk.mw.tum.de/download/lehrstuhl/Formaldehyd-Abschlussbericht_Teil_II.pdf (accessed on 16 December 2012).
- Ebertsch, G.; Fiedler, A. Formaldehyd im Abgas von Biogasmotoranlagen und Erdgas-Blockheizkraftwerken [in German]. Wasser Abfall 2010, 12/11, 14–20. [Google Scholar]
- Aschmann, V.; Kissel, R.; Gronauer, A. Umweltverträglichkeit biogasbetriebener Blockheizkraftwerke in der Praxis [in German]. Landtechnik 2008, 63, 77–79. [Google Scholar]
- Bayer. Landesamt für Umwelt (LfU). In Biogashandbuch Bayern-Materialienband [in German]; Kap. 2.2.2, Stand März 201; Bayerisches Landesamt für Umwelt (LfU): Augsburg, Germany, 2008; p. 13. [Google Scholar]
- Kampmann, H.J. Gas Otto-Motor oder Zündstrahl-Gas-Motor für Nutzungsmöglichkeiten und deren Einordnung. Available online: http://www.biogas-infoboard.de/pdf/H_Kampmann.pdf (accessed on 2 December 2012).
- Bundesministerium für Umwelt, Naturschutz und Reaktorsicherheit. In First General Administrative Regulation Pertaining the Federal Immission Control Act: Technical Instructions on Air Quality Control; Federal Ministry for Environment, Nature Conservation and Nuclear Safety: Berlin, Germany, 2002; pp. 96–98.
- IARC Classifies Formaldehyde as Carcinogenic to Humans; International Agency for Research on Cancer: Lyon, France, 2004; Available online: http://www.iarc.fr/en/media-centre/pr/2004/pr153.html (accessed on 27 November 2012).
- Neumann, T.; Hofmann, U. Studie zu Maßnahmen zur Minderung von Formaldehyd an mit Biogas betriebenen BHKW [in German]; Sächsisches Landesamt für Umwelt, Landwirtschaft und Geologie: Dresden, Germany, 2009; Available online: http://www.fif.mw.htw-dresden.de/forschung/Studie-Formaldehyd-BHKW.pdf (accessed on 5 October 2012).
- Moczigemba, T. Gerüche aus Abgasen bei Biogas-BHKW [in German]; Schriftenreihe des Sächsischen Landesamtes für Umwelt, Landwirtschaft und Geologie: Dresden, Germany, 2008; Available online: https://publikationen.sachsen.de/bdb/artikel/14910 (accessed on 5 October 2012).
- Gronauer, A.; Effenberger, M.; Kaiser, F.; Schlattmann, M. Biogasanlagen-Monitoring und Emissionsverhalten von Biogas-Blockheizkraftwerken—Abschlussbericht [in German]; Bayerische Landesanstalt für Landtechnik: Freising-Weihenstephan, Germany, 2003; Available online: http://www.lfu.bayern.de/energie/biogas/doc/biogasanlagen_monitoring.pdf (accessed on 10 December 2012).
- Aschmann, V.; Effenberger, M. Elektrische Wirkungsgrade von biogasbetriebenen BHKW [in German]. Landtechnik 2012, 2, 118–121. [Google Scholar]
- Effenberger, M. In vier Schritten die Schwächen aufdecken [in German]. Top Agrar 2012, 6, 8–11. [Google Scholar]
- Allianz Versicherungs AG (publ.). Bewertung des Gebrauchtölzustands von stationären Gasmotoren [in German]; Allianz Report für Risiko und Sicherheit: Allianz Versicherungs AG, Germany, 2004. [Google Scholar]
- Stationäre Gasmotoren—Beurteilung des Gebrauchtölzustands und Limitwerte [in German]; Oelcheck GmbH: Brannenburg, Germany, 2002; Available online: http://www.oelcheck.de/fileadmin/oelcheck/pdf/oelchecker/winter2002.pdf (accessed on 19 December 2012).
- Westner, G.; Madlener, R. The benefit of regional diversification of cogeneration investments in Europe: A mean-variance portfolio analysis. Energy Policy 2010, 38, 7911–7920. [Google Scholar] [CrossRef]
- Le Corre, O.; Saikaly, K.; Rosen, M.A. Effects on CHP plant efficiency of H2 production through partial oxydation of natural gas over two group VIII metal catalysts. Int. J. Hydrog. Energy 2012, 37, 10380–10389. [Google Scholar] [CrossRef]
- Mago, P.J.; Fumo, N.; Chamra, L.M. Performance analysis of CCHP and CHP systems operating following the thermal and electric load. Int. J. Energy Res. 2009, 33, 852–864. [Google Scholar] [CrossRef]
- Hinnells, M. Combined heat and power in industry and buildings. Energy Policy 2008, 36, 4522–4526. [Google Scholar] [CrossRef]
- Pourmovahed, A.; Opperman, T.; Lemke, B. Performance and Efficiency of a Biogas CHP System Utilizing a Stirling Engine. In Proceedings of International Conference on Renewable Energies and Power Quality, Las Palmas de Gran Canaria, Spain, 13–15 April 2011; Available online: http://www.icrepq.com/icrepq%2711/288-pourmovahed.pdf (accessed on 1 October 2012).
- Lemmer, A.; Bekker, M.; Oechsner, H.; Jungbluth, T. Forschungsbiogasanlage “Unterer Lindenhof” [in German]. Landtechnik 2008, 2, 80–81. [Google Scholar]
- Zacharias, F. Gasmotoren [in German]; Vogel-Verlag: Würzburg, Germany, 2001; p. 119. [Google Scholar]
© 2013 by the authors; licensee MDPI, Basel, Switzerland. This article is an open access article distributed under the terms and conditions of the Creative Commons Attribution license (http://creativecommons.org/licenses/by/3.0/).