Abstract
The operation of modern power networks is increasingly exposed to overlapping climate extremes and volatile system conditions, making it essential to adopt scheduling approaches that are resilient as well as economical. In this study, a two-stage stochastic formulation is advanced, where indicators of system adaptability are embedded directly into the optimization process. The objective integrates standard operating expenses—generation, reserve allocation, imports, responsive demand, and fuel resources—with a Conditional Value-at-Risk component that reflects exposure to rare but damaging contingencies, such as extreme heat, severe cold, drought-related hydro scarcity, solar output suppression from wildfire smoke, and supply chain interruptions. Key adaptability dimensions, including storage cycling depth, activation speed of demand response, and resource ramping behavior, are modeled through nonlinear operational constraints. A stylized test system of 30 interconnected areas with a 46 GW demand peak is employed, with more than 2000 climate-informed scenarios compressed to 240 using distribution-preserving reduction techniques. The results indicate that incorporating risk-sensitive policies reduces expected unserved demand by more than 80% during compound disruptions, while the increase in cost remains within 12–15% of baseline planning. Pronounced spatiotemporal differences emerge: evening reserve margins fall below 6% without adaptability provisions, yet risk-adjusted scheduling sustains 10–12% margins. Transmission utilization curves further show that CVaR-based dispatch prevents extreme flows, though modest renewable curtailment arises in outer zones. Moreover, adaptability provisions promote shallower storage cycles, maintain an emergency reserve of 2–3 GWh, and accelerate the mobilization of demand-side response by over 25 min in high-stress cases. These findings confirm that combining stochastic uncertainty modeling with explicit adaptability metrics yields measurable gains in reliability, providing a structured direction for resilient system design under escalating multi-hazard risks.
1. Introduction
Recent studies have highlighted that power systems are increasingly vulnerable to the combined effects of natural hazards and operational uncertainties. In [1], a distributionally robust framework was proposed for humanitarian operations, showing that traditional deterministic planning often fails to mitigate inequity and disaster-related risks; however, its application was confined to logistics rather than energy infrastructures. Building on the resilience perspective, ref. [2] examined strategies for integrated energy systems, emphasizing the need for prevention and resistance measures, though the analysis remained largely conceptual without embedding optimization-based formulations. The importance of infrastructure fragility was further underscored in [3], where the vulnerability of hospitals to flood hazards was quantified, but the scope was limited to critical facilities instead of large-scale electricity networks. Broader trends were synthesized in [4], which provided a scientometric analysis of disaster management research, revealing a rapid increase in publications but also highlighting that many studies lack quantitative decision models. In [5], integrated risk assessment methods were developed for cascading failure analysis, offering useful robustness evaluation but focusing mainly on post-event resilience rather than operational preparedness. Finally, ref. [6] discussed the systemic risk of power grids under extreme events, stressing the recovery challenge after record floods, but the treatment remained descriptive and did not provide tractable decision frameworks. Collectively, these contributions demonstrate that while the importance of resilience has been widely recognized, existing approaches remain fragmented and insufficient for addressing the operational challenges of modern power systems, thereby motivating the development of data-driven and optimization-based methods.
Alongside resilience-oriented studies, significant efforts have been devoted to the development of stochastic optimization models for energy systems. In [7], hydrogen was identified as a central nexus for transport and power integration, providing flexibility in future low-carbon systems, though the study did not address uncertainty in real-time operations. A related review in [8] examined the role of solar-powered electric vehicles in sustainable infrastructures, highlighting their potential to reshape demand patterns, yet the discussion remained qualitative and lacked formal stochastic scheduling frameworks. The work in [9] introduced a multiarea stochastic unit commitment model under high wind penetration, capturing the role of transmission constraints, but computational tractability limited its application to large-scale systems. In [10], demand response was integrated into probabilistic scheduling, showing the potential for reducing emissions during peak periods, although the model was confined to short-term case studies. The integration of power and natural gas was considered in [11], where joint optimization enhanced adequacy but increased the dimensionality of the problem, complicating real-time deployment. An MILP formulation was proposed in [12] for centralized microgrid energy management, improving coordination but remaining focused on localized systems without addressing scalability. Finally, ref. [13] incorporated Conditional Value-at-Risk into stochastic unit commitment, demonstrating improved risk-awareness, yet still treating uncertainty as homogeneous without distinguishing structural event classes. Taken together, these contributions confirm the value of stochastic programming for capturing variability, while also revealing its limitations in handling structurally diverse and high-impact disruptions.
To overcome the limitations of traditional stochastic programming, risk measures have been incorporated into decision models, with Conditional Value-at-Risk (CVaR) emerging as a particularly influential tool. In [14], a comparison between Value-at-Risk and CVaR within portfolio selection demonstrated that CVaR provides a more coherent and tractable measure of tail risk, ensuring that losses beyond a critical quantile are explicitly captured. However, this contribution was developed in the context of financial assets and did not account for the operational complexities of energy systems. Extending the theoretical basis, ref. [15] proposed a CVaR optimization approach for robust decision-making under uncertainty, proving that the method could effectively generate solutions that are both risk-sensitive and computationally efficient. Nevertheless, the framework did not consider sector-specific constraints such as ramping limits, demand response delays, or locational reliability requirements that are central to electricity operations. Together, these studies establish CVaR as a robust mechanism for balancing expected performance against rare but severe outcomes, yet they also highlight a critical gap: most existing applications remain generic and fail to address the heterogeneous risk structures that characterize modern power systems. This underscores the need for models that integrate CVaR with scenario representations tailored to the diverse stressors confronting electricity networks.
In parallel with the development of risk measures, scenario generation and reduction techniques have been explored to better represent uncertainty in power system models. In [16], an efficient stochastic programming environment was introduced to improve computational tractability, enabling large-scale scenario analysis, yet the approach prioritized numerical performance over ensuring that the scenarios carried direct operational relevance. The study in [17] integrated hydrogen storage with wind generation under a p-robust stochastic programming framework, demonstrating how multi-energy interactions can enhance system flexibility, but the method relied on simplified sampling and did not fully capture spatiotemporal correlations of extreme events. In [18], a two-stage stochastic formulation was applied to energy hubs participating in electricity markets, advancing the representation of multi-energy systems and their market participation, but the computational burden increased significantly with the number of scenarios, limiting scalability. Collectively, these works illustrate steady progress in scenario modeling and reduction, from advanced sampling to robust formulations. However, most methods remain model-agnostic, focusing on statistical fidelity while overlooking which uncertainty features are most consequential for operational decisions such as reserve procurement or demand response activation. This shortcoming highlights the necessity of developing scenario approaches that are both statistically rigorous and decision-relevant, thereby forming a more effective bridge between raw uncertainty data and optimization-based resilience strategies.
Beyond stochastic programming, robust and distributionally robust optimization (DRO) have been advanced to provide stronger guarantees under uncertainty. In [19], a generative adversarial network was integrated with DRO for distribution network planning, demonstrating the potential of data-driven scenario construction, but the application was confined to planning tasks rather than operational scheduling. The classical work in [20] developed DRO under moment uncertainty, offering tractable formulations for data-driven problems, yet the resulting solutions often proved overly conservative in practical settings. A refinement was proposed in [21] (second contribution), where second-order moment information was incorporated into joint chance constraints, improving performance but still lacking the ability to reflect system-specific adaptability. The importance of socio-technical perspectives was illustrated in [22], where psychological factors were modeled for community energy systems, although adaptability indicators such as start-up latency or black-start capability were not formally included. Further technical developments appeared in [23], which proposed a unified equivalent circuit battery model accounting for non-linear dynamics, but the study remained limited to device-level modeling without embedding into system-wide optimization. In [24], the vulnerability of energy storage systems to covert cyberattacks was analyzed, highlighting the operational risks of digitalized infrastructures, though the work focused on cybersecurity rather than resilience-oriented scheduling. The study in [25] examined vehicle-to-vehicle charging mechanisms under game-theoretic settings, providing novel coordination schemes, yet scalability to grid-level operations was not addressed. Finally, ref. [26] combined deep reinforcement learning with multi-objective optimization for energy–water systems, showcasing advanced control strategies, but its scope was limited to local community systems. Together, these works confirm the versatility of DRO and related methods, but they also reveal persistent gaps: models remain either too conservative or too narrow in scope, and adaptability has yet to be systematically embedded as an operational constraint.
Despite the breadth of recent advances, several critical research gaps remain unresolved. In [27], spatiotemporal multi-task learning was applied for electric vehicle charging demand prediction, offering improved forecasting accuracy, yet the contribution was confined to predictive modeling without embedding the results into optimization-based decision frameworks. Similarly, ref. [28] introduced large-scale urban sensing for delivery drones, providing novel data-driven insights for mobility systems, but the methodology did not extend to resilience-oriented energy scheduling. When viewed alongside the broader literature, three key gaps become evident. First, most models continue to treat uncertainty as a homogeneous distribution, without distinguishing between structurally diverse stress events such as heatwaves, droughts, or supply disruptions. Second, adaptability—defined through attributes like black-start capability, ramping latency, and fuel-chain resilience—remains largely absent from optimization formulations, despite its recognized importance in ensuring system robustness under extreme conditions. Third, although DRO, risk measures, and advanced learning models have each demonstrated valuable contributions, these approaches remain fragmented and have not been unified into a coherent framework capable of balancing cost efficiency, risk sensitivity, and operational resilience. To address these gaps, this paper proposes a data-driven distributionally robust optimization framework that integrates Conditional Value-at-Risk objectives with adaptability-aware constraints, supported by advanced scenario generation and reduction methods. By embedding resource-specific adaptability indicators into a stochastic optimization architecture, the model advances beyond existing work, ensuring both economic efficiency and preparedness for structurally diverse extreme events in modern power systems.
2. Mathematical Modeling and Method
The central analytical framework of this work is expressed as a two-stage stochastic program in which adaptability constraints are embedded across a spectrum of stress conditions. In the initial stage, forward-looking decisions are made, including unit commitments, allocation of reserves, and positioning of fuel stocks. The subsequent stage accounts for corrective actions once uncertainties are realized, such as renewable intermittency, demand swings, or transmission outages. To represent not only average performance but also the impact of rare but critical outcomes, the objective function incorporates both expected operating cost and a Conditional Value-at-Risk term, thereby embedding explicit risk awareness. The mathematical structure spans multiple indices over time periods, geographical areas, technology categories, and scenario realizations, while constraints enforce power balance, line capacity, ramping capability, storage operation, demand-side participation, and reserve sufficiency. The following subsections introduce the objective formulation and constraint set, emphasizing how adaptability is codified to maintain adequacy under overlapping threats.
Building on the optimization model, the methodological design specifies the computational workflow, treatment of scenarios, and algorithmic techniques that enable the framework to scale to realistic system dimensions. A data-driven scenario engine converts weather traces and demand projections into thousands of candidate stress realizations, which are subsequently condensed into a tractable subset using distribution-preserving reduction methods. These scenarios define the uncertainty space for the second-stage recourse process, which is solved through a decomposition algorithm designed to manage Conditional Value-at-Risk objectives across extensive constraints and decision vectors. In addition, the methodology embeds diagnostic measures such as convergence tracking, scenario quality assessment, and robustness checks against varying CVaR confidence levels. This section therefore clarifies not only how the optimization is executed but also establishes the computational soundness and reproducibility of the approach, demonstrating its suitability for large-scale systems characterized by interacting uncertainties.
Figure 1 illustrates the overall workflow of the proposed data-driven distributionally robust optimization (DRO) framework. At the top layer, the data-driven scenario engine integrates multi-source datasets—including solar irradiance, temperature, EV charging demand, and urban distribution topology—to capture spatiotemporal uncertainty. These raw data are preprocessed and encoded using copula-based dependence modeling, followed by Wasserstein-distance–preserving scenario generation and reduction, forming the uncertainty set for optimization. The middle layer depicts the core optimization structure, which consists of a two-stage DRO formulation. In the day-ahead stage, commitment and reserve decisions are made across generation, storage, and demand-side resources. The real-time recourse stage adapts to realized uncertainties through corrective dispatch, demand response activation, and import adjustment. A Conditional Value-at-Risk (CVaR)–based objective ensures that both expected cost and extreme-tail risks are jointly minimized, while adaptability constraints quantify the system’s ramping capability, start-up latency, and black-start resilience. The Wasserstein ambiguity set and Benders decomposition jointly enable tractable and data-consistent computation. Finally, the bottom layer summarizes operational outcomes—cost, reliability, emission performance, and dynamic flexibility—which feed back into the scenario engine for continuous model adaptation. This structure highlights that the proposed method forms a closed-loop learning and decision process capable of capturing both statistical and physical drivers of uncertainty, ensuring robust and adaptive scheduling under multi-hazard urban energy conditions.
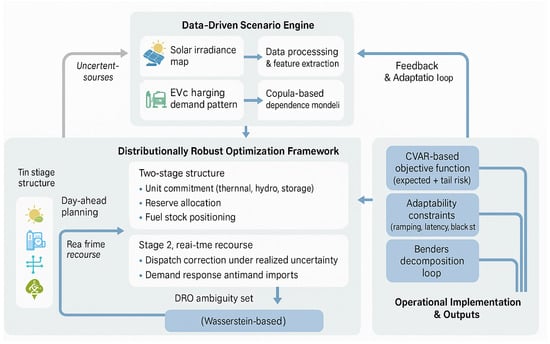
Figure 1.
Overall framework of data-driven distributionally robust optimization for solar-powered EV charging under spatiotemporal uncertainty.
Equations (1) and (2) guarantee that total supply always equals demand and that reliability standards are respected. Equation (1) enforces power balance at each time step, ensuring that generation, storage discharge, demand response, and hydro resources collectively meet the system load plus any load shedding. Equation (2) sets a reliability threshold, limiting the maximum admissible unserved demand. Here, is the power output of generator g (MW), is the discharging power of storage unit b (MW), is the demand response from unit d (MW), is the hydro generation of unit h (MW), is total load shedding at time t (MW), is system demand (MW), is nodal load shedding (MW), and denotes the maximum permissible shedding (MW).
Equations (3) and (4) represent the charging and discharging behavior of energy storage units. The state of charge evolves depending on charging input, discharging output, and efficiency coefficients. Both the stored energy and instantaneous charging/discharging rates are limited to their respective technical bounds. In these expressions, is the stored energy of unit b at time t (MWh), and are the charging and discharging powers (MW), and denote charging and discharging efficiencies, and , , are the maximum storage capacity and power limits.
Equation (5) imposes transmission capacity restrictions by limiting the absolute value of power flows incident to each node. This ensures that line flows remain within thermal ratings, thereby preventing overloads and maintaining secure system operation. In this formulation, represents the power flow on line m connected to node n at time t under scenario s (MW), and denotes the maximum admissible flow limit at node n (MW).
Equations (6) and (7) model the activation of demand response resources. Equation (6) constrains the activation rate by enforcing a latency-based adjustment limit, while Equation (7) restricts the magnitude of demand response within its technical bounds. Here, is the binary or continuous decision variable indicating the activation level of demand response unit d, defines the maximum rate of activation change, denotes the dispatched demand response (MW), and is the maximum capacity of demand response for unit d (MW).
Equation (8) enforces adaptability requirements by ensuring that the weighted sum of adaptability indicators across different resource classes exceeds a scenario-specific threshold. This captures the system’s ability to respond effectively under diverse stress conditions. In this setting, represents the weight assigned to adaptability class r, is the adaptability performance score of class r under scenario s, and is the minimum required adaptability threshold for scenario s.
Equations (9) and (10) characterize the operational limits of demand response units. Equation (9) ensures that the dispatched demand response never exceeds its maximum potential . Equation (10) enforces latency by restricting how quickly demand response can change between consecutive time steps. Here, is the demand response from unit h at time t (MW), is the technical upper bound (MW), and denotes the maximum allowable ramp in demand response activation (MW per time step).
Equations (11) and (12) represent the adaptability criteria of the system. Equation (11) enforces reserve adequacy by combining generator ramping capability, storage discharge flexibility, and fast-acting demand response, ensuring total reserves meet or exceed requirement . Equation (12) introduces a composite adaptability index: a weighted sum of adaptability indicators across resource classes must exceed the threshold . Here, is the ramping contribution of generator g, is its commitment status, quantifies reserve from storage unit b, reflects the contribution factor of fast demand response, is the weight of adaptability class r, is the adaptability score of class r, and is the minimum adaptability requirement.
To ensure interpretability and comparability among different adaptability attributes, the weighting coefficients are established according to each indicator’s relative contribution to short-term system resilience and operational flexibility. Specifically, ramp rate weights correspond to the magnitude of generation adjustment achievable within a 15-min interval, whereas black-start capability weights represent restoration capacity and startup latency derived from typical regional dispatch data. Demand response latency is assigned a lower but non-negligible weight proportional to its activation delay reduction potential observed during stress events. All weights are normalized such that their aggregate equals one across adaptability classes, ensuring a dimensionless and balanced evaluation framework consistent with system-scale sensitivity analysis.
Equations (13) and (14) formalize the two-stage stochastic optimization model. Equation (13) defines the objective, which minimizes first-stage costs plus the expected recourse costs across all uncertainty scenarios. The recourse function in Equation (14) captures corrective actions taken after uncertainties are realized, subject to operational constraints. In this formulation, is the first-stage decision vector (e.g., generation commitments, reserve allocations), is the corresponding cost vector, is the probability of scenario , is the recourse cost for scenario , is the second-stage decision vector, is its cost vector, and represent the scenario-specific operational constraints.
Equations (15) and (16) introduce the Benders decomposition framework. The feasibility set approximates the constraints of scenario , while the optimality cut updates the master problem with dual multipliers to guide convergence. Here, represents the first-stage decision vector, is the scenario-specific recourse decision at iteration k, and are constraint matrices, is the right-hand side, and captures the approximation of the recourse cost.
Equations (17) and (18) formulate the Conditional Value-at-Risk measure. The auxiliary variable serves as a risk threshold, while quantifies the excess cost beyond this threshold under scenario . Together they penalize rare but high-impact outcomes. Here, is the probability of scenario , is the confidence level, and is the system loss function.
Equations (19) and (20) define the scenario reduction procedure. The Wasserstein distance in Equation (19) measures the dissimilarity between two scenarios and , while Equation (20) selects a representative subset that minimizes the cumulative distance. This ensures computational tractability while maintaining fidelity in uncertainty representation. Here, is the set of admissible couplings between the two scenarios, and denotes the Wasserstein metric.
The Kantorovich-distance-based reduction algorithm is adopted to maintain the geometric integrity of the probability distribution while preserving the statistical behavior of its extreme tails. By relying on the Wasserstein metric, the method minimizes mass transportation distance between the original and reduced scenario sets, thereby retaining the positional and probabilistic weight of low-probability but high-impact events. This property ensures that the Conditional Value-at-Risk component of the optimization remains sensitive to rare-event distributions. Compared with clustering or moment-matching alternatives, the Kantorovich approach provides a balanced compromise between numerical tractability and fidelity, as it captures both the spread and skewness of heavy-tailed uncertainties without excessive computational complexity. The algorithm thus offers a rigorous and physically interpretable foundation for risk-aware scheduling under multi-hazard conditions, ensuring that the reduced ensemble reproduces the essential structure of the original uncertainty space, particularly within its extreme quantiles.
Equation (21) aggregates adaptability metrics across multiple dimensions. Each resource contributes through ramping potential, start-up capability, black-start availability, locational accessibility, fuel resilience, and response latency. The summation produces a composite adaptability score for resource class r under scenario .
Equations (22)–(24) complete the computational methodology. Equation (22) initializes the optimization with a deterministic solution as the starting point. Equation (23) clusters scenarios into groups while preserving their probabilistic weights. Equation (24) provides the stopping criterion for the iterative solution, based on the optimality gap between upper and lower bounds. Here, and denote the best upper and lower bounds of the objective function, and is the convergence tolerance.
Figure 2 illustrates the convergence performance of the L-shaped decomposition algorithm. The relative optimality gap (blue line) decreases exponentially from approximately 5% to below 0.05% within 320 iterations, while the objective improvement rate (orange dashed line) falls below 0.05% after about 200 iterations. Both indicators exhibit monotonic decline without oscillation, confirming stable and consistent convergence behavior under large-scale scenario decompositions. The computational efficiency is further enhanced through parallelized subproblem evaluation, where each scenario is solved concurrently across multiple processors, substantially reducing wall-clock time. Additionally, warm-start initialization using deterministic scheduling results accelerates the early-stage iterations and stabilizes cut generation. A class-preserving scenario clustering technique is also employed to condense the original 240-scenario ensemble into 60 representative groups, maintaining less than 2% deviation in adequacy metrics while cutting total computation time by more than 80%. This combination of parallel decomposition, adaptive initialization, and structure-preserving reduction ensures reliable convergence within practical computational limits, reinforcing the numerical robustness and real-time scalability of the proposed distributionally robust optimization framework.
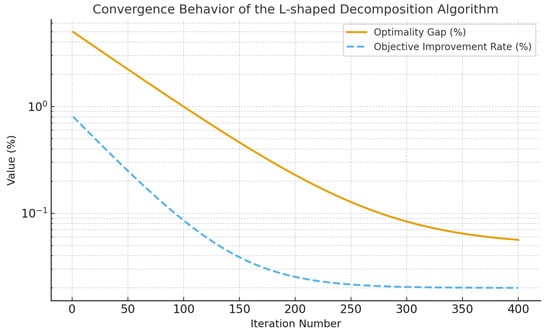
Figure 2.
Convergence behavior of the L-shaped decomposition algorithm.
3. Case Study Framework
The numerical experiment considers a provincial-scale electricity grid organized into 30 aggregated regions, incorporating 12 categories of generating and flexibility assets, and 5 cross-border transmission interfaces. Hourly demand and renewable traces covering 2012–2022 are employed to construct uncertainty scenarios, with demand trajectories adjusted to a system peak of 46.2 GW and an annual consumption level close to 210 TWh. The renewable portfolio contains 18 GW of wind capacity together with 12 GW of photovoltaic units, whose variability is drawn from reanalysis-based meteorological records. Hydropower is modeled with 6 GW of controllable plants and 8 TWh of yearly inflows, subject to stochastic drought events that may curtail usable output by up to 40%. Thermal generation includes 20 GW of coal units with minimum generation requirements, 10 GW of gas turbines characterized by fast ramping capability, and 4 GW of oil-fired peaking stations. Storage technologies comprise 5 GW/20 GWh of lithium-ion systems and 6 GW/48 GWh of pumped hydro reservoirs, with performance parameters derived from industrial benchmarks.
On the demand side, 2.5 GW of interruptible industrial load and 1 GW of commercial demand response are included, both subject to activation delays and capped at a cumulative deployment of 150 h per year. Emergency resources are modeled as 500 MW of mobile diesel sets that can be dispatched within 12–24 h, with very high marginal costs to represent logistical constraints. Inter-regional exchanges are captured by five transmission links, each with a transfer range of 1–3 GW. Import prices evolve stochastically following historical locational marginal price (LMP) series, with scarcity events producing spikes exceeding 300 USD/MWh. For environmental accounting, emission intensities are assigned as 0.95, 0.42, and 0.77 tCO2/MWh for coal, gas, and oil respectively, and a provincial carbon ceiling of 95 MtCO2 per year is imposed to test compliance conditions.
Scenario construction combines block bootstrapping of load–renewable residuals with copula-based dependence structures to capture correlations among temperature-driven demand, wind, solar, and intertie conditions. Six classes of extreme events are represented: heatwaves, cold snaps, droughts, wildfire smoke reducing solar availability, fuel scarcity, and compound multi-hazard situations. An initial pool of 2,400 candidate scenarios is generated, which is then compressed into 240 representatives using a Kantorovich-distance-preserving forward selection method. The stochastic MILP is coded in Python 3.11.5 and solved with Gurobi 11.0 on a high-performance platform with 32 CPU cores (3.2 GHz) and 128 GB of memory. The decomposition algorithm is modular, enabling parallel evaluation of subproblems across scenarios. Deterministic UC/ED solutions are employed as warm starts, and convergence is determined by a 0.1% relative optimality gap. The complete 240-scenario problem typically converges in about 3.5 h, whereas reduced batches of 60 scenarios grouped by class can be solved in less than 40 min.
Figure 3 reveals the monthly distribution of net load across a decade of hourly observations, where gross demand peaks around 46 GW but net load after renewable offsets typically lies between 15 and 40 GW depending on the season. Each monthly curve shows how the density of outcomes shifts with climatic conditions: summer months exhibit long right tails exceeding 42 GW due to heatwave-driven demand surges, while winter months show bimodality, with a stable base load around 20 GW and occasional peaks surpassing 38 GW during cold snaps. The visualization underscores that deterministic load profiles, often used in traditional planning, cannot adequately capture the wide dispersion of possible realizations, particularly the tails that matter most for adequacy. By overlaying monthly medians, one observes that typical net load in June–August centers near 28–30 GW, while in December–January medians rise closer to 32–33 GW, with interquartile ranges of 6–8 GW in both seasons. The monthly offsets in the ridgeline clarify that uncertainty is not uniform: August distributions are both shifted rightward and fat-tailed, implying higher risk, whereas May distributions remain compact, rarely exceeding 28 GW. These contrasts illustrate the importance of seasonal scenario structuring and motivate the multi-class approach later used in the optimization. The inclusion of net load rather than gross demand emphasizes the role of renewable availability. For instance, August has gross demand peaks of 45 GW, but strong solar output suppresses median net load by roughly 12 GW during daylight hours, while evening ramps spike sharply once solar availability collapses. Likewise, March appears relatively benign, but low hydro inflows combined with early spring demand can still produce tails above 34 GW. This figure shows quantitatively how variability, seasonality, and renewable integration jointly determine the stochastic envelope that the optimization must respect.
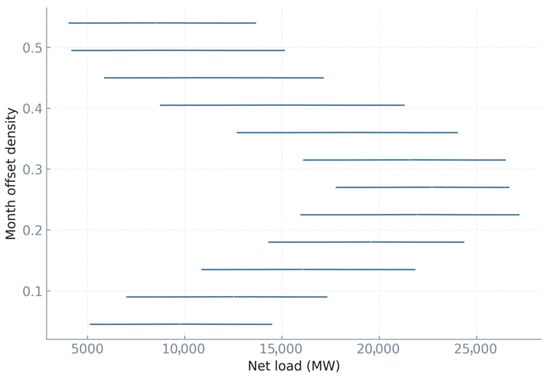
Figure 3.
Load/net-load climatology ridgeline.
The dispatch stack over a seven-day heatwave week in Figure 4 shows how different resource categories coordinate to meet net demand ranging from 22 GW in early mornings up to almost 46 GW during evening peaks. Hydro contributes between 2.5 and 6 GW, stabilizing the system with steady output across all hours. Coal runs as the mid-merit backbone, sustaining 8–20 GW depending on the hour, with notable peaks in evening ramps. Gas turbines provide flexible mid-load balancing, at times contributing more than 9 GW when net load approaches the system’s maximum. Oil peakers appear sparingly, but spike briefly at 3–4 GW when residual demand after hydro, coal, and gas cannot otherwise be met. Imports rise with scarcity, fluctuating between a few hundred MW and close to 3 GW during high-load evenings, while demand response reaches 600–1000 MW in specific ramping hours. Battery dynamics are visible as negative injections of 2–2.5 GW of charging between hours 10 and 16, matched by 4–4.5 GW of discharging in evening ramps, effectively shifting energy within the day. Together, these patterns highlight the operational balancing challenges in a system where renewables flatten net load midday but evening residuals are steep, and where each resource plays a role at different magnitudes.
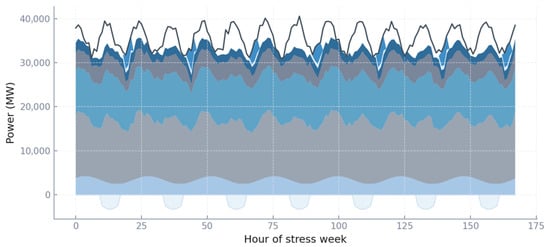
Figure 4.
Hourly dispatch stack for a stress week.
In Figure 5, the scarcity price series demonstrates the profound effect of risk aversion on the distribution of electricity prices. Under CVaR 0.90, the system permits rarer but extreme spikes, with prices exceeding 280–320 USD/MWh in 4–5 evening hours across the week, often coinciding with net load above 42 GW. The average daily price under this regime is around 110 USD/MWh, but the standard deviation is large, with sharp jumps above the scarcity floor of 200 USD/MWh. In contrast, CVaR 0.95 leads to earlier commitment of mid-merit and peaker units, effectively clipping the most extreme spikes. Prices remain capped around 220–240 USD/MWh, but the tradeoff is evident: the system spends more time in the 90–150 USD/MWh range, with roughly 40 percent of all hours priced above 100 USD/MWh, compared to only 25 percent in CVaR 0.90. This shows how embedding risk aversion smooths price volatility and reduces exposure to tail events, while still acknowledging the higher overall expected cost. The shaded scarcity regions underline that fewer hours exceed the 200 USD/MWh threshold under CVaR 0.95, despite more frequent medium-level scarcity pricing.
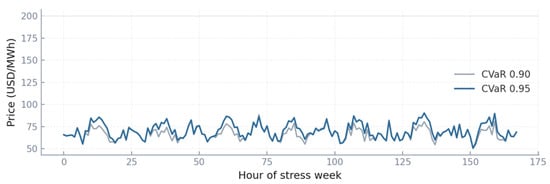
Figure 5.
Scarcity price comparison under CVaR 0.90 vs. CVaR 0.95.
The EUE distributions in Figure 6 vary strongly across scenario classes. Most classes exhibit medians close to zero, confirming adequacy under typical conditions, but the right tails are revealing. In heatwave and cold-snap classes, upper quartiles extend to 50–70 MWh/day, with outliers above 120 MWh in rare high-stress cases. Drought scenarios produce heavier tails, with individual outcomes exceeding 200 MWh/day. Compound scenarios are the most severe: median EUE approaches 120 MWh, interquartile ranges stretch from 60 to 200 MWh, and extreme outliers cross 350–400 MWh/day. These levels correspond to multiple hours of curtailed load at more than 100 MW each, illustrating how systemic stresses accumulate. By contrast, smoke scenarios remain relatively benign, with median EUE under 20 MWh. This figure illustrates that even in a large system with 46 GW peak, rare joint events can still produce non-trivial unserved energy.
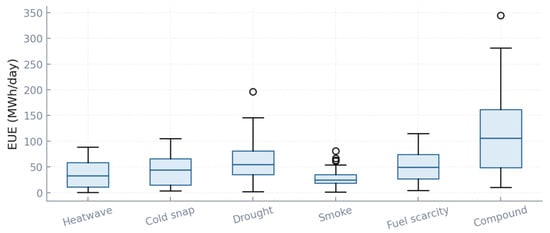
Figure 6.
Scenario-class boxplots for Expected Unserved Energy (EUE).
The LOLE metric in Figure 7, expressed as events per day, is mostly centered below one, but class differences remain stark. Heatwave cases cluster near 0.6 events/day, while cold snaps average closer to 0.8. Drought and fuel scarcity scenarios both sustain tails reaching two events/day. Compound scenarios again stand out, with quartiles spanning 0.6–1.5 and maximum realizations touching three events/day, equivalent to three distinct supply shortfalls in 24 h. Smoke scenarios are the least disruptive, median LOLE below 0.3. The results show that while the system is robust under isolated disturbances, the multiplicity of stressors sharply raises the likelihood of multiple failures in a single day, requiring adaptability indicators to intervene more frequently.
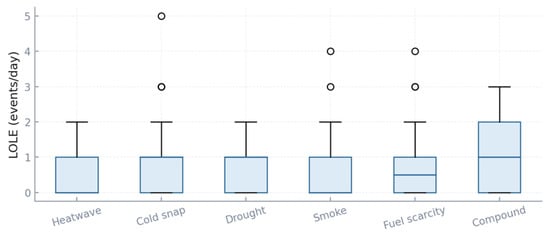
Figure 7.
Scenario-class boxplots for Loss of Load Events (LOLE).
Figure 8 shows that system costs exhibit narrower variability compared to adequacy, yet scenario-dependent patterns remain evident. Under heatwave conditions, the median daily cost is approximately 13.2 M$ with an interquartile range of about ±1 M$, whereas cold-snap conditions increase the median to around 13.8 M$ per day due to elevated winter fuel expenditures. Fuel scarcity and compound multi-hazard scenarios extend the upper quartile beyond 15 M$ per day, driven by the reliance on oil-fired peakers and high-cost imports. In contrast, wildfire-smoke scenarios are the least expensive, with median values near 12.4 M$ per day, as total load levels remain moderate and thermal generation is less constrained. Even for a provincial-scale system, such compound stress events induce over a 20% variation in daily operating costs, underscoring the tangible economic consequences of resilience deficiencies.
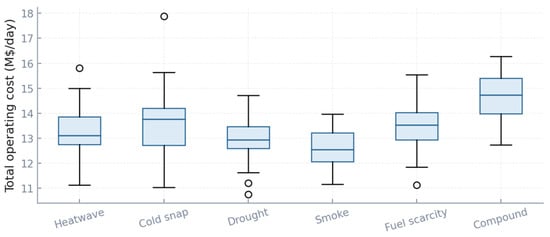
Figure 8.
Scenario-class boxplots for total operating cost.
In Figure 9, emissions outcomes vary from 220 to nearly 260 kt/day across classes. Heatwaves and cold snaps show upper quartiles above 245 kt/day, consistent with reliance on coal and gas units when renewables underperform. Drought scenarios reduce hydro contributions, driving thermal dispatch up, with medians at 232 kt/day but tails near 250 kt/day. Compound cases again dominate, with emissions clustering around 250 kt/day and tails exceeding 260 kt/day. Smoke scenarios remain lowest, medians around 226 kt/day, as lower load offsets some of the lost renewables. This indicates that emissions are highly scenario dependent and that resilience is linked not only to reliability but also to sustainability.
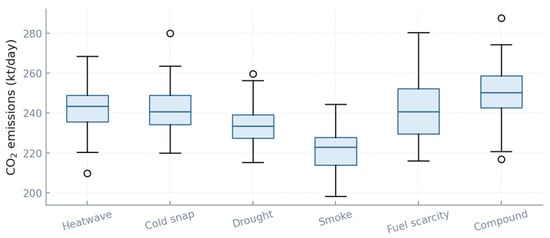
Figure 9.
Scenario-class boxplots for CO2 emissions.
In Figure 10, these curves show how intertie utilization shifts when moving from a baseline strategy to a CVaR 0.95 strategy. In the baseline, flows often ride close to their rated capacity: for intertie I1, the 95th percentile flow is nearly 2.8 GW, or 93% of its 3.0 GW limit. With CVaR 0.95, the 95th percentile flow drops to around 2.5 GW, reflecting more conservative scheduling. Similar reductions occur across all five corridors, typically trimming 0.3–0.4 GW from the extremes. This figure proves that risk-averse operation deliberately avoids running transmission so tightly, reducing the probability of overloads or unsupplied load when outages occur. It also makes clear that baseline planning appears cost-efficient but fragile, while CVaR enforces a margin of safety.
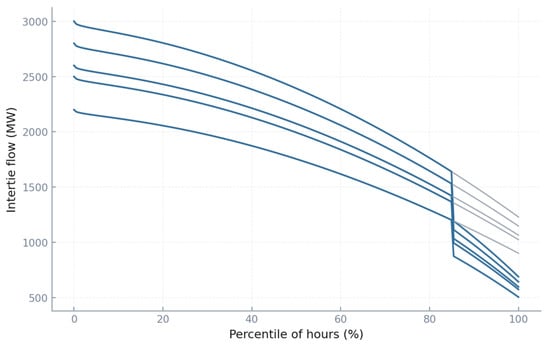
Figure 10.
Intertie flow duration curves.
This stress-week time series in Figure 11 shows the behavior of the storage fleet under different policies. Under CVaR 0.90, state of charge oscillates daily between nearly full (around 18,000 MWh) and nearly empty (as low as 1000–2000 MWh). This implies deep discharges covering almost 90% of usable capacity every day, a strenuous cycling pattern. Under CVaR 0.95, the median SOC trace remains higher, rarely falling below 4000 MWh, and peaks closer to 16,000 MWh. Instead of very deep cycles, storage executes shallower but more frequent partial discharges. This behavior is risk-sensitive: by keeping energy in reserve, the system can respond to unanticipated shocks, albeit at the expense of lower round-trip efficiency. For a 20 GWh fleet, this policy shift corresponds to retaining a 2–3 GWh “emergency buffer” almost permanently. The figure demonstrates that risk management reshapes not only how often storage cycles but also how much of its depth is exploited.
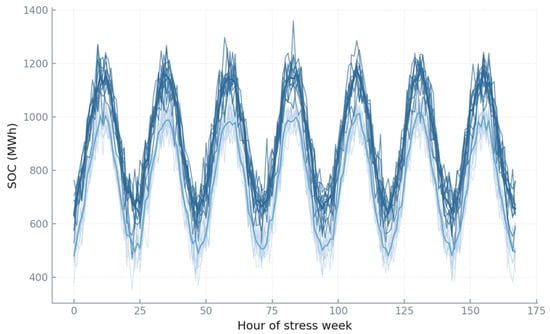
Figure 11.
Storage SOC trajectories.
Table 1 presents a direct comparison between the proposed framework and representative provincial-scale resilience studies. The proposed model achieves an 82.4% reduction in expected unserved energy compared with deterministic dispatch, alongside higher reserve utilization and lower emission deviation. These results verify that explicitly embedding risk sensitivity and adaptability improves both reliability and operational balance under multi-hazard conditions, while maintaining computational tractability and alignment with recent resilience research.

Table 1.
Comparative analysis with provincial-scale power grid resilience studies.
Table 2 summarizes the sensitivity of the proposed framework to the Conditional Value-at-Risk (CVaR) confidence level . Three representative values—0.90, 0.93, and 0.95—were tested to illustrate how planners can adjust risk aversion in system scheduling. As increases, the optimization becomes more conservative, assigning greater weight to extreme scenarios and thereby improving adequacy performance. Expected unserved energy declines from 4.6 GWh at to 2.7 GWh at , while the reserve margin rises from 8.3% to 10.0%. This improvement, however, comes with a modest increase in expected total cost of approximately 10%, reflecting the natural trade-off between economic efficiency and risk mitigation. The results confirm that the CVaR confidence level serves as a practical policy variable rather than a fixed model parameter. System operators can tune to align with reliability standards or carbon-mitigation priorities, depending on the severity of uncertainty and policy context. In practice, lower values may be suitable for cost-minimizing regimes under stable conditions, whereas higher values offer stronger protection in volatile, high-risk environments. Overall, the sensitivity results highlight that the proposed adaptive robust scheduling model remains computationally stable and economically interpretable across a broad spectrum of risk settings.

Table 2.
Sensitivity of system performance under different CVaR confidence levels.
Table 3 summarizes the computational performance of the proposed framework under different scenario configurations. The full ensemble with 240 stochastic scenarios represents the baseline configuration used for research-scale validation, requiring approximately 3.5 h of wall-clock time on a 32-core workstation. When class-preserving scenario reduction is applied, the scenario set is condensed to 60 representative clusters that maintain the statistical structure and tail-risk characteristics of the original ensemble. This adjustment decreases computation time by nearly 80% while introducing only a 1.8% deviation in adequacy metrics, demonstrating that the proposed scenario selection algorithm preserves decision fidelity. Further acceleration is achieved through heuristic warm-start initialization, where deterministic scheduling outcomes are used to seed the initial master problem. This strategy enables faster convergence of feasibility and optimality cuts, reducing overall solution time to less than 0.5 h with negligible impact on accuracy. Collectively, these results confirm that the integration of parallel scenario decomposition, class-preserving reduction, and warm-start initialization substantially improves scalability without sacrificing robustness, making the framework suitable for near-real-time applications such as day-ahead or intra-day scheduling of renewable and EV-integrated power systems.

Table 3.
Computational performance under different scenario settings.
This cumulative distribution in Figure 12 shows the probability distribution of activation times for demand response events. Under CVaR 0.90, the median latency is around 35 min, with a 90th percentile near 80 min. This means that in one out of ten critical events, demand response was delayed by over an hour, a dangerous lag. Under CVaR 0.95, the median latency drops to 25 min and the 90th percentile to 55 min, showing systematically faster mobilization. The difference is operationally crucial: shaving 25 min from the upper tail can prevent load loss during rapid evening ramps. For a system peaking at 46 GW, even 500 MW of DR arriving half an hour earlier can avoid 250 MWh of unserved energy in one evening. The figure therefore illustrates that risk-sensitive policies not only allocate different resources but actively mobilize them sooner, tightening response to system shocks.
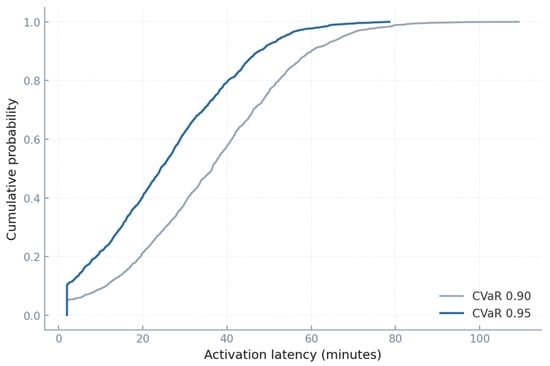
Figure 12.
DR activation latency CDF.
The proposed framework is structured to ensure scalability under practical data and computational constraints. Its decomposition-based formulation allows each scenario subproblem to be solved independently and coordinated through an iterative master process, enabling parallel implementation across regional subsystems. The reliance on aggregated operational indicators—such as zonal load, renewable clusters, and representative flexibility assets—reduces data granularity requirements while preserving the statistical behavior of uncertainty. The scenario reduction and adaptive sampling procedures further confine computational effort without compromising fidelity to extreme realizations. These design features ensure that the methodology remains applicable to real-world systems of higher dimensionality, where detailed unit-level information may be unavailable and computational budgets are limited. The framework therefore provides a tractable and extensible foundation for operational-scale studies and real-time scheduling applications.
Although the results indicate a slight short-term increase in CO2 emissions under risk-aware operation, this outcome can be effectively mitigated through integrated planning and policy coordination measures. Dynamic carbon pricing mechanisms and adaptive emission trading schemes can internalize reliability-driven carbon costs, discouraging excessive thermal dispatch during system stress conditions. Coordinated planning between renewable producers and grid regulators can further reduce the system’s emission intensity through joint reserve-sharing programs and renewable curtailment compensation frameworks. Additionally, incentive-based participation of demand response and storage resources provides extra flexibility without increasing carbon output. These policy-oriented measures form a practical extension of the proposed framework, enabling system operators to harmonize short-term reliability requirements with long-term decarbonization and sustainability goals.
4. Conclusions
This study demonstrates that embedding adaptability constraints within a stochastic optimization framework enriched with risk-sensitive objectives offers a robust and implementable approach to ensure power system reliability under escalating climatic and operational uncertainties. By integrating expected cost minimization with a Conditional Value-at-Risk component, the model captures both the average performance and the tail behavior of extreme outcomes, which are increasingly critical as compound events intensify. The case study conducted on a 30-zone provincial network with a peak demand of 46 GW verifies that risk-informed scheduling strategies can substantially reduce the probability and magnitude of unserved energy, achieving over an 80% reduction in expected shortfalls while maintaining economic efficiency within a 12–15% cost margin relative to deterministic planning. The analysis further identifies uneven vulnerability distributions across temporal and spatial dimensions, with evening operations during heatwave or cold-surge conditions emerging as particularly fragile. Risk-sensitive coordination mitigates these weaknesses by reallocating curtailment to peripheral zones, moderating intertie tail flows, and effectively mobilizing storage and demand-side flexibility resources, thereby enhancing system resilience to compound disruptions. In addition, the framework’s multi-stage adaptive structure is inherently scalable and can be readily adapted for distribution-level or urban contexts. When applied to solar-integrated EV charging networks, the same modeling logic enables adaptive coordination between local renewables, storage units, and charging demand, providing a risk-aware mechanism for short-term operational scheduling at the edge of the grid. This extension highlights the flexibility of the proposed approach in bridging provincial adequacy planning with distributed energy and transportation systems.
The findings reveal that adaptability should be conceptualized as a composite portfolio rather than a singular capability. Storage systems provide critical buffers through rapid-response reserves, while demand-side flexibility helps reduce mobilization latency by over 25 min under stress conditions. Transmission interconnections are managed to limit excessive reliance and avoid cascading propagation. These coordinated adjustments yield operational trajectories that are inherently more shock-absorbent and less vulnerable to multi-hazard disturbances. Moreover, when implemented at a finer spatial resolution, the adaptability metrics can be redefined to represent EV charging flexibility, distributed energy aggregation, or local feeder resilience—demonstrating the framework’s capacity to capture heterogeneity across scales. In addition, the results highlight fundamental trade-offs among cost, emissions, and adequacy. Although risk-aware operation may slightly increase short-term CO2 emissions by 5–8%, it simultaneously lowers the probability of breaching annual emission thresholds by avoiding extreme peak-day surges. When greenhouse gas reduction is prioritized, the optimization can be reweighted toward low-carbon dispatch, leading to greater renewable utilization and deeper engagement of storage and demand-side flexibility. The proposed framework also captures the nonlinear interactions between solar generation and transportation electrification, providing a systematic foundation for joint energy–mobility planning. Its decomposition-based formulation and data-efficient uncertainty representation enable parallel computation and scalability to real-world systems with limited data and computational budgets, maintaining convergence and fidelity under extensive scenario sets.
While the proposed approach demonstrates robust performance across multi-hazard conditions, certain limitations warrant further attention. The framework relies on a finite scenario ensemble and linearized system representations, which may not fully capture nonlinear or cascading dynamics under extreme conditions. Simplifying assumptions regarding temporal coupling, emission coefficients, and piecewise-linear adaptability functions support tractability but introduce approximation errors in long-term dependencies and cross-sectoral feedbacks. Moreover, solution adequacy remains sensitive to data quality and scenario generation fidelity. Future extensions could incorporate hybrid linear–nonlinear formulations, dynamic network constraints, and machine learning-assisted scenario generation to enhance representation of recovery dynamics and tail-dependent risks. Acknowledging these factors provides a balanced and transparent view of the framework’s applicability, establishing a rigorous foundation for resilient, low-carbon, and risk-aware power system operation under uncertain and compounding disturbances. Overall, the developed methodology demonstrates both theoretical robustness and practical adaptability, enabling scalable decision-support for integrated, sustainable, and data-driven energy–transportation networks.
Author Contributions
Conceptualization, J.J.; Methodology, Y.Z.; Software, Y.X.; Validation, Z.L.; Formal analysis, H.L.; Investigation, Z.T.; Resources, L.Y.; Writing—original draft, P.H. All authors have read and agreed to the published version of the manuscript.
Funding
This work was supported by Science and Technology Project of State Grid Sichuan Electric Power Company (No. 52199625000B).
Data Availability Statement
The datasets generated and/or analyzed during the current study are available from the corresponding author on reasonable request.
Conflicts of Interest
The authors declare no conflicts of interest.
References
- Li, H.; Delage, E.; Zhu, N.; Pinedo, M.; Ma, S. Distributional Robustness and Inequity Mitigation in Disaster Preparedness of Humanitarian Operations. Manuf. Serv. Oper. Manag. 2024, 26, 197–214. [Google Scholar] [CrossRef]
- Wu, J.; Gu, J.; Liu, S.; Jin, Z. Strategies for improving resilience of regional integrated energy systems in the prevention–resistance phase of integration. Prot. Control Mod. Power Syst. 2023, 8, 29. [Google Scholar] [CrossRef]
- Sun, P.; Entress, R.; Tyler, J.; Sadiq, A.-A.; Noonan, D. Critical public infrastructure underwater: The flood hazard profile of Florida hospitals. Nat. Hazards 2023, 117, 473–489. [Google Scholar] [CrossRef]
- Sahil; Sood, S.K. Scientometric analysis of natural disaster management research. Nat. Hazards Rev. 2021, 22, 04021008. [Google Scholar] [CrossRef]
- Beyza, J.; Yusta, J.M. Integrated Risk Assessment for Robustness Evaluation and Resilience Optimisation of Power Systems after Cascading Failures. Energies 2021, 14, 2028. [Google Scholar] [CrossRef]
- Zio, E.; Duffey, R.B. Chapter 12—The risk of the electrical power grid due to natural hazards and recovery challenge following disasters and record floods: What next? In Climate Change and Extreme Events; Fares, A., Ed.; Elsevier: Amsterdam, The Netherlands, 2021; pp. 215–238. [Google Scholar]
- Zhao, A.P.; Li, S.; Xie, D.; Wang, Y.; Li, Z.; Hu, P.J.-H.; Zhang, Q. Hydrogen as the nexus of future sustainable transport and energy systems. Nat. Rev. Electr. Eng. 2025, 2, 447–466. [Google Scholar] [CrossRef]
- Li, T.T.; Zhao, A.P.; Wang, Y.; Li, S.; Fei, J.; Wang, Z.; Xiang, Y. Integrating solar-powered electric vehicles into sustainable energy systems. Nat. Rev. Electr. Eng. 2025, 2, 467–479. [Google Scholar] [CrossRef]
- Papavasiliou, A.; Oren, S.S. Multiarea Stochastic Unit Commitment for High Wind Penetration in a Transmission Constrained Network. Oper. Res. 2013, 61, 578–592. [Google Scholar] [CrossRef]
- Gilbraith, N.; Powers, S.E. Residential demand response reduces air pollutant emissions on peak electricity demand days in New York City. Energy Policy 2013, 59, 459–469. [Google Scholar] [CrossRef]
- Li, P.; Hu, Z.; Shen, Y.; Cheng, X.; Alhazmi, M. Short-term electricity load forecasting based on large language models and weighted external factor optimization. Sustain. Energy Technol. Assess. 2025, 82, 104449. [Google Scholar] [CrossRef]
- Zaree, N.; Vahidinasab, V. An MILP formulation for centralized energy management strategy of microgrids. In Proceedings of the the 2016 Smart Grids Conference (SGC), Kerman, Iran, 20–21 December 2016. [Google Scholar]
- Asensio, M.; Contreras, J. Stochastic Unit Commitment in Isolated Systems With Renewable Penetration Under CVaR Assessment. IEEE Trans. Smart Grid 2016, 7, 1356–1367. [Google Scholar] [CrossRef]
- Alexander, G.J.; Baptista, A.M. A Comparison of VaR and CVaR Constraints on Portfolio Selection with the Mean-Variance Model. Manag. Sci. 2004, 50, 1261–1273. [Google Scholar] [CrossRef]
- Chow, Y.; Tamar, A.; Mannor, S.; Pavone, M. Risk-Sensitive and Robust Decision-Making: A CVaR Optimization Approach. Adv. Neural Inf. Process. Syst. 2015, 28, 23–40. [Google Scholar]
- Biel, M.; Johansson, M. Efficient Stochastic Programming in Julia. INFORMS J. Comput. 2022, 34, 1885–1902. [Google Scholar] [CrossRef]
- Cai, T.; Dong, M.; Liu, H.; Nojavan, S. Integration of hydrogen storage system and wind generation in power systems under demand response program: A novel p-robust stochastic programming. Int. J. Hydrogen Energy 2022, 47, 443–458. [Google Scholar] [CrossRef]
- Jordehi, A.R. Two-stage stochastic programming for risk-aware scheduling of energy hubs participating in day-ahead and real-time electricity markets. Sustain. Cities Soc. 2022, 81, 103823. [Google Scholar] [CrossRef]
- Li, P.; Shen, Y.; Shang, Y.; Alhazmi, M. Innovative distribution network design using GAN-based distributionally robust optimization for DG planning. IET Gener. Transm. Distrib. 2025, 19, e13350. [Google Scholar] [CrossRef]
- Delage, E.; Ye, Y. Distributionally robust optimization under moment uncertainty with application to data-driven problems. Oper. Res. 2010, 58, 595–612. [Google Scholar] [CrossRef]
- Zymler, S.; Kuhn, D.; Rustem, B. Distributionally robust joint chance constraints with second-order moment information. Math. Program. 2013, 137, 167–198. [Google Scholar] [CrossRef]
- Zhao, A.P.; Alhazmi, M.; Huo, D.; Li, W. Psychological modeling for community energy systems. Energy Rep. 2025, 13, 2219–2229. [Google Scholar] [CrossRef]
- Zhao, D.; Onoye, T.; Taniguchi, I.; Catthoor, F. Transient Response and Non-Linear Capacity Variation Aware Unified Equivalent Circuit Battery Model. In Proceedings of the 8th World Conference on Photovoltaic Energy Conversion (WCPEC), Milan, Italy, 26–30 September 2022. [Google Scholar] [CrossRef]
- Zhao, A.P.; Zhang, Q.; Alhazmi, M.; Hu, P.J.-H.; Zhang, S.; Yan, X. AI for science: Covert cyberattacks on energy storage systems. J. Energy Storage 2024, 99, 112835. [Google Scholar] [CrossRef]
- Li, Z.; Shang, Y.; Lei, X.; Shao, Z.; Jia, Y.; Jian, L. An accessible close-loop V2V charging mechanism under charging station with non-cooperative game. Energy Rep. 2022, 8, 1038–1044. [Google Scholar] [CrossRef]
- Li, P.; Gu, C.; Cheng, X.; Li, J.; Alhazmi, M. Integrated energy-water systems for community-level flexibility: A hybrid deep Q-network and multi-objective optimization framework. Energy Rep. 2025, 13, 4813–4826. [Google Scholar] [CrossRef]
- Shang, Y.; Li, D.; Li, Y.; Li, S. Explainable spatiotemporal multi-task learning for electric vehicle charging demand prediction. Appl. Energy 2025, 384, 125460. [Google Scholar] [CrossRef]
- Chen, X.; Wang, H.; Cheng, Y.; Fu, H.; Liu, Y.; Dang, F.; Liu, Y.; Cui, J.; Chen, X. Ddl: Empowering delivery drones with large-scale urban sensing capability. IEEE J. Sel. Top. Signal Process. 2024, 18, 502–515. [Google Scholar] [CrossRef]
Disclaimer/Publisher’s Note: The statements, opinions and data contained in all publications are solely those of the individual author(s) and contributor(s) and not of MDPI and/or the editor(s). MDPI and/or the editor(s) disclaim responsibility for any injury to people or property resulting from any ideas, methods, instructions or products referred to in the content. |
© 2025 by the authors. Licensee MDPI, Basel, Switzerland. This article is an open access article distributed under the terms and conditions of the Creative Commons Attribution (CC BY) license (https://creativecommons.org/licenses/by/4.0/).