Abstract
The numerical analysis technique is one of the primary methods for the design and development of floating offshore wind turbines (FOWTs). This study presents a detailed investigation into the influences of fully coupled and decoupled numerical analysis methods on the dynamic responses of a floating offshore wind turbine. The fully coupled analysis is implemented via bidirectional FAST-OrcaFlex co-simulation, considering the dynamic interaction between rotor operation and platform motions. The decoupled analysis is conducted using OrcaFlex for wave-induced response analysis, incorporating unidirectional imported FAST-based thrust time series. First, the numerical tools used for simulating fully coupled numerical model of OC5 DeepCwind are verified against published model test data, including free-decay test, white noise wave test and working condition test. Then, the fully coupled and decoupled numerical models are compared under wind fields of different turbulence intensities and wind speeds to reveal the dynamic coupling effects. The results indicate that the predictions of the decoupled model are more aligned with the experimental data compared to those of the fully coupled model under conditions of combined wave and steady winds. The differences between the fully coupled and decoupled models are minor under wave-only condition. However, under turbulent condition, the decoupled model overestimates surge by up to 10% and mooring tension by less than 5%, while pitch deviations can reach 17%. These findings support the use of the decoupled method in preliminary design stages—especially for mooring system optimal design—to save computational cost and time. For detailed designs involving turbulent winds, low-frequency structure response analysis or pitch-sensitive performance, the fully coupled approach is recommended to ensure accuracy. This study could offer practical guidance for selecting suitable numerical methods in FOWT design and analysis.
1. Introduction
The global energy landscape has undergone a transformative shift in recent years, characterized by the increasing contributions of renewable energy to electricity generation and steadily declining implementation costs. Current projections from the International Energy Agency (IEA) indicate that renewable sources could constitute 61% of the global electricity production by 2030, with this growth trajectory being primarily driven by the accelerated deployment of wind and solar technologies. The wind power industry in China is experiencing rapid growth, with the installed capacity of wind power expanding swiftly in recent years. This expansion is predominantly for onshore wind power, although the proportion of offshore wind power is also rising rapidly. Compared to onshore wind farms, offshore wind farms benefit from higher-quality wind, more space for wind turbines, and a reduced impact on human activities. Additionally, FOWTs are under development and have the potential to provide an economical solution for harnessing wind energy in deep waters. To date, numerous FOWT concepts have been proposed, primarily including the spar, the semi-submersible, and the tension leg platform (TLP), which are derived from designs originally used for offshore floating oil and gas platforms.
Unlike floating oil and gas platforms, FOWTs are subject not only to the excitations of waves and currents in the complex marine environment but also to the significant wind loads on rotors. The surge and pitch motions of floating wind turbine platforms exhibit a significant coupling effect with aerodynamic loads. Furthermore, as wind turbines grow larger, the tower structure becomes increasingly tall and the rotor size continues to expand, which further intensifies the coupling effect of aerodynamic loads. A FOWT consists of the rotor, tower, floating platform, and mooring system. The platform motion responses are influenced by waves, currents, and the mooring system, which alters the rotor’s wind-facing area and relative wind speed, thereby changing the rotor’s aerodynamic loads and power generation efficiency. Simultaneously, the rotor thrust is transmitted to the floating platform, causing changes in the platform’s motion and mooring tension.
The design and analysis of FOWTs require validating a large number of environmental load conditions and continuously optimizing the structure based on design objectives. This process consumes significant computational resources, time, and labor costs. In the study of FOWTs, it is recommended to use an integrated fully coupled analysis method to obtain reliable results. This method accounts for the aerodynamic loads of the upper rotor and the hydrodynamic loads of the lower platform, as well as the coupling effects of the restoring force characteristics of the mooring system. Thus, the results are more precise; however, concurrently, computational efficiency is reduced, and the computational analysis cycle is extended. Furthermore, in the actual design of floating wind turbines, the upper rotor is typically designed by the wind turbine manufacturer, whereas the lower platform and mooring system are designed and analyzed by other research institutions. Thus, achieving data interoperability for the entire FOWT during the design phase is challenging, leading to increased difficulty in conducting fully coupled integrated analysis. Due to the incomplete data, the development and analysis of floating wind turbines usually adopt decoupled analysis methods. This method has the advantage of minimizing computational workload and shortening the design cycle. Given the above, it is imperative to investigate the differences in dynamic response results between the fully coupled numerical method and the decoupled numerical method.
A number of researchers have investigated the coupled effects of FOWTs. Haselbach et al. [1] compared moments and forces at the joints of a jacket structure between a fully coupled simulation in HAWC2 and decoupled load predictions in Abaqus. Plodpradit et al. [2] studied a complex jacket wind turbine with pile–soil–structure interactions (PSSIs), finding that structural responses from a coupled analysis including PSSI are significantly lower than from a decoupled analysis. Bae and Kim [3,4] performed extensive coupled dynamic analyses to investigate the dynamic coupling effects between the rotor and floater of a mono-column TLP. Xu et al. [5] evaluated the importance of mooring line dynamics by comparing decoupled (quasi-static) and coupled (dynamic) mooring models. Kim et al. [6] compared the simulation results between coupled and decoupled methods for the 5 MW semi-submersible FOWT. Yu et al. [7] studied the fully coupled dynamic modeling of the floating offshore wind turbine drivetrain and discussed its boundary condition setting for the decoupled drivetrain analysis to improve decoupled simulation efficiency and accuracy. While low-order modeling techniques integrating Blade Element Momentum (BEM) theory with potential flow model are frequently used due to low computational costs, they compromise some accuracy [8]. Computational fluid dynamics (CFD) provides a more sophisticated alternative for modeling intricate flow mechanisms and capturing free surface effects with greater accuracy. This method offers a more detailed and reliable understanding of the hydrodynamic loads and motion responses of FOWTs, particularly in scenarios involving complex geometries and nonlinear wave-structure interactions. Huang et al. [9,10] carried out coupled aero-hydrodynamic simulations of a spar FOWT with a CFD analysis tool FOWT-UALM-SJTU to investigate the interaction between the aerodynamic loads and different single DOF platform motions. Recent reviews by Xu et al. [11], Zhang et al. [12], and Haider et al. [13] have comprehensively summarized CFD applications in FOWTs, including comparisons between fully coupled and decoupled analyses. However, despite these advancements, a comparative study between fully coupled and decoupled methods, particularly one that is rigorously validated against experimental data and investigates the influence of key environmental parameters like turbulence intensity across a range of wind speeds, remains limited. Many existing comparisons lack comprehensive experimental validation, leaving the practical accuracy and applicability boundaries of the computationally efficient decoupled method insufficiently defined. This study aims to address this gap by presenting a validated numerical model and conducting a detailed comparison of the dynamic responses predicted by fully coupled and decoupled methods under various wind and wave conditions, thereby providing clearer guidance for their application in design stages.
The investigation of FOWT performances commonly utilizes a combination of theoretical analysis, numerical simulation, and experimental techniques. Results from the scaled model experiment not only validate the accuracy and reliability of the numerical modeling method but also provide critical empirical foundations for establishing robust analytical frameworks for FOWT system dynamics. FOWT model tests are conducted by many universities and institutes, with scale factors ranging from 1/130 to 1/22.5. However, much of the test data is unavailable to researchers interested in numerical model validation. Both the Offshore Code Comparison Collaboration, Continued (OC4) project and its continuation, OC5, involve the DeepCWind project, and the relevant design and model test data are available. NREL 5 MW wind turbine [14] is used in the OC4 project, but the geometrically scaled wind turbine did not perform well in the low-Reynolds-number wind condition for the model test. A performance-scaled version of the NREL 5 MW wind turbine is used in the OC5 model test, and it is proven to have better scaled thrust and torque loads [15]. Thus, the OC5 DeepCwind is utilized in this study, and the fully coupled numerical model is verified by comparing with model test data.
In this study, the rotor thrust of the decoupled numerical method is analyzed and calculated by a fixed wind turbine, and then the thrust time history is loaded onto the tower of the floating wind turbine model, with the rotor mass replaced by an equivalent mass point. Compared to the fully coupled numerical method, the decoupled method does not consider the relative motion between the floating platform and the upper rotor. The theoretical methodology of the numerical analysis method is introduced in Section 2, and the numerical model verification against model tests is given in Section 3. Then, the comparative research work on the fully coupled numerical method and decoupled numerical method is conducted, and the feasibility and accuracy of the decoupled numerical method are verified. The differences in the FOWT dynamic performances between fully coupled and decoupled numerical models under various environmental conditions are evaluated. The influences of turbulent intensity and wind speed are investigated, and the interaction effects between the platform and rotor of the FOWT are discussed. Finally, the applicability and reliability of different coupled methods are concluded.
2. Theoretical Methodology
2.1. Numerical Analysis Methods
For the FOWT, there is a strong interaction between the floating platform and wind turbine in terms of loads and induced responses when the rotor is operational. Platform motions of the FOWT affect the effective rotor area and significantly alter the aerodynamic performance. Correspondingly, aerodynamic loads of the wind turbine will induce and affect platform motions, which will change the wave radiation forces and the viscous damping loads. Therefore, the interference effects between the floating platform and wind turbine make the FOWT system responses more sophisticated.
The coupled numerical simulation in this study is conducted by integrating FAST v8.0 and OrcaFlex 10.3 through the use of a dynamic link library (DLL). OrcaFlex is a commercial hydrodynamic software that specializes in the dynamic analysis of floaters and mooring systems, which have been extensively validated [16]. FAST is an open-source aero-hydro-servo-elastic wind turbine simulation software, utilized for calculating the dynamic responses of horizontal-axis wind turbines.
For the coupled numerical model, hydrodynamics and mooring loads are analyzed in OrcaFlex, while the aerodynamics and servo-controlled dynamics of the RNA (rotor-nacelle-assembly) are computed by FAST. For coupling implementation, a special DLL is required, and the bidirectional data exchange between FAST and OrcaFlex is facilitated through the OrcaFlexInterface module within FAST. The simulation operates with synchronized time steps. At each time step, FAST transmits the platform’s positions, orientations, and velocities in six degrees of freedom (6 DOF) to OrcaFlex. Subsequently, OrcaFlex calculates all hydrodynamic and mooring loads and returns them to FAST in the form of an added-mass matrix and load vector [17]. In addition, before the time-domain analysis in OrcaFlex and FAST, the frequency-domain hydrodynamic analysis is conducted by the diffraction/radiation preprocessor AQWA. The hydrodynamic coefficients, including added mass, radiation damping, first-order wave load transfer functions, and second-order wave force QTFs (Quadratic Transfer Functions) of the FOWT obtained from AQWA, are transferred to OrcaFlex for time-domain analysis.
For the decoupled numerical model, time-domain analysis is performed solely in OrcaFlex, with the tower and rotor treated as part of a rigid platform hull. The time-varying wind loads are replaced by a thrust time series applied at the hub center, with the mean thrust set equal to that measured in the model test. This thrust time series is precomputed using FAST, based on a tower-base-fixed 5 MW wind turbine that shares the same tower and rotor configuration as the OC5 DeepCwind. Unlike the fully coupled model, the blades, nacelle, and hub in the decoupled model are represented as point masses. Consequently, the relative motion between the platform and the turbine, as well as the influence of turbine attitude on wind loads, are not considered.
The schematic diagrams illustrating the modeling strategies for the fully coupled and decoupled numerical methods are presented below (Figure 1):
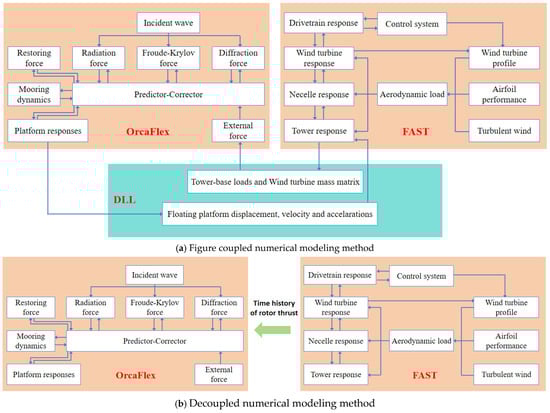
Figure 1.
Fully coupled/decoupled numerical modeling methods.
2.2. The Dynamic Equation of the FOWT Motion
Both potential theory and drag term of Morison’ equation are used to calculate the hydrodynamic loads in this study, and the motion equation for the whole floating wind turbine in the time domain can be written as [18]
where , , are the motion, velocity, and acceleration vectors, respectively. M is the mass matrix of the body. is the added mass matrix at infinity frequency. is the retardation function matrix, calculated from frequency-dependent added mass and damping coefficient matrices. C is the hydrostatic restoring matrix. K(x(t)) is the restoring stiffness matrix. is the Froude–Krylov force; is the diffraction force; is the aerodynamic force; is the viscous drag force; is the mooring force.
The wave loads on an FOWT can be expressed as a sum of linear first-order and nonlinear second-order terms. The first-order load is considered as the sum of each individual wave component contribution. The second-order load is quadratic with wave amplitude and consists of contributions from each wave pair component, and can be divided into difference frequency terms and sum frequency terms, both of which are considered in this study. The second-order difference frequency load is also known as wave drift load, consisting of mean wave drift load and the slowly varying drift load. The second-order wave loads are described in OrcaFlex with full QTF method in this study, and the second-order difference frequency wave loads can be represented as
where R means the real part, is wave drift QTF for wave component i and j, and are wave directions, and are wave periods, and are wave amplitudes, and are wave frequencies, and and are wave phases.
2.3. Analysis Methods for the Rotor and Tower
For a coupled numerical model, the tower and blades are modeled in FAST by defining the distributed mass and stiffness, and the nacelle and hub are modeled as rigid bodies with appropriate lumped mass and inertia. The relative motion between the platform and turbine is considered. The blade models in FAST are based on a mode-superposition method for straight Euler-Bernoulli beams with bending only. The solution is only applicable to moderate deflections. FAST can analyse the flexibility of blades and towers by using a linear model representation that assumes small deflections with each other. Since blades in the model test were manufactured using relatively thick layers of carbon fiber, the blades were assumed to be rigid in the numerical model.
In this study, the BEM theory is used for calculating the wind-induced effect on blades, and several corrections to the BEM theory in FAST are taken into account, including tip-loss and hub-loss models to account for vortices shed, and the skewed wake correction model to account for the effects of incoming flow that is not perpendicular to the rotor plane. Despite its computational efficiency and utility in predicting overall rotor performance, the BEM theory has recognized limitations. It struggles to accurately simulate complex flow conditions, including dynamic stall (characterized by unsteady flow separation and delayed lift loss) and high yaw angles (which induce asymmetric inflow and complex separation). These limitations stem from BEM’s fundamental assumptions of steady-state flow and its simplified treatment of aerodynamics. In addition, the semi-empirical Beddoes–Leishman model is used for dynamic stall. The wind condition could be steady or turbulent, and when turbulent wind is considered, three-dimensional and time-varying wind data are produced by the NREL simulation code, TurbSim [14].
For a decoupled numerical model, the effect of blade-to-tower interaction is not considered; the tower is simulated as a conical tubular steel construction with a ‘homogeneous pipe’ line type option in OrcaFlex, and the rotor is simulated as a lumped mass. The wind loading applied to the rotor is replaced by a time-series thrust of the same mean value as that in the physical test.
2.4. Analysis Methods for Platform and Mooring System
Herein, a hybrid combination of a potential-flow-based approach with additional viscous drag computed via Morison’s equation is used in both coupled and decoupled numerical models. The potential flow models use radiation and diffraction matrices derived from AQWA.
The OC5 DeepCwind floating wind turbine is moored by a catenary line system, which leads to the natural periods of horizontal and vertical motions being much larger than representative wave periods. Therefore, resonant surge and pitch motions can be excited by difference frequency second-order wave loads, which are considered in this paper by using full QTFs in six DOFs. In this study, the lumped-mass method is used through OrcaFlex to analyze dynamic mooring forces. The line is discretized into a series of massless segments with n lumped-mass nodes in the mooring line end. The bending and twisting stiffnesses of mooring lines are assumed to be negligible. Thus, each segment only models the axial properties of the mooring line, and the axial stiffness and damping in the line segment are modelled by a spring-damper.
3. Validation of the Numerical Model
3.1. Model Description
The OC5 DeepCwind project primarily focuses on validating modeling tools of the FOWT by comparing the dynamic responses from numerical simulations to those from physical tests, as provided by MARIN [19]. The wind turbine used in the OC5 model test is a performance-scaled version of the NREL 5-MW wind turbine developed by MARIN, named the MARIN stock wind turbine (MSWT). In model tests, wind turbines operate at a constant revolutions per minute (rpm), constant blade pitch, and fixed nacelle yaw. The scale of the model test is 1/50, and all the result data presented in this paper are in full scale. Figure 2 illustrates the overall structure and top view of OC5 DeepCWind, with the reference origin of coordinates positioned at the centerline of the main column on the mean water level (MWL). The mooring system consists of three catenary mooring lines, with adjacent mooring lines spaced 120 degrees apart. Table 1 summarizes the global system parameters of OC5 DeepCwind, and further details, including parameters of the tower, rotor-nacelle-assembly (RNA), floating platform, and mooring system, are available in the literature [20].
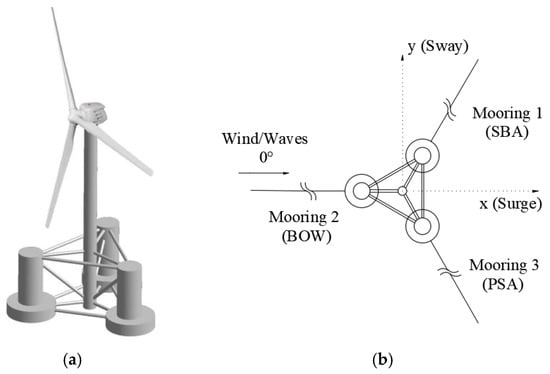
Figure 2.
Description of OC5 DeepCWind, (a) The overall structure (b) Top view [21].

Table 1.
Global system parameters of OC5 DeepCwind.
3.2. Free Decay Test
The natural vibration periods and damping in each degree of freedom of the numerical model can be verified through free decay test results. The tests are conducted in still water with the wind turbine rotor parked. In the model tests, the cable bundles of measurement sensors installed on the floating wind turbine model introduce certain constraints, thereby affecting the measurement results of the natural vibration periods in surge and sway. Therefore, corresponding linear stiffness matrices are incorporated into the numerical simulations to reduce errors in system stiffness. According to literature [22], additional stiffness is primarily required in the surge and sway directions, set at 5000 N/m and 7000 N/m, respectively. For a cylindrical body in steady flow, the mean drag coefficient Cd depends on the Reynolds number and the cylinder diameter. Since the Reynolds number in the model tests differs from that of the full-scale system, the tangential and axial drag coefficients of the floating platform columns, cross braces, and diagonal braces in the numerical analysis are adjusted to modify the quadratic drag. The tuning process based on free decay and the selection of relevant drag coefficients can be referred to in the literature [23].
The authors’ previous work demonstrates a good agreement between model tests [24] and numerical simulations for the free decay characteristics in surge, heave, and pitch, as seen in Figure 3 and Table 2. This indicates that the natural vibration periods and damping characteristics of the tests and simulations correspond well.
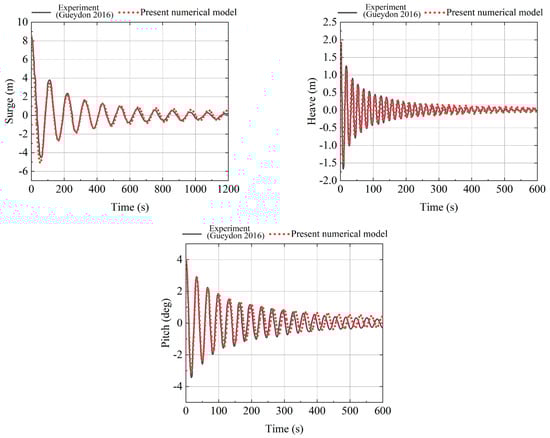
Figure 3.
The free decay curves of surge, heave, and pitch [24] (adapted from [25]).
Table 2.
Natural periods of OC5 DeepCwind.
3.3. Motion Response Amplitude Operators (RAOs)
In the model tests, motion RAOs were obtained through white noise tests22. The wave height for this white noise test is 10.5 m, with a wave period range of 6–26 s. The numerically simulated RAOs are calculated based on a series of regular wave excitations, with the wave period range also set at 6–26 s. To achieve steady-state results, the computation duration is 3600 s. The comparison of motion RAOs between the experimental model and numerical model in Figure 4 shows there is good agreement in the surge decay curve, while differences exist in heave and pitch within 0.1–0.4 rad/s, and good agreement is observed in other frequency ranges. The observed discrepancies may be attributed to the following two aspects: (1) The white noise waves are used in the model test, whereas regular waves are employed in the numerical model. This difference in wave excitation mechanisms could account for variations in results at specific frequencies; (2) the hydrodynamic numerical model, developed based on linear potential flow theory and indirect time-domain methods, may exhibit inherent limitations in simulating nonlinear effects. Overall, the numerical model’s motion RAO demonstrates good agreement with experimental results within the wave frequency range.
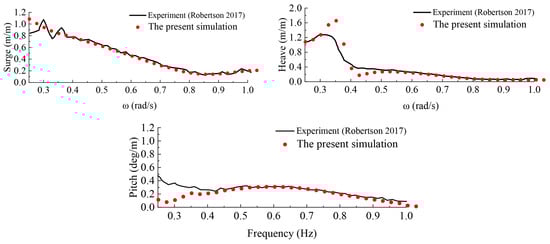
Figure 4.
Motion RAOs (surge, heave, and pitch) [20].
3.4. Time-Domain Analysis
This section primarily conducts a comparative analysis of time-domain dynamic responses between the physical scale model and numerical simulations, focusing on two operational scenarios, Case R1 (irregular wave-only condition) and Case R2 (combined irregular wave-wind condition) as specified in Table 3. In Case R2, the wind turbine pitch angle is maintained at 1°, and the rotational speed of the wind turbine is 12.1 rpm. Vhub represents the wind speed at the hub center height; Tmean represents the average rotor thrust; HS is the wave height; TP is the wave period, and γ is the spectral peak factor.
Table 3.
Environmental conditions.
3.4.1. Irregular Wave-Only Condition
As shown in Figure 5, the surge, heave, and pitch motion responses of the experimental model and the numerical model are basically consistent within the wave frequency range. In the low-frequency range, the surge and pitch responses of the experimental model are greater than those of the numerical model. It is noted that the instrument cable used to send information from the measurement sensors to the data acquisition system in the OC5 DeepCwind model test is a significant source of the uncertainty [26]. Furthermore, the wind turbine used in the model test is a performance-scaled turbine, which has a different blade geometry (airfoils), mass distribution, and pitch settings from the full-scale NERL 5 MW wind turbine modelled in the numerical model. The random uncertainty could also be related to the wind variation in the model test. There is a discrepancy in the spatial distribution of the wind field across the rotor between the model test and the numerical simulation, leading to different aerodynamics. The response differences between the experiment and numerical simulation could be caused by the aforementioned reasons.
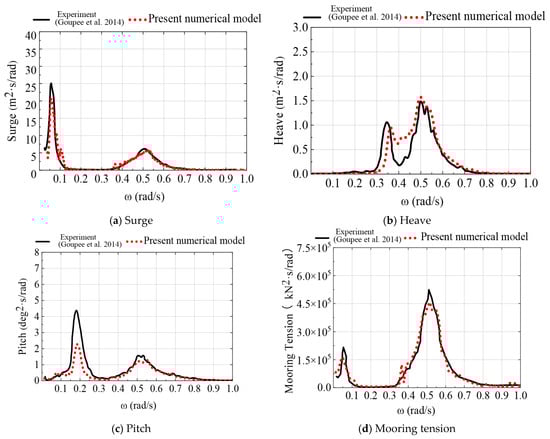
Figure 5.
Response spectra of surge, heave, pitch, and mooring tension in Case R1 [19] (adapted from [25]).
As shown in Table 4, under the wave-only condition, compared with the experimental model, the motion response amplitude of the numerical model is smaller, with the surge maximum being 9.9% smaller and the pitch maximum being 11.7% smaller. Figure 5d shows the tension response spectrum curve of the mooring line 2, from which it can be seen that the mooring tension response of the experimental model is slightly greater than that of the numerical results. According to Table 4, the mooring tension maximum of the numerical model is 0.67% larger than that of the experimental model, and the statistical results of the mooring tension for both show good agreement.
Table 4.
Time domain response statistics in Case R1.
3.4.2. Combined Irregular Waves and Wind Condition
Figure 6 presents the time-domain response results of motion and mooring line tension for the FOWT under the combined irregular waves and steady wind. As can be seen, the experimental and numerical response results are basically consistent within the wave frequency range, and the surge and pitch responses of the experimental model are both greater than the numerical simulation results within the low-frequency range. The difference between the experimental and numerical heave response results is not significant within the wave frequency range. By comparing Figure 5 and Figure 6, it can be observed that the wave frequency motion response under the combined waves and wind condition is close to that under the wave-only condition. The surge and pitch low-frequency responses under the combined waves and wind condition are both smaller than those under the wave-only condition, indicating that wind primarily affects the low-frequency response and has an inhibitory effect on the motion amplitude. For the mooring line tension, the experimental and numerical response results are in good agreement. According to Table 5, compared with the experimental statistical results, the numerical results show a 1.72% reduction in surge amplitude and a 2.62% decrease in mean value; a 5.14% reduction in pitch amplitude and a 6.54% decrease in mean value; and a 7.22% reduction in mooring line tension amplitude and a 6.46% decrease in mean value. Overall, the experimental model response results are slightly greater than those of the numerical model using by fully coupled method, but they correspond well, proving the feasibility and accuracy of the fully coupled numerical simulation method presented in this section.
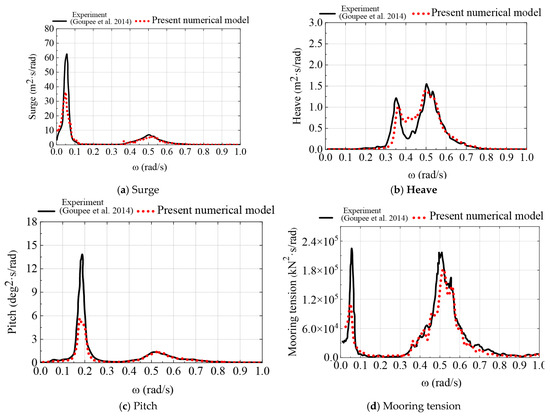
Figure 6.
Response spectra of surge, heave, pitch, and mooring tension in Case R2 [19] (adapted from [25]).
Table 5.
Time domain response statistic comparison in Case R2.
4. Comparative Study of Coupled and Decoupled Analysis Methods
4.1. RAOs and Dynamic Response Results
Figure 7 and Figure 8 present the motion RAOs and dynamic response results of the FOWT with the fully coupled numerical method and decoupled numerical method, respectively. Table 6 shows the time-domain statistical results for different coupled models, and the Case R1C and Case R1U represent the fully coupled numerical model and the decoupled numerical model under the Case R1 environment condition, respectively. From this, it can be observed that the response results of both the fully coupled and decoupled numerical models are basically consistent under the wave-only condition. This is because the calculation of wave loads and motion responses in both the fully coupled and decoupled numerical models is based on the same theoretical method, as well as the hydrodynamic model being consistent. Furthermore, comparing Table 5 and Table 6, it is shown that the experimental results of motion response and mooring tension are consistently larger than the predictions from the coupled numerical model. Meanwhile, the decoupled model, which is computationally cheaper and generally considered less accurate, produces results that are also larger than the coupled model under combined irregular waves and wind conditions. This indicates that the decoupled model’s predictions are actually closer to the experimental data than the fully coupled model in some specific conditions.
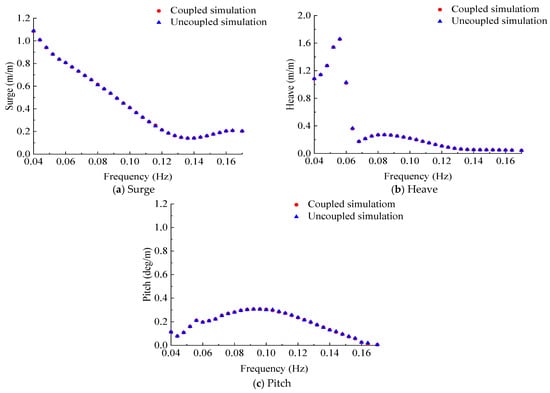
Figure 7.
Surge, heave, and pitch RAOs.
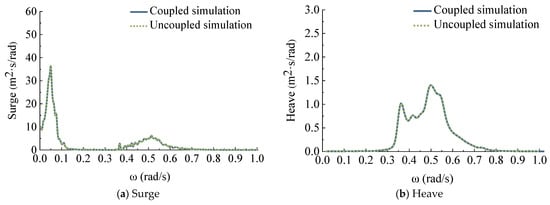
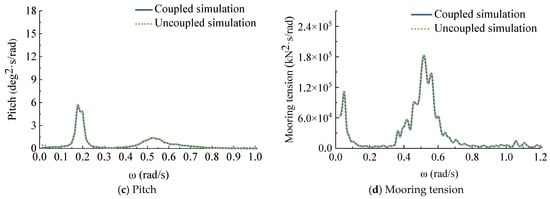
Figure 8.
Dynamic response comparison of surge, heave, pitch, and mooring tension under wave-only conditions.
Table 6.
Statistical results of coupled and decoupled numerical models.
4.2. Different Turbulence Intensities and Wind Speeds
The main difference between the fully coupled and decoupled numerical models lies in the adoption of different rotor thrust loading methods. The response differences in the two numerical model systems mainly come from the inconsistent aerodynamic loads and the differences in the relative motion between the rotor and the floating platform. Therefore, it is necessary to analyze the influence of different wind excitation parameters. This section investigated the effects of different turbulence intensities and wind speeds on the dynamic response of the FOWT with the fully coupled and decoupled modeling method. Generally, the wind turbine generates maximum thrust at the rated wind speed; thus, this section considers different turbulence intensities at the rated wind speed of 11.4 m/s, as shown in Table 7. Among them, Case iC (i = 2~5) represents the fully coupled numerical model, and Case iU (i = 2~5) represents the decoupled numerical model. In addition, TI stands for turbulence intensity, and the turbulent wind adopts the Von Karman spectrum. The average rotor speed is 12.1 rpm, and the average blade pitch angle is set to 1°. The wave is modeled with the JONSWAP spectrum. The duration of the time-domain dynamic analysis is 3 h, and the time-domain statistical results are the mean values calculated from eight different random wave seeds. In this section, the time steps for both fully coupled and decoupled numerical models are set to be consistent, both at 0.02 s.
Table 7.
Environmental parameters in different conditions.
Figure 9 indicates that within the low-frequency range, the surge response peak of the decoupled numerical model is slightly smaller than that of the fully coupled numerical model, whereas the pitch response peak is significantly reduced. Compared to the surge response, the impact of the two modeling methods on the pitch response is more obvious. The turbulence intensity has less effect on the motion response within the wave frequency range, mainly affecting the response results within the low-frequency range. As the turbulence intensity increases, the peak value of the surge and pitch low-frequency response also rises. This indicates that the wind load mainly affects the low-frequency motion response of the FOWT. Additionally, Figure 9 shows that the surge and pitch response peaks under the turbulent wind at the natural frequency are much greater than those under steady wind, and the difference in pitch response results between the fully coupled model and decoupled model is more pronounced. From Figure 9d, it is known that turbulence intensity also affects the mooring tension response within the wave frequency range, with greater turbulence intensity resulting in a smaller response peak. In addition, different coupled analysis methods and turbulence intensities have a very small impact on heave.
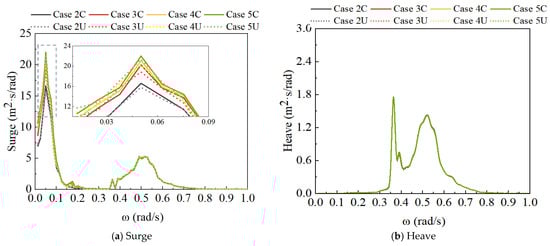
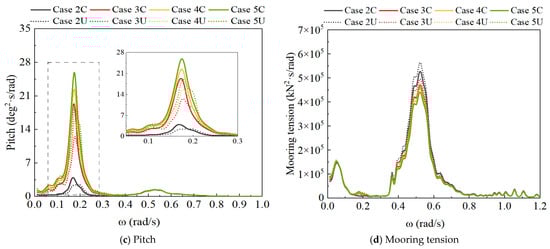
Figure 9.
Surge, heave, pitch, and mooring tension response spectra.
By representing the RNA as point masses and neglecting the relative motion between the platform and the turbine, the decoupled model fails to capture two key coupled dynamics. First, the aerodynamic damping effect, which arises from the relative velocity between the moving platform and the incoming wind, is absent. In the fully coupled simulation, as the platform moves forward, the relative wind speed at the rotor decreases, leading to a reduction in thrust maximum and a damping effect on the pitch motion. The decoupled model, with its fixed thrust time-series and rigid body assumption, cannot reproduce this stabilizing mechanism. Second, the decoupled model does not account for the influence of platform motions on the aerodynamic loads via changes in the rotor’s effective inflow angle. This omission is especially critical under turbulent wind conditions, where the complex interplay between platform motions and wind field variations amplifies the response differences. Therefore, the larger deviations in pitch response, as opposed to surge and mooring tension, underscore that the decoupled method’s simplifications most significantly impact degrees of freedom strongly coupled with aerodynamic loads.
Figure 10, Figure 11 and Figure 12 show the response result statistical graphs of surge, pitch, and mooring tension with different turbulence intensities. With steady wind and turbulence intensities of 0.12, 0.16, 0.20, the surge maximum of the decoupled numerical model is 1.18%, 3.01%, 3.42%, and 3.47% larger than those of the fully coupled numerical model, respectively. Evidently, the surge maximum of the decoupled numerical model is larger than that of the fully coupled numerical model, and the surge response difference increases with the increase in turbulence intensity. Additionally, both the surge maximum and mean values decrease with the increase in turbulence intensity. This is because, under the full-load wind speed condition, the wind load will decrease if the wind speed is greater or less than the rated speed, and the greater the turbulence intensity, the higher the probability that the wind speed will deviate from the rated wind speed over time. The wind load under steady wind excitation is larger than that under turbulent wind excitation. In addition, when the aerodynamic excitation is coupled with hydrodynamic loads, it results in reduced environmental load extreme values and a smaller surge maximum. As illustrated in Figure 11, the range of surge variation expands with the increase in turbulence intensity.
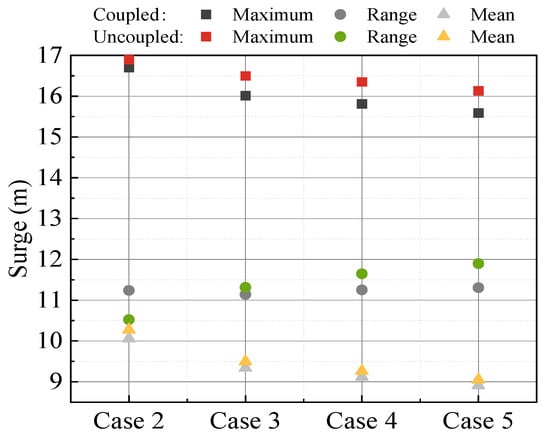
Figure 10.
Surge statistic comparison under different turbulence intensities.
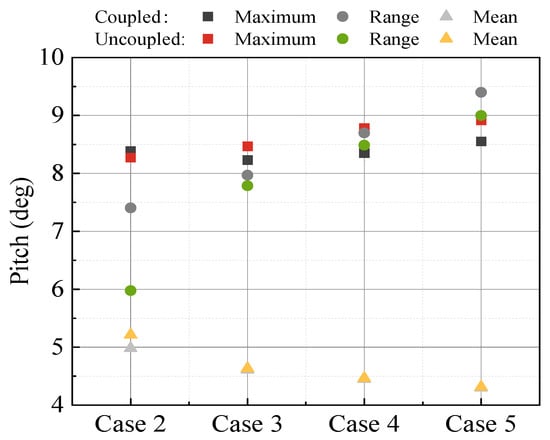
Figure 11.
Pitch statistic comparison under different turbulence intensities.
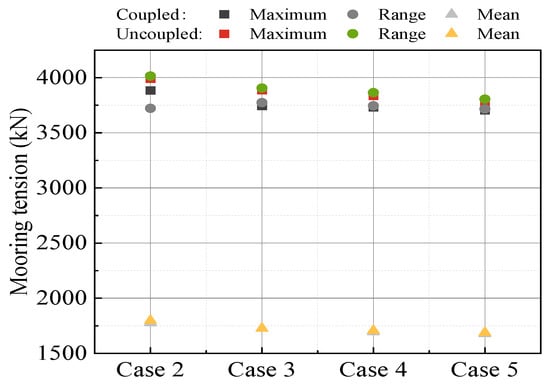
Figure 12.
Mooring tension statistic comparison under different turbulence intensities.
As the turbulence intensity increases (0, 0.12, 0.16, and 0.20), the differences in the pitch maximum between the decoupled numerical model and the fully coupled numerical model become more pronounced, which are −1.39%, 2.89%, 5.19%, and 5.01%, respectively. The overall trend of the pitch maximum is to increase, with the response results of the decoupled model being greater than those of the fully coupled model. Compared to the surge, different coupled methods have a greater influence on pitch. At the rated wind speed, the difference in the motion response between the two coupled analysis methods under turbulent wind excitation is greater than that under steady-state wind excitation. It is because, with the action of the wind turbine controller, the increase or decrease in turbulence intensity at the rated wind speed will lead to a reduction in wind thrust and lower the extreme values of wind loads. This also explains the phenomenon in Figure 12, where the greater the turbulence intensity, the smaller the statistical value of the mooring tension. The mooring tension maximum under turbulence intensities of 0.12, 0.16, and 0.20 decreased by 2.63%, 3.88%, and 5.25%, respectively, compared to that under steady winds. The maximal mooring tension in the decoupled numerical model is slightly greater than that in the fully coupled numerical model (Figure 13).

Figure 13.
Percentage differences between fully coupled and decoupled numerical models (the maximum values of surge, pitch, and mooring tension).
This section also conducts a comparative study on the motion and mooring tension responses of the two coupled modeling methods under different wind speeds. The wave conditions are presented in Table 7, and the wind condition is modeled with a turbulence intensity of 0.16. There are 7 conditions, ranging from Case 6 to Case 12, which correspond to wind speeds of 4.5 m/s, 6.2 m/s, 8 m/s, 9.7 m/s, 11.4 m/s, 16 m/s, and 33.6 m/s. The maximum and mean values in the time domain of surge, pitch, and mooring tension are shown in Figure 14, Figure 15 and Figure 16, respectively. It can be seen that under different wind speeds, the difference in pitch response is greater than that in surge response between the fully coupled model and the decoupled model. In addition, the difference in statistical values of mooring tension of the fully coupled model and decoupled model under different wind speeds is not significant, and the maximum difference between the two models occurs in Case 11, which is 4.77% (Figure 17). Therefore, during the preliminary analysis and optimization design phase of the mooring system of the FOWT, the decoupled numerical simulation method can be adopted to improve computational efficiency, and the response results of mooring tension are slightly different from those of the fully coupled numerical simulation method.
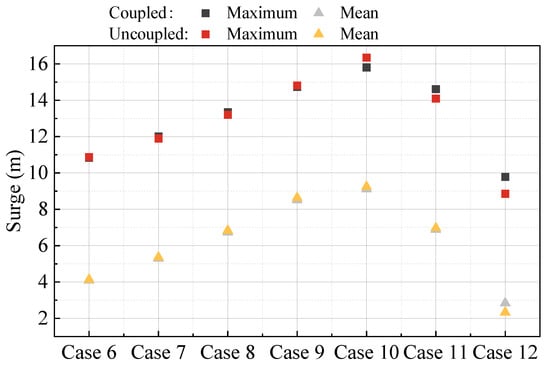
Figure 14.
Surge statistic comparison under different wind speeds.
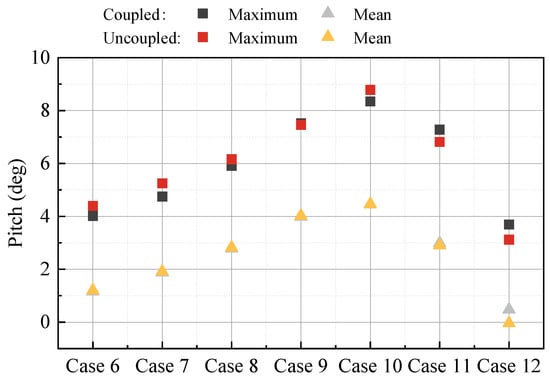
Figure 15.
Pitch statistic comparison under different wind speeds.
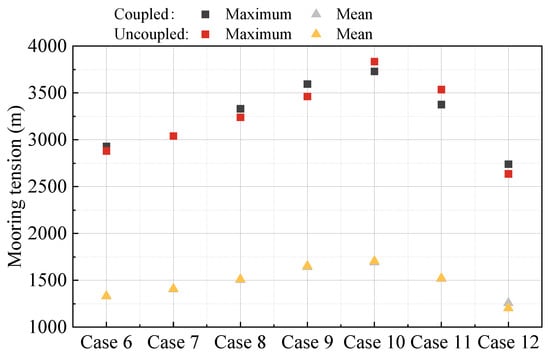
Figure 16.
Mooring tension statistic comparison under different wind speeds.
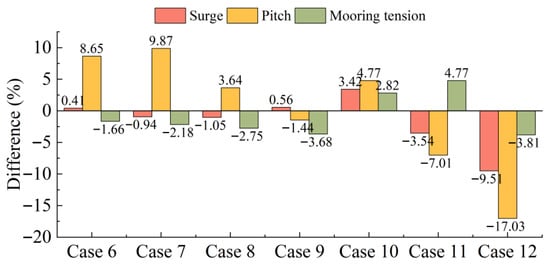
Figure 17.
Percentage differences between fully coupled and decoupled numerical models (the maximum values of surge, pitch, and mooring tension).
5. Conclusions
This paper initially presents the methodology for model testing of floating wind turbines and selects the OC5 DeepCwind model test, which has undergone extensive verification, to validate the fully coupled numerical model of floating wind turbines proposed herein. By comparing and analyzing the free decay test results, the frequency-domain response, and the time-domain response results under the irregular wave-only and combined wave-wind conditions, the reliability and accuracy of the present fully coupled numerical model of the FOWT are verified. Subsequently, the study investigates and compares the FOWT time-domain dynamic response of the fully coupled numerical model and the decoupled numerical model. Additionally, the effects of turbulence intensity and wind speed on the motion and mooring tension response differences between the two numerical models are studied. The primary conclusions of this study are delineated below:
- Under the wave-only condition, the numerical analysis indicates a 9.9% reduction in surge amplitude, an 11.7% reduction in pitch amplitude, and a relatively similar response in mooring tension; under the combined wave-wind condition, the numerical analysis shows a 1.72% smaller surge amplitude, a 5.14% smaller pitch amplitude, and a 7.22% smaller mooring tension amplitude. Overall, the results of the motion and mooring tension response from numerical analysis are smaller than those from the model test, but the differences between them are not very obvious, which verifies the correctness of the fully coupled numerical analysis method presented in this study.
- The motion responses of the experimental model are consistently larger than the predictions from the fully coupled numerical model. Meanwhile, the decoupled model, which is computationally cheaper and generally considered less accurate, produces results that are also larger than the coupled model in some cases. This indicates that, in some specific condition, the decoupled model’s predictions are actually closer to the experimental data than the fully coupled model.
- Under the wave-only condition, there is no significant difference in the response results between the fully coupled and decoupled numerical models. However, under the combined wave-wind condition, the results of the FOWT motion and mooring line tension responses calculated by the fully coupled and decoupled numerical analysis methods show significant differences in the low-frequency range. Specifically, the response spectrum peak of surge and pitch in the decoupled numerical analysis is greater than that in the fully coupled analysis. The response results of the two coupled analysis methods are basically consistent in the wave frequency range.
- Turbulence intensity does not influence the motion response within the wave frequency range; it primarily affects the response outcomes in the low-frequency range. As the turbulence intensity increases, the peak of the low-frequency response rises. This indicates that the wind load primarily affects the low-frequency motion response of the FOWT. The response peak values of surge and pitch under turbulent wind conditions at the natural frequency are significantly greater than those under steady wind conditions, and the difference in pitch responses of the FOWT under turbulent wind conditions between the fully coupled and decoupled models is more pronounced. Different coupled analysis methods and turbulence intensities have minimal effects on the heave response.
- Compared with the response results of fully coupled analysis, the maximal values of surge and pitch calculated by the decoupled method are larger, and the percentage of increase becomes more pronounced as the turbulence intensity increases. When the turbulence intensity is 0.2, the maximal values of surge and pitch of the decoupled numerical model are 3.47% and 5.01% larger than the results of the fully coupled numerical model, respectively. Additionally, at the rated wind speed, the maximum and mean values of surge decrease as the turbulence intensity increases. This is due to the effect of the wind turbine control module, where the wind thrust is at its greatest when the wind speed remains constant at the rated value; when the wind speed is greater or less than the rated value, the wind thrust decreases. Thus, the greater the deviation of wind speed from its rated value over time, the more it reduces the extreme values of wind loads, consequently decreasing the extreme values of surge motion as well. As the turbulence intensity increases, the range of variation and standard deviation of surge also increase.
- The statistical values of mooring tension under various wind speeds for both fully coupled and decoupled analysis methods do not differ significantly, with the maximal difference in extreme values being 4.77% in this study. Thus, during the preliminary analysis and optimization design phase, the decoupled method can be utilized, enhancing computational efficiency while maintaining accuracy.
In summary, the decoupled numerical analysis method can be applied during the early design or preliminary concept evaluation stage for the floating platform and mooring system of the FOWT. It effectively reduces the design analysis cycle, conserves computational resources, and maintains the accuracy of results. Nonetheless, for detailed engineering designs, such as those involving low-frequency structure response analysis or the consideration of turbulent wind conditions, the fully coupled numerical analysis method proves to be more accurate.
Author Contributions
Conceptualization, S.L., Y.Y., T.T., W.J. and X.Y.; Formal analysis, S.L.; Funding acquisition, C.C. and X.Y.; Investigation, S.L., Y.Y., T.T., Z.H., W.J. and C.C.; Methodology, S.L., Y.Y., T.T., Z.H. and C.C.; Project administration, C.C. and X.Y.; Software, S.L.; Supervision, C.C.; Validation, S.L.; Visualization, Z.H. and W.J.; Writing—original draft, S.L.; Writing—review and editing, S.L., Y.Y., T.T., Z.H., W.J. and X.Y. All authors have read and agreed to the published version of the manuscript.
Funding
This research was funded by the Key-Area Research and Development Program of Guangdong Province, China (grant no. 2021B0707040002), State Key Laboratory of Ocean Engineering (Shanghai Jiao Tong University) (GKZD010090).
Data Availability Statement
The data presented in this study are available on request from the corresponding author due to being a part of an ongoing study.
Conflicts of Interest
S.L., Y.Y., T.T. and Z.H. were employed by China Southern Power Grid Electric Power Technology Co., Ltd. S.L., Y.Y. and Z.H. were employed by National Institute of Guangdong Advanced Energy Storage Co., Ltd. W.J. was employed by China Datang Corporation Ltd. The remaining authors declare that the research was conducted in the absence of any commercial or financial relationships that could be construed as a potential conflict of interest.
References
- Haselbach, P.; Natarajan, A.; Jiwinangun, R.G.; Branner, K. Comparison of coupled and decoupled load simulations on a jacket support structure. Energy Procedia 2013, 35, 244–252. [Google Scholar] [CrossRef]
- Plodpradit, P.; Dinh, V.-N.; Kim, K.-D. Coupled analysis of offshore wind turbine jacket structures with pile-soil-structure interaction using FAST v8 and X-SEA. Appl. Sci. 2019, 9, 1633. [Google Scholar] [CrossRef]
- Bae, Y.; Kim, M. Rotor-floater-mooring coupled dynamic analysis of mini TLP-type offshore floating wind turbines. In Proceedings of the 29th ASME International Conference on Ocean, Offshore and Arctic Engineering, Shanghai, China, 6–11 June 2010; pp. 491–498. [Google Scholar]
- Bae, Y.; Kim, M.; Yu, Q.; Heo, J. Aero-elastic floater-mooring coupled dynamic analysis of FOWT (floating offshore wind turbine) in maximum operation and survival conditions. In Proceedings of the 31st ASME International Conference on Ocean, Offshore and Arctic Engineering, American Society of Mechanical Engineers, Rio de Janeiro, Brazil, 1–6 July 2012; pp. 529–537. [Google Scholar]
- Xu, X.; Srinil, N. Dynamic response analysis of spar-type floating wind turbines and mooring lines with decoupled vs coupled models. In Proceedings of the 34th ASME International Conference on Ocean, Offshore and Arctic Engineering, Busan, Republic of Korea, 31 May–5 June 2015. [Google Scholar]
- Kim, H.; Boo, S.Y. Coupled and decoupled analysis of Y-Wind semi Wind Turbine Foundation. In Proceedings of the 23rd Offshore Symposium, SNAME, Houston, TX, USA, 14 February 2018. [Google Scholar]
- Yu, Z.; Wang, K.; Sun, P.; Li, C.; Sun, D.; Sun, B. Fully-Coupled and Decoupled Analysis Comparisons of Dynamic Characteristics of Floating Offshore Wind Turbine Drivetrain. Energies 2022, 15, 110639. [Google Scholar] [CrossRef]
- Hassan, H.A.; Mahmoud, M.; ElSherif, I.A.; El-latif, M.A.; Shaheen, M.M.; Elmesalamy, A.S.; Mahmoud, H. A Comprehensive Review of Numerical Simulation Techniques for Wind Turbines: From Computational Fluid Dynamics and Finite Element Analysis to Advanced Turbulence Modeling. Beni-Suef Univ. J. Basic Appl. Sci. 2025, 14, 92. [Google Scholar] [CrossRef]
- Huang, Y.; Cheng, P.; Wan, D.C. Numerical analysis of a floating offshore wind turbine by coupled aero-hydrodynamic simulation. J. Mar. Sci. Appl. 2019, 18, 82–92. [Google Scholar] [CrossRef]
- Huang, Y.; Wan, D. Investigation of interference effects between wind turbine and spar-type floating platform under combined wind-wave excitation. Sustainability 2020, 12, 246. [Google Scholar] [CrossRef]
- Xu, S.; Xue, Y.; Zhao, W.; Wan, D. A Review of High-Fidelity Computational Fluid Dynamics for Floating Offshore Wind Turbines. J. Mar. Sci. Eng. 2022, 10, 1357. [Google Scholar] [CrossRef]
- Zhang, W.; Calderon-Sanchez, J.; Duque, D.; Souto-Iglesias, A. Computational Fluid Dynamics (CFD) Applications in Floating Offshore Wind Turbine (FOWT) Dynamics: A Review. Appl. Ocean Res. 2024, 150, 104075. [Google Scholar] [CrossRef]
- Haider, R.; Li, X.; Shi, W.; Lin, Z.; Xiao, Q.; Zhao, H. Review of Computational Fluid Dynamics in the Design of Floating Offshore Wind Turbines. Energies 2024, 17, 4269. [Google Scholar] [CrossRef]
- Jonkman, J.; Butterfield, S.; Musial, W.; Scott, G. Definition of a 5-MW Reference Wind Turbine for Offshore System Development; NREL/TP-500-38060; National Renewable Energy Laboratory: Golden, CO, USA, 2009. [Google Scholar]
- de Ridder, E.-J.; Otto, W.; Zondervan, G.-J.; Huijs, F.; Vaz, G. Development of a scaled-down floating wind turbine for offshore basin testing. In Proceedings of the ASME 2014 33rd International Conference on Ocean, Offshore and Arctic Engineering, San Francisco, CA, USA, 8–13 June 2014. [Google Scholar]
- Orcina. OrcaFlex Validation. 2015. Available online: http://www.orcina.com/SoftwareProducts/OrcaFlex/Validation/ (accessed on 19 January 2016).
- National Wind Technology Center. FAST-OrcaFlex Interface. 2017. Available online: https://nwtc.nrel.gov/OrcaFlexInterface (accessed on 10 March 2017).
- Xu, K. Design and Analysis of Mooring System for Semisubmersible Floating Wind Turbines in Shallow Water. Ph.D. Thesis, Norwegian University of Science and Technology, Trondheim, Norway, 2020. [Google Scholar]
- Goupee, A.J.; Fowler, M.J.; Kimball, R.W.; Helder, J.; de Ridder, E.-J. Additional wind/wave basin testing of the DeepCwind semi-submersible with a performance-matched wind turbine. In Proceedings of the 33rd International Conference on Ocean, Offshore and Arctic Engineering, San Francisco, CA, USA, 8–13 June 2014. [Google Scholar]
- Robertson, A. OC5 project phase II: Validation of global loads of the DeepCwind floating semisubmersible wind turbine. In Proceedings of the 14th Deep Sea Offshore Wind R&D Conference, Trondheim, Norway, 18–20 January 2017. [Google Scholar]
- Tumewu, Y.; Petrone, C. Numerical simulation of the influence of platform pitch motion on power generation steadiness in floating offshore wind turbines. Environ. Sci. Sustain. Dev. 2017, 1, 92–101. [Google Scholar] [CrossRef]
- Wendt, F.; Andersen, M.; Robertson, A.; Jonkman, J. Verification and validation of the new dynamic mooring modules available in FAST v8. In Proceedings of the 26th International Ocean and Polar Engineering Conference, Rhodes, Greece, 26 June 2016. [Google Scholar]
- Robertson, A.; Jonkman, J.; Masciola, M.; Song, H.; Goupee, A.; Coulling, A.; Luan, C. Definition of the Semisubmersible Floating System for Phase II of OC4; National Renewable Energy Laboratory: Golden, CO, USA, 2014. [Google Scholar]
- Gueydon, S. Aerodynamic Damping on a Semisubmersible Floating Foundation for Wind Turbines. Energy Procedia 2016, 94, 367–378. [Google Scholar] [CrossRef]
- Yan, X.; Chen, C.; Yin, G.; Ong, M.C.; Ma, Y.; Fan, T.H. Numerical Investigations on Nonlinear Effects of Catenary Mooring Systems for a 10-MW FOWT in Shallow Water. Ocean Eng. 2023, 276, 114207. [Google Scholar] [CrossRef]
- Robertson, A. Uncertainty analysis of OC5-DeepCwind floating semisubmersible offshore wind test campaign. In Proceedings of the International Society of Offshore and Polar Engineers Conference, San Francisco, CA, USA, 25–30 June 2017. [Google Scholar]
Disclaimer/Publisher’s Note: The statements, opinions and data contained in all publications are solely those of the individual author(s) and contributor(s) and not of MDPI and/or the editor(s). MDPI and/or the editor(s) disclaim responsibility for any injury to people or property resulting from any ideas, methods, instructions or products referred to in the content. |
© 2025 by the authors. Licensee MDPI, Basel, Switzerland. This article is an open access article distributed under the terms and conditions of the Creative Commons Attribution (CC BY) license (https://creativecommons.org/licenses/by/4.0/).