Abstract
This article presents the accumulated technical and scientific knowledge from energy performance upgrade work in emblematic and essential municipal and public buildings in Crete and the Greek islands, such as the Venetian historical building Loggia, which is used as the Heraklion City Hall, the Natural History Museum of Crete, Pancretan Stadium, the municipal swimming pool of the municipality of Minoa Pediadas, the indoor sports hall in Leros, primary schools, high schools and a cultural center. Each one of the aforementioned buildings has a distinct use, thus covering almost all different categories of municipal or public buildings and facilities. The applied energy performance upgrade process in general terms is: (1) Mapping of the current situation, regarding the existing infrastructure and final energy consumption. (2) Formulation and sizing of the proposed passive measures and calculation of the new indoor heating and cooling loads. (3) Selection, sizing and siting of the proposed active measures and calculation of the new expecting energy sources consumption. (4) Sizing and siting of power and heat production systems from renewable energy sources (RES). Through the work accomplished and presented in this article, practically all the most technically and economically feasible passive and active measures were studied: insulation of opaque surfaces, opening overhangs, natural ventilation, replacement of openings, daylighting solar tubes, open-loop geo-exchange plants, refrigerant or water distribution networks, air-to-water heat pumps, solar thermal collectors, lighting systems, automation systems, photovoltaics etc. The main results of the research showed energy savings through passive and active systems that can exceed 70%, depending mainly on the existing energy performance of the facility. By introducing photovoltaic plants operating under the net-metering mode, energy performance upgrades up to zero-energy facilities can be achieved. The payback periods range from 12 to 45 years. The setup budgets of the presented projects range from a few hundred thousand euros to 7 million euros.
1. Introduction
1.1. General Background
Rational use of energy (RUE) and energy saving constitute the backbone of effective and sustainable energy transition. Before electricity, heat or mechanical energy production from renewable energy sources (RESs), RUE, and energy saving aim at the optimization of energy use and the maximization of energy transformation efficiency from the primary to the final energy forms, which in turn will lead to the minimization of primary energy source consumption.
Energy saving has been established as “a fundamental principle of EU energy policy” in the relevant European Union (EU) directive [1]. This means that “energy efficiency must be considered by EU countries in all relevant policy and major investment decisions taken in the energy and non-energy sectors.”
Energy saving refers to all energy forms and final uses and all different sectors: residential and commercial buildings, industry, agriculture, sport facilities, municipal and public buildings, public lighting, transportation, etc. A considerable amount of research has been accomplished on RUE covering the investigation of materials and applications of passive energy systems, alternative layout and sizing methodologies for active systems, automation, investigation of energy saving measures for different climate conditions or different final uses, alternative combinations of passive and active systems, etc.
Buildings are responsible for 40% of the total primary energy consumption in the European Union (EU) [2] and for 30% globally [3]. Additionally, 36% of the total greenhouse emissions in the EU and 26% globally comes from the energy consumed in buildings. At the same time, 75% of the existing building stock in EU is energy-inefficient [2], which means that they are classified as energy performance rank C or lower. This low efficiency of energy use in Europe presents an opportunity for considerable energy saving and highlights the significance of energy saving in the building sector in the achievement of carbon neutrality by 2050, set in the European Green Deal [4].
The energy performance upgrading of the building stock in the EU will lead to a total primary energy annual saving of 5–6% and a greenhouse gas emission annual drop of 5%. However, on average, less than 1% of public or municipal buildings are renovated every year. This figure varies on a national level for the EU’s Member States from 0.4% to 1.2% [2].
Every year, topic-specific research and application funding programs are announced globally, aiming at monetary support for the energy retrofitting of municipal and public buildings. Only in 2022, USD 400 million was invested in the development of new technologies for materials and advanced equipment or processes relevant to energy saving in buildings [4], while during the period 2017–2030, close to USD 600 billion is expected to be invested on energy performance upgrade projects, aiming at net-zero buildings and facilities.
1.2. Energy Saving in Municipal and Public Buildings
Municipal and public buildings and facilities constitute a major energy consumption sector due to their size and extensive operation periods [5]. On the other hand, the energy cost constitutes a major operation cost for municipal and public buildings, which, depending on the building’s or facility’s use and size, can vary from 20–30% in common administrative buildings and schools to 40% in hospitals and even higher than 50% in sports facilities and swimming pool centers versus the overall operation cost [6]. Having acknowledged these data, the European Commission has set a target for the renovation of 3% of overall public and municipal building stock every year [7].
A considerable amount of research has been accomplished on the energy performance upgrading of public and municipal buildings. This is because public and municipal buildings, apart from their energy and environmental footprint, can also play a crucial role in the investigation of advanced and innovative energy saving technologies and the cultivation of energy culture in their users.
Starting with buildings, the principal final energy form is heat. In the European Union, 60–80% of annual energy consumption in buildings is for indoor heating or cooling and 13% for domestic hot water production [8]. Consequently, most research on upgrading buildings’ energy performance is focused on the improvement of their thermal behavior and features. This implies that the beginning of every rationally designed project on RUE in buildings should start with the integration of passive energy saving measures in the buildings’ envelope [9].
Passive energy saving measures for existing buildings most typically include insulation of opaque vertical or horizontal surfaces and replacement of old openings and overhangs for shading [10,11]. Extensive research has been accomplished on the insulation materials, including conventional polymer-based materials [12], physical residue materials coming from agriculture or sea algae [13,14], natural and polymer-based composites [15], recycled plastic materials [16], phase-change materials [17], and even slag from industrial processes [18]. Opening shadings also have a crucial contribution on cooling load reduction [19], and they can also be combined with the installation of photovoltaic panels for concurrent shading and electricity production [20]. Particularly in hot–arid buildings, a 27–32% drop in indoor cooling load can be achieved by either constant or dynamic shading elements [21]. Regarding openings, the research is mainly focused on glazing technologies and investigating thermochromic, photochromic, and electrochromic smart windows, all of which aim to regulate the balance between the glazing’s transmittance and absorbance depending on the climate conditions and the desirable indoor thermal comfort [22,23]. In former studies, it has been shown that the indoor heating and cooling load can be reduced 30–70%, thanks to the overall passive energy saving measures integration in buildings’ envelopes [24,25].
A special category of municipal or public buildings is historical ones, protected under specific cultural conservation regimes [26,27]. In these cases, most commonly there are strict limitations regarding any interventions on the buildings’ facades, if not prohibition, restricting considerably the options for the integration of passive energy saving measures. On the other hand, most commonly these historical buildings have been constructed with high-thermal-capacity materials (e.g., stones) and thicknesses that can exceed 50 cm [28], leading to relatively acceptable U-factors, especially in southern climates (within a range of 1 W/m2∙K) [29]. Most commonly, in historical buildings, potentially permitted interventions can be the replacement of openings with authentic copies of the originals, but with materials with improved thermal properties and the installation of internal thermal insulation for opaque vertical walls and roods [30].
In the case of new buildings designed from scratch, there is the option of introducing simple bioclimatic techniques. These bioclimatic elements can include the building’s appropriate orientation, the appropriate positioning and sizing of the openings depending on the geographic latitude of the installation, the integration of adequate shading measures, such as overhangs or planting of deciduous trees, the introduction of natural ventilation elements (e.g., solar chimneys), installation of green roofs, etc. [31,32]. Additionally, more sophisticated bioclimatic measures can be a solar greenhouse [33] and a Trombe–Michel wall [34]. The Trombe–Michel wall installed in the US National Renewable Energy Laboratory (NREL) building contributes 20% to the annual coverage of the building’s heating demand [35].
Apart from buildings, sports centers constitute another common, energy-consuming type of municipal or public facilities. These are most typically indoor sports halls, swimming pool centers, and outdoor courts or stadiums. In these cases, the energy saving margin is usually huge, due to the large energy amounts required for the indoor conditioning of these facilities, the domestic hot water production, the swimming pool heating, and the lighting [36]. Plenty of articles have been published on energy saving in sports facilities. Apart from the typical passive energy saving measures also proposed for buildings [37], in the case of sports facilities, special passive measures are proposed, aiming to:
- Avoid overheating of an indoor sports hall in summer [38], such as shadings, natural ventilation, and nighttime cooling.
- Reduce the heat loss from swimming pools’ upper surface, such as construction of bioclimatic enclosures for outdoor swimming pools or placement of insulation top covers on the pools’ upper surface [39].
- Increase natural lighting in large indoor halls, such as installation of solar-light tubes on the facility’s roof [40].
The appropriate introduction of passive energy saving measures in sports facilities can lead to impressive drops in heating or cooling load that can exceed 70% [41]. In particular, the upgrade of an outdoor swimming pool center to an indoor one and the use of insulation top cover for the pool’s upper surface can lead to 95% drop of the pools’ heating load [40,42].
Energy performance upgrading is integrated with the introduction of appropriate active energy saving and electricity production systems, which aim to maximize the efficiency of the energy sources used. The combination of high-efficiency water-to-water heat pumps, supported by open-loop geo-exchange plants, is considered the most technically mature and cost-effective solution for active indoor conditioning, on the condition that there are nearby water resources for primary heat pumping or disposal (e.g., sea, underground aquifers, lakes or rivers) [43]. Annual electricity savings higher than 40% can be achieved compared to air-to-air heat pumps [44,45].
Another highly cost-effective and sustainable approach is the replacement of diesel oil with biomass burners powered by locally available biomass resources coming from agriculture [46], livestock farming [47] or urban organic waste [48]. This approach comprises RUE with cycling economy, exhibits high added value and offers sustainable solutions for the disposal of agricultural process residues (e.g., tree pruning or olive pulp) and waste (e.g., livestock farming manure, urban organic waste etc.) [49]. Heat production from biomass resources has in practice been combined with district heating networks, optimizing the overall process for all (from the supply chain to heat distribution) and achieving heating production cost for final users more than 50% lower compared to the use of diesel oil [50,51]. District heating can be ideally implemented through collective schemes, such as energy cooperatives or communities [52,53].
Solar systems are typically used for both heat and electricity production. In the first case, solar thermal collectors have been proposed for both indoor heating and domestic hot water production. Relevant research is focused on the investigation of new materials [54,55] and new types of working means (e.g., hybrid nanofluids [56]), aiming to improve the collector’s performance. Alternative layouts and operation algorithms have also been investigated for the combined operation of solar thermal collectors with heat storage tanks [57,58], aiming to maximize solar heat penetration produced to cover a specific heat demand, such as indoor heating for school buildings [59,60] or swimming pool heating [61,62].
Aiming at net-zero-energy buildings and facilities, energy performance upgrade projects are usually completed with the installation of electricity production technologies from renewable energy sources (RESs), such as photovoltaics or small wind turbines, often supported by electricity storage technologies [63,64]. Apart from buildings, decentralized electricity production and storage plants have also been proposed and applied for specific purposes, such as street lighting [65] or municipal desalination plants [66].
The present article gathers the knowledge and experience gained from a large number of studies and projects on the energy performance upgrading of important and emblematic municipal buildings and facilities in the insular Greek territory. Municipal halls, historical buildings, schools, national stadiums, indoor sports halls, and swimming pool centers are included among the projects accomplished. The methodology adopted and results achieved are summarized in the next sections.
2. Scope and Methodology
This article present and analyzes the experience gained and the results achieved from a considerable number of energy performance upgrade studies, particularly for municipal and public buildings and facilities. Specifically, these facilities are:
- Four school buildings.
- Two municipal halls and administrative buildings.
- One historical and protected city hall.
- Two indoor sports halls.
- A swimming pool center.
- A national stadium with an indoor swimming pool center.
- A cultural center.
- A museum.
All these facilities are located in Greece in a Mediterranean climate of mild winters and relatively cool summers [67]. The ultimate objective of the article is to present some common and general conclusions on the optimum applied energy performance upgrade process and the anticipated economic and energy saving results for these specific facilities and for the specific climate conditions.
The methodology adopted and applied for the energy performance upgrade studies in the aforementioned buildings and facilities can be summarized in the following steps [68,69].
- Invitation for collaboration to the management organization (e.g., a municipality) and initialization of an open communication line with the executives in charge of the operation and management of the facility.
- Visit and on-site inspection of the facility, collection of all required data for the mapping of the facility, such as architectural and construction elements, energy consumption, and operating schedule.
- Execution of the initial computational simulation of the facility’s annual operation under the existing conditions, and calculation of existing energy loads and energy sources consumption.
- Calculation of the annual primary energy consumption of the infrastructure in its current operating state with existing active energy systems.
- Selection, dimensioning, and siting of the most technically and economically viable passive measures, with the aim of reducing the facility’s energy loads.
- Execution of a second computational simulation of the annual operation of the facility with the introduction of the proposed passive energy saving measures and calculation of the new energy loads.
- Selection, dimensioning, and siting of the most technically and economically viable active energy saving measures to cover the new energy needs of the infrastructure.
- Calculation of the new annual primary energy consumption after the introduction of the proposed passive and active energy saving measures for full coverage of the facility’s energy needs.
- Dimensioning and siting of an electricity production technology (e.g., a photovoltaic park), aiming at annual compensation of the remaining electricity consumption in the facility.
- Calculation of the achieved annual energy savings, the setup and operation cost, and essential key performance indicators (KPIs).
All the abovementioned computational simulations were performed on the basis of annual time series data with average hourly calculation time steps. All required meteorological data were obtained from the European Centre for Medium-Range Weather Forecasts (ECMWF) for the period 2010–2020 [70].
The above-described methodology is presented in Figure 1.
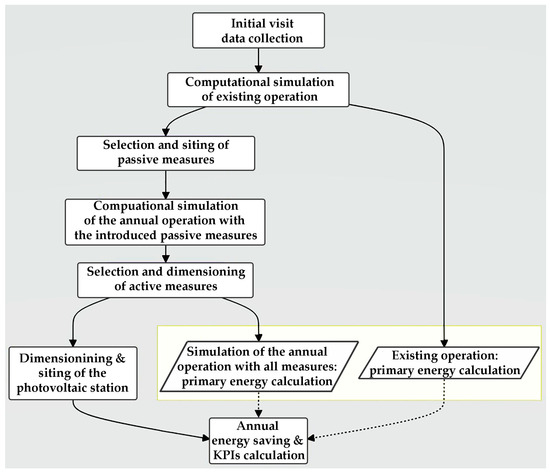
Figure 1.
Logical diagram of the adopted methodology of energy performance upgrade process.
The above-described methodology was applied to all the investigated municipal facilities. Evaluation of the achieved results was accomplished in the frame of this work on the basis of specific KPIs, such as:
- The annual achieved primary energy saving.
- The annual RES penetration.
- The annual CO2 emission drop.
- The payback period of the required investment.
3. Mathematical Background and Essential Data
The mathematical background applied in the work accomplished comes from the basic theory of heat transfer and fluid mechanics and is analyzed in the following sections.
3.1. Indoor Heating and Cooling Load
The indoor conditioning loads were calculated by applying the basic methodology regarding heat losses and solar thermal gains through a building envelope [71]. Specifically, the ASHRAE transfer function method (TFM) was applied [72] with the computational support of TRNSYS [73]. All indoor conditioning load calculations were performed with TRNSYS for both existing and expected operating conditions of the facilities under consideration after the introduction of the proposed passive energy saving interventions.
The transferred thermal power through a surface A of a construction element of the building’s envelope is given by the following essential equation [72] (for the winter period):
where U is the surface heat transfer factor (the so-called U-factor) and Tin and Tout are the indoor and outdoor air temperatures, respectively.
The heat transfer factors were calculated with the following basic relationship:
where dj and kj are the thickness and the thermal conductivity of the construction element j of an opaque surface of the building’s envelope. The thermal transition factor for indoor and outdoor space hi and ho were assumed equal to [74]:
- hi = 10 W/m2∙K and ho = 25 W/m2∙K for atmospheric airflow above horizontal surfaces with average wind velocity of 5 m/s.
- hi = 7.7 W/m2∙K and ho = 25 W/m2∙K for atmospheric airflow parallel to vertical surfaces with average wind velocity of 5 m/s.
The heat transfer factors for the openings were retrieved from the TRNSYS library and were equal to 5 W/m2∙K or even higher for the existing openings with metallic frames and single glazing or equal to 1.5 W/m2∙K for the proposed openings with double glazing and synthetic frames. The openings’ solar gain factors were adopted within a range of 0.77.
The natural ventilation of the indoor space due to openings’ insufficient airtightness was calculated from the following equation [75], introduced by ASHRAE:
where ACH (air changes per hour) is the total air volume changes per hour of the indoor space, uw is the annual average wind speed, Tin and Tamb are the indoor and ambient temperatures, respectively, and the parameters K1, K2, and K3 were selected versus the airtightness quality of the openings.
The thermal comfort conditions were taken from the Directive on Buildings’ Energy Performance versus the use of each facility [76].
3.2. Domestic Hot Water Production
The basic equation for the calculation of the thermal power required for the production of domestic hot water is the following one:
where is the hot water mass flow rate, cp = 4.187 kJ/kg∙K the specific water heat, Thw the produced hot water temperature (typically equal to 45 °C), and Tsw the temperature of the water in the municipal supply network, which according to the Technical Directive of the Technical Chamber of Greece 20701-1/2017 [77] varies between 12.8 °C in February and 26.6 °C in August for the A climate zone in Greece.
3.3. Swimming Pool Heating Load
The total thermal power loss from the free surface of a swimming pool is given by the relationship [78]:
where:
- : the total thermal power loss from the swimming pool’s free surface.
- : the thermal power loss with convection and radiation.
- : the thermal power loss with evaporation.
- : the heating load due to the replenishment of the water loss due to evaporation with the water supplied from the municipal network.
- : the solar heat gains due to the incident solar radiation.
If Tamb is the ambient temperature and TW the temperature of the water in the swimming pool (typically 26 °C), the thermal power loss due to convection and radiation is given by the equation [74]:
where:
- Asp: the swimming pool’s upper free surface.
- U: the heat transfer factor from the pool to the ambient environment.
The heat transfer factor U expresses the heat transfer from the swimming pool’s free surface by convection and radiation and is given by the equation:
where hc is the thermal transition factor for airflow over a horizontal surface, which for an outdoor environment and an average annual wind speed of 5 m/s is taken as 10 W/m2∙K [75], while hrw is the heat emission coefficient of water by radiation, which is given by the equation:
where εw the water emissivity, equal to 0.957, and σ the Stefan–Boltzmann constant (5.67∙10−8 W/m2∙K4). The ratio in the parentheses is the water–ambient air average temperature.
Where an insulation top cover has been placed in the swimming pool’s free surface, the heat transfer factor is given by the equation:
where:
- hw: the heat convection coefficient of still water, equal to 50 W/(m2∙K).
- kc: the heat conduction coefficient of the insulation top cover.
- dc: the insulation top cover thickness.
- hfc: the thermal transition factor from the insulation top cover to the ambient environment.
The heat transfer factor U describes the heat transfer from the surface of the insulation top cover by convection and radiation and is given by the following equation:
where hc is the thermal convection coefficient for airflow over a horizontal surface and for an indoor space, equal to 2.5 W/m2∙K [74], and hrc is the radiant heat emission coefficient of the insulation top cover, which is given by the equation:
where εc is the emissivity of the insulation top cover, equal to 0.550, and Tc is the temperature of the insulation top cover, which can be assumed equal to the water temperature in the swimming pool. The ratio in parentheses is the average water–ambient air temperature.
The heat losses due to evaporation of water are given by the relationship [78]:
where:
- he: the evaporation transfer coefficient.
- ps,w: the saturation vapor pressure for water at temperature Tw (in kPa).
- : the partial pressure of water vapor away from the swimming pool, at ambient temperature Tamb (in kPa).
The evaporation transfer coefficient can be calculated from the following empirical equation [78]:
where u0.3 is the wind speed in m/s at a height of 30 cm above the pool’s surface. If the wind speed is known at a height z2 above ground, at a height z1 it can be calculated from the exponential law for the wind speed profile [79]:
The exponential n is given versus the roughness height of the ground z0 from the following equation:
where the roughness height of ground for a semi-urban environment is estimated at 0.5 m.
n = 0.04∙lnz0 + 0.003∙(lnz0)2 + 0.24
The water vapor saturation pressure ps,w is obtained from relevant tables as a function of the water temperature Tw and for atmospheric pressure [80].
The partial water vapor pressure away from the reservoir can be calculated from the following definition of the relative humidity φ, which can also be provided as a climate datum from the ECMWF meteorological database:
where is the saturation pressure of water vapor at temperature Tamb and atmospheric pressure [80].
The additional heating load due to replenishment of the evaporation water with water from the supply network is given by the following basic equation:
where:
- : the replenishment water mass flow rate.
- cp: the specific water heat (4.187 kJ/kg∙K).
- Tw: the required water temperature in the swimming pool (typically equal to Τw = 26 °C).
- Tsw: the water temperature in the municipal supply network.
The replenished water mass flow rate is given by the equation:
where hfg is the specific latent heat of water (2441.7 kJ/kg at 25 °C [81]). Average monthly values of water temperature in supply networks are provided by the Technical Directive 20701-1/2017 of the Technical Chamber of Greece [77].
Finally, the solar thermal gains from the incident solar radiation on the surface of the tank are given by the relationship [74,75]:
where:
- a: solar radiation absorption coefficient by the swimming pool, typically around 0.85 for light-colored pools [78].
- G: the total incident solar radiation on the swimming pool’s free surface.
- Asp: the area of the swimming pool’s free surface.
3.4. Shading of Vertical Surfaces
The calculation of the openings’ shading from overhangs and vertical sunshades is analyzed in this section with the support of Figure 2 [71].
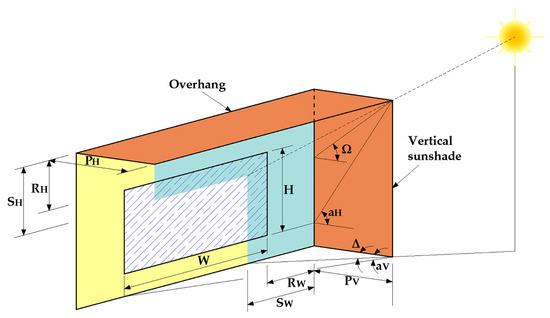
Figure 2.
Opening’s shading from overhangs or vertical sunshades.
The following distances can be found in Figure 2:
- W, H the opening’s width and height, respectively.
- PH, PV the width of the overhang or the vertical sunshade, respectively.
- LH, LV the length of the overhang or the vertical sunshade, respectively.
- RH, Rw the distance of the overhang or the vertical sunshade, respectively, from the opening’s nearest side.
- SH, SW the shade’s width caused by the overhang or the vertical sunshade, respectively.
- The angle Ω is called a “vertical shadow angle” and is the angle projected on the vertical level, created between the horizontal plane and an inclined surface that crosses the sun and the outer edge of the overhang.
- The angle Δ is called a “horizontal shadow angle” and is the angle projected on the horizontal plane, created by a surface perpendicular to the opening’s level and a surface that crosses the sun and the outer edge of the vertical sunshade.
- The angle αH is the minimum Ω that causes full shading of the opening from the overhang.
- The angle αV is the minimum Δ that causes full shading of the opening from the vertical sunshade.
For a vertical opening’s surface, the following equations stand:
for |γ| < 90° or |γ| > 270°.
Hence, Δ = γ for |γ| < 90° or |γ| > 270°.
According to Figure 2, in order to achieve a full opening’s shading from the overhang, the following condition should stand:
Similarly, in order to achieve a full opening’s shading from the vertical sunshade, the following condition should stand:
4. Examined Buildings’ and Facilities’ Initial Operation
4.1. Geographic Locations
The scope of this article is to present and analyze the process and the results achieved from energy performance upgrade studies conducted for specific public and municipal buildings and facilities. The ultimate objective is to highlight conclusions on the specific topic of RUE and energy saving, which may be applicable in similar public facilities, under the same or close climate conditions.
All the examined cases are located in Greece, more specifically in the A climatic zone, which includes the south of the country and the islands. In total, 13 municipal and public facilities were chosen to be analyzed in this work: four schools, three municipal halls (including a historical one), one cultural center, one museum, two indoor sports hall, one swimming pool center, and one national stadium (including an indoor swimming pool center). These are summarized in Table 1, with essential data regarding their size, type, and location. The covered area presented for the outdoor and the indoor swimming pool centers refers to the total upper surface of the pools. Specifically, the outdoor swimming pool center consists of two pools of 1000 m2 and 125 m2 upper surface area. Additionally, there are two more indoor swimming pools in Pancretan Stadium, with upper surface areas of 312.5 m2 and 75 m2.

Table 1.
The public and municipal facilities investigated.
Thorough energy performance upgrade studies have been conducted for all the facilities presented in Table 1. Four of the studied energy performance upgrade projects have been implemented and three more have had funding ensured and are expected to be implemented in the near future.
The geographic points of the towns, cities, and islands where the above-listed facilities are located are presented in Figure 3. As seen in Figure 3, all the investigated municipal and public facilities are located in Crete and on the islands of Kassos and Leros. The climate in the specific geographic area is characterized as Mediterranean, with minimum annual temperatures of 0–5 °C, except mountainous areas, and maximum temperatures of 30–32 °C, except heat wave periods. The annual rainfall height is 300–400 mm in the small islands and higher than 500–700 mm in Crete.
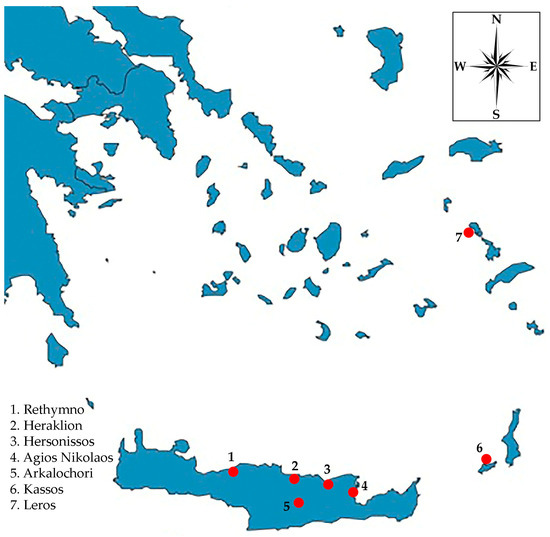
Figure 3.
The geographic locations of the towns, cities, and islands of the facilities examined.
4.2. Initial Construction Elements and Thermal Performance
All buildings investigated were constructed after 1950, including the historical Venetian Loggia city hall of Heraklion [82]. Actually, Loggia was a Venetian building constructed in 1626–1628. The building gradually deteriorated over the centuries and eventually totally destroyed in the Second World War. The new building was constructed as an accurate replica of the original. Its construction started in the early 1960s and was completed in the late 1970s. The new building has a bearing structure of reinforced concrete and stone walls. The same construction elements also apply to the municipal hall of Kassos. In both cases, vertical walls with total thickness equal to or higher than 50 cm are met.
With the exception of Loggia and the municipal hall of Kassos, the rest of the buildings examined were constructed with modern materials, such as reinforced concrete for the bearing structures and the roofs and vertical opaque surfaces of double bricks. The two indoor sports halls have bearing structures of steel pylons and beams, and their walls and roofs have been covered with synthetic polyurethane panels. There was and absence of or inadequate thermal insulation in the facilities examined during the initial inspection, apart from some very few exceptions. Openings of obsolete technology were found, either with metallic frames without thermal brakes or wooden frames, and single or double glazing without any reflective properties and inadequate airtightness.
The construction elements and the estimated U-factors for each of the buildings and facilities under consideration are summarized in Table 2. The table refers only to the buildings investigated. This means that the swimming pool center is not included.
Table 2.
Summary of the construction elements and U-factors of the examined buildings in their initial state.
It should be clarified that the results presented in Table 2 constitute only an approach to summarize the complex thermophysical properties of the buildings’ construction elements. This is because most of them have been formulated versus time by starting with an initial construction and then adding new sections. This means that in specific buildings, we find different construction elements in different parts of them. For example, in the Natural History Museum of Crete we can find the old, historical building, constructed with stones, and the new one, constructed with synthetic panels. Similarly, in the 2nd primary school of Agios Nikolaos, we can see that there is no insulation in the old building, while the newly added section has been insulated. Additionally, the U-factor may vary in different parts of the same construction element, such as vertical walls constructed partially with reinforced concrete (bearing structure) and with another material (stone, bricks, etc.). In practice, for all these different parts of the same construction element, different U-factors were used so as to approach maximum calculation accuracy. Finally, the effect of damage and wear was also considered for the U-factor calculation. For example, the inappropriate installation of the polyurethane panels on the roofs of the indoor sports halls in Arkalochori and in Leros enabled the penetration of rain water, which deteriorated the insulation properties of this construction element. This is revealed by the considerably high U-factor estimated for the roof in these specific cases.
Another important conclusion is that for almost all investigated cases, the calculated U-factors are higher than the maximum permissible values defined in the Greek Directive for Building Energy Performance [76]. These values for the A climate zone are:
- For vertical opaque surfaces: 0.55 W/m2∙K.
- For horizontal or inclined roofs: 0.45 W/m2∙K.
- For openings and transparent surfaces: 2.80 W/m2∙K.
Typical operation parameters and data were retrieved both from the executives in charge of the facilities and the standards introduced by the Greek Directive for Building Energy Performance [76]. There parameters are summarized in Table 3.
Table 3.
Typical operation parameters for the facilities investigated.
Using the mathematical background presented in Section 3.1 and with the support of TRNSYS, the annual indoor heating and cooling load was calculated for the aforementioned facilities. A diagram of the calculation process in TRNSYS is presented in Figure 4. As seen in the figure, the calculation starts with the introduction of the climate data in the form of annual time series with hourly averaged values. This is accomplished with the “weather” subroutine. Given the introduced climate data, in the second step, the incident solar radiation on the buildings’ vertical and horizontal surfaces is calculated with the involvement of the “8-surfaces” and the “horizontal” subroutines. In a third preliminary step, the “sky-temperature” subroutine is introduced for the calculation of the long-wave solar radiation emission in the space. In the fourth and final introductory step, the wind characteristics introduced with the “weather” subroutine are exploited for the calculation of the infiltration parameters in the building with the “infiltration” subroutine. The output from the aforementioned subroutines is introduced in the “building” subroutine, together with the building’s construction elements, orientation, and geometry. The indoor heating and cooling load are also calculated in this subroutine. Finally, in the output subroutines “temperature,” “energy,” “humidity,” and “output,” the calculation results are exported in the form of both graphs and annual time series.
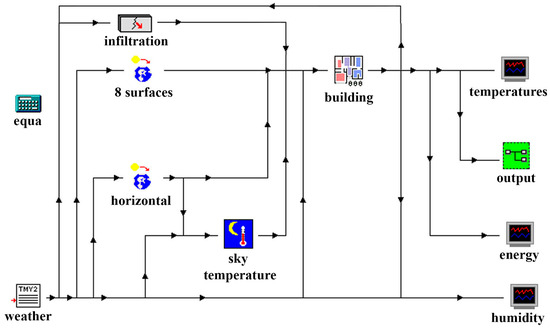
Figure 4.
Diagram of the model adopted in TRNSYS for the indoor conditioning load calculation.
The calculated annual heating and cooling load for the facilities investigated are summarized in Table 4. The building with the lowest specific load per square meter of covered conditioned area is the 2nd primary school of Agios Nikolaos. This should be expected, given that roughly half of the overall facility is a new, insulated building. With the exception of the 1st high school of Rethymno, all the other buildings exhibit specific heating and cooling loads higher than 70 kWh/m2. The two indoor sports halls exhibit the highest specific heating and cooling loads, between 127 kWh/m2 and 161 kWh/m2. This is because of the coverage of the vertical walls with semitransparent polycarbonate panels and the roof with polyurethane panels, which have deteriorated due to moisture penetration.
Table 4.
Annual indoor heating and cooling load calculation results for the facilities investigated in their initial state.
Additionally, based on the mathematical background presented in Section 3.3, the swimming pool heating load was calculated for the outdoor center in Arkalochori and the indoor swimming pools in Pancretan Stadium. The results are given in Table 5.
Table 5.
Swimming pool heating load.
In the initial operation condition, the indoor heating and cooling load of the buildings and facilities investigated was calculated based on the consumption of diesel oil and electricity. The outdoor swimming pools are heated by a diesel oil burner, while the indoor swimming pools in Pancretan Stadium are heated by air-to-air heat pumps. The annual consumption of these energy sources is given in Table 6. In the same table, the corresponding primary energy consumption is also calculated, given the conversion factors introduced in the Greek Directive of Building Energy Performance and the lowest calorific value of diesel oil, which are [76]:
Table 6.
Energy sources and primary energy consumption for the indoor heating and cooling of the buildings investigated and the swimming pool heating in their initial state.
- Primary energy calculation factor for diesel oil, applied on the contained initial energy: 1.1.
- Primary energy calculation factor for electricity: 2.9.
- Diesel oil lowest calorific value: 10.25 kWh/L.
In Table 6, it can be seen that the facilities with the highest annual heating and cooling specific load (presented in Table 4) also exhibit the highest primary energy-specific consumption for indoor heating and cooling. The active indoor conditioning systems involved in the initial state of the facilities examined exhibit more or less the same features:
- Diesel oil burners with efficiency around 80%, derived from the official maintenance annual reports.
- Air-to-air heat pumps or split air-conditioning units with COP and EER within a range of 2.0–2.5, derived from the official data sheets of the air conditioning units initially available.
The annual specific load of the swimming pool heating was calculated versus the total area of their upper surfaces. Also worthy of mention is the considerably high diesel oil consumption for the outdoor swimming pool heating. Given that (approximately) there is no need for heating for 90 days per year, the annual diesel oil consumption (307.9 kL) gives a daily diesel oil consumption of 0.84 kL.
4.3. Other Consumption—Summary
Apart from indoor heating and cooling and swimming pool heating, energy is also consumed in the facilities investigated for the following final uses:
- Domestic hot water consumption in the sports facilities examined, namely the two indoor sports halls, the swimming pool center, and the national stadium.
- Outdoor and indoor lighting in all facilities.
- Other consumption not related to energy performance upgrade, such as office machines, elevators, pumps etc.
The mathematical background for the calculation of the heat required for domestic hot water production is presented in Section 3.2. The required data and parameters were either given by the executives in charge of the facilities’ operation or by the standards defined in the Greek Directive of Building Energy Performance [76]. They are summarized in Table 7.
Table 7.
Heat production and energy source consumption for the production of domestic hot water.
Finally, the electricity consumption for outdoor and indoor lighting was calculated on the basis of the installed lighting electrical input power and the annual operation time.
In Table 8, the overall energy consumption in the facilities examined is presented separately for each discrete final energy use and in total.
Table 8.
Primary energy consumption analysis versus final energy use in the facilities investigated in their initial operation state.
5. Passive Measures and Heating—Cooling Load Reduction
5.1. Proposed Passive Measures
The first step towards the energy performance upgrading of the public and municipal facilities investigated is the introduction of passive measures, aiming to reduce the heating and cooling load of the conditioned indoor space and the heating load of the outdoor swimming pool center and the indoor swimming pools hosted in the national stadium. Additionally, passive measures can be introduced to maximize natural lighting during daytime.
The selected and proposed passive measures for the facilities under consideration are listed below.
- Thermal insulation of all opaque vertical and horizontal surfaces, applied in the walls and roofs constructed with conventional reinforced concrete or bricks. In all cases, external insulation was proposed to avoid any disturbances in the facilities normal operation and reduction in available indoor space, as well as to provide holistic protection (including waterproofing) for the buildings’ envelopes. A typical layout of the proposed external insulation for vertical walls and horizontal roofs are given in Figure 5. For the specific geographic region, it can be seen that an insulation layer of polyurethane or stone wool of 7 cm thickness is required to ensure achievement of U-factors within a range of 0.4 W/m2∙K, satisfying the prerequisites set in the Greek Directive for Building Energy Performance [76] (see Section 4.2).
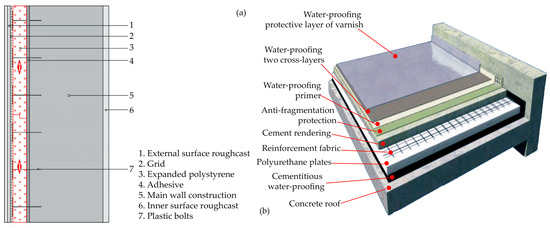 Figure 5. External insulation layout for: (a) vertical and (b) horizontal opaque surfaces.
 - Replacement of old openings with new ones with synthetic frames, double, reflective, low-E glazing, and high airtightness. The glazing total thickness ranges from 24 mm to 32 mm. The U-factors of the new openings achieved are within a range of 1.6 W/m2∙K.
- In buildings with extensive transparent surfaces, such as schools, outdoor inclined overhangs were proposed for all of them with southern, eastern, and western orientation, aiming to provide adequate shading and reduce solar gains from spring to autumn due to direct solar radiation penetration. The sizing and the installation position with regard to the openings’ location are crucial so as to ensure shading during the summer period without preventing solar radiation from entering indoors during winter by exploiting the low and high solar heights in winter and summer, respectively. The relevant mathematical background is given in Section 3.4. Two indicative installation layouts and sizing are presented in Figure 6. The overhang’s length is at least twice that of the opening’s width.
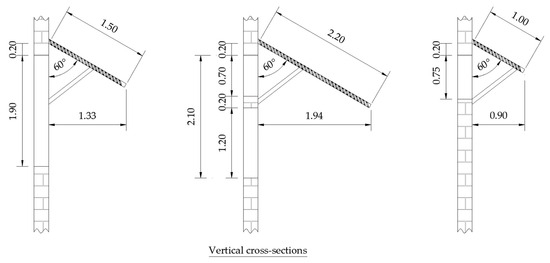 Figure 6. Indicative installation layout and sizing of inclined overhangs for opening shading.
 - Particularly for the indoor sports hall, the installation of solar light tubes has been proposed on their roofs, in order to maximize the natural lighting in the main halls during daytime. This intervention is necessary in order to compensate the reduction of natural lighting that will be caused by the replacement of the semitransparent polycarbonate sheets with opaque stone wool panels. The siting layout for the indoor sports hall in Leros is given in Figure 7, together with the results of the photometric calculation during a cloudy day in winter at 12:00 noon. As seen in this figure, a grid of 6 × 8 = 48 light tubes has been designed. With this solar light tube number and installation topology, the illuminance achieved on the hall’s floor ranges from 250 lux to 350 lux for the aforementioned time and weather conditions. The required illuminance according to Technical Directive 20701-1/2017 of the Technical Chamber of Greece is 300 lux [77].
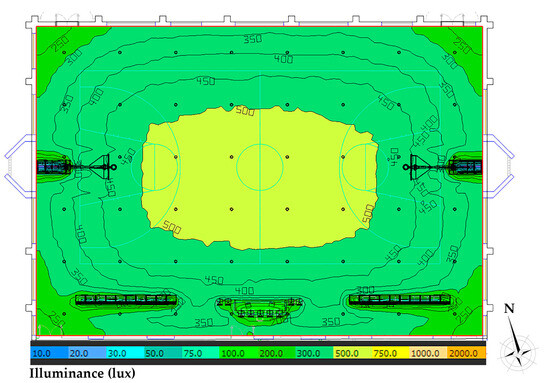 Figure 7. Solar light tube installation layout for the indoor sports hall in Leros and illuminance achieved on the hall’s floor.
 - Facilitation of natural ventilation in the indoor sports hall in Arkalochori, with the installation of two new series with 18 windows each in the opposite long sides of the main hall.
- Upgrading of the outdoor swimming pool center to an indoor one, with the construction of an enclosure and placement of an insulating top cover on the pools’ upper surface whenever they are not in use. A 3D drawing of the proposed enclosure is presented in Figure 8.
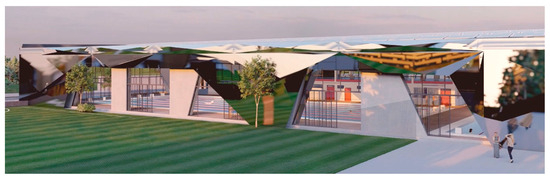 Figure 8. 3D image of the proposed enclosure for the outdoor swimming pool center.
In summary, the proposed passive energy saving measures aim to:
- Reduce the indoor heating and cooling loads by reducing the U-factors of the buildings’ and facilities’ construction elements and preventing direct solar penetration during summer from the transparent surfaces with shading overhangs.
- Reduce swimming pool heating load by upgrading the outdoor center to an indoor one and using the upper-surface-insulation top cover.
- Maximize natural lighting in the indoor sports halls with solar light tubes.
- Facilitate natural ventilation with the installation of new openings in the opposite long sides of the indoor sports hall in Crete.
5.2. Heating and Cooling Load Reduction
The indoor conditioning load and the swimming pools’ heating load were calculated again by applying the same computational process presented in Section 3.1 and Section 3.3, this time assuming that the proposed passive energy saving measures have been introduced in the facilities. The results are summarized in Table 9 and Table 10.
Table 9.
Indoor annual heating and cooling load calculation results for the facilities investigated after the introduction of the proposed passive energy saving measures.
Table 10.
Swimming pool heating load after the introduction of the proposed passive measures.
Table 11 summarizes the annual heating and cooling load percentage drops achieved with the introduction of the proposed passive energy saving measures.
Table 11.
Annual heating and cooling load percentage drop with the introduction of the proposed passive energy saving measures.
From Table 11, we can come to the following conclusions.
- There is impressively high potential for energy saving in swimming pool centers. The heating load achieved reaches almost 96% in the outdoor center thanks to the enclosure construction, while it exceeds 51% in the indoor swimming pools, with only the placement of the upper surface top cover.
- The lowest drop for the indoor conditioning load is achieved for Pancretan Stadium. This is because for this facility, due to its large dimensions and the consequent significantly increased budget for energy performance upgrading (higher than 3,000,000 euros) and the fact that the floor level is practically in contact with the earth, limiting considerably the heat losses or gains from the ambient environment, it was decided only to replace the openings without applying any other type of passive measures.
- The indoor conditioning load drop achieved for the historical Loggia city hall was also rather low, because only the replacement of the existing openings with faithful replicas of the existing ones was permitted by the antiquities authority in charge. No other passive measure was allowed. The building’s roof was already insulated, while the vertical walls of 65 cm thickness keep the U-factor relatively low (within a range of 1.5 W/m2∙K).
- There is also the case of the high school in Kassos, where the passive measures introduced cause cooling load increase. Thanks to the low airtightness of the existing openings, the natural ventilation contributes to the reduction in cooling load. On the contrary, the improved airtightness of the proposed openings, while having an important positive contribution towards the heating load reduction (62%), causes a 55% increase in cooling load.
- If we exclude the aforementioned cases, the percentage drop achieved for the indoor heating and cooling load ranges between 40% and 70%, highlighting the important contribution of the passive measures towards building energy performance upgrading.
6. Active Measures and Final Energy Saving
The proposed and introduced active measures in the facilities examined sensibly focus, on the improvement in efficiency and energy saving for the following final uses.
- Indoor conditioning and ventilation.
- Swimming pool heating.
- Domestic hot water production.
- Indoor and outdoor lighting.
- Electricity production from RESs.
The proposed active energy saving measures are presented in the following sections. The sizing of all active energy systems was executed on the assumption that all the proposed passive energy saving measures presented in Section 5.1 have been installed.
6.1. Indoor Conditioning
Open-loop geo-exchange plants can be considered the most effective technology for indoor conditioning. These leverage the stable thermal properties of underground or surface water resources (aquifer, lakes, or rivers) for heating or cooling with water-to-water heat pumps [83,84]. Statistically, the anticipated annual electricity saving can be higher than 40% [85] compared to the electricity consumption for indoor conditioning with air-to-air heat pumps. Roughly, the indoor cooling load is disposed of through a heat exchanger and the primary open loop in the water resources. On the contrary, the heating load is covered by pumping heat through the heat exchanger and the primary open loop from the water resources.
Open-loop geo-exchange plants were proposed for two of the facilities examined—Pancretan Stadium and the National History Museum of Crete (NHMC)—given that both facilities are located on the coast. Seawater will be pumped in both cases from the aquifer through four and two boreholes, respectively, from 50 m depth.
Given the peak heating and cooling demand in the national stadium and the NHMC after the installation of the proposed passive energy saving measures, the sizing and the main features of two open-loop geo-exchange plants are given in Table 12.
Table 12.
Main technical features of the designed open-loop geo-exchanged plants.
A detailed layout of the installation in NHMC is presented in Figure 9.
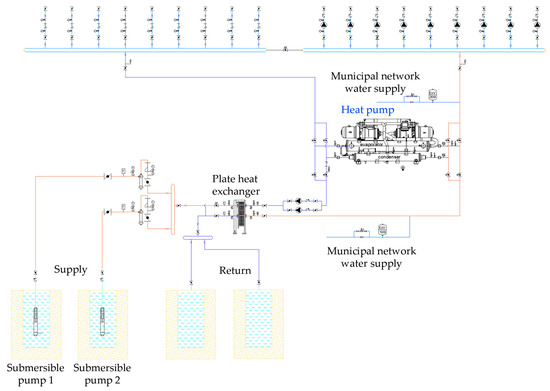
Figure 9.
Detailed connection layout of the open-loop geo-exchange plant in the NHMC.
For all the other facilities, air-to-air heat pumps were proposed for indoor heating and cooling, with SCOP and SEER higher than 4.0 and 5.0, respectively. Hydraulic networks of polypropylene (PPR) glass reinforce pipelines with water as the working medium, and hydronic terminal units were proposed for heating and cooling distribution in the indoor space.
By executing a computational simulation of the annual operation of the open-loop geo-exchange plants and the newly introduced air-to-air heat pumps, with average hourly values, the annual electricity and primary energy consumption and the annual average COP and EER were calculated. The results are presented in Table 13.
Table 13.
Energy sources and primary energy consumption for the indoor heating and cooling of the buildings investigated after the introduction of the proposed passive and active energy saving measures.
In Table 14, the achieved primary energy saving for the indoor conditions of the facilities investigated is listed, assuming that all the proposed passive and active energy saving measures have been introduced.
Table 14.
Primary energy annual saving achieved with the introduction of the proposed passive and active energy saving measures in the facilities investigated.
As seen in Table 14, with the exception of the Loggia historical building, the achieved annual primary energy saving is impressive, ranging from 58% to 85%.
6.2. Swimming Pool Heating
In Pancretan Stadium, a biomass heater of 1 MWth capacity was proposed, given the already existing infrastructure in the stadium, powered currently by a diesel oil burner, and the abundant available biomass resources in the area, coming from olive trees pruning and olive kernel. This biomass heater will be used for swimming pool heating and domestic hot water production. For the outdoor swimming pool center, an air-to-air heat pump with 150 kWth nominal heating capacity was proposed, supported by a biomass heater, during days of low ambient temperature (below 5 °C).
The sizing of both heating systems was executed on the assumption that the presented passive measures in Section 5.1 have been installed. This means that it was assumed that the outdoor swimming pool center will have been upgraded to an indoor one, with the construction of the enclosure presented in Figure 8. Additionally, it was assumed that the insulation top cover will be also put on the pools’ upper surface when they are not in use.
The results for annual energy sources and primary energy consumption for swimming pool heating after the integration of the proposed passive and active energy saving measures are presented in Table 15. The annual average COP of the air-to-air heat pumps for the outdoor swimming pool center was calculated to be 3.9.
Table 15.
Energy sources and primary energy annual consumption for swimming pool heating after integration of the proposed passive and active energy saving measures.
The primary energy saving achieved for the swimming pool center heating is presented in Table 16. The remarkably high energy saving percentage, particularly for the current outdoor swimming pool center, is noteworthy.
Table 16.
Primary energy annual saving for the swimming pool center heating after the integration of the proposed passive and active energy saving measures.
6.3. Domestic Hot Water Production
Domestic hot water is consumed in all the sports facilities investigated: the two indoor sports halls, the swimming pool center, and the national stadium. The heat demand and the current primary energy consumption are presented in Table 7, Section 4.3. The fundamental active system proposed for domestic hot water production in these facilities is the “solar-combi system.” It consists of solar thermal collectors and heat storage tanks. As back-up units, either biomass heaters or air-to-air heat pumps have been proposed. The essential layout of the solar-combi system introduced is given in Figure 10.
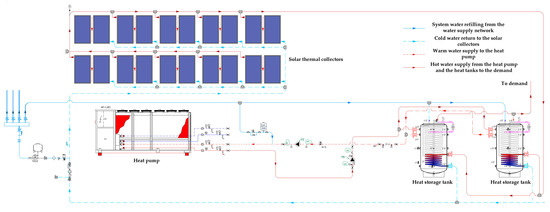
Figure 10.
Layout of the solar-combi system designed for the indoor sports hall in Arkalochori.
As seen in Figure 10, both the solar thermal collectors’ field and the heat pump are connected to the heat tanks. The hot water demand is covered by the heat tanks. The system is sized versus the computated simulation of its annual operation, following a specific operation algorithm. Both the operation algorithm and the mathematical background have been presented in detail in former articles [59,62], and they are omitted from this work for space purposes. The sizing computational process is iteratively executed, introducing as optimization criteria the minimization of the specific heat production cost and the achievement of solar heat penetration higher than 45% versus the total annual heat demand. The fundamental results of this sizing process are summarized in Table 17.
Table 17.
Essential results from the computational optimization sizing process of the proposed solar-combi systems for domestic hot water production.
Finally, in Table 18, the primary energy consumption achieved with the introduction of the proposed solar-combi system is presented, revealing very high primary energy saving results for this final energy use too.
Table 18.
Primary energy annual saving achieved with the proposed solar-combi system for the production of domestic hot water.
6.4. Lighting Consumption, Summary, and Electricity Production from RESs
Regarding the lighting consumption, electricity saving is approached with the installation of new bulbs, luminaires with reflective surfaces, and floodlights, all of them using LED technology. Additionally, the installation of BEMS systems for lighting management is proposed.
Finally, for all facilities examined, the installation of small photovoltaic stations is also proposed in order to cover the remaining electricity consumption after the application of all the proposed passive and active energy saving measures. The remaining electricity demand coverage is based on the so-called net-metering operation mode, according to which the electricity consumption is compensated by the photovoltaic stations’ production on an annual basis. This means that there is no need for real-time demand coverage. This approach is highly favorable, since there is no need for electricity storage devices procurement or installation, thus avoiding a considerable increase in the investments’ cost. The sizing of the photovoltaic stations was based on the available meteorological data [70]. The electricity production from each photovoltaic station should be at least equal to the remaining electricity consumption of the corresponding facility. Usually, the facilities’ roofs or potentially available outdoor space were occupied for the photovoltaic stations’ installation. In cases of flat roofs, the panels were installed with a southern orientation and 30° inclination with regard to the horizontal plane. In cases of inclined roofs, the panels were installed tangentially to the roof surface. A fundamental mathematical background was used for the calculation of the electricity production [86].
The results from the sizing and the electricity produced from the photovoltaic stations are presented in Table 19. As seen in Table 19, the annual capacity factor of the photovoltaic stations varies from 14.7% to 19.9% depending on the orientation and the inclination of the panels’ installation, as well as the selected technology. The highest capacities factors are met for the most recent studies, for which the improved photovoltaic technology regarding their operational efficiency was taken into account. For the municipal hall of Kassos and for the Loggia, the panels were requested by the antiquities authorities to be installed horizontally so as to avoid the deterioration of the buildings’ volume.
Table 19.
Photovoltaic station installation features.
In Table 20, the final summary of the new primary energy consumption is presented after the introduction of the proposed passive and active energy saving systems in the facilities investigated. Negative total primary energy consumption means that the facility becomes a zero-energy facility. This is achieved when the electricity produced from the photovoltaic station is higher than the remaining electricity consumption. This was achieved for 7 out of the 13 facilities investigated. In the other six cases, the achievement of zero energy was not possible due to the following.
Table 20.
Summary of the new primary energy consumption after the introduction of the proposed passive and active energy saving systems in the facilities investigated.
- Violation of the maximum acceptable budget for energy performance upgrading (Pancretan Stadium).
- Lack of the required space for the installation of the required nominal power of the photovoltaic station, in order to fully cover the remaining electricity production in the facility after the application of the proposed passive and active measures (all the rest of the facilities).
7. KPIs and Discussion
In Table 21, essential key performance indicators (KPIs) are presented, together with the projects’ setup costs and the achieved energy procurement cost saving, thanks to the energy performance upgrade projects. A primary energy saving higher than 100% implies energy performance upgrading to a zero-energy facility. CO2 emission percentage drops similar to the primary energy percentage savings are achieved. The RES penetration is calculated as the ratio of the primary energy that corresponds to the electricity or the heat produced by RES technologies (photovoltaics, solar thermal collectors, and biomass heaters) over the new primary energy consumption in the facilities after the introduction of the proposed passive and active energy saving measures. Finally, the payback period is calculated from the division of the setup cost by the annual monetary saving.
Table 21.
Setup cost and key performance indicators for the studied energy performance upgrade projects.
The calculated payback periods vary from 13 to 45 years. This indicator strongly depends on two parameters:
- The initial annual energy procurement cost before the introduction of the proposed interventions.
- Particularly for buildings, the introduction of passive energy saving measures, especially opaque surface insulation and opening replacement, which considerably increase the project’s setup cost.
For example, in the case of the outdoor swimming pool center and the museum, the high annual monetary saving is achieved because of the initially high existing energy procurement cost, which is minimized with the proposed energy saving measures. In these two cases, the payback periods are the minimum ones (within a range of 13 years). Similarly, in the case of the national stadium, the high initial energy procurement cost creates a margin for corresponding high annual monetary saving. For this case, additionally, limited passive energy saving measures were proposed for the reasons explained in Section 5.2. The combination of these two parameters leads to a relatively low payback period (19 years). The extensive energy needs in the indoor sports halls for indoor heating and domestic hot water and the corresponding energy saving achieved, leads to payback periods lower than 30 years. In all other cases (school buildings and municipal halls), the payback periods vary from 30 to 45 years.
Another interesting indicator is the specific annual setup cost, calculated as the ratio of the investment over the achieved primary energy annual saving and the payback period. By introducing in the ratio’s denominator the payback period, the total investment is distributed over the total payback period. In this way, a corresponding annual setup cost is calculated, which is divided by the primary energy annual saving, leading to a new KPI that gives the projects’ annual specific setup cost/kWh of annual primary energy saving. This KPI ranges from EUR 0.05/kWh to EUR 0.32/kWh. Most projects, however, exhibit specific annual setup cost within a range of 0.10–0.15 EUR/kWh.
To conclude, a primary energy saving higher than 100%, which practically means upgrading to zero energy, definitely leads to the minimization of energy consumption and the environmental footprint from the facilities’ operation. It also leads to the minimization of the facilities’ operation cost, particularly regarding the energy procurement cost. On the other hand, upgrading to zero energy does not necessarily exhibit the optimum investment indicators, such as the payback period, especially when expensive passive energy saving measures are proposed or if the initial energy procurement cost is not high.
The most cost-effective projects, with simultaneously the highest achieved annual energy saving, are the sports facilities’ upgrades, with the outdoor swimming pool center exhibiting the highest feasibility, as revealed by the corresponding calculated KPIs. The upgrade of outdoor swimming pool centers to indoor ones and the substitution of diesel oil with biomass pellets or electricity for swimming pool heating is highlighted as the most energy saving and cost-effective investment.
Except sports facilities, the research indicated that considerable cost-effective energy saving was also achieved in the museum. For the other administrative and educational facilities, the energy and monetary savings were lower, due to the relatively lower initial energy consumption.
Apart from the type, the size of the facility and the corresponding energy saving margin also have an important impact on the energy upgrade project’s economic viability. This is clearly depicted in the specific annual setup cost, which ranges from EUR 0.05/kWh for the largest project (Pancretan Stadium) to EUR 0.32/kWh for the smallest one (municipal hall of Kassos).
Additionally, the achievement of a net-zero-energy upgrade is highly affected by the following potential limitations.
- The large dimensions of a facility, which may imply a corresponding increase in the setup cost that cannot be covered by the available funding. This is the case for Pancretan Stadium and the high school of Kassos.
- The highest photovoltaic power that is permitted to be installed and can be licensed for a specific facility, which for public and municipal facilities is defined at 300 kWp. This limitation was also applied in the case of Pancretan Stadium, which requires photovoltaic power higher than 600 kWp for the full coverage of its electricity annual consumption.
- The space available for photovoltaic installation, which may determine the maximum possible installed photovoltaic capacity. This limitation affected the cultural center, the Natural History Museum, the high school of Kassos, and the municipal hall of Rethymno.
- Restrictions regarding the architectural, cultural, and historical identity of the building, which may affect the potential installation of passive energy saving measures. This is the case for the Venetian Loggia municipal hall.
Except the aforementioned cases, all the rest are upgraded to net-zero-energy facilities with the proposed energy saving measures.
Finally, all the proposed passive and active energy saving measures are highly adapted to local climate conditions, as follows.
- Regarding the proposed passive measures, the opaque surface insulation and the opening replacements are typical, obvious solutions aiming to reduce the indoor conditioning loads. Additionally, given the high solar radiation available, overhangs are proposed for most cases to protect indoor overheating from direct solar radiation penetration. Finally, solar-light tubes are sensibly proposed to maximize natural lighting in large indoor spaces, such as the indoor sports halls.
- Solar thermal collectors and photovoltaics are proposed for heat and power production, given the high solar radiation available in the geographic area under consideration.
- For those facilities located in the coastline or close to the sea, the installation of open-loop geo-exchange plants is proposed for maximum energy saving for indoor conditioning. For all the other cases, high-efficiency air-to-air heat pumps are proposed.
- For large facilities with extensive heat demand, such as Pancretan Stadium and the outdoor swimming pool center, biomass heaters operating with locally available solid biomass resources are proposed.
Given the above analysis, it is conceivable that all the proposed measures are technically mature, with numerous installations worldwide. They exhibit high technical applicability, with the best possible economic indicators. From the presented projects, the energy performance upgrading of the Natural History Museum of Crete, Loggia city hall, municipal hall of Rethymno, and the 1st high school of Rethymno have been implemented, while funding for the retrofitting of the high school of Kassos and the indoor sports hall of Leros have been ensured and are expecting to be implemented. As a direction for future work, in a follow-up article, which will complement this one, the real achieved energy saving results from the operation of the upgraded facilities can be presented and compared with the results of the studies. In this way, the current work, limited exclusively to the theoretical calculation phase, will be verified with the measured achieved energy saving results in the municipal facilities examined.
8. Conclusions
Energy performance upgrading of municipal buildings and facilities constitutes a major energy transition. The energy saving margin is large, while the environmental footprint of the facilities’ operation, thanks to the achieved both energy and CO2 emission saving, can be minimized.
Zero-energy upgrading can be achieved with the remaining electricity annual consumption coverage from an electricity production technology from RESs, most typically a photovoltaic station. This can be possible depending on the following major limitations.
- The availability of enough territorial space for the installation of the photovoltaic station.
- The highest photovoltaic power that is permitted to be installed and can be licensed for a specific facility according to the relevant legal framework.
- The availability of the required funding resources.
- Potential restrictions imposed by the historical, cultural, and architectural identity and value of the facility, which may affect the type and the size of the energy saving measures that can be applied.
Even if a zero-energy upgrade is not possible, the achievement of primary energy annual saving from 60% to 80% can be easily achieved with the combination of passive and active energy saving measures. Specifically, on average, a typical indoor conditioning load drop of 50% can be approached with the installation of the appropriate passive measures, while in extreme cases, it can reach 70%. Additionally, 30–40% electricity saving for indoor conditioning can be achieved with the installation of effective active systems (open-loop geo-exchange plants or high-efficiency air-to-air heat pumps). Primary energy saving up to 70% can also be achieved with the installation of solar thermal collectors and heat storage tanks for domestic hot water production, while the anticipated saving for the lighting equipment upgrade is around 50%.
The energy saving potential, especially for sports facilities, is huge. Payback periods for the corresponding investments can be lower than 15 years. Particularly regarding swimming pool centers, primary energy savings higher than 95% can be achieved with the upgrading of outdoor swimming pools to indoor ones.
For administrative and school buildings, the energy saving margin is lower than in sports facilities and the corresponding investments do not exhibit attractive economic indicators. However, the regularly available European or national funding calls for the implementation of municipal and public buildings’ energy retrofitting can help to overcome the obstacle of these projects’ funding and the poor economic indicators.
Additionally, it must be underlined that energy performance upgrade projects applied to educational buildings, apart from their direct energy and monetary saving benefits, can also have an additional and highly important positive side effect, which is their contribution to the education of students on energy saving and on RUE. Educating the next generation about RUE can be of major importance for a more sustainable and effective use of energy.
For all the cases investigated, the achieved energy savings are important and their contribution to the elimination of their environmental footprint is crucial. The monetary annual saving achieved can also be quite important, given the (in general) limited funding resources of these facilities. The money savings from the energy performance upgrades can be invested in the improvement of facilities’ infrastructure and the administrative, educational, cultural, and sports services supplied.
The application of energy performance upgrades for public and municipal buildings and facilities can act as pilot projects for the introduction of similar energy saving measures and technologies in the private sector also: households and commercial buildings. For this reason, their significance is further increased.
Author Contributions
Conceptualization, D.A.K.; methodology, D.A.K., G.M.S., N.S. and A.T.; software, D.A.K. and G.Z.; validation, G.M.S., E.G. and S.Y.; formal analysis, E.G. and S.Y.; investigation, D.A.K., N.S., A.T. and G.Z.; resources, E.D., Y.Y. and A.T.; data curation, E.D. and Y.Y.; writing—original draft preparation, D.A.K.; writing—review and editing, D.A.K.; visualization, D.A.K.; supervision, D.A.K.; project administration, D.A.K. and E.D.; funding acquisition, D.A.K. All authors have read and agreed to the published version of the manuscript.
Funding
This research was funded by the owners of the facilities involved in the form of private contracts: Municipality of Heraklion, Municipality of Rethymno, Municipality of Heroic Island of Kassos. Additionally, this work received funding from the European Commission with the following projects: The Cooperation Program (CP) Interreg V-A “Greece–Cyprus 2014–2020”, project “ANAVATHMEZO”; Horizon 2020 project “New Energy Solutions Optimized for Islands” (NESOI), sub-project “Sustainable Actions for Viable Energy” (SAVE), under the grant number EL-056-2021-006; Life Local Ownership Of Power (Life LOOP) project.
Data Availability Statement
The original contributions presented in this study are included in the article. Further inquiries can be directed to the corresponding author.
Conflicts of Interest
The authors declare no conflicts of interest.
References
- Directive (EU) 2023/1791 of the European Parliament and of the Council of 13 September 2023 on Energy Efficiency and Amending Regulation (EU) 2023/955 (Recast) (Text with EEA Relevance). Available online: https://eur-lex.europa.eu/legal-content/EN/TXT/?uri=OJ%3AJOL_2023_231_R_0001&qid=1695186598766 (accessed on 1 September 2025).
- European Commission. In Focus: Energy Efficiency in Buildings. Available online: https://commission.europa.eu/news-and-media/news/focus-energy-efficiency-buildings-2020-02-17_en (accessed on 13 October 2025).
- International Energy Agency. Buildings. Available online: https://www.iea.org/energy-system/buildings (accessed on 13 October 2025).
- European Commission. The European Green Deal. Available online: https://commission.europa.eu/strategy-and-policy/priorities-2019-2024/european-green-deal_en (accessed on 13 October 2025).
- Ortiz-Peña, A.; Honrubia-Escribano, A.; Gómez-Lázaro, E. Electricity Consumption and Efficiency Measures in Public Buildings: A Comprehensive Review. Energies 2025, 18, 609. [Google Scholar] [CrossRef]
- Zekić-Sušac, M.; Has, A.; Knežević, M. Predicting energy cost of public buildings by artificial neural networks, CART, and random forest. Neurocomputing 2021, 439, 223–233. [Google Scholar] [CrossRef]
- European Commission: Public Buildings. Available online: https://energy.ec.europa.eu/topics/energy-efficiency/energy-efficiency-targets-directive-and-rules/public-buildings_en (accessed on 15 September 2025).
- European Commission. Energy Use in Buildings. Available online: https://energy.ec.europa.eu/system/files/2016-11/energyuse_0.pdf (accessed on 2 September 2025).
- Huang, J.; Lv, H.; Gao, T.; Feng, W.; Chen, Y.; Zhou, T. Thermal properties optimization of envelope in energy-saving renovation of existing public buildings. Energy Build. 2014, 75, 504–510. [Google Scholar] [CrossRef]
- Maghoul, A.; Sundaram, S.; Maghami, M.R. Net zero energy buildings: An overview of passive and active designs. Energy Rep. 2025, 14, 1327–1348. [Google Scholar] [CrossRef]
- Mujeebu, M.A.; Bano, F. Integration of passive energy conservation measures in a detached residential building design in warm humid climate. Energy 2022, 255, 124587. [Google Scholar] [CrossRef]
- Cai, S.; Deng, X.; Beiyuan, J.; Chen, X.; Liu, D.; Lv, D.; Duan, C.; Lin, L.; Cha, R.; Xie, W.; et al. Review of synthetic polymer-based thermal insulation materials in construction and building. J. Build. Eng. 2024, 97, 110846. [Google Scholar] [CrossRef]
- Zhang, X.; Tang, J.; Wang, P.; Liu, Y.; Dong, X.; Jiao, P.; Zhang, X.; Yin, R.; Xie, Y.; Guo, M.; et al. Carbonized corn straw core: A green building material with high-efficiency EMI shielding, thermal, and sound insulation. Ind. Crops Prod. 2025, 230, 121107. [Google Scholar] [CrossRef]
- El Mendili, Y.; Benzaama, M.-H.; Bejček, L.; Mège, R.; Hennequart, F.; El Haddaji, B. Algae-based earth materials for sustainable construction: Toward a new generation of bio-stabilized building solutions. Resour. Conserv. Recycl. 2025, 221, 108401. [Google Scholar] [CrossRef]
- Mouguen, F.; Charai, M.; Oubaha, S.; Mghazli, M.O.; Mezrhab, A.; Taha, Y.; Benzaazoua, M. Synergistic optimization of plant-based natural insulation materials with starch and waste-expanded polystyrene composite binders: Advancing thermo-acoustic efficiency for sustainable building envelopes. Energy Build. 2025, 341, 115834. [Google Scholar] [CrossRef]
- Arumugam, P.; Ramalingam, V. Thermal comfort enhancement of office buildings located under warm and humid climate through phase change material and insulation coupled with natural ventilation. Sustain. Energy Technol. Assess. 2024, 63, 103657. [Google Scholar] [CrossRef]
- Jin, D.; Park, J.H.; Nam, J.; Kim, S. Repurposing recycled plastic banners for the development and creation of innovative high-performance building insulation materials. Case Stud. Constr. Mater. 2025, 22, e04521. [Google Scholar] [CrossRef]
- Lei, Z.; Qi, W.; Zhang, L.; Yang, J.; Zhuorui, Z. Preparation and comprehensive performance optimization of green insulation building materials based on blast furnace slag. J. Build. Eng. 2025, 106, 112591. [Google Scholar] [CrossRef]
- Wijewardane, S.; Vasilakopoulou, K.; Santamouris, M. Dynamic solar shadings: Redefining the building envelope. Sol. Compass 2025, 16, 100139. [Google Scholar] [CrossRef]
- Appelbaum, J.; Aronescu, A.; Maor, T. Shading by Overhang PV Collectors. Appl. Sci. 2019, 9, 4280. [Google Scholar] [CrossRef]
- Humaidan, O.; Almazam, K.; Bashir, F.M.; Alshayeb, M.J.; Al-Tamimi, N.; Dodo, Y.A. Comprehensive assessment of dynamic shading devices for daylighting and energy management in Saudi Arabian hot-arid buildings. Energy Build. 2025, 346, 116180. [Google Scholar] [CrossRef]
- Arnaoutakis, G.E.; Katsaprakakis, D.A. Energy performance of buildings with thermochromic windows in Mediterranean climates. Energies 2021, 14, 6977. [Google Scholar] [CrossRef]
- Tällberg, R.; Jelle, B.P.; Loonen, R.; Gao, T.; Hamdy, M. Comparison of the energy saving potential of adaptive and controllable smart windows: A state-of-the-art review and simulation studies of thermochromic, photochromic and electrochromic technologies. Sol. Energy Mater. Sol. Cells 2019, 200, 109828. [Google Scholar] [CrossRef]
- Tolón-Becerra, A.; Lastra-Bravo, X.B.; Fernández-Membrive, V.J.; Flores-Parra, I. Opportunities in Spanish Energy Efficiency. Current Situation, Trends and Potential in the Building Sector. Energy Procedia 2013, 42, 63–72. [Google Scholar] [CrossRef]
- Karakosta, C.; Vryzidis, I. Cost-Effective Energy Retrofit Pathways for Buildings: A Case Study in Greece. Energies 2025, 18, 4014. [Google Scholar] [CrossRef]
- Galatioto, A.; Ciulla, G.; Ricciu, R. An overview of energy retrofit actions feasibility on Italian historical buildings. Energy 2017, 137, 991–1000. [Google Scholar] [CrossRef]
- Kyritsi, E.; Katsaprakakis, D.; Dakanali, E.; Yiannnakoudakis, Y.; Zidianakis, G.; Michael, A.; Michopoulos, A. Energy renovation of two historical buildings in Mediterranean area. J. Cult. Herit. 2025, 71, 106–113. [Google Scholar] [CrossRef]
- Sami Döndüren, M.; Sişik, O. Materials, used in historical buildings, analysis methods and solutions puroposals. E3S Web Conf. 2017, 19, 03019. [Google Scholar] [CrossRef]
- Akkurt, G.G.; Aste, N.; Borderon, J.; Buda, A.; Calzolari, M.; Chung, D.; Costanzo, V.; Del Pero, C.; Evola, G.; Huerto-Cardenas, H.; et al. Dynamic thermal and hygrometric simulation of historical buildings: Critical factors and possible solutions. Renew. Sustain. Energy Rev. 2020, 118, 109509. [Google Scholar] [CrossRef]
- Coelho, G.B.A.; Henriques, F.M.A. Performance of passive retrofit measures for historic buildings that house artefacts viable for future conditions. Sustain. Cities Soc. 2021, 71, 102982. [Google Scholar] [CrossRef]
- Aghimien, E.I.; Li, D.H.W.; Tsang, E.K.-W. Bioclimatic architecture and its energy-saving potentials: A review and future directions. Eng. Constr. Archit. Manag. 2021, 29, 961–988. [Google Scholar] [CrossRef]
- Couvelas, A. Bioclimatic building design theory and application. Procedia Manuf. 2020, 44, 326–333. [Google Scholar] [CrossRef]
- Manzano-Agugliaro, F.; Montoya, F.G.; Sabio-Ortega, A.; García-Cruz, A. Review of bioclimatic architecture strategies for achieving thermal comfort. Renew. Sustain. Energy Rev. 2015, 49, 736–755. [Google Scholar] [CrossRef]
- Sergei, K.; Shen, C.; Jiang, Y. A review of the current work potential of a Trombe wall. Renew. Sustain. Energy Rev. 2020, 130, 109947. [Google Scholar] [CrossRef]
- Torcellini, P.; Pless, S. Trombe Walls in Low-Energy Buildings: Practical Experiences; UNT Digital Library, University of North Texas Libraries: Denton, TX, USA, 2004; Available online: https://digital.library.unt.edu/ark:/67531/metadc1411092/citation/#top (accessed on 2 September 2025).
- Almaleck, P.; Massucco, S.; Mosaico, G.; Saviozzi, M.; Serra, P.; Silvestro, F. Electrical consumption forecasting in sports venues: A proposed approach based on neural networks and ARIMAX Models. Sustain. Cities Soc. 2024, 100, 105019. [Google Scholar] [CrossRef]
- Adel El-Kadi, A.E.M.; Fanny, M.A. Architectural designs and thermal performances of school sports-halls. Appl. Energy 2003, 76, 289–303. [Google Scholar] [CrossRef]
- Kisilewicz, T.; Dudzińska, A. Summer overheating of a passive sports hall building. Arch. Civ. Mech. Eng. 2015, 15, 1193–1201. [Google Scholar] [CrossRef]
- Katsaprakakis, D.A.; Papadakis, N.; Giannopoulou, E.; Yiannnakoudakis, Y.; Zidianakis, G.; Kalogerakis, M.; Katzagiannakis, G.; Dakanali, E.; Stavrakakis, G.M.; Kartalidis, A. Rational Use of Energy in Sports Centres to Achieve Net Zero: The SAVE Project (Part A). Energies 2023, 16, 4040. [Google Scholar] [CrossRef]
- Katsaprakakis, D.A.; Papadakis, N.; Giannopoulou, E.; Yiannnakoudakis, Y.; Zidianakis, G.; Katzagiannakis, G.; Dakanali, E.; Stavrakakis, G.M.; Kartalidis, A. Rational Use of Energy in Sport Centers to Achieving Net Zero—The SAVE Project (Part B: Indoor Sports Hall). Energies 2023, 16, 7308. [Google Scholar] [CrossRef]
- Qian, F.; Shi, Z.; Yang, L. A Review of Green, Low-Carbon, and Energy-Efficient Research in Sports Buildings. Energies 2024, 17, 4020. [Google Scholar] [CrossRef]
- Zuccari, F.; Santiangeli, A.; Orecchini, F. Energy analysis of swimming pools for sports activities: Cost effective solutions for efficiency improvement. Energy Procedia 2017, 126, 123–130. [Google Scholar] [CrossRef]
- Kumar, A.; Alam, T. A review on geothermal energy systems and various approaches to enhance the system’s performance. Energy Build. 2025, 344, 115962. [Google Scholar] [CrossRef]
- Liang, B.; Chen, M.; Orooji, Y. Effective parameters on the performance of ground heat exchangers: A review of latest advances. Geothermics 2022, 98, 102283. [Google Scholar] [CrossRef]
- Fuentes, E.; Waddicor, D.A.; Salom, J. Improvements in the characterization of the efficiency degradation of water-to-water heat pumps under cyclic conditions. Appl. Energy 2016, 179, 778–789. [Google Scholar] [CrossRef]
- Kimming, M.; Sundberg, C.; Nordberg, Å.; Baky, A.; Bernesson, S.; Norén, O.; Hansson, P.A. Biomass from agriculture in small-scale combined heat and power plants—A comparative life cycle assessment. Biomass Bioenergy 2011, 35, 1572–1581. [Google Scholar] [CrossRef]
- Srirangan, K.; Akawi, L.; Moo-Young, M.; Chou, C.P. Towards sustainable production of clean energy carriers from biomass resources. Appl. Energy 2012, 100, 172–186. [Google Scholar] [CrossRef]
- Springer, T.L. Biomass yield from an urban landscape. Biomass Bioenergy 2012, 37, 82–87. [Google Scholar] [CrossRef]
- Savvakis, N.; Tournaki, S.; Tarasi, D.; Kallergis, N.; Daras, T.; Tsoutsos, T. Environmental effects from the use of traditional biomass for heating in rural areas: A case study of Anogeia, Crete. Environ. Dev. Sustain. 2022, 24, 5473–5495. [Google Scholar] [CrossRef]
- Sperling, K. How does a pioneer community energy project succeed in practice? The case of the Samsø Renewable Energy Island. Renew. Sustain. Energy Rev. 2017, 71, 884–897. [Google Scholar] [CrossRef]
- Jantzen, J.; Kristensen, M.; Haunstrup Christensen, T. Sociotechnical transition to smart energy: The case of Samso 1997–2030. Energy 2018, 162, 20–34. [Google Scholar] [CrossRef]
- Chalkiadakis, G.; Akasiadis, C.; Savvakis, N.; Tsoutsos, T.; Hoppe, T. Providing a scientific arm to renewable energy cooperatives. In The Role of Exergy in Energy and the Environment; Green Energy and Technology; Springer: Cham, Switzerland, 2018. [Google Scholar]
- Yfanti, S.; Katsaprakakis, D.; Sakkas, N.; Condaxakis, C.; Karapidakis, E.; Syntichakis, S.; Stavrakakis, G.M. The Role of Energy Communities in the Achievement of a Region’s Energy Goals: The Case of a Southeast Mediterranean Region. Energies 2025, 18, 1327. [Google Scholar] [CrossRef]
- Said, S.; Mellouli, S.; Alqahtani, T.; Algarni, S.; Ajjel, R.; Alshammari, B.M.; Kolsi, L. Optimizing thermal performance of evacuated tube solar collectors with cascaded phase change materials. Case Stud. Therm. Eng. 2025, 70, 106138. [Google Scholar] [CrossRef]
- Caldarelli, A.; Gaudino, E.; De Luca, D.; Farooq, U.; Musto, M.; Di Gennaro, E.; Russo, R. Low emissivity thin film coating to enhance the thermal conversion efficiency of selective solar absorber in high vacuum flat plate collectors. Thin Solid Film. 2023, 764, 139632. [Google Scholar] [CrossRef]
- Khan, R.; Hassan, W.H.; Alizadeh, A.; Singh, P.K.; Hussein, A.A.; Hajlaoui, K.; Dixit, S.; Singh, A. Improving the thermal performance of flat-plate solar collectors for building applications through hybrid nanofluids and vortex-inducing geometries. Case Stud. Therm. Eng. 2025, 72, 106377. [Google Scholar] [CrossRef]
- Vahidhosseini, S.M.; Rashidi, S.; Hsu, S.H.; Yan, W.M.; Rashidi, A. Integration of solar thermal collectors and heat pumps with thermal energy storage systems for building energy demand reduction: A comprehensive review. J. Energy Storage 2024, 95, 112568. [Google Scholar] [CrossRef]
- Verma, V.; Murugesan, K. Experimental study of solar energy storage and space heating using solar assisted ground source heat pump system for Indian climatic conditions. Energy Build. 2017, 139, 567–577. [Google Scholar] [CrossRef]
- Katsaprakakis, D.A.; Zidianakis, G. Optimized Dimensioning and Operation Automation for a Solar-Combi System for Indoor Space Heating. A Case Study for a School Building in Crete. Energies 2019, 12, 177. [Google Scholar] [CrossRef]
- Rosato, A.; Ciervo, A.; Ciampi, G.; Sibilio, S. Effects of solar field design on the energy, environmental and economic performance of a solar district heating network serving Italian residential and school buildings. Renew. Energy 2019, 143, 596–610. [Google Scholar] [CrossRef]
- Lugo, S.; Best, R.; Gómez, V.H.; Morales, L.I.; García-Valladares, O. Numerical simulation and experimental validation of an outdoor-swimming-pool solar heating system in warm climates. Sol. Energy 2019, 189, 45–56. [Google Scholar] [CrossRef]
- Katsaprakakis, D.A. Computational Simulation and Dimensioning of Solar-Combi Systems for Large-Size Sports Facilities: A Case Study for the Pancretan Stadium, Crete, Greece. Energies 2020, 13, 2285. [Google Scholar] [CrossRef]
- Abdel-razak, M.H.; Emam, M.; Ookawara, S.; Hassan, H. Study the performance of a novel design of twin hybrid Darrieus-Savonius vertical-axis wind turbines integrated with building water storage tanks: 3D optimization study. Renew. Energy 2026, 256 Pt B, 124024. [Google Scholar] [CrossRef]
- An, J.; Hong, T. Energy harvesting using rooftops in urban areas: Estimating the electricity generation potential of PV and wind turbines considering the surrounding environment. Energy Build. 2024, 323, 114807. [Google Scholar] [CrossRef]
- Sanda, M.G.; Emam, M.; Ookawara, S.; Hassan, H. Techno-enviro-economic evaluation of on-grid and off-grid hybrid photovoltaics and vertical axis wind turbines system with battery storage for street lighting application. J. Clean. Prod. 2025, 491, 144866. [Google Scholar] [CrossRef]
- Qudah, A.; Almerbati, A.; Mokheimer, E.M.A. Techno-economic analysis and optimization of standalone Hybrid Photovoltaic (PV)/Wind Turbine (WT) with water tank storage driven Reverse Osmosis (RO) desalination system. Desalination 2025, 600, 118522. [Google Scholar] [CrossRef]
- Castellini, M.; Castelli, C.; Gusperti, C.; Lupi, V.; Vergalli, S. Balancing climate policies and economic development in the Mediterranean countries. Energy Econ. 2025, 145, 108452. [Google Scholar] [CrossRef]
- Hashempour, N.; Taherkhani, R.; Mahdikhani, M. Energy performance optimization of existing buildings: A literature review. Sustain. Cities Soc. 2020, 54, 101967. [Google Scholar] [CrossRef]
- Li, Y.; Kubicki, S.; Guerriero, A.; Rezgui, Y. Review of building energy performance certification schemes towards future improvement. Renew. Sustain. Energy Rev. 2019, 113, 109244. [Google Scholar] [CrossRef]
- European Centre for Medium-Range Weather Forecasts (ECMWF): ERA5 from the Copernicus Climate Change Service (C3S) Climate Date Store. ERA5 Hourly Data on Single Levels from 1959 to Present. Available online: https://cds.climate.copernicus.eu/#!/search?text=ERA5&type=dataset (accessed on 4 September 2025).
- Kreider, J.; Rabl, A.; Curtiss, P. Heating and Cooling of Buildings, 3rd ed.; CRC Press: Boca Raton, FL, USA, 2017. [Google Scholar]
- Spitler, J.D. Load Calculation Applications Method, 2nd ed.; ASHRAE Editions: Atlanta, GA, USA, 2014. [Google Scholar]
- Transient System Simulation Tool (TRNSYS). Available online: https://www.trnsys.com/ (accessed on 4 September 2025).
- Kteniadakis, Μ. Heat Transfer Applications, 2nd ed.; Ziti Editions: Athens, Greece, 2021. [Google Scholar]
- 2009 ASHRAE Handbook—Fundamentals (SI Edition); American Society of Heating, Refrigerating and Air-Conditioning Engineers, Inc.: Atlanta, GA, USA, 2009.
- Official Hellenic Governmental Gazette. Directive on Buildings’ Energy Performance. In Official Governmental Gazette 2367Β’/12-7-2017; Official Hellenic Governmental Gazette: Athens, Greece, 2017. Available online: https://ypen.gov.gr/energeia/energeiaki-exoikonomisi/ktiria/kenak/ (accessed on 4 September 2025).
- Technical Chamber of Greece. Technical Directive 20701-1/2017. Detailed national parameter specifications for calculating the energy performance of buildings and issuing the energy performance certificate. In Official Governmental Gazette 4003Β’/17-11-2017; Technical Chamber of Greece: Athens, Greece, 2017. [Google Scholar]
- Assimakopoulos, D.; Arampatzis, G.; Aggelis-Dimakis, A.; Kartalidis, A.; Tsiligkiridis, G. Renewable Energy Sources—Potential & Technologies, 1st ed.; Sophia Editions: Athens, Greece, 2015. [Google Scholar]
- Manwell, J.F.; McGowan, J.G.; Rogers, A.L. Wind Energy Explained: Theory, Design and Application, 2nd ed.; John Wiley & Sons: Chicago, IL, USA, 2009. [Google Scholar]
- The Engineering Toolbox: Water—Saturation Pressure vs. Temperature. Available online: https://www.engineeringtoolbox.com/water-vapor-saturation-pressure-d_599.html (accessed on 4 September 2025).
- The Engineering Toolbox: Water—Heat of Vaporization vs. Temperature. Available online: https://www.engineeringtoolbox.com/water-properties-d_1573.html (accessed on 4 September 2025).
- Municipality of Heraklion. The City Hall. Available online: https://www.heraklion.gr/en/municipality/city-hall//city-hall.html (accessed on 8 September 2025).
- Aggarwal, V.; Meena, C.S.; Kumar, A.; Alam, T.; Kumar, A.; Ghosh, A.; Ghosh, A. Potential and Future Prospects of Geothermal Energy in Space Conditioning of Buildings: India and Worldwide Review. Sustainability 2020, 12, 8428. [Google Scholar] [CrossRef]
- Xinguo, L. Thermal performance and energy saving effect of water-loop heat pump systems with geothermal. Energy Convers. Manag. 1998, 39, 295–301. [Google Scholar] [CrossRef]
- The Geothermal Exchange Organization. GeoExchange Systems: Renewable and Ready. Available online: https://geoexchange.org/geoexchange-systems-renewable-and-ready/ (accessed on 16 September 2025).
- Fragkiadakis, I. Photovoltaic Systems, 4th ed.; Ziti Editions: Athens, Greece, 2019. [Google Scholar]


Disclaimer/Publisher’s Note: The statements, opinions and data contained in all publications are solely those of the individual author(s) and contributor(s) and not of MDPI and/or the editor(s). MDPI and/or the editor(s) disclaim responsibility for any injury to people or property resulting from any ideas, methods, instructions or products referred to in the content. |
© 2025 by the authors. Licensee MDPI, Basel, Switzerland. This article is an open access article distributed under the terms and conditions of the Creative Commons Attribution (CC BY) license (https://creativecommons.org/licenses/by/4.0/).