Abstract
This study presents the first comprehensive investigation establishing the relationship between color consistency and luminous efficacy of radiation (LER) in phosphor-converted light-emitting diodes (LEDs), introducing novel selection criteria for energy-efficient applications. A systematic analysis of LED sources with nominal correlated color temperature (CCT) values of 3000 K and 4000 K across color-rendering index (CRI Ra) thresholds (≥60 and ≥80) was conducted, evaluating spectral power distributions (SPD) and chromaticities relative to 3-step, 5-step color-consistency circles, and 7-step American National Standards Institute (ANSI) quadrangles. Novel findings reveal a previously uncharacterized strong positive correlation between color consistency and luminous efficacy across all analyzed LED sources. LEDs with chromaticities within 3-step color-consistency circles consistently demonstrated superior LER values compared to 5-step boundaries, while sources outside established circles showed significantly inferior energy performance despite meeting nominal CCT requirements. The research establishes that tighter color-consistency tolerances directly correlate with enhanced luminous efficacy, revealing an intrinsic relationship between color quality and energy performance. These breakthrough findings introduce a paradigm shift in LED selection methodology, providing lighting professionals with evidence-based criteria that simultaneously optimize color consistency and energy efficiency, enabling more sustainable lighting solutions through integrated quality–performance assessment.
1. Introduction
Light-emitting diode (LED) technology has fundamentally transformed the lighting industry over the past two decades, establishing itself as the predominant solid-state lighting solution through its superior energy efficiency compared to conventional incandescent and fluorescent systems [1,2]. This technological revolution represents a remarkable achievement, with modern LEDs demonstrating luminous efficacies exceeding 200 lm/W [3,4]—a ten-fold improvement over traditional incandescent bulbs that achieve merely 20 lm/W [5,6]. The widespread adoption of LED technology stems from its exceptional energy performance [7,8,9], extended operational lifespan [10,11], and enhanced design versatility [12,13,14]. While traditional lighting sources typically operate for only 1000–2000 h, LEDs maintain efficient performance for 25,000–50,000 h or more [2,15], substantially reducing maintenance costs and replacement frequency. Furthermore, their compact form and directional light output capabilities enable innovative lighting design solutions that were previously unattainable with conventional technologies. This remarkable advancement has been enabled through systematic progress in semiconductor materials engineering [16], phosphor composition optimization [5,17,18], and sophisticated thermal management strategies [19,20,21]. These innovations have facilitated substantial reductions in global lighting-related energy consumption, with studies indicating that widespread LED adoption could significantly reduce worldwide lighting energy demand [22,23,24]. As a result, LED technology has positioned itself as a cornerstone for addressing escalating energy requirements and environmental sustainability challenges [25,26,27], marking a pivotal moment in the evolution of lighting technology. The exceptional energy efficiency of LED lighting emerges from the synergistic interaction of three primary factors: power supply architecture, optical design, and semiconductor chip characteristics. At the foundation lies the power supply method, where high-quality LED drivers ensure stable electrical parameters while minimizing conversion losses. The optical system—comprising precisely engineered lenses, reflectors, and diffusers—works with the power supply to not only control light distribution but also maximize the utilization efficiency of the generated luminous flux. Central to this integrated system are the LED chips themselves, whose fundamental properties including luminous efficacy, thermal behavior, and long-term stability directly govern the overall energy performance of the luminaire. In LED luminaires operating under constant parameters—where identical control circuits and supply power are maintained with only the semiconductor chip varying—a remarkable linear relationship emerges between energy efficiency and luminous efficacy of radiation. This linearity occurs because the entire LED’s spectrum of emitted radiation falls within the visible range, allowing luminous efficacy of radiation (LER) to serve as a direct measure of LED energy efficiency. This fundamental relationship proves crucial for LED manufacturers and researchers, as it simplifies the optimization process by enabling focus on a single parameter to achieve both energy and quality performance.
While energy efficiency captures the attention of engineers and policymakers, the color quality determines whether end users will embrace LED technology in their daily lives. The color quality parameters—particularly color consistency—represent fundamental determinants of user acceptance, visual comfort, commercial viability, and application-specific performance requirements [28]. The ability to maintain consistent color output across varying operational conditions and throughout the product lifecycle remains a significant challenge that directly impacts broader LED technology implementation across diverse applications, from residential lighting to specialized commercial and industrial uses. Color consistency is typically quantified using metrics such as correlated color temperature (CCT), general color-rendering index (CRI Ra), and chromaticities [18,29,30]. To illustrate the importance of these parameters, consider that even small variations in chromaticities can be perceptible to the human eye [31,32,33] and create an undesirable patchwork effect in lighting installations [34]. Inconsistent light color can negatively affect visual comfort [35], perceived product quality [36,37], and the aesthetic integration of lighting in architectural or retail environments [38,39,40]. In retail settings, for instance, inconsistent color rendering can distort merchandise appearance [41] and negatively impact sales [42], while in residential applications [43], it can create an uncomfortable living environment that users may struggle to define but instinctively dislike [44,45].
Various techniques have been proposed to enhance LED color consistency, including ANSI binning using 7-step quadrangles [46], CIE-recommended u′,v′ circle methods [47] (Figure 1), active color control systems [48,49], and multi-channel LED configurations [50]. While these approaches show promise, each comes with trade-offs in terms of cost, complexity, and implementation feasibility. ANSI binning, for example, helps ensure initial color consistency [51] but requires sophisticated sorting processes [52] that can increase manufacturing costs. Active color-control systems offer real-time adjustment capabilities [53] but add electronic complexity and potential failure points [54]. These approaches represent ongoing efforts to address the dual challenges of maintaining both energy efficiency and color quality in LED lighting systems [55,56,57], with the ultimate goal of achieving lighting solutions [58,59] that satisfy both technical performance requirements and human visual preferences [60,61].
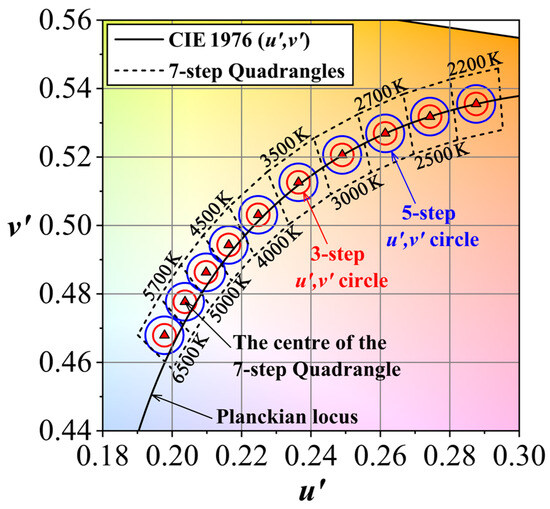
Figure 1.
The CIE 1976 chromaticity diagram showing ANSI C78.377 7-step quadrangles (black dashed lines) and 3-step u′,v′ circles (red) and 5-step u′,v′ circles (blue) used for LED binning.
However, these approaches often involve trade-offs, including increased system complexity, higher manufacturing costs, or potential reductions in luminous efficacy. The relationship between energy efficiency and color consistency represents a fundamental design challenge in modern LED lighting systems. Manufacturing processes focused on maximizing LED luminous efficacy may result in broader color variations [62], as relaxed binning tolerances increase chromaticity spread. Despite significant progress, the potential trade-off between energy efficiency and color consistency raises an important question for both manufacturers and researchers: does improving color consistency inherently compromise energy performance, or can both parameters be optimized simultaneously?
Some studies suggest that pursuing ultra-high color uniformity may necessitate additional optical or electronic components that slightly reduce overall system efficiency [63,64]. Conversely, strategies to maximize luminous efficacy—such as operating at higher drive currents or using fewer phosphor layers—can exacerbate chromaticity variations [65]. These findings imply a potential inverse relationship between the two parameters. Foundational work by Ohno [29] established standard methods to evaluate color rendering and chromaticity in LEDs, highlighting how phosphor-converted white LEDs can achieve high efficacy but may suffer from chromaticity variations due to manufacturing tolerances and thermal effects. Royer et al. [66] advanced this discussion by introducing the TM-30 method [67], to describe color quality more comprehensively. Their analyses demonstrated that LED products evaluation according to TM-30 recommendation achieve better visual consistency, although often at the cost of slightly lower efficacy due to broader phosphor spectra. In parallel, research has found that consumers notice even small chromaticity differences between nominally identical LED products [68].
Given the increasing demand for lighting systems that deliver both energy efficiency and visual consistency, systematic research is urgently needed to clarify this fundamental relationship. Existing studies predominantly focus on specific design strategies, prototypes, or controlled laboratory conditions, leaving practical trade-offs in real-world commercial products significantly underexplored. By analyzing experimental data from a representative sample of commercial LED lighting products, this study addresses this critical knowledge gap. Specifically, this research quantifies how enhanced color consistency influences energy performance in commercially available LEDs. Understanding this relationship is essential for informing product design decisions, developing realistic efficiency standards that incorporate color quality requirements, and guiding manufacturers toward solutions that effectively balance visual quality with sustainability objectives. The findings contribute to the broader challenge of optimizing LED lighting systems where energy efficiency and color consistency must be simultaneously achieved. This study investigates the quantitative relationship between color consistency and luminous efficacy of radiation (LER) in phosphor-converted light-emitting diodes (LEDs), introducing novel evidence-based selection criteria for energy-efficient applications that maintain superior color performance.
2. Materials and Methods
The relationship between energy efficiency described by LER and color consistency was investigated by analyzing typical LEDs commonly employed in outdoor and indoor installations. This analysis utilized spectral power distribution (SPD) data from contemporary white phosphor-converted LEDs, encompassing a comprehensive range of commercially available LED sources derived from publicly available databases [69,70,71]. The databases consist of LED light sources that are widely used in general lighting installations, sourced from two major government-funded initiatives. The first dataset originated from the EMPIR 15SIB07 PhotoLED project, a multi-year European research initiative that systematically collected and measured 1494 relative spectral power distributions from LED products of different types, including AC- and DC-operated bulbs, spots, tubes, street lamps, LED strips, downlight luminaires, and products from a large number of manufacturers. EMPIR 15SIB07 PhotoLED—Database of LED product spectra. This EURAMET European Metrology Programme for Innovation and Research (EMPIR) project addressed the need to support the introduction and uptake of new solid state lighting (SSL) products and developed the basis for a new photometric system based on white light-emitting diodes. The EMPIR PhotoLED database includes the measurements were carried out across various laboratories (including manufacturers of LED products, test laboratories, and National Metrology Institutes).
The second major dataset was derived from the PNNL (Pacific Northwest National Laboratory) LED database, which represents another extensive government-funded effort. PNNL’s work is supported by DOE’s Building Technologies Office through the Solid-State Lighting Program, focused on research to realize tremendous energy savings with the goal to cut U.S. lighting-related energy use by 75 percent by 2035. The Pacific Northwest National Laboratory database similarly encompasses thousands of white LEDs collected from the commercial market over multiple years of systematic data gathering.
The analyzed LEDs are typically based on phosphor-converted technology, utilizing blue excitation in conjunction with yellow phosphor conversion. The scope of this study excludes specialized LED solutions where spectral characteristics are modified through multi-phosphor combinations or alternative spectral engineering approaches.
The selected LEDs were characterized by diverse SPD and colorimetric parameters, representing all categories of LEDs used in practical lighting applications to ensure the representativeness of results across the entire spectrum of available LED technologies.
For interior lighting applications, conventional solutions typically employ light sources with 4000 K nominal correlated color temperature (CCT) and color-rendering index (CRI Ra) requirements of ≥80 [72,73,74]. In contrast, contemporary road lighting applications follow recent technological developments and applicable international standards that recommend implementing light sources with maximum CCT values not exceeding 3000 K [75,76]. This recommendation stems from comprehensive analyses of spectral composition effects on both natural environments and human health.
The adoption of lower CCT values in road lighting applications directly correlates with light-pollution mitigation, which represents a significant ecological challenge in contemporary urban environments [77,78,79]. Light sources with elevated blue content—characteristic of 4000 K and higher CCT values—demonstrate significantly greater atmospheric scattering properties, thereby intensifying sky glow phenomena and adversely affecting astronomical observations [80,81]. Additionally, extensive scientific research has demonstrated that high CCT light emission exerts detrimental effects on living organisms, particularly within nocturnal ecosystems [82,83]. The blue spectral component disrupts natural behavioral patterns of nocturnal fauna, interferes with avian migration processes, and disturbs insect reproductive cycles, consequently resulting in adverse biodiversity impacts [84,85].
This approach represents a substantial paradigm shift from previous engineering practices, where lighting installations commonly utilized LED sources with 4000 K nominal CCT in outdoor applications. This transformation aligns with the European Union’s Sustainable Development Goals (SDG) strategy for environmental protection and ecosystem impact minimization [86].
Figure 2 and Figure 3 present a comprehensive comparison of spectral power distributions, chromaticity parameters, and colorimetric characteristics of LEDs with 3000 K nominal CCT. The analysis encompasses detailed examination of spectral power distributions for respective binning groups, including 3-step, 5-step, and 7-step quadrangle classifications. Within the conducted analysis, values of key color-rendering quality metrics CRI Ra and Rf are presented for all analyzed spectral groups. This approach enables comprehensive evaluation of photometric and colorimetric properties of the investigated LED sources in the context of the influence of different binning classification strategies on the quality parameters of emitted light.
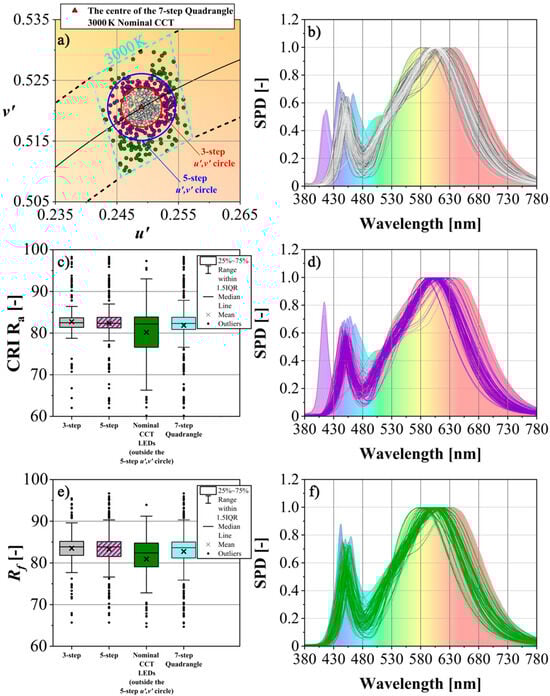
Figure 2.
The spectral and colorimetric parameters of 3000 K nominal CCT LEDs: the chromaticities are distributed on the CIE 1976 u′,v′ color space diagram with binning group classification 3-step circles, 5-step circles and 7-step quadrangles (a); the spectral power distributions for respective binning groups: 3-step (b), 5-step (d), and 7-step quadrangle (f); the color-rendering quality metrics CRI Ra and Rf values for the analyzed spectral groups (c,e).
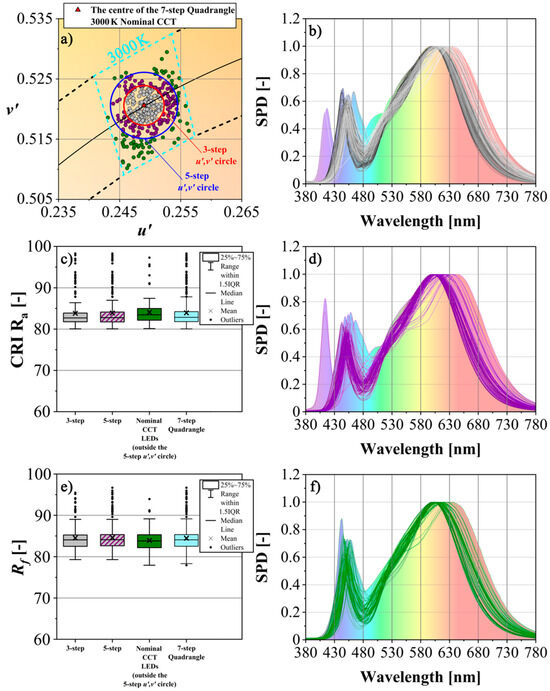
Figure 3.
The spectral and colorimetric parameters of 3000 K nominal CCT LEDs: the chromaticities are distributed on the CIE 1976 u′,v′ color space diagram with binning group classification 3-step circles, 5-step circles and 7-step quadrangles (a); the spectral power distributions for respective binning groups: 3-step (b), 5-step (d), and 7-step quadrangle (f); the color-rendering quality metrics CRI Ra and Rf values for the analyzed spectral groups (c,e).
In this study, spectral power distributions (SPDs) of LED sources with 3000 K nominal CCT were analyzed. The examined LED sources were divided into two datasets based on their CRI Ra values (CRI Ra ≥ 60 and CRI Ra ≥ 80). The distribution of chromaticities for the evaluated LEDs with CRI Ra ≥ 60 within the ANSI quadrangle at 3000 K nominal CCT revealed heterogeneous positioning relative to the color-consistency circles (Figure 2a). Analysis showed that some light sources fell within the tolerance limits defined by the 3-step and 5-step color-consistency circles, while others exceeded these standard tolerance boundaries.
To systematize the analysis, LEDs were classified according to their chromaticities relative to the color-consistency circles. This methodological approach enabled the identification of three distinct groups characterized by specific spectral power distributions:
- Group 1: sources with chromaticities located within the 3-step u′,v′ circle (SPDs shown in Figure 2b);
- Group 2: sources with chromaticities positioned between the 3-step and 5-step u′,v′ circles (SPDs shown in Figure 2d);
- Group 3: sources with chromaticities located outside the 5-step u′,v′ circle but within the 7-step quadrangles (SPDs shown in Figure 2f).
For all examined LED sources, comprehensive analysis of color-rendering quality parameters was conducted, evaluating both the CRI Ra index (Figure 2c) and the color fidelity Rf parameter (Figure 2e). The data are presented as box plots. The box plots provides a comprehensive visual representation of data distribution through multiple statistical parameters. The central rectangular box displays the interquartile range (IQR), with its lower boundary representing the first quartile (Q1, 25th percentile) and upper boundary representing the third quartile (Q3, 75th percentile), thus encompassing the middle 50% of the data. The horizontal line within the box indicates the median (Q2, 50th percentile), which serves as the measure of central tendency. The whiskers extend from the box boundaries to represent the data range: the lower whisker extends to the smallest value within 1.5 times the IQR below Q1, while the upper whisker extends to the largest value within 1.5 times the IQR above Q3. Any data points falling beyond these whisker limits are plotted individually as outliers (dots), indicating values that deviate significantly from the main distribution pattern. Additionally, the box chart enables immediate visual assessment of data symmetry, skewness, variability (through the IQR width), and the presence of extreme values, making it an invaluable tool for exploratory data analysis and comparative statistical evaluation across multiple groups or datasets.
The following color coding of box plots where used:
- Gray: LED sources with chromaticities within the 3-step u′,v′ circle
- Gray-purple: sources with chromaticities within the 5-step u′,v′ circle
- Green: sources with chromaticities within the 7-step quadrangles but outside the 5-step u′,v′ circle
- Blue: all LED sources with chromaticities within the 7-step quadrangles
The distribution of chromaticities for LEDs with CRI Ra ≥ 80 within the ANSI quadrangle at 3000 K nominal CCT similarly demonstrated heterogeneous positioning relative to the color-consistency circles (Figure 3a). Following the same classification methodology applied to LEDs with CRI Ra ≥ 60, three groups of SPDs were identified, with colorimetric and photometric parameters are illustrated in Figure 3 using identical presentation conventions.
A comprehensive comparison of spectral power distributions, chromaticity parameters, and color characteristics for LEDs with 4000 K nominal CCT are presented in Figure 4 (for CRI Ra ≥ 60) and Figure 5 (for CRI Ra ≥ 80). The analysis encompasses detailed examination of SPDs for respective groups, including 3-step, 5-step, and 7-step quadrangle classifications. Key color-rendering quality metrics (CRI Ra and Rf) are presented for all analyzed spectral groups, enabling comprehensive evaluation of photometric and colorimetric properties. This approach facilitates assessment of how different binning classification strategies influence the quality parameters of emitted light. The graphical presentation follows the same format established for the 3000 K nominal CCT LED.
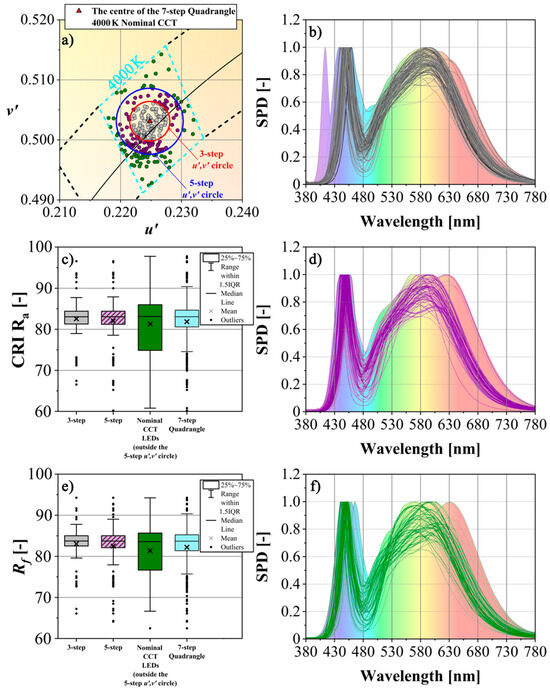
Figure 4.
The spectral and colorimetric parameters of 4000 K nominal CCT LEDs: the chromaticities are distributed on the CIE 1976 u′,v′ color space diagram with binning group classification 3-step circles, 5-step circles and 7-step quadrangles (a); the spectral power distributions for respective binning groups: 3-step (b), 5-step (d), and 7-step quadrangle (f); the color-rendering quality metrics CRI Ra and Rf values for the analyzed spectral groups (c,e).
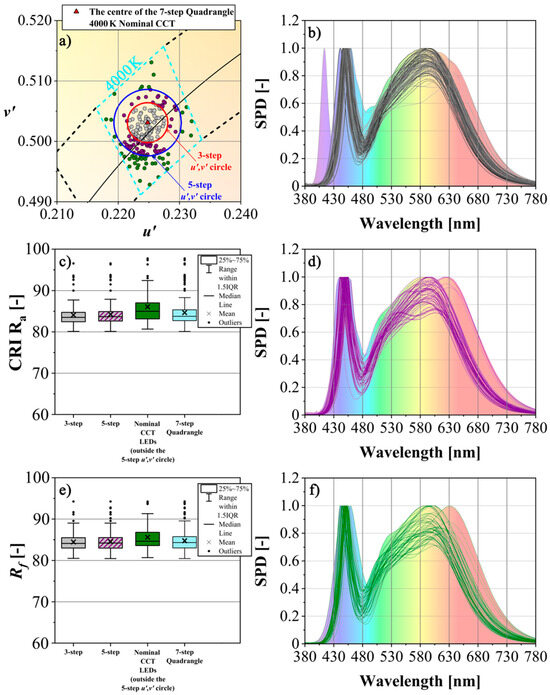
Figure 5.
The spectral and colorimetric parameters of 4000 K nominal CCT LEDs: the chromaticities are distributed on the CIE 1976 u′,v′ color space diagram with binning group classification 3-step circles, 5-step circles and 7-step quadrangles (a); the spectral power distributions for respective binning groups: 3-step (b), 5-step (d), and 7-step quadrangle (f); the color-rendering quality metrics CRI Ra and Rf values for the analyzed spectral groups (c,e).
3. Results
The analysis of LER values was conducted based on statistical parameters (see Table 1, Table 2, Table 3 and Table 4) where standard deviation (SD), first quartile (Q1, 25%), third quartile (Q3, 75%), average, median (Q2), minimum and maximum LER values (excluding outliers), as well as minimum and maximum LER values (including outliers) are presented.

Table 1.
The results of statistical evaluations of LEDs with 3000 K nominal CCT and CRI Ra ≥ 60.
Table 2.
The results of statistical evaluations of LEDs with 3000 K nominal CCT and CRI Ra ≥ 80.
Table 3.
The results of statistical evaluations of LEDs with 4000 K nominal CCT and CRI Ra ≥ 60.
Table 4.
The results of statistical evaluations of LEDs with 4000 K nominal CCT and CRI Ra ≥ 80.
The comparison of LER for LEDs with nominal CCT of 3000 K and 4000 K for different groups of their SPDs are presented also in Figure 2, Figure 3, Figure 4 and Figure 5. The LER is evaluated for LEDs: the data are presented as box plots (Figure 6, Figure 7, Figure 8 and Figure 9) with the following color coding:
- Gray: LED sources with chromaticities within the 3-step u′,v′ circle;
- Gray-purple: sources with chromaticities within the 5-step u′,v′ circle;
- Green: sources with chromaticities within the 7-step quadrangles but out-side the 5-step u′,v′ circle;
- Blue: all LED sources with chromaticities within the 7-step quadrangles.
The analyzed datasets were characterized by CRI Ra ≥ 60 and CRI Ra ≥ 80.

Figure 6.
The luminous efficacy of radiation (LER) presented as box plots for LEDs 3000 K nominal CCT and CRI Ra ≥ 60 grouped according to their chromaticities: within the 3-step u′,v′ color-consistency circle (gray), within the 5-step u′,v′ color-consistency circle (gray with purple dashes), outside the 5-step u′,v′ color-consistency circle, but within the ANSI bin (green), within the entire 7-step ANSI bin (blue).

Figure 7.
The luminous efficacy of radiation (LER) presented as box plots for LEDs 3000 K nominal CCT and CRI Ra ≥ 80 grouped according to their chromaticities: within the 3-step u′,v′ color-consistency circle (gray), within the 5-step u′,v′ color-consistency circle (gray with purple dashes), outside the 5-step u′,v′ color-consistency circle, but within the ANSI bin (green), within the entire 7-step ANSI bin (blue).

Figure 8.
The luminous efficacy of radiation (LER) presented as box plots for LEDs 4000 K nominal CCT and CRI Ra ≥ 60 grouped according to their chromaticities: within the 3-step u′,v′ color-consistency circle (gray), within the 5-step u′,v′ color-consistency circle (gray with purple dashes), outside the 5-step u′,v′ color-consistency circle, but within the ANSI bin (green), within the entire 7-step ANSI bin (blue).

Figure 9.
The luminous efficacy of radiation (LER) presented as box plots for LEDs 4000 K nominal CCT and CRI Ra ≥ 80 grouped according to their chromaticities: within the 3-step u′,v′ color-consistency circle (gray), within the 5-step u′,v′ color-consistency circle (gray with purple dashes), outside the 5-step u′,v′ color-consistency circle, but within the ANSI bin (green), within the entire 7-step ANSI bin (blue).
4. Discussion and Conclusions
The comprehensive analysis of LED sources with nominal CCT values of 3000 K and 4000 K reveals a consistent correlation between luminous efficacy of radiation (LER) and color consistency, independent of the CRI Ra classification range (Figure 6, Figure 7, Figure 8 and Figure 9). This finding represents a significant advancement in understanding the relationship between colorimetric properties and energy efficiency performance of contemporary LED lighting technologies.
The statistical analysis demonstrates that LED sources with chromaticities positioned within the 3-step color-consistency circle consistently show LER values compared to those classified within the 5-step color-consistency circle boundaries (see the maximum value of LER when the outliers are excluded in Table 1, Table 2, Table 3 and Table 4). This hierarchical performance relationship indicates that tighter color-consistency tolerances are associated with enhanced energy efficiency characteristics, suggesting a strong correlation between color uniformity and luminous efficacy performance.
Furthermore, the analysis reveals that LED sources whose chromaticities fall outside the established color-consistency circles, while remaining within the ANSI-defined nominal CCT quadrangles, consistently demonstrate inferior LER performance relative to their color-consistent counterparts. This observation is particularly significant as it indicates that compliance with basic ANSI CCT classification requirements alone is insufficient to ensure optimal energy efficiency performance.
The findings establish that color consistency in LED sources correlates positively with enhanced energy efficiency in typical LED lighting products. This relationship has profound implications for lighting system design and product selection, particularly in applications where energy conservation is paramount. The results suggest that specifying color-consistency requirements alongside traditional photometric parameters can serve as an effective strategy for optimizing both color quality and energy efficiency in LED lighting installations, providing valuable guidance for lighting professionals in developing more sustainable and efficient lighting solutions.
This result indicates that even small shifts in the chromaticities position of LEDs can have a significant impact on luminous efficacy expressed by the LER parameter. From a practical standpoint, the obtained data emphasize the necessity of precise control and selection of chromaticities in the production and selection process of light sources, particularly where optimization of luminous efficacy is crucial. Furthermore, the results suggest that classifications based on broad ANSI bins may not be sufficiently precise for a complete description of light quality and its efficacy (the complete statistical analysis procedure that supports this conclusion is detailed in Appendix A).
The analysis of LER parameter values, based on maximum values indicated by the whiskers of the box plots, reveals that light sources with CRI Ra ≥ 60 achieve higher LER values compared to the CRI Ra ≥ 80 group. This finding suggests that sources with lower CRI Ra achieve higher luminous efficacy as expressed by the LER parameter. This relationship can be attributed to the reduced presence of spectral components that are responsible for accurate color reproduction but are less favorable from the perspective of achieving optimal colorimetric parameters.
The conducted standard deviation (SD) analysis (Table 1, Table 2, Table 3 and Table 4) presented that the highest values of this parameter occur for datasets based on LEDs which chromaticities are located within the ANSI bin, but outside the 5-step u′,v′ circle (represented by green box-chart presented in Figure 6, Figure 7, Figure 8 and Figure 9). This indicates significantly greater data variability within this dataset. It is meaning that observations are more widely dispersed around the mean value. Due to the color-consistency requirement the chromaticities of a given LED source must fall within a circle with a radius of 5 u′,v′ steps. This approach is justified in applications requiring high repeatability of color perception, where even minor spectral deviations can result in undesirable differences in color perception. But there are also some LEDs with chromaticities located within the ANSI bin but outside the 5-step u′,v′ circle. Those LEDs are not color consistent. These products are commercially available as cheaper, lower-quality products (represented by green box-chart presented in Figure 6, Figure 7, Figure 8 and Figure 9).
5. Conclusions
This result indicates that even small shifts in the chromaticity position of LEDs can have a significant impact on luminous efficacy expressed by the LER parameter. From a practical standpoint, the obtained data emphasize the necessity of precise control and selection of chromaticities in the production and selection process of light sources, particularly where the optimization of luminous efficacy is crucial. Furthermore, the results suggest that classifications based on broad ANSI bins may not be sufficiently precise for a complete description of light quality and its efficacy.
Author Contributions
Conceptualization, I.F. and M.L.; methodology, I.F. and M.L.; software, I.F. and M.L.; validation, I.F. and M.L.; formal analysis, I.F. and M.L.; investigation, I.F. and M.L.; data curation, I.F. and M.L.; writing—original draft preparation, I.F. and M.L.; writing—review and editing, I.F. and M.L.; visualization, I.F. and M.L.; supervision, I.F. and M.L. All authors have read and agreed to the published version of the manuscript.
Funding
The APC was funded by Bialystok University of Technology under grant No. WI/WE-IA/3/2025.
Data Availability Statement
The data supporting the findings of this study are available from the corresponding author upon reasonable request.
Conflicts of Interest
The authors declare no conflicts of interest.
Appendix A. Statistical Analysis of LER Parameter for LED Light Sources
The study was conducted for four variants of LED light sources:
- Nominal CCT 3000 K, CRI Ra ≥ 60;
- Nominal CCT 3000 K, CRI Ra ≥ 80;
- Nominal CCT 4000 K, CRI Ra ≥ 60;
- Nominal CCT 4000 K, CRI Ra ≥ 80.
The examined LED sources were grouped according to their chromaticities:
- within the entire 7-step ANSI bin;
- within the 3-step u′,v′ color-consistency circle;
- within the 5-step u′,v′ color-consistency circle;
- outside the 5-step u′,v′ color-consistency circle (but within the ANSI bin).
- Step 1.
- To testing the normality of data distribution, the Shapiro–Wilk test was applied to verify the normality of the data distributions. The test revealed significant deviations from normal distribution in all analyzed groups, which justified the use of non-parametric methods in subsequent analyses.Due to the non-normal data distribution, the Kruskal–Wallis test was used—a non-parametric method for comparing medians between more than two independent groups. The test was performed for all four variants of LED light sources.
- Step 2.
- The Kruskal–Wallis test revealed significant differences between groups regarding the LER parameter in all analyzed variants. The weakest statistical effect was observed for LED sources with nominal CCT 4000 K and CRI Ra ≥ 80 (p = 0.02), which nevertheless remained statistically significant at the α = 0.05 level.
- Step 3.
- For the variant with CCT 4000 K and CRI Ra ≥ 80 sources, Dunn’s post hoc test with Bonferroni correction was conducted to identify specific differences between groups. The analysis revealed a statistically significant difference (p = 0.02) between LED sources whose chromaticities was located within the 3-step u′,v′ circle and sources positioned within the 7-step ANSI bin but simultaneously outside the 5-step u′,v′ circle.
References
- Haitz, R.; Tsao, J.Y. Solid-state Lighting: ‘The Case’ 10 Years after and Future Prospects. Phys. Status Solidi (a) 2011, 208, 17–29. [Google Scholar] [CrossRef]
- Tsao, J.Y.; Saunders, H.D.; Creighton, J.R.; Coltrin, M.E.; Simmons, J.A. Solid-State Lighting: An Energy-Economics Perspective. J. Phys. D Appl. Phys. 2010, 43, 354001. [Google Scholar] [CrossRef]
- Xiao, P.; Yu, Y.; Cheng, J.; Chen, Y.; Yuan, S.; Chen, J.; Yuan, J.; Liu, B. Advances in Perovskite Light-Emitting Diodes Possessing Improved Lifetime. Nanomaterials 2021, 11, 103. [Google Scholar] [CrossRef]
- Diouf, B.; Muley, A.; Pode, R. Issues, Challenges, and Future Perspectives of Perovskites for Energy Conversion Applications. Energies 2023, 16, 6498. [Google Scholar] [CrossRef]
- Narukawa, Y.; Ichikawa, M.; Sanga, D.; Sano, M.; Mukai, T. White Light Emitting Diodes with Super-High Luminous Efficacy. J. Phys. D Appl. Phys. 2010, 43, 354002. [Google Scholar] [CrossRef]
- Tarashioon, S.; Baiano, A.; Van Zeijl, H.; Guo, C.; Koh, S.W.; Van Driel, W.D.; Zhang, G.Q. An Approach to “Design for Reliability” in Solid State Lighting Systems at High Temperatures. Microelectron. Reliab. 2012, 52, 783–793. [Google Scholar] [CrossRef]
- Wantuch, A.; Olesiak, M. Effect of LED Lighting on Selected Quality Parameters of Electricity. Sensors 2023, 23, 1582. [Google Scholar] [CrossRef] [PubMed]
- Sikora, R.; Markiewicz, P. Analysis of Electric Power Quantities of Road LED Luminaires under Sinusoidal and Non-Sinusoidal Conditions. Energies 2019, 12, 1109. [Google Scholar] [CrossRef]
- Sikora, R.; Markiewicz, P.; Pabjańczyk, W. The Active Power Losses in the Road Lighting Installation with Dimmable LED Luminaires. Sustainability 2018, 10, 4742. [Google Scholar] [CrossRef]
- Richter, J.L.; Tähkämö, L.; Dalhammar, C. Trade-Offs with Longer Lifetimes? The Case of LED Lamps Considering Product Development and Energy Contexts. J. Clean. Prod. 2019, 226, 195–209. [Google Scholar] [CrossRef]
- Casamayor, J.; Su, D.; Ren, Z. Comparative Life Cycle Assessment of LED Lighting Products. Light. Res. Technol. 2018, 50, 801–826. [Google Scholar] [CrossRef]
- Fryc, I.; Bisegna, F.; Tabaka, P. Lighting of Recreation Grounds as a Source of Sky Glow—The Influence of Luminaire Type on This Phenomenon. In Proceedings of the 2017 IEEE International Conference on Environment and Electrical Engineering and 2017 IEEE Industrial and Commercial Power Systems Europe (EEEIC/I&CPS Europe), Milan, Italy, 6–9 June 2017; pp. 1–4. [Google Scholar] [CrossRef]
- Ou, H.; Corell, D.; Ou, Y.; Poulsen, P.B.; Dam-Hansen, C.; Petersen, P.-M. Spectral Design Flexibility of LED Brings Better Life. In Proceedings of the SPIE—The International Society for Optical Engineering, San Francisco, CA, USA, 21–22 January 2012; Volume 8278, p. 827802. [Google Scholar] [CrossRef]
- Žukauskas, A.; Vaicekauskas, R.; Vitta, P. Optimization of Solid-State Lamps for Photobiologically Friendly Mesopic Lighting. Appl. Opt. 2012, 51, 8423. [Google Scholar] [CrossRef] [PubMed]
- Shen, H.; Pan, J.; Feng, H. Accelerated Life Test for High-Power White LED Based on Spectroradiometric Measurement. In Proceedings of the SPIE Photonics Asia 2007, Beijing, China, 12–14 November 2007; Volume 6841, p. 684104. [Google Scholar] [CrossRef]
- Zhang, S.; Liang, M.; Yan, Y.; Huang, J.; Li, Y.; Feng, T.; Zhu, X.; Li, Z.; Xu, C.; Wang, J.; et al. High Luminous Efficacy Phosphor-Converted Mass-Produced White LEDs Achieved by AlN Prebuffer and Transitional-Refraction-Index Patterned Sapphire Substrate. Nanomaterials 2022, 12, 1638. [Google Scholar] [CrossRef] [PubMed]
- Liu, Y.; Zou, J.; Shi, M.; Li, Y.; Yang, B.; Wang, Z.; Li, W.; Zheng, F.; Zhou, H.; Jiang, N. Effect of Phosphor Composition and Packaging Structure of Flexible Phosphor Films on Performance of White LEDs. J. Mater. Sci. Mater. Electron. 2018, 29, 18476–18485. [Google Scholar] [CrossRef]
- Mueller-Mach, R.; Mueller, G.; Krames, M.R.; Höppe, H.A.; Stadler, F.; Schnick, W.; Juestel, T.; Schmidt, P. Highly Efficient All-nitride Phosphor-converted White Light Emitting Diode. Phys. Status Solidi (a) 2005, 202, 1727–1732. [Google Scholar] [CrossRef]
- Law, T.K.; Lim, F.; Li, Y.; Yeong, K.K.G.; Sng, G.K.E.; Uvarajan, M.V.; Teo, J.W.R. Implications of Phosphor Coating on the Thermal Characteristics of Phosphor-Converted White LEDs. IEEE Trans. Device Mater. Reliab. 2016, 16, 576. [Google Scholar] [CrossRef]
- Davis, J.L.; Mills, K.; Lamvik, M.; Perkins, C.; Georgiy; Bobashev; Young, J.; Yaga, R.; Johnson, C. Understanding and Controlling Chromaticity Shift in LED Devices. In Proceedings of the 2017 18th International Conference on Thermal, Mechanical and Multi-Physics Simulation and Experiments in Microelectronics and Microsystems (EuroSimE), Dresden, Germany, 3–5 April 2017; pp. 1–8. [Google Scholar] [CrossRef]
- Zheng, C.; Guo, B.; Lu, T.; Zhu, X.; Xia, B.; Yang, B.; Yang, Z.; Lishik, S.; Chernyakov, A.; Xiong, J.; et al. Enhanced Highly Thermal-Humidity Reliability of (Sr,Ca)AlSiN3:Eu2+ Phosphors via Rapid Plasma-Assisted Silica Surface Coating. Opt. Express 2025, 33, 4940. [Google Scholar] [CrossRef]
- Islam, N.U.; Usman, M.; Jamil, T. Energy-Savings Using Solid-State Lighting: A Case Study of India, Pakistan, and Bangladesh. Energy Policy 2022, 160, 112676. [Google Scholar] [CrossRef]
- Pimputkar, S.; Speck, J.S.; DenBaars, S.P.; Nakamura, S. Prospects for LED Lighting. Nat. Photon 2009, 3, 180–182. [Google Scholar] [CrossRef]
- De Almeida, A.; Santos, B.; Paolo, B.; Quicheron, M. Solid State Lighting Review—Potential and Challenges in Europe. Renew. Sustain. Energy Rev. 2014, 34, 30–48. [Google Scholar] [CrossRef]
- Fryc, I.; Listowski, M.; Martinsons, C.; Fan, J.; Czyżewski, D. A Paradox of LED Road Lighting: Reducing Light Pollution Is Not Always Linked to Energy Savings. Energies 2024, 17, 5727. [Google Scholar] [CrossRef]
- Storms, M.; Degen, T.; Degen, J. Female Moths Call in Vain: Streetlights Diminish the Promise of Mating. Ecol. Entomol. 2025, 50, 729–740. [Google Scholar] [CrossRef]
- Briolat, E.S.; Gaston, K.J.; Bennie, J.; Rosenfeld, E.J.; Troscianko, J. Artificial Nighttime Lighting Impacts Visual Ecology Links between Flowers, Pollinators and Predators. Nat. Commun. 2021, 12, 4163. [Google Scholar] [CrossRef]
- Tan, J.; Narendran, N. Defining Phosphor Luminescence Property Requirements for White AC LED Flicker Reduction. J. Lumin. 2015, 167, 21–26. [Google Scholar] [CrossRef]
- Ohno, Y. Spectral Design Considerations for White LED Color Rendering. Opt. Eng. 2005, 44, 111302. [Google Scholar] [CrossRef]
- Houser, K.W.; Wei, M.; David, A.; Krames, M.R.; Shen, X.S. Review of Measures for Light-Source Color Rendition and Considerations for a Two-Measure System for Characterizing Color Rendition. Opt. Express 2013, 21, 10393. [Google Scholar] [CrossRef]
- Wright, W.D. The Sensitivity of the Eye to Small Colour Differences. Proc. Phys. Soc. 1941, 53, 93–112. [Google Scholar] [CrossRef]
- Ruppertsberg, A.I.; Bloj, M.; Hurlbert, A. Sensitivity to Luminance and Chromaticity Gradients in a Complex Scene. J. Vis. 2008, 8, 3. [Google Scholar] [CrossRef]
- Lindsey, D.T.; Wee, A.G. Perceptibility and Acceptability of CIELAB Color Differences in Computer-Simulated Teeth. J. Dent. 2007, 35, 593–599. [Google Scholar] [CrossRef] [PubMed]
- Yang, W.; Jeon, J.Y. Effects of Correlated Colour Temperature of LED Light on Visual Sensation, Perception, and Cognitive Performance in a Classroom Lighting Environment. Sustainability 2020, 12, 4051. [Google Scholar] [CrossRef]
- Shamsul, B.M.T.; Sia, C.C.; Ng, Y.G.; Karmegan, K. Effects of Light’s Colour Temperatures on Visual Comfort Level, Task Performances, and Alertness among Students. AJPHR 2013, 1, 159–165. [Google Scholar] [CrossRef]
- Özkul, E.; Bilgili, B.; Koç, E. The Influence of the Color of Light on the Customers’ Perception of Service Quality and Satisfaction in the Restaurant. Color Res. Appl. 2020, 45, 1217–1240. [Google Scholar] [CrossRef]
- Stylidis, K.; Woxlin, A.; Siljefalk, L.; Heimersson, E.; Söderberg, R. Understanding Light. A Study on the Perceived Quality of Car Exterior Lighting and Interior Illumination. Procedia CIRP 2020, 93, 1340–1345. [Google Scholar] [CrossRef]
- Custers, P.; De Kort, Y.; IJsselsteijn, W.; De Kruiff, M. Lighting in Retail Environments: Atmosphere Perception in the Real World. Light. Res. Technol. 2010, 42, 331–343. [Google Scholar] [CrossRef]
- Żagan, W. The Aesthetics of Lighting. Przegląd Elektrotechniczny 2017, 1, 146–149. [Google Scholar] [CrossRef]
- Zhao, J.; Dai, Y.; Liu, Q. Effects of Color in Lighting on Aesthetic Preference and Perceived Safety during the Evening. Environ. Eng. Manag. J. 2022, 21, 1427–1437. [Google Scholar] [CrossRef]
- Nitse, P.S.; Parker, K.R.; Krumwiede, D.; Ottaway, T. The Impact of Color in the E-commerce Marketing of Fashions: An Exploratory Study. Eur. J. Mark. 2004, 38, 898–915. [Google Scholar] [CrossRef]
- Rea, M.S.; Freyssinier, J.P. Color Rendering: Beyond Pride and Prejudice. Color Res. Appl. 2010, 35, 401–409. [Google Scholar] [CrossRef]
- Fathabadi, A.; Imanparast, A.; Rashidian Vaziri, M.R.; Sazgarnia, A. Broad-Scope Analysis of Color, Performance, and Safety of Residential Led. 2025. Available online: https://ssrn.com/abstract=5270112 (accessed on 27 May 2025).
- Frascarolo, M.; Martorelli, S.; Vitale, V. An Innovative Lighting System for Residential Application That Optimizes Visual Comfort and Conserves Energy for Different User Needs. Energy Build. 2014, 83, 217–224. [Google Scholar] [CrossRef]
- Kim, G.; Kim, J.T. Healthy-Daylighting Design for the Living Environment in Apartments in Korea. Build. Environ. 2010, 45, 287–294. [Google Scholar] [CrossRef]
- ANSI C78.377-2017; American National Standard for Electric Lamps—Specifications for the Chromaticity of Solid State Lighting (SSL) Products. American National Standards Institute: Washington, DC, USA, 2017.
- CIE TN 001:2014; Chromaticity Difference Specification for Light Sources. International Commission on Illumination: Vienna, Austria, 2014. Available online: https://cie.co.at/publications/chromaticity-difference-specification-light-sources (accessed on 27 May 2025).
- Tanaka, M.; Horiuchi, T.; Tominaga, S. Color Control of a Lighting System Using RGBW LEDs. In Proceedings of the SPIE—The International Society for Optical Engineering, IS&T/SPIE Electronic Imaging, San Francisco, CA, USA, 23–27 January 2011; Volume 7866, p. 78660W. [Google Scholar] [CrossRef]
- Goudjil, A.; Pigeon, E.; Pouliquen, M.; Menard, T.; Gehan, O.; Girard, S.; Dufay, B.; Boudjelal, A. An Interior-Points Algorithm for Color and CCT Control of Multichannel LED Lighting System Using a Smart 18-Channel Spectral Sensor. Energy Build. 2023, 298, 113541. [Google Scholar] [CrossRef]
- Hoelen, C.; Van Der Burgt, P.; Jungwirth, P.; Keuper, M.; Man, K.; Mutter, C.; Ter Weeme, J.-W. Color-Consistent LED Modules for General Lighting. In Proceedings of the SPIE OPTO: Integrated Optoelectronic Devices, San Jose, CA, USA, 24–29 January 2009; Volume 7231, p. 72310A. [Google Scholar] [CrossRef]
- Fryc, I.; Listowski, M.; Supronowicz, R. Going beyond the 20th Century Color Space to Evaluate LED Color Consistency. Opt. Express 2023, 31, 38666. [Google Scholar] [CrossRef]
- Deshpande, A.; Kolodin, B.; Jacob, C.; Chowdhury, A.; Kuenzler, G.; Sater, K.; Aesram, D.; Glaettli, S.; Gallagher, B.; Langer, P.; et al. Development of Advanced Manufacturing Methods for Warm White LEDs for General Lighting; National Energy Technology Laboratory: Pittsburgh, PA, USA; Morgantown, WV, USA, 2012. [Google Scholar]
- Zhan, X.; Wang, W.; Chung, H. A Neural-Network-Based Color Control Method for Multi-Color LED Systems. IEEE Trans. Power Electron. 2019, 34, 7900–7913. [Google Scholar] [CrossRef]
- Trivellin, N.; Meneghini, M.; Buffolo, M.; Meneghesso, G.; Zanoni, E. Failures of LEDs in Real-World Applications: A Review. IEEE Trans. Device Mater. Relib. 2018, 18, 391–396. [Google Scholar] [CrossRef]
- Fryc, I.; Listowski, M.; Supronowicz, R.; Martinsons, C. Selecting Energy-Efficient LED Retrofits with Optimal Color Qualities for New and Refurbished Buildings. Energies 2024, 18, 112. [Google Scholar] [CrossRef]
- Fryc, I.; Listowski, M.; Martinsons, C. Color Quality Versus Energy Efficiency: A Dual Perspective on LED Retrofits in Healthcare Examination Rooms. Appl. Sci. 2025, 15, 756. [Google Scholar] [CrossRef]
- De Souza, D.F.; Da Silva, P.P.F.; Fontenele, L.F.A.; Barbosa, G.D.; De Oliveira Jesus, M. Efficiency, Quality, and Environmental Impacts: A Comparative Study of Residential Artificial Lighting. Energy Rep. 2019, 5, 409–424. [Google Scholar] [CrossRef]
- Royer, M. Evaluating Tradeoffs between Energy Efficiency and Color Rendition. OSA Contin. 2019, 2, 2308. [Google Scholar] [CrossRef]
- Liu, J.G.; Tang, W.; Shen, C.; Ke, Y.; Sun, G. Advances in Higher Color Quality and Healthier White LEDs. In Proceedings of the 2017 14th China International Forum on Solid State Lighting: International Forum on Wide Bandgap Semiconductors China (SSLChina: IFWS), Beijing, China, 1–3 November 2017; pp. 13–16. [Google Scholar] [CrossRef]
- Baniya, R.; Maksimainen, M.; Sierla, S.; Pang, C.; Yang, C.-W.; Vyatkin, V. Smart Indoor Lighting Control: Power, Illuminance, and Colour Quality. In Proceedings of the 2014 IEEE 23rd International Symposium on Industrial Electronics (ISIE), Istanbul, Turkey, 1–4 June 2014; pp. 1745–1750. [Google Scholar] [CrossRef]
- Smet, K.; Ryckaert, W.; Pointer, M.; Deconinck, G.; Hanselaer, P. Optimization of Colour Quality of LED Lighting with Reference to Memory Colours. Light. Res. Technol. 2012, 44, 7–15. [Google Scholar] [CrossRef]
- Hung, P.-C.; Tsao, J.Y. Maximum White Luminous Efficacy of Radiation Versus Color Rendering Index and Color Temperature: Exact Results and a Useful Analytic Expression. J. Disp. Technol. 2013, 9, 405–412. [Google Scholar] [CrossRef]
- Chen, D.-C.; Liu, Z.-G.; Deng, Z.-H.; Wang, C.; Cao, Y.-G.; Liu, Q.-L. Optimization of Light Efficacy and Angular Color Uniformity by Hybrid Phosphor Particle Size for White Light-Emitting Diode. Rare Met. 2014, 33, 348–352. [Google Scholar] [CrossRef]
- Chen, B.-M.; Chen, C.-H.; Ying, S.-P.; Chang, Y.-K. Replication of Leaf Surface Structures on Flat Phosphor-Converted LEDs for Enhanced Angular Color Uniformity. Micromachines 2024, 15, 1399. [Google Scholar] [CrossRef]
- Kim, S.H.; Song, Y.H.; Jeon, S.R.; Jeong, T.; Kim, J.Y.; Ha, J.S.; Kim, W.H.; Baek, J.H.; Yang, G.M.; Park, H.J. Enhanced Luminous Efficacy in Phosphor-Converted White Vertical Light-Emitting Diodes Using Low Index Layer. Opt. Express 2013, 21, 6353. [Google Scholar] [CrossRef] [PubMed]
- Royer, M.; Murdoch, M.J.; Smet, K.; Whitehead, L.; David, A.; Houser, K.; Esposito, T.; Livingston, J.; Ohno, Y. Improved Method for Evaluating and Specifying the Chromaticity of Light Sources. LEUKOS 2023, 19, 35–52. [Google Scholar] [CrossRef]
- Royer, M.P. Background and Guidance for Using the ANSI/IES TM-30 Method for Evaluating Light Source Color Rendition. LEUKOS 2022, 18, 191–231. [Google Scholar] [CrossRef]
- Royer, M.; Wilkerson, A.; Wei, M. Human Perceptions of Colour Rendition at Different Chromaticities. Light. Res. Technol. 2018, 50, 965–994. [Google Scholar] [CrossRef]
- ANSI/IES TM-30-20; IES Method for Evaluating Light Source Color Rendition. Illuminating Engineering Society: New York, NY, USA, 2021. Available online: https://store.ies.org/product/technical-memorandum-ies-method-for-evaluating-light-source-color-rendition/?v=288404204e3d (accessed on 27 May 2025).
- Royer, M. Real Light Source SPDs and Color Data for Use in Research. 2023. Available online: https://figshare.com/articles/dataset/Real_Light_Source_SPDs_and_Color_Data_for_Use_in_Research/12947240 (accessed on 27 May 2025). [CrossRef]
- Jost, S.; Thorseth, A.; Poikonen, T.; Blattner, P.; Gerloff, T.; Kokka, A.; Dekker, P.; Smid, M.; Ferrero, A.; Kubarsepp, T.; et al. EMPIR 15SIB07 PhotoLED—Database of LED Product Spectra. 2021. Available online: https://data.dtu.dk/articles/dataset/EMPIR_15SIB07_PhotoLED_-_Database_of_LED_product_spectra/12783389 (accessed on 27 May 2025). [CrossRef]
- Neberich, M.; Opferkuch, F. Standardizing Melanopic Effects of Ocular Light for Ecological Lighting Design of Nonresidential Buildings—An Overview of Current Legislation and Accompanying Scientific Studies. Sustainability 2021, 13, 5131. [Google Scholar] [CrossRef]
- Van De Perre, L.; Smet, K.; Hanselaer, P.; Dujardin, M.; Ryckaert, W. The Effect of Correlated Colour Temperature and Wall Luminance on Spatial Brightness and Scene Preference in a Windowless Office Setup. Light. Res. Technol. 2024, 56, 316–336. [Google Scholar] [CrossRef]
- Dangol, R.; Islam, M.; Hyvärinen, M.; Bhushal, P.; Puolakka, M.; Halonen, L. User Acceptance Studies for LED Office Lighting: Preference, Naturalness and Colourfulness. Light. Res. Technol. 2015, 47, 36–53. [Google Scholar] [CrossRef]
- Arrêté Du 27 Décembre 2018 Relatif à La Prévention, à La Réduction et à La Limitation Des Nuisances Lumineuses. 2018. Available online: https://aida.ineris.fr/reglementation/arrete-241219-modifiant-larrete-27-decembre-2018-relatif-a-prevention-a-reduction-a (accessed on 27 May 2025).
- Code de L’environnement. Available online: https://www.legifrance.gouv.fr/codes/texte_lc/LEGITEXT000006074220/ (accessed on 27 May 2025).
- Linares Arroyo, H.; Abascal, A.; Degen, T.; Aubé, M.; Espey, B.R.; Gyuk, G.; Hölker, F.; Jechow, A.; Kuffer, M.; Sánchez De Miguel, A.; et al. Monitoring, Trends and Impacts of Light Pollution. Nat. Rev. Earth Environ. 2024, 5, 605. [Google Scholar] [CrossRef]
- Gaston, K.J.; Davies, T.W.; Bennie, J.; Hopkins, J. REVIEW: Reducing the Ecological Consequences of Night-time Light Pollution: Options and Developments. J. Appl. Ecol. 2012, 49, 1256–1266. [Google Scholar] [CrossRef]
- Kostic, M.; Djokic, L. Recommendations for Energy Efficient and Visually Acceptable Street Lighting. Energy 2009, 34, 1565–1572. [Google Scholar] [CrossRef]
- Luginbuhl, C.B.; Boley, P.A.; Davis, D.R. The Impact of Light Source Spectral Power Distribution on Sky Glow. J. Quant. Spectrosc. Radiat. Transf. 2014, 139, 21–26. [Google Scholar] [CrossRef]
- Aubé, M.; Roby, J.; Kocifaj, M. Evaluating Potential Spectral Impacts of Various Artificial Lights on Melatonin Suppression, Photosynthesis, and Star Visibility. PLoS ONE 2013, 8, e67798. [Google Scholar] [CrossRef] [PubMed]
- Longcore, T. A Compendium of Photopigment Peak Sensitivities and Visual Spectral Response Curves of Terrestrial Wildlife to Guide Design of Outdoor Nighttime Lighting. Basic Appl. Ecol. 2023, 73, 40–50. [Google Scholar] [CrossRef]
- Cabrera-Cruz, S.A.; Smolinsky, J.A.; Buler, J.J. Light Pollution Is Greatest within Migration Passage Areas for Nocturnally-Migrating Birds around the World. Sci. Rep. 2018, 8, 3261. [Google Scholar] [CrossRef] [PubMed]
- Dickerson, A.L.; Hall, M.L.; Jones, T.M. The Effect of Natural and Artificial Light at Night on Nocturnal Song in the Diurnal Willie Wagtail. Sci. Total Environ. 2022, 808, 151986. [Google Scholar] [CrossRef]
- Aulsebrook, A.E.; Connelly, F.; Johnsson, R.D.; Jones, T.M.; Mulder, R.A.; Hall, M.L.; Vyssotski, A.L.; Lesku, J.A. White and Amber Light at Night Disrupt Sleep Physiology in Birds. Curr. Biol. 2020, 30, 3657–3663.e5. [Google Scholar] [CrossRef] [PubMed]
- Lyytimäki, J. Sustainable Development Goals Relighted: Light Pollution Management as a Novel Lens to SDG Achievement. Discov. Sustain. 2025, 6, 197. [Google Scholar] [CrossRef]
Disclaimer/Publisher’s Note: The statements, opinions and data contained in all publications are solely those of the individual author(s) and contributor(s) and not of MDPI and/or the editor(s). MDPI and/or the editor(s) disclaim responsibility for any injury to people or property resulting from any ideas, methods, instructions or products referred to in the content. |
© 2025 by the authors. Licensee MDPI, Basel, Switzerland. This article is an open access article distributed under the terms and conditions of the Creative Commons Attribution (CC BY) license (https://creativecommons.org/licenses/by/4.0/).