
Research and Simulation Analysis on a Novel U-Tube Type Dual-Chamber Oscillating Water Column Wave Energy Conversion Device
Abstract
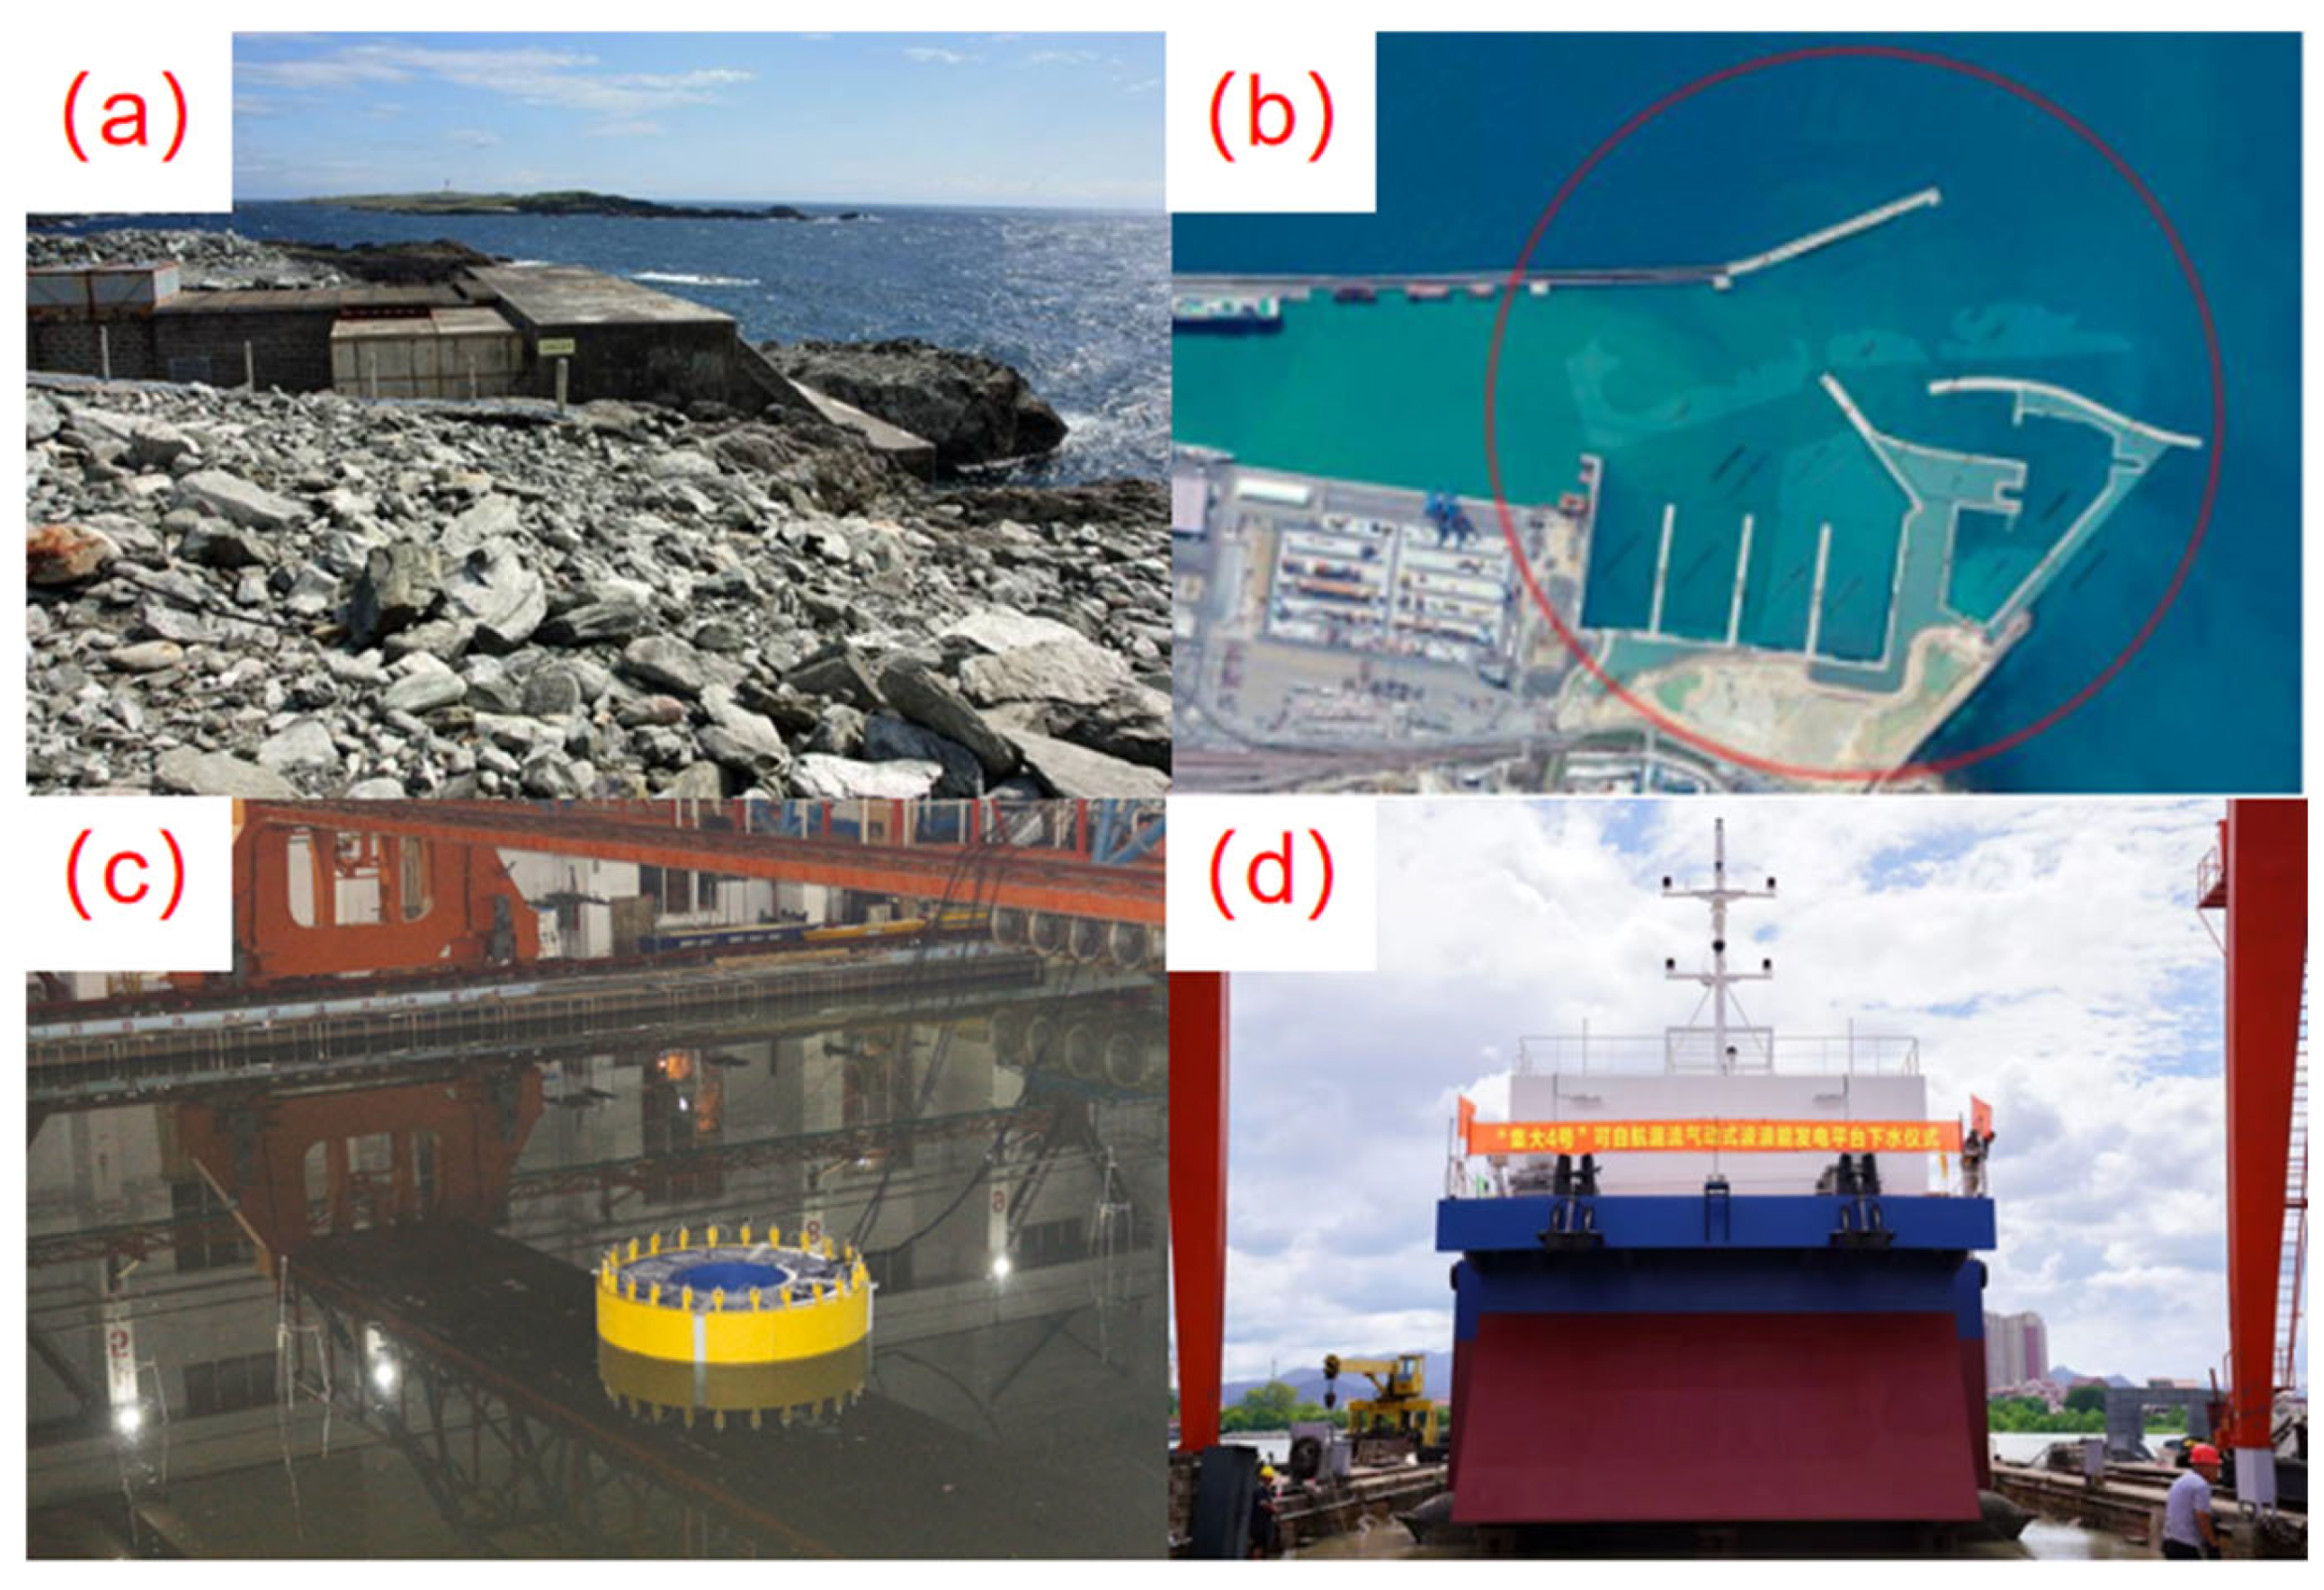
1. Introduction
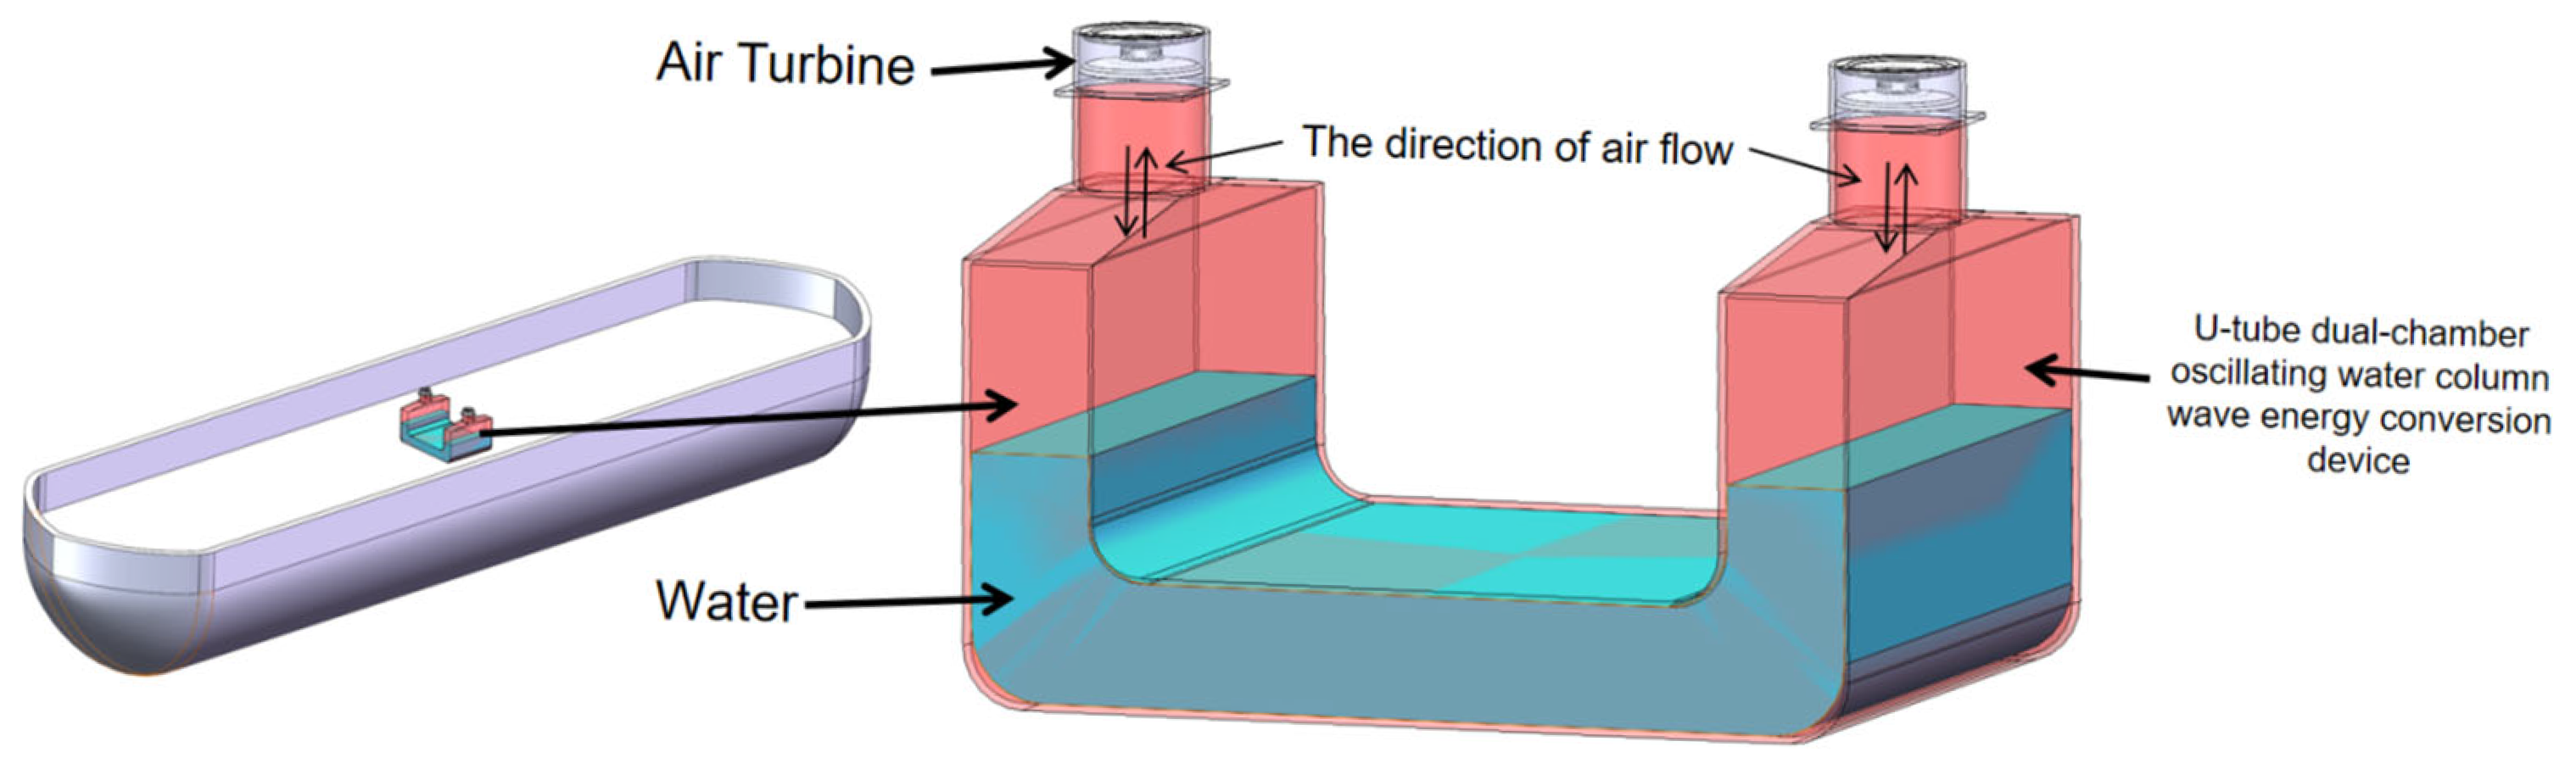
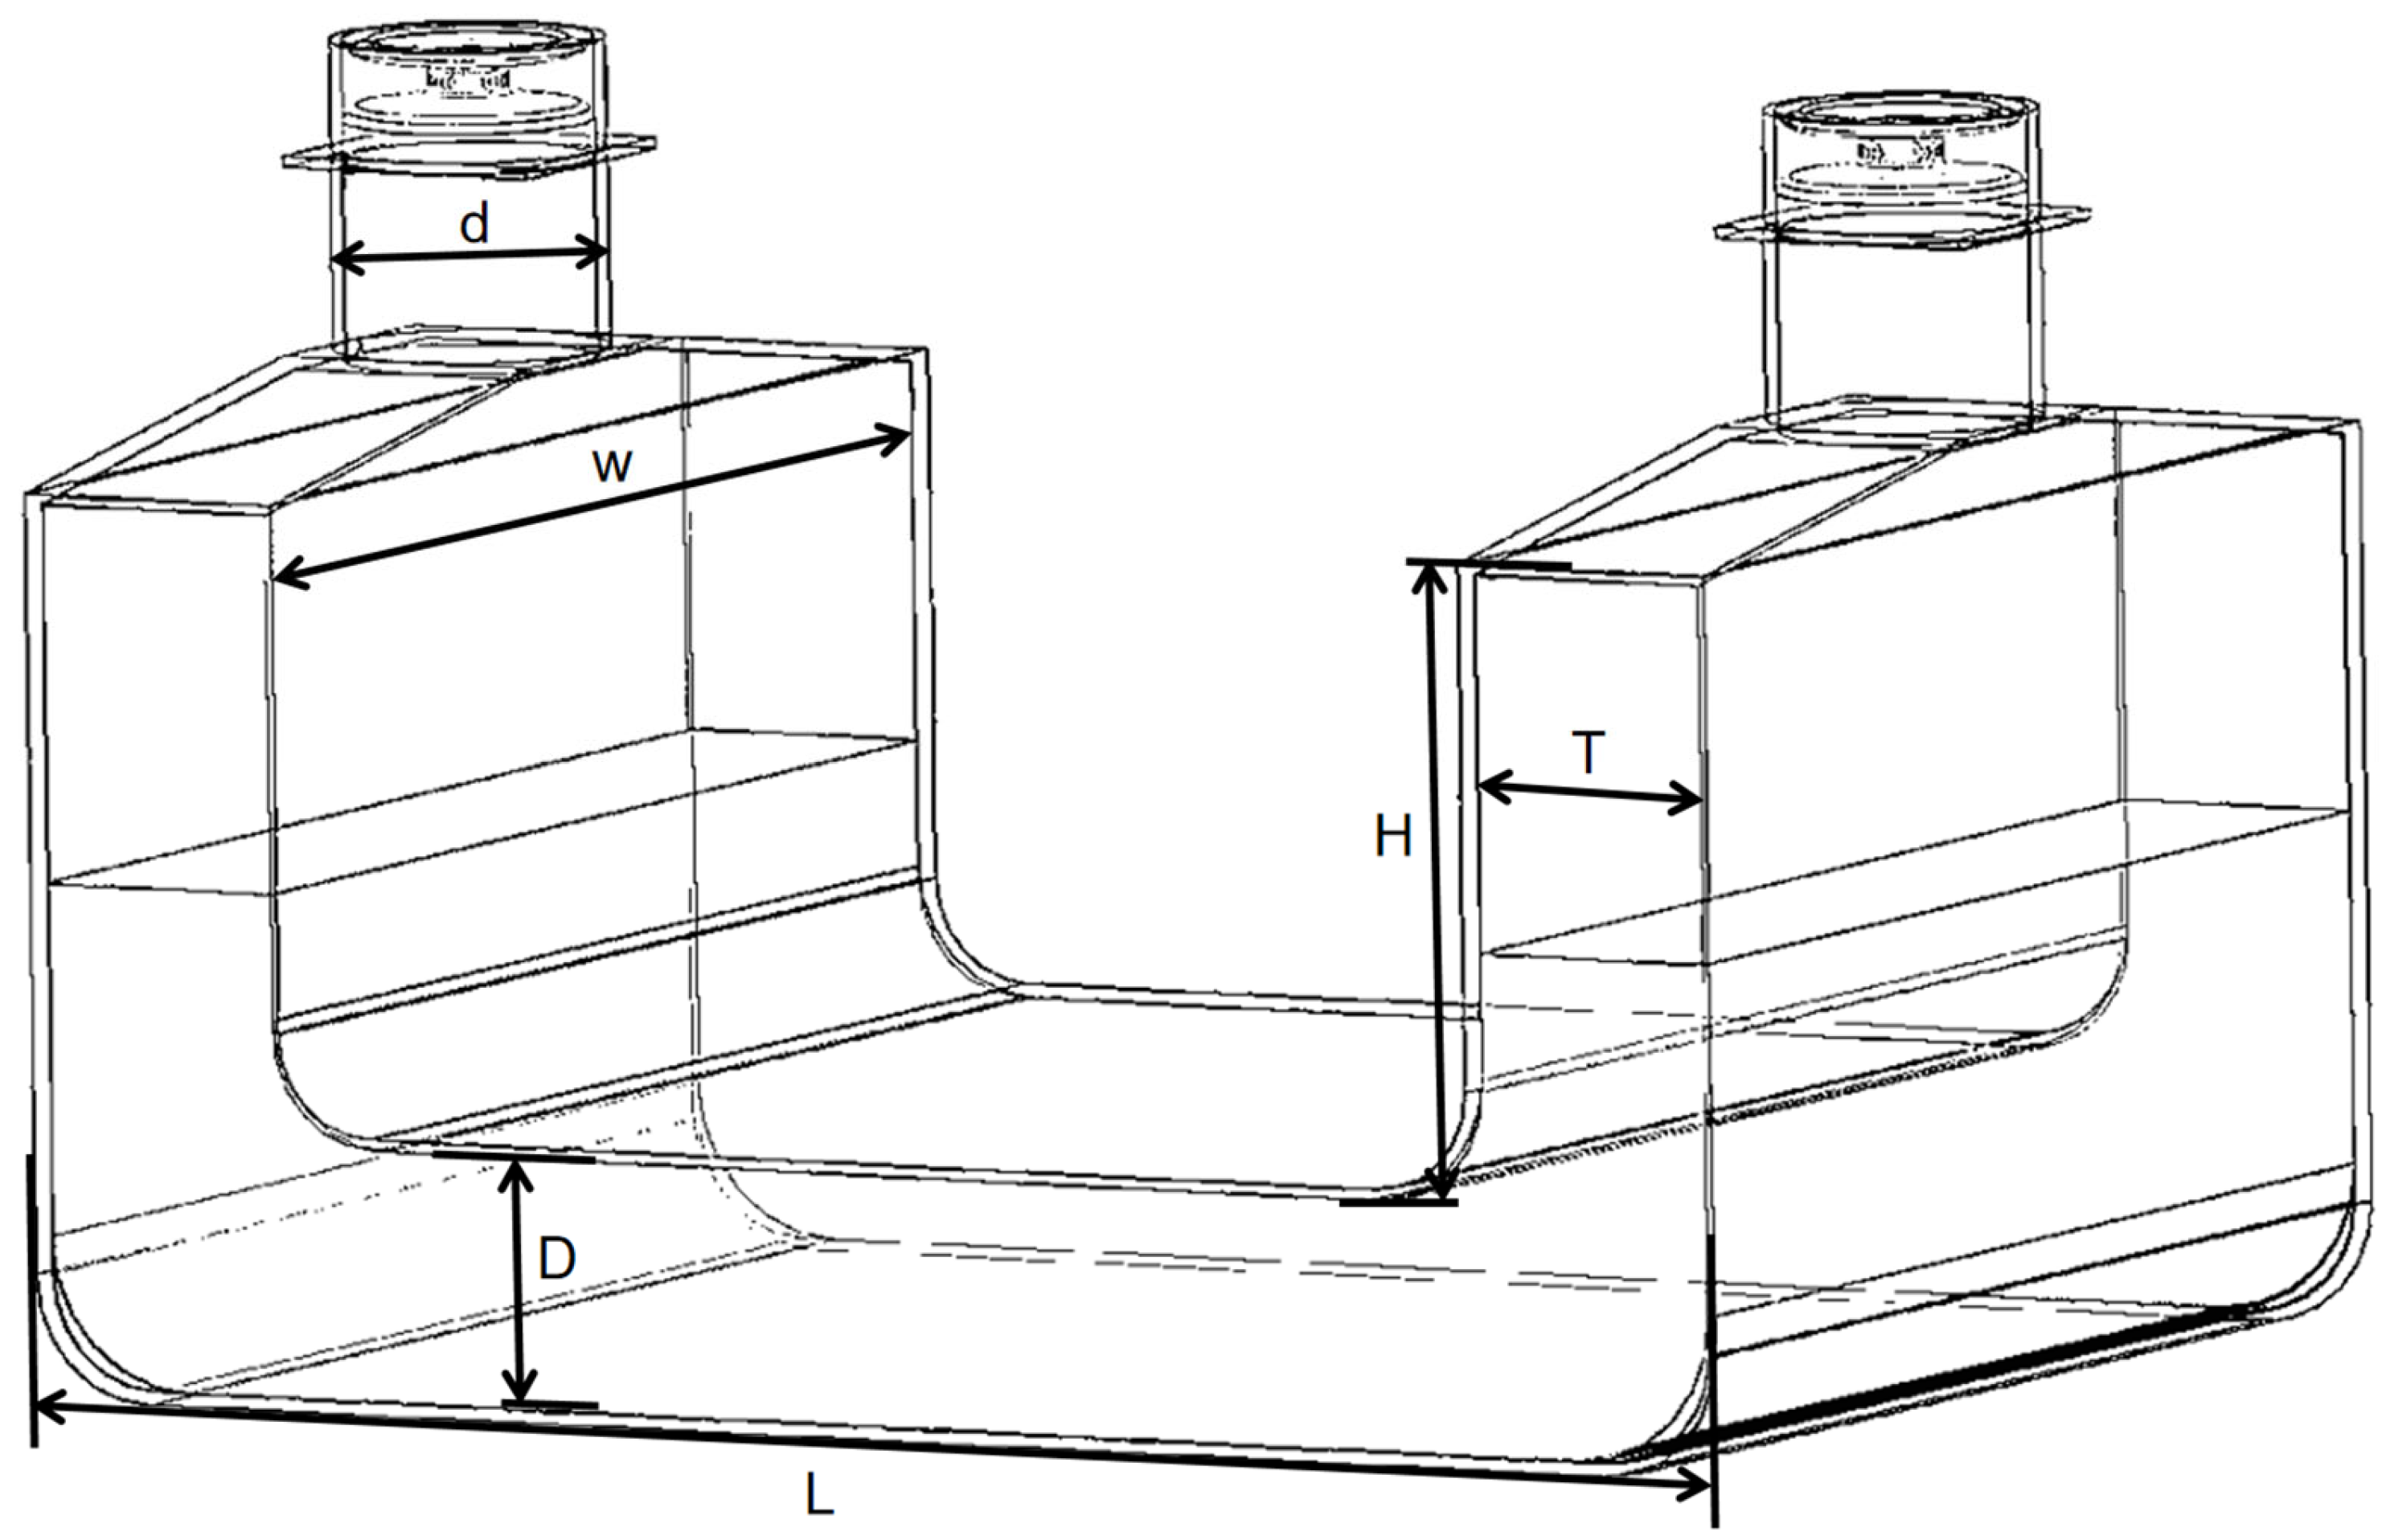
2. The Design of U-Tube Dual Chamber OWC
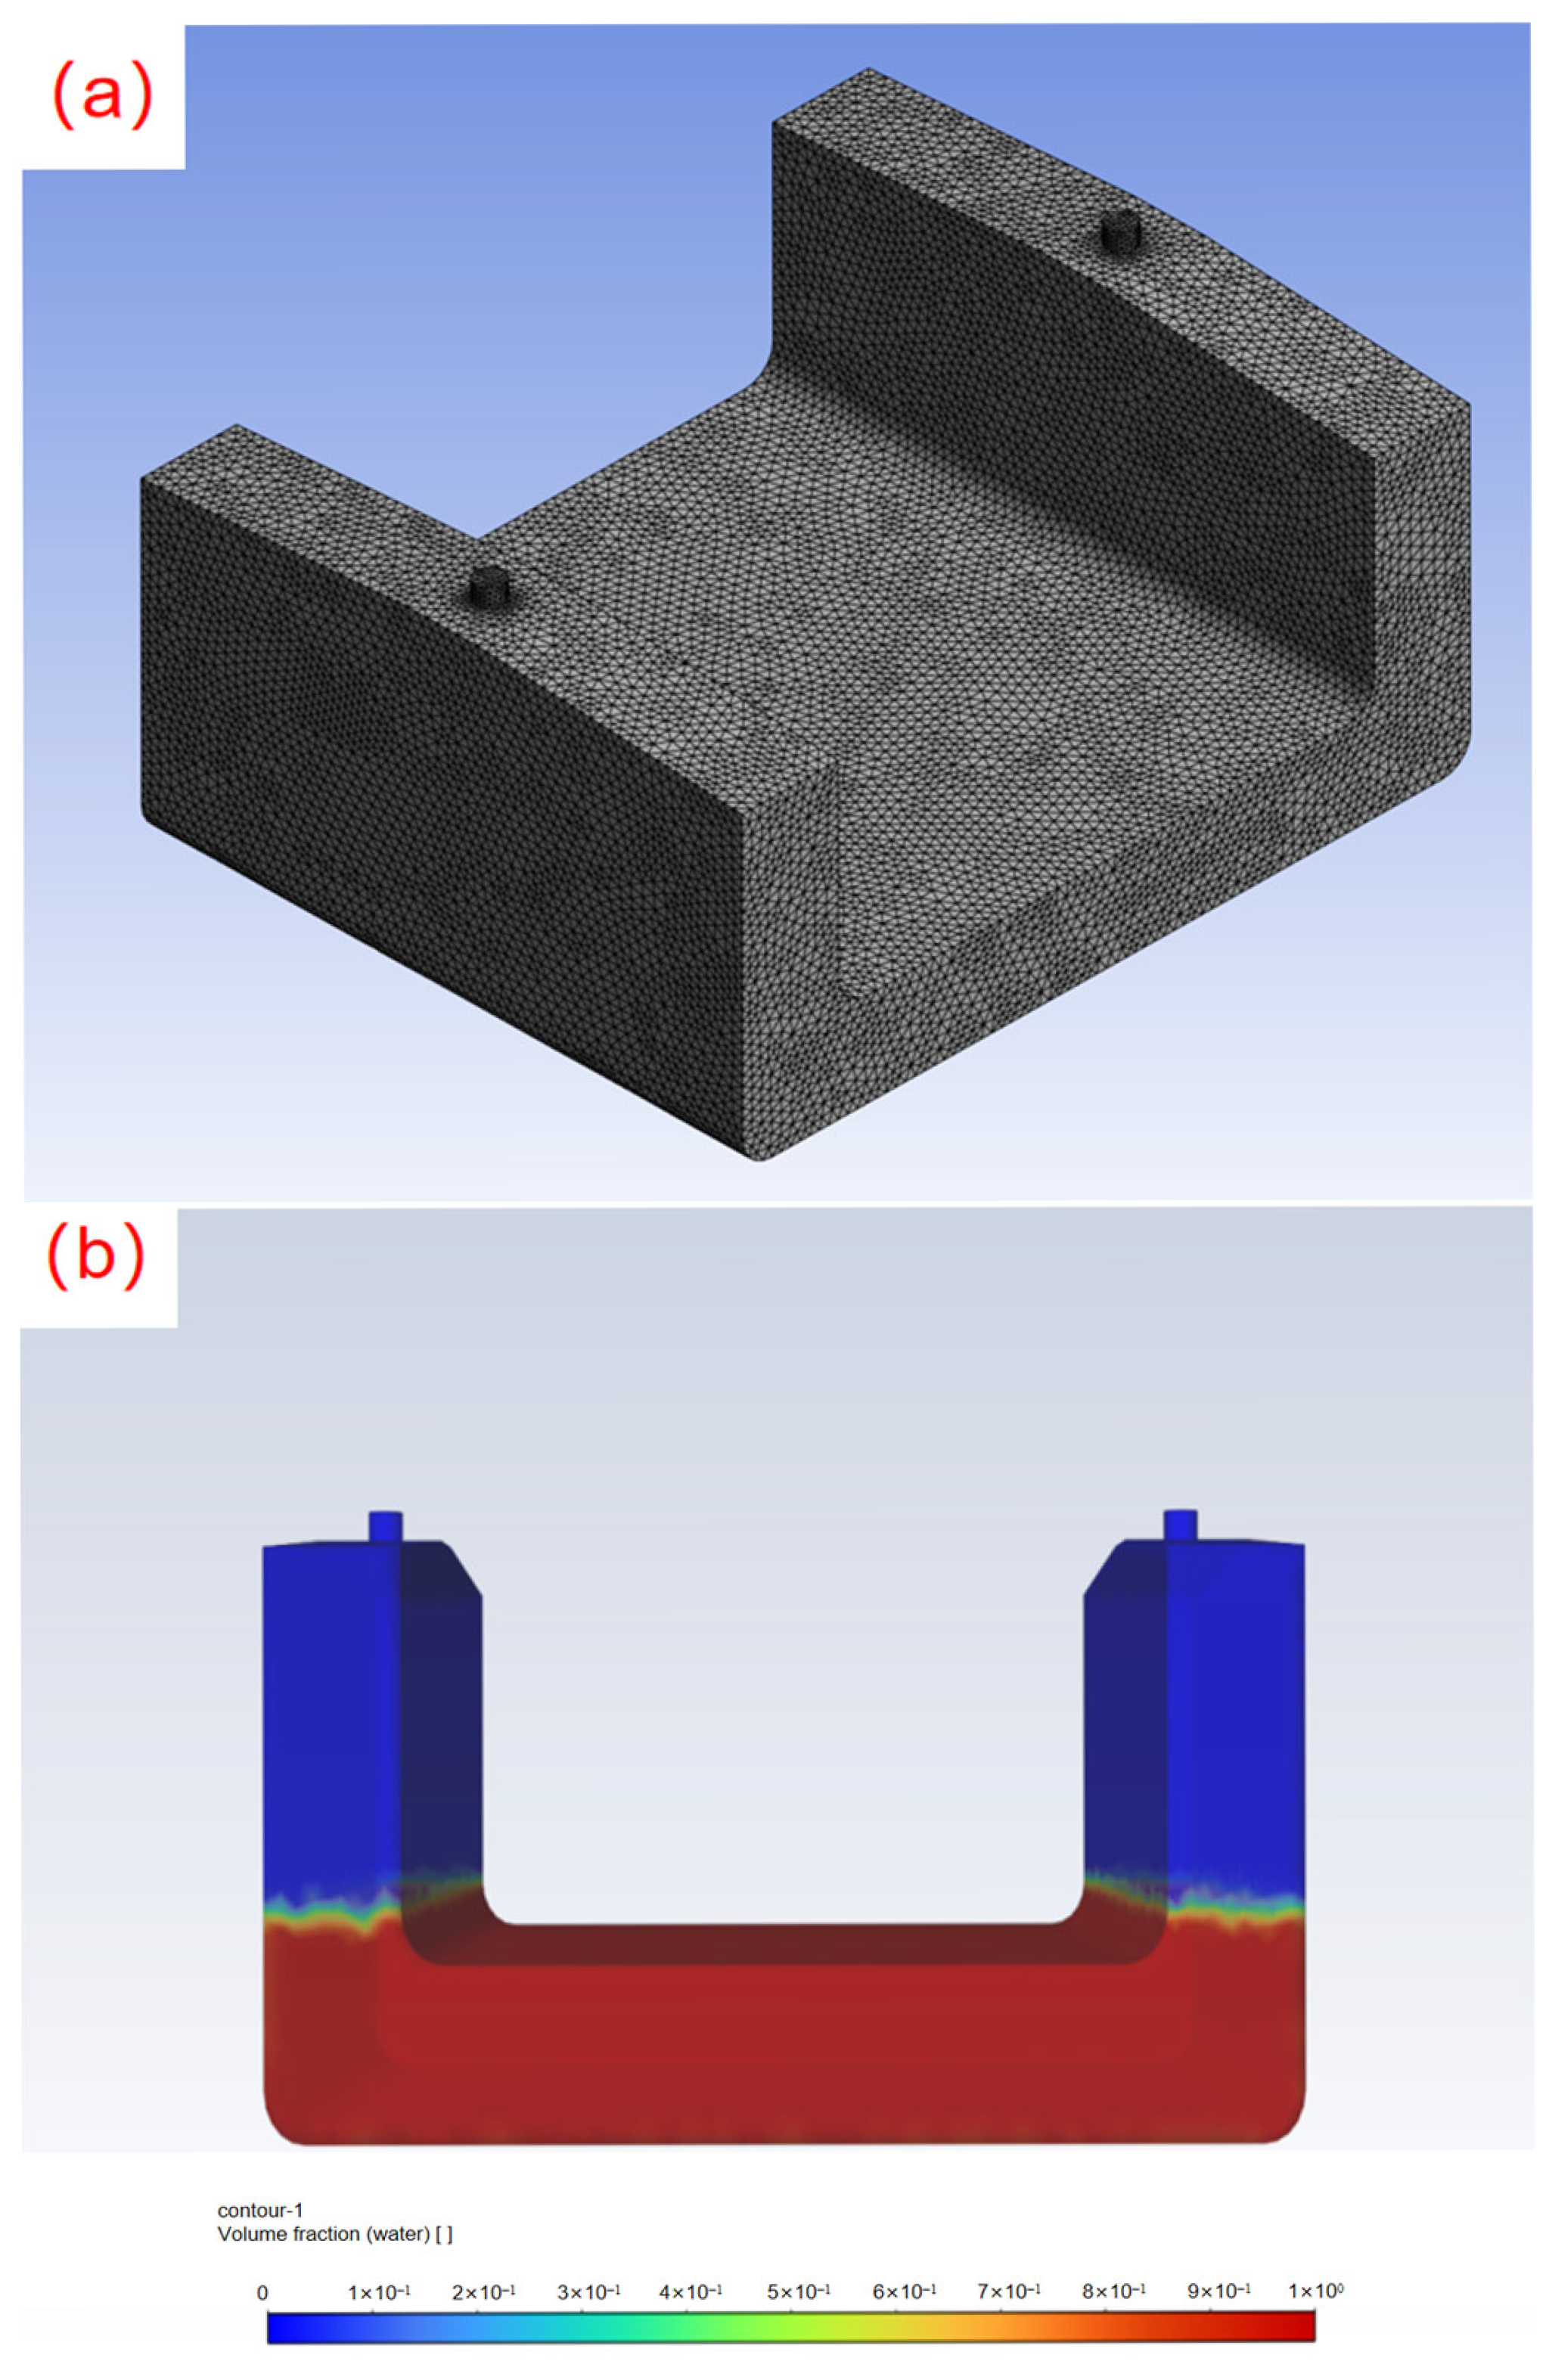
3. Numerical Model
4. Simulation Settings
5. Simulation Analysis
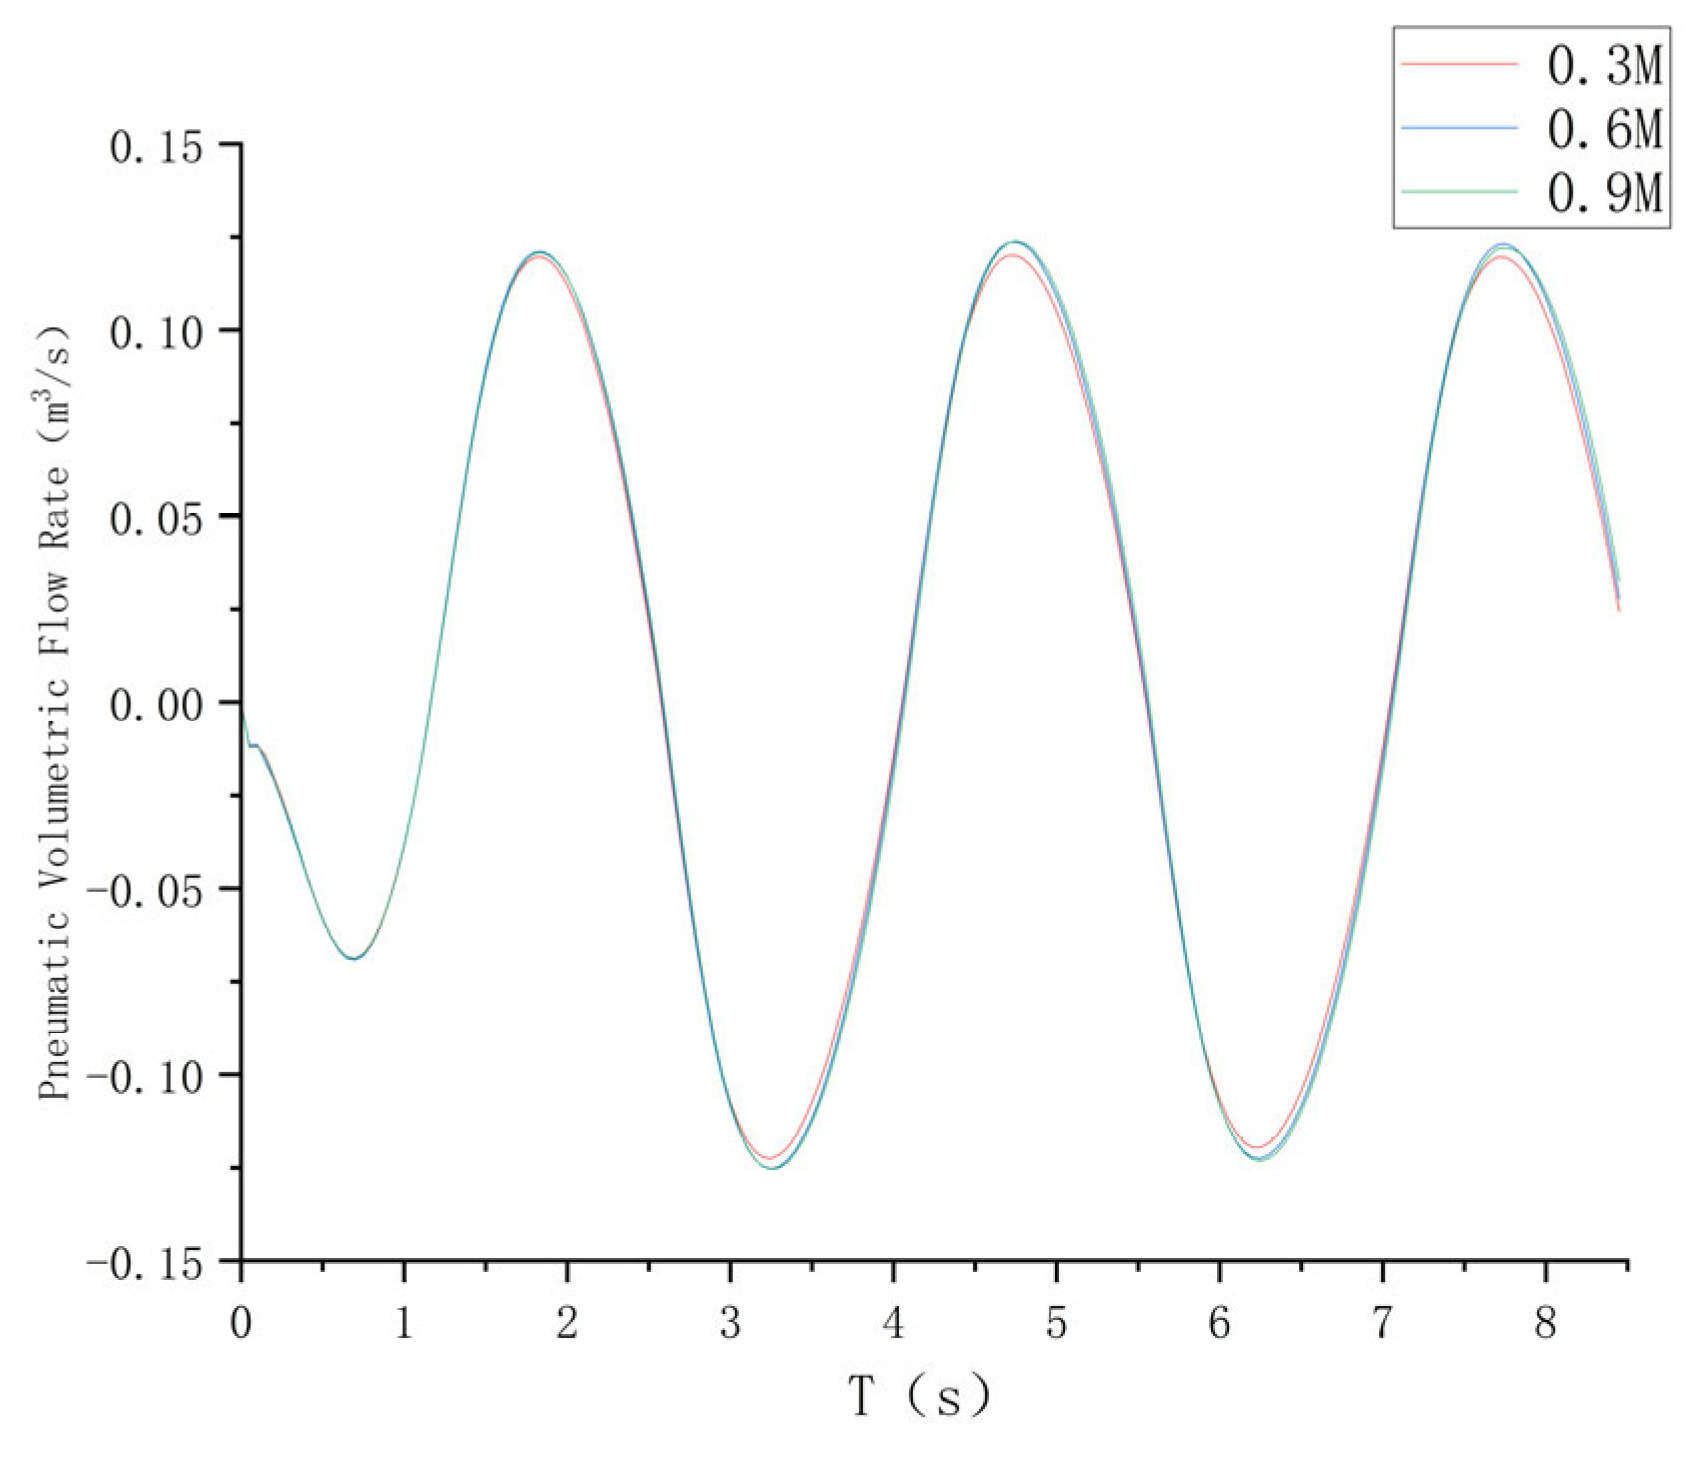
5.1. Mesh Effect of the Numerical Model
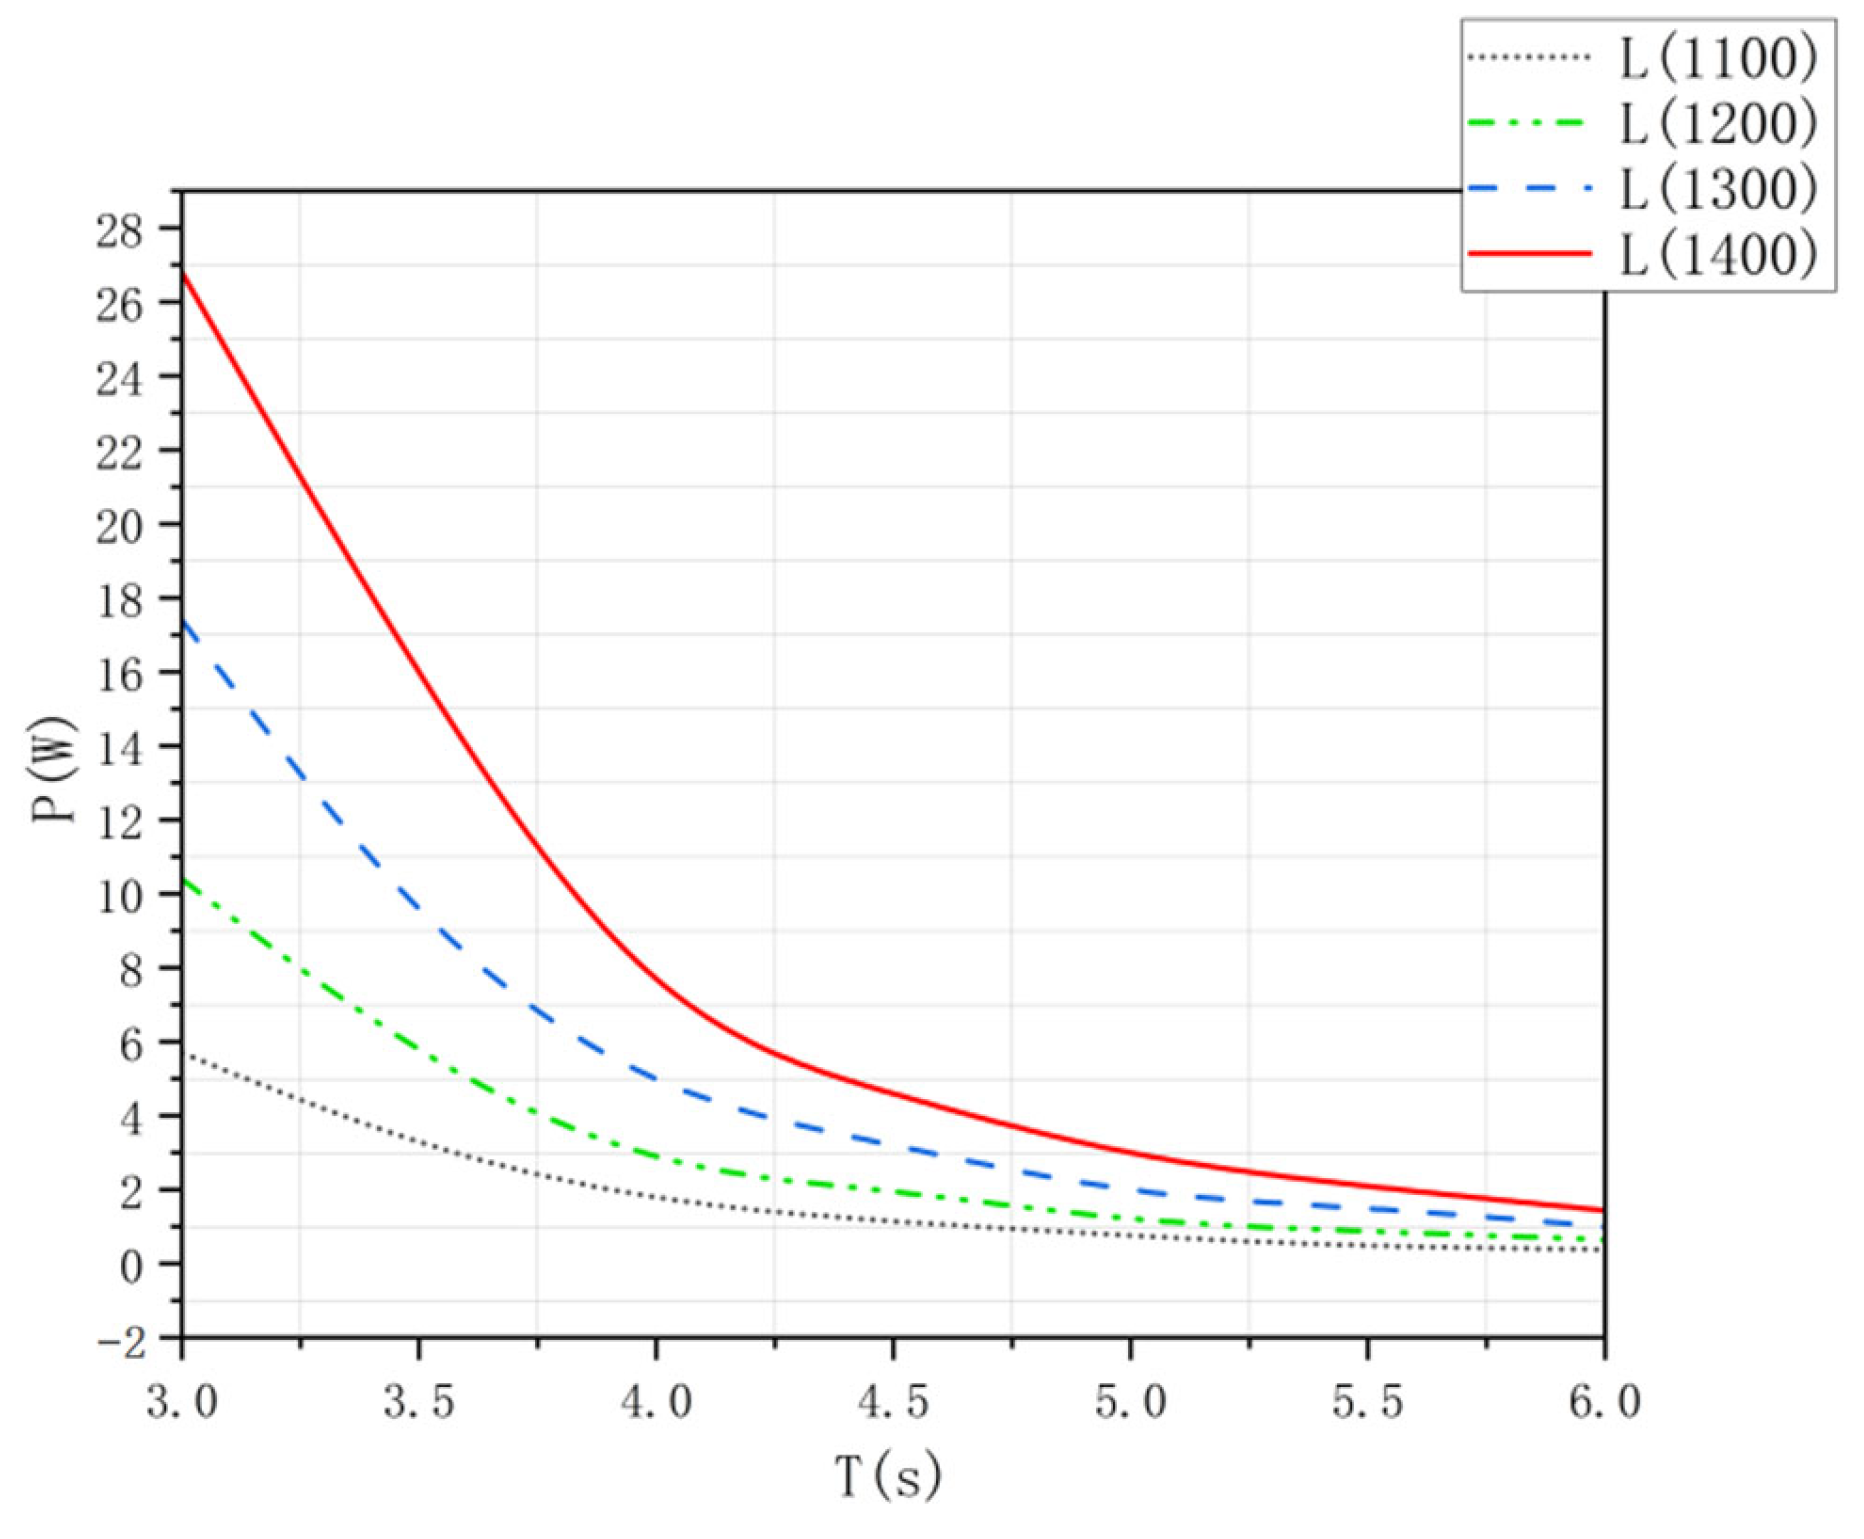
5.2. The Effect of the Overall Device Length on the Aerodynamic Power
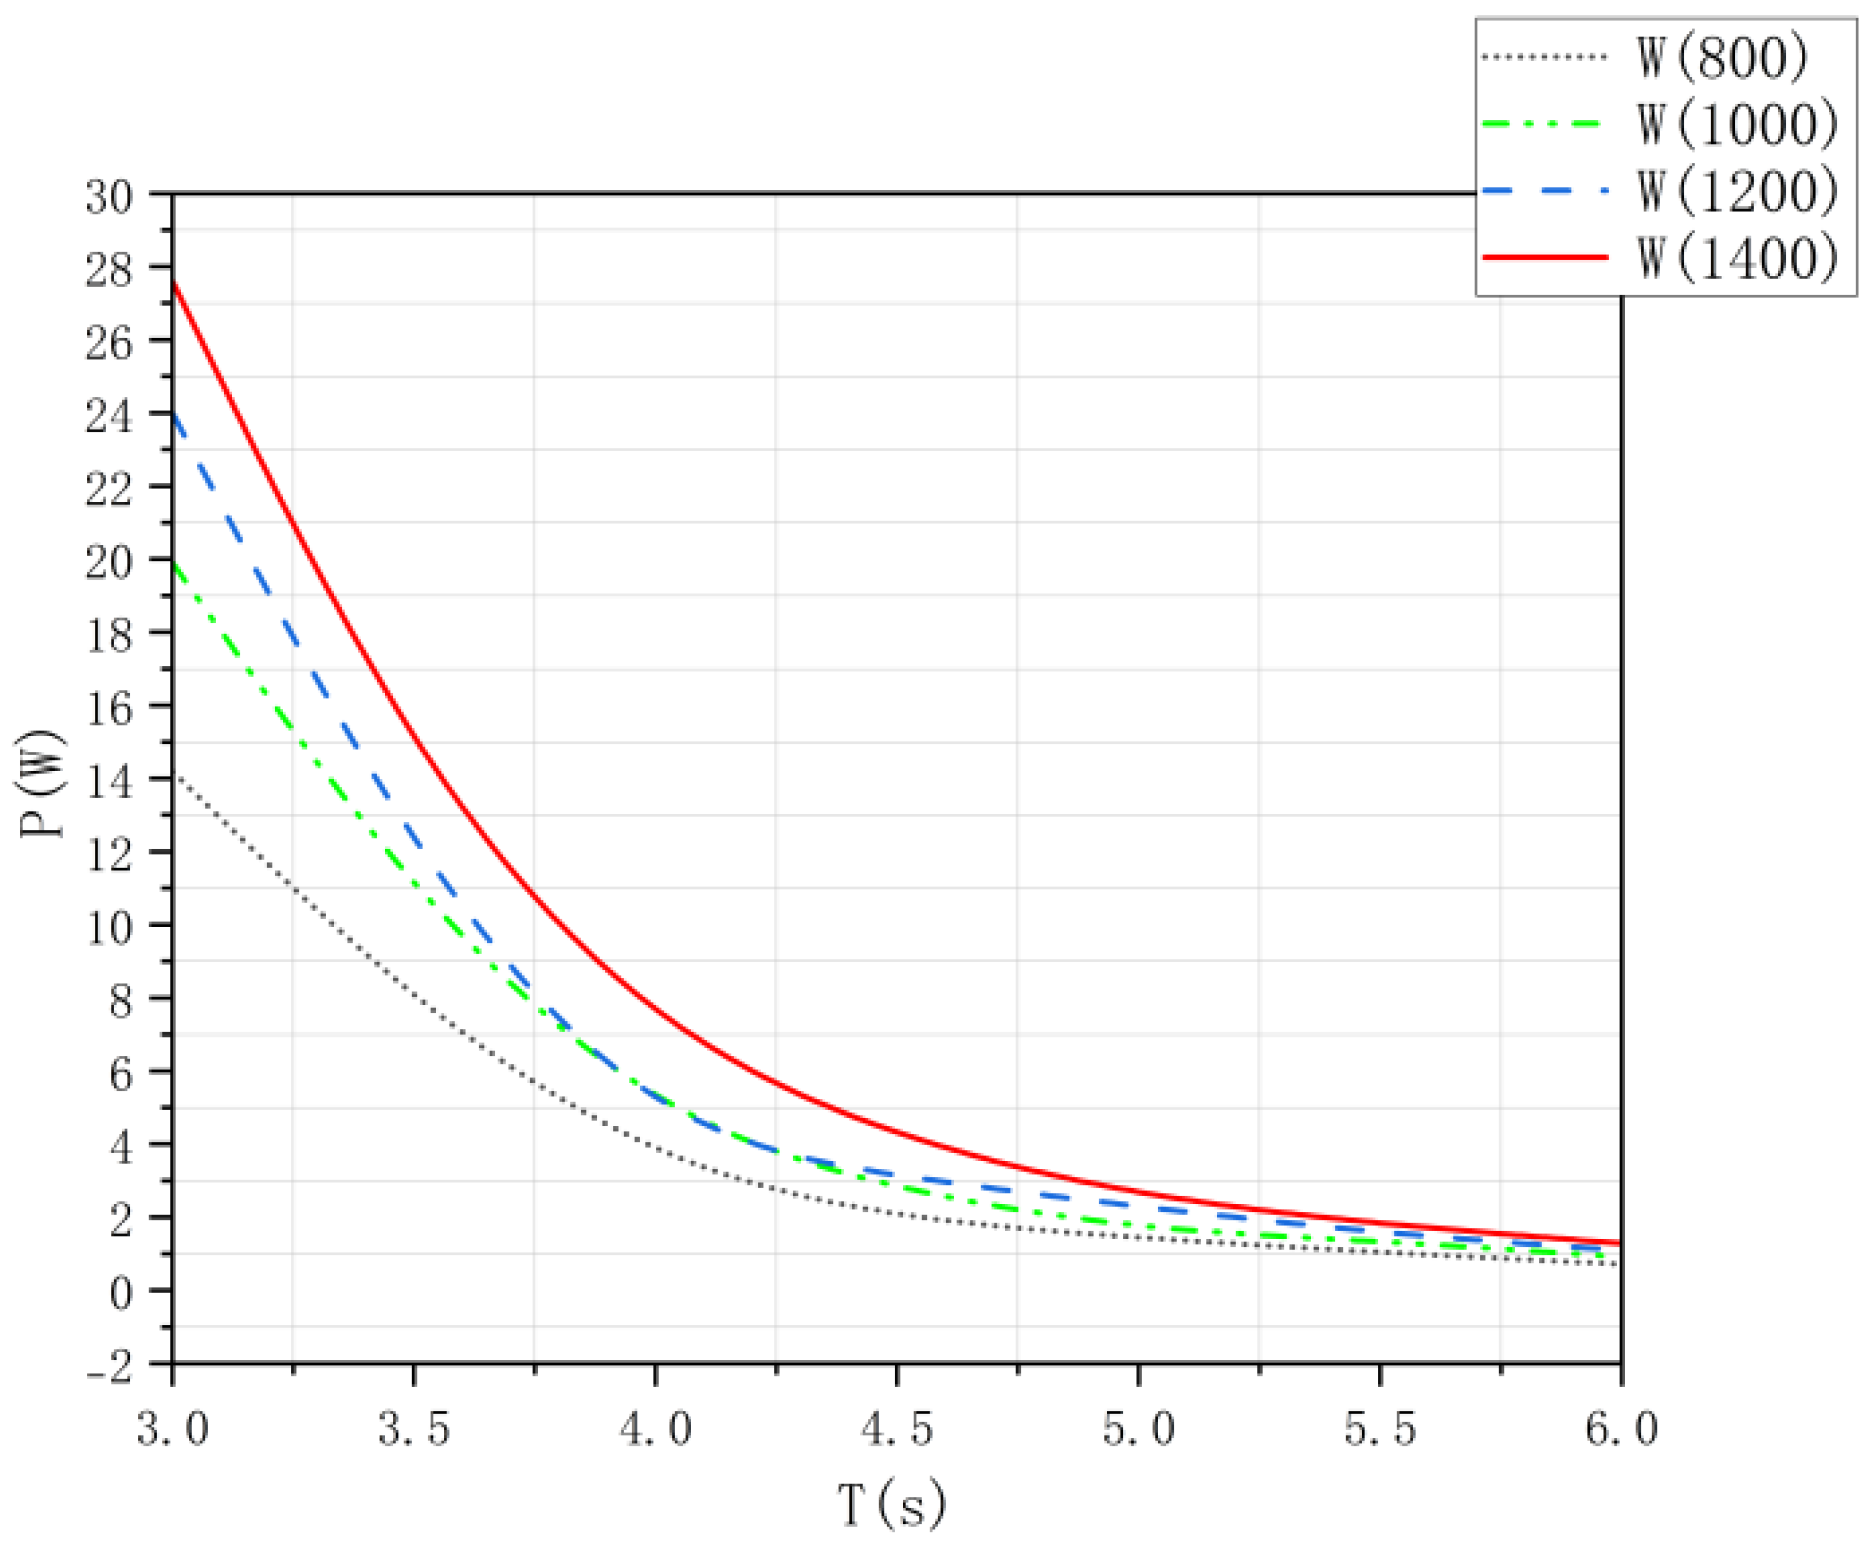
5.3. The Impact of the Overall Width of the Device on Aerodynamic Power
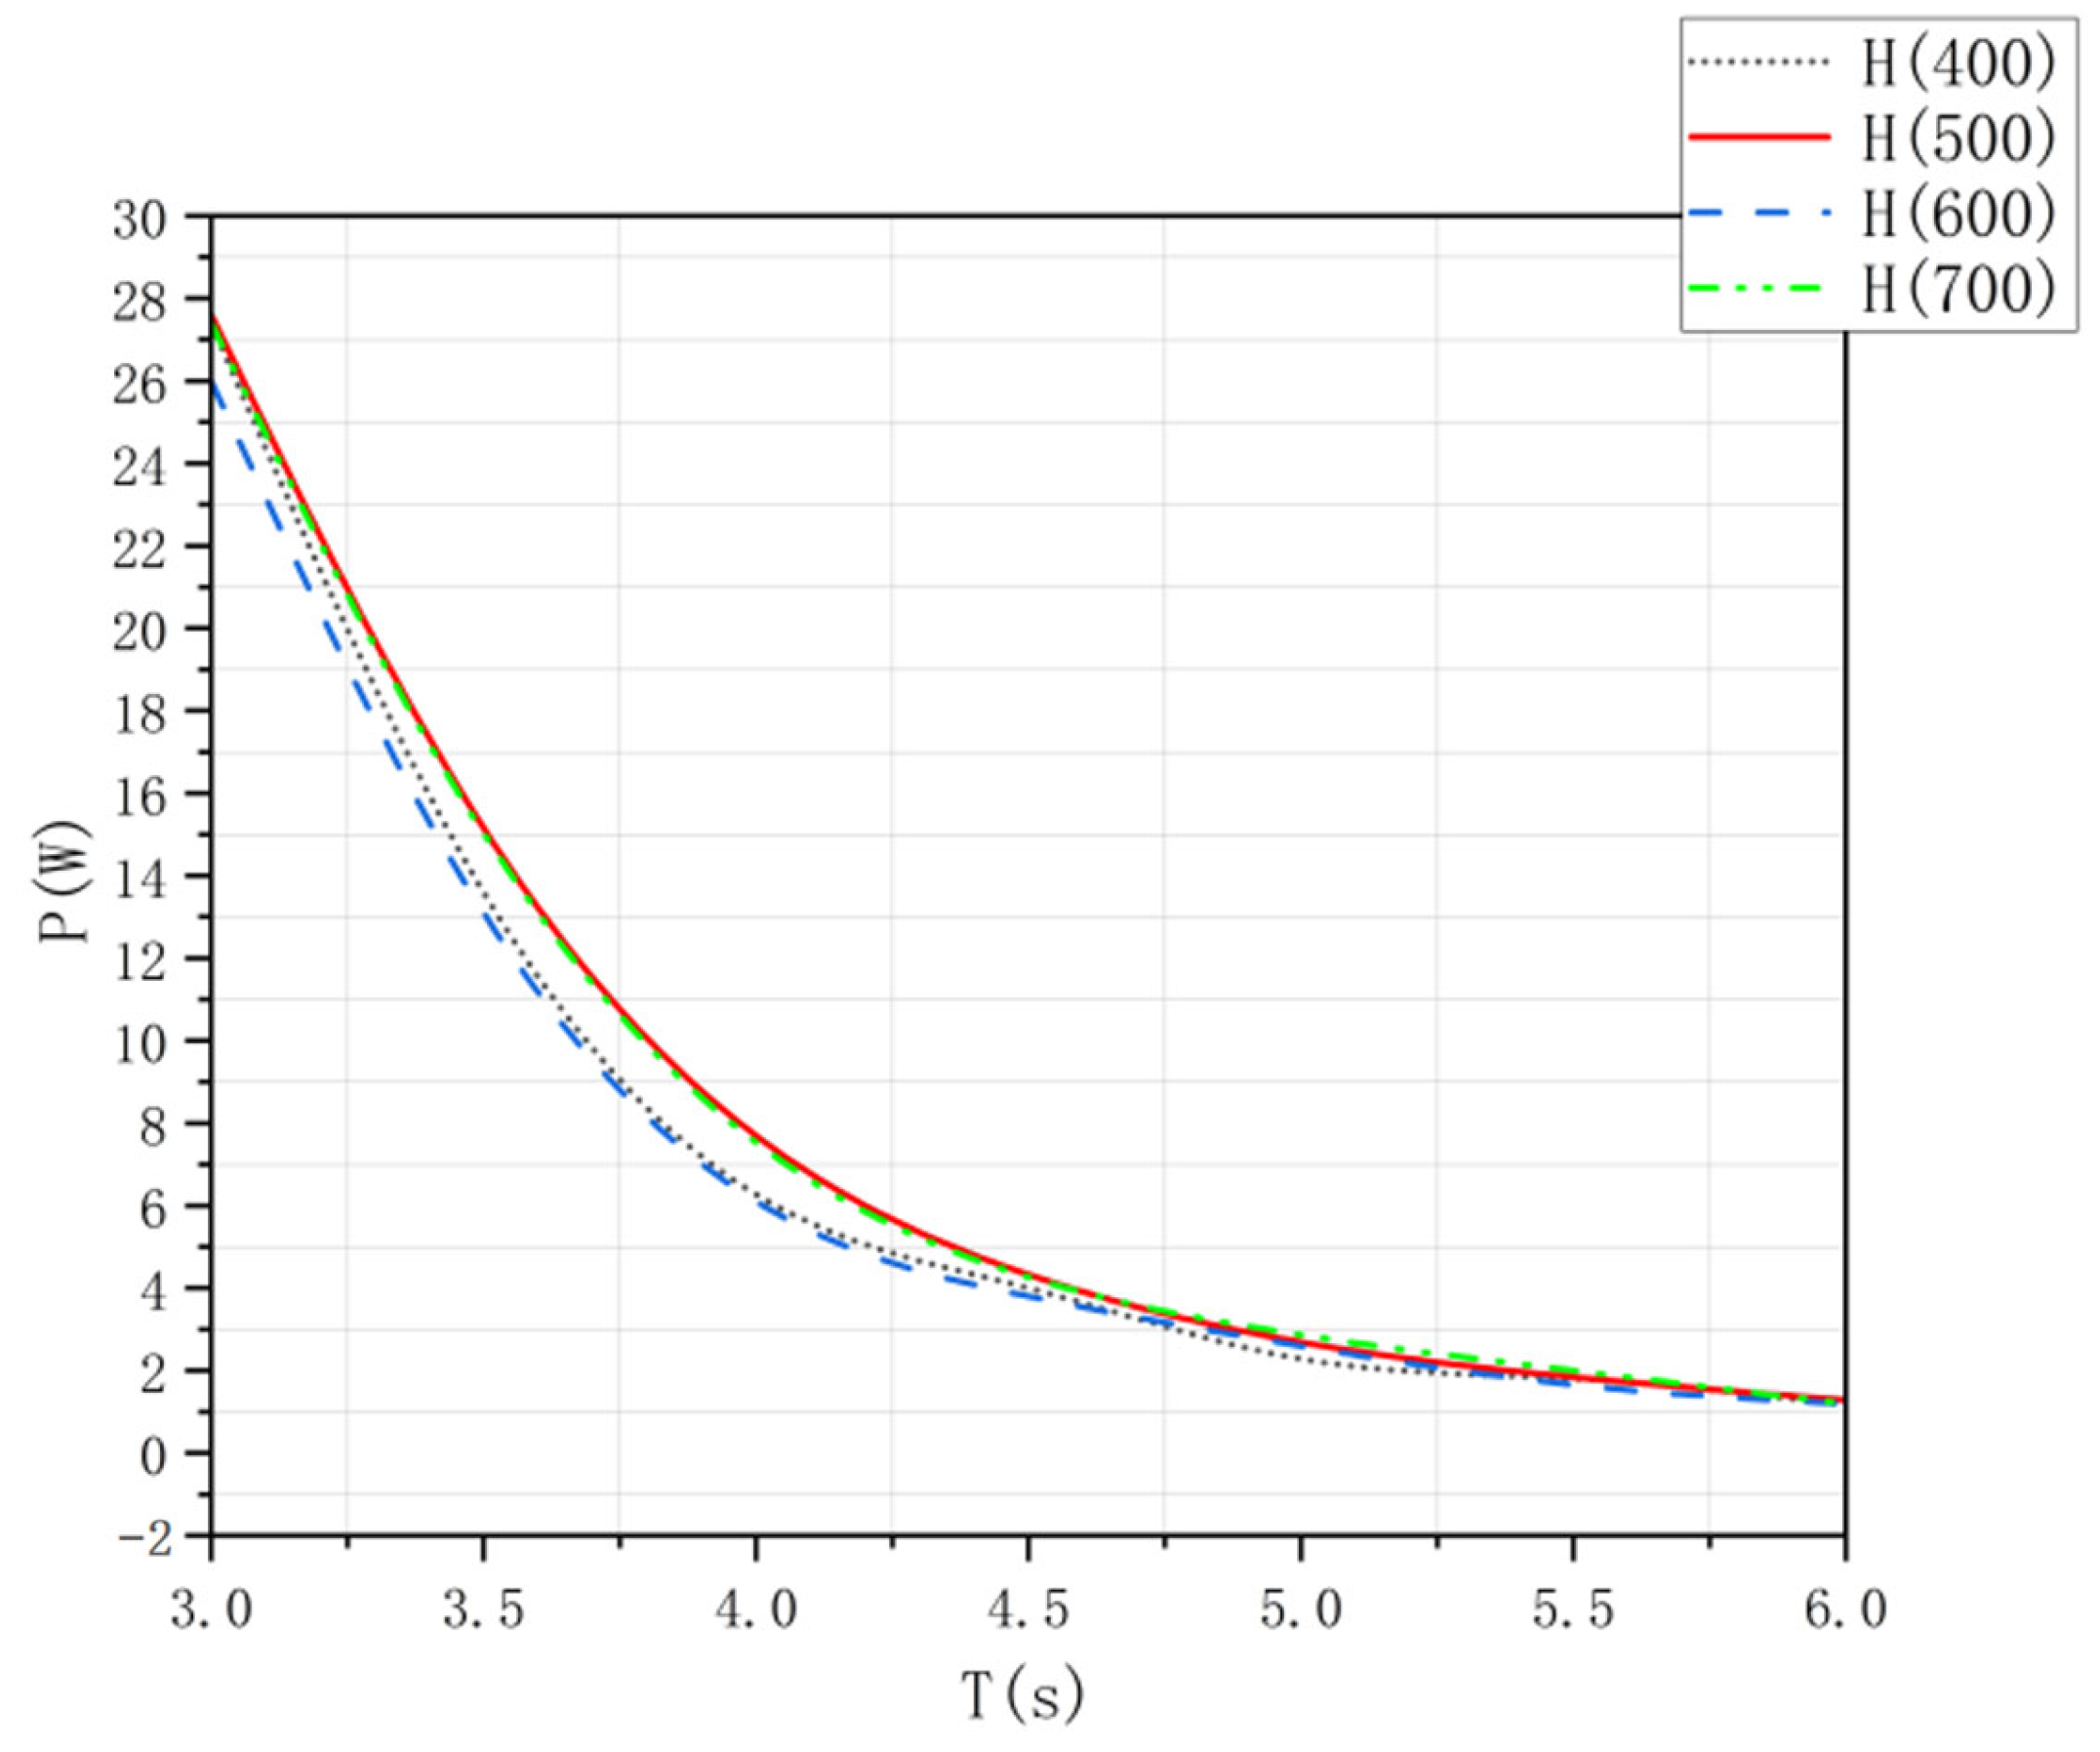
5.4. The Impact of the Overall Height of the Device on Aerodynamic Power
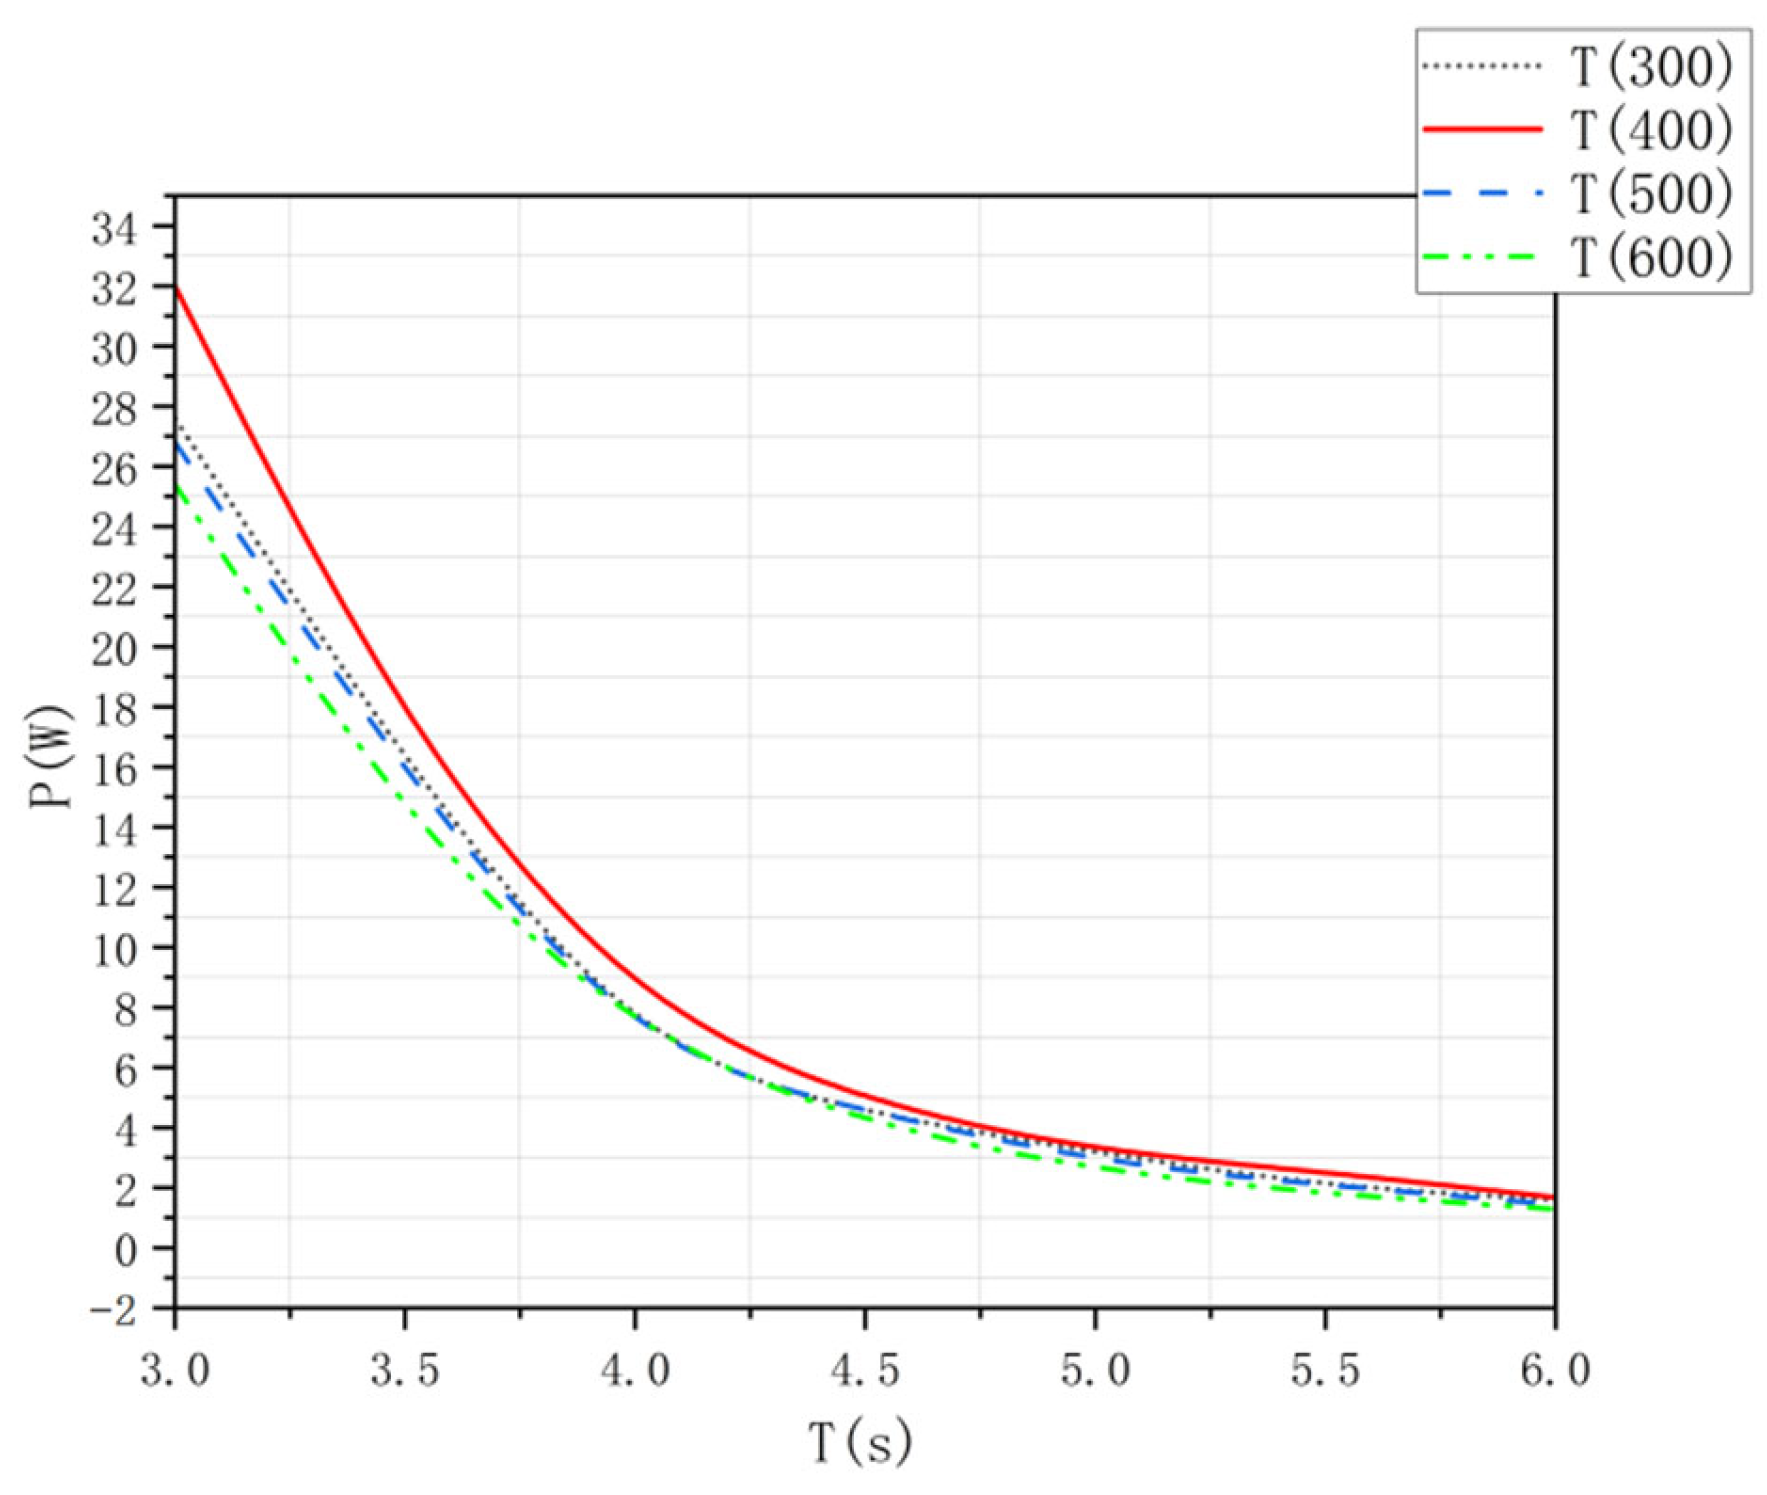
5.5. The Impact of the Channel Width Inside the Device on the Aerodynamic Power
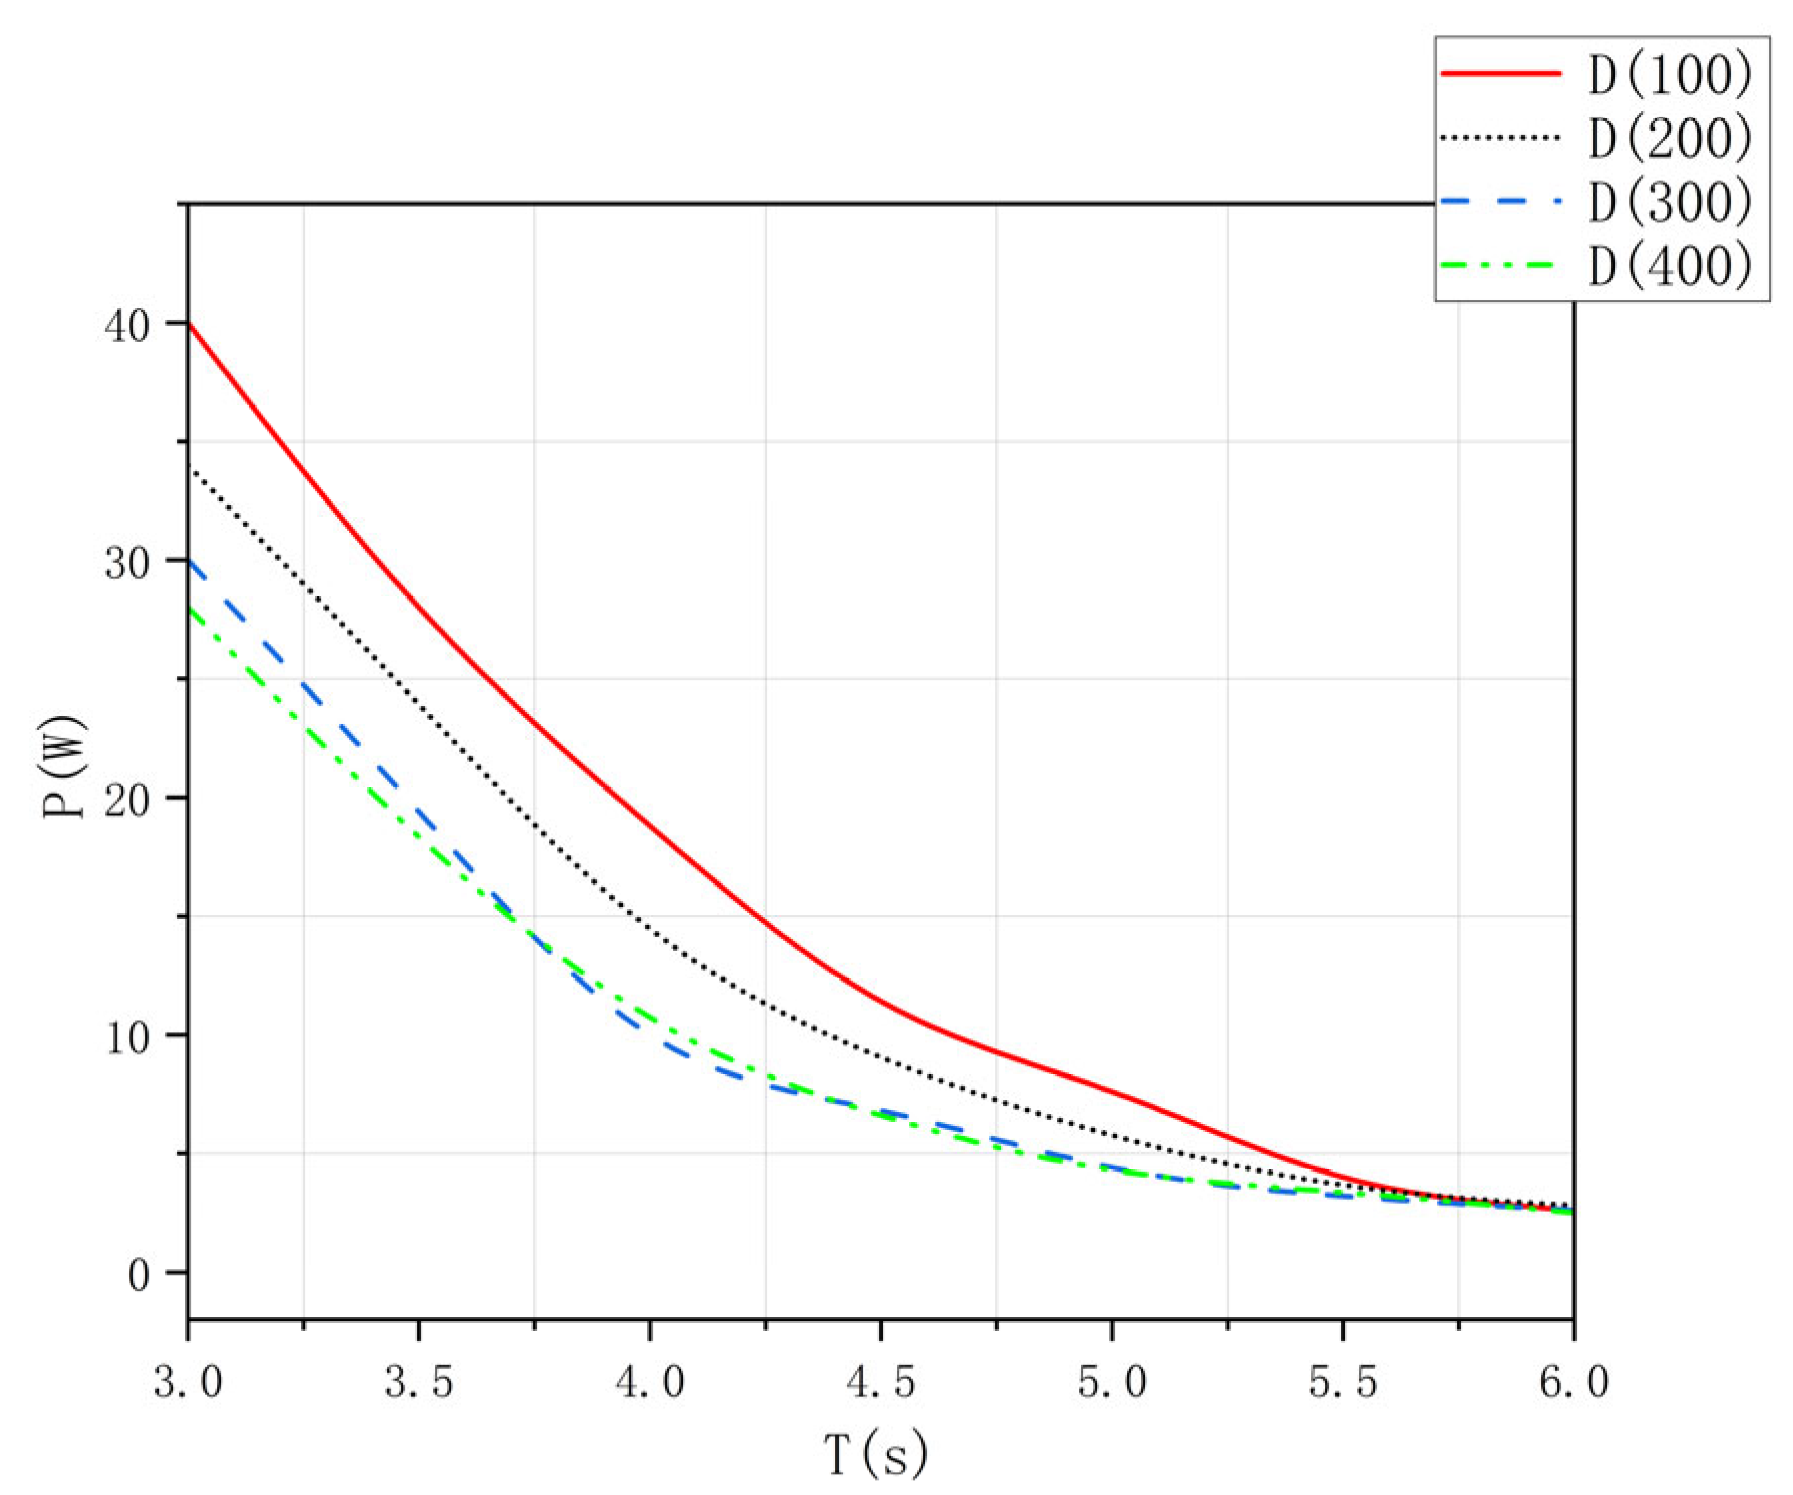
5.6. The Impact of the Channel Height Inside the Device on the Aerodynamic Power
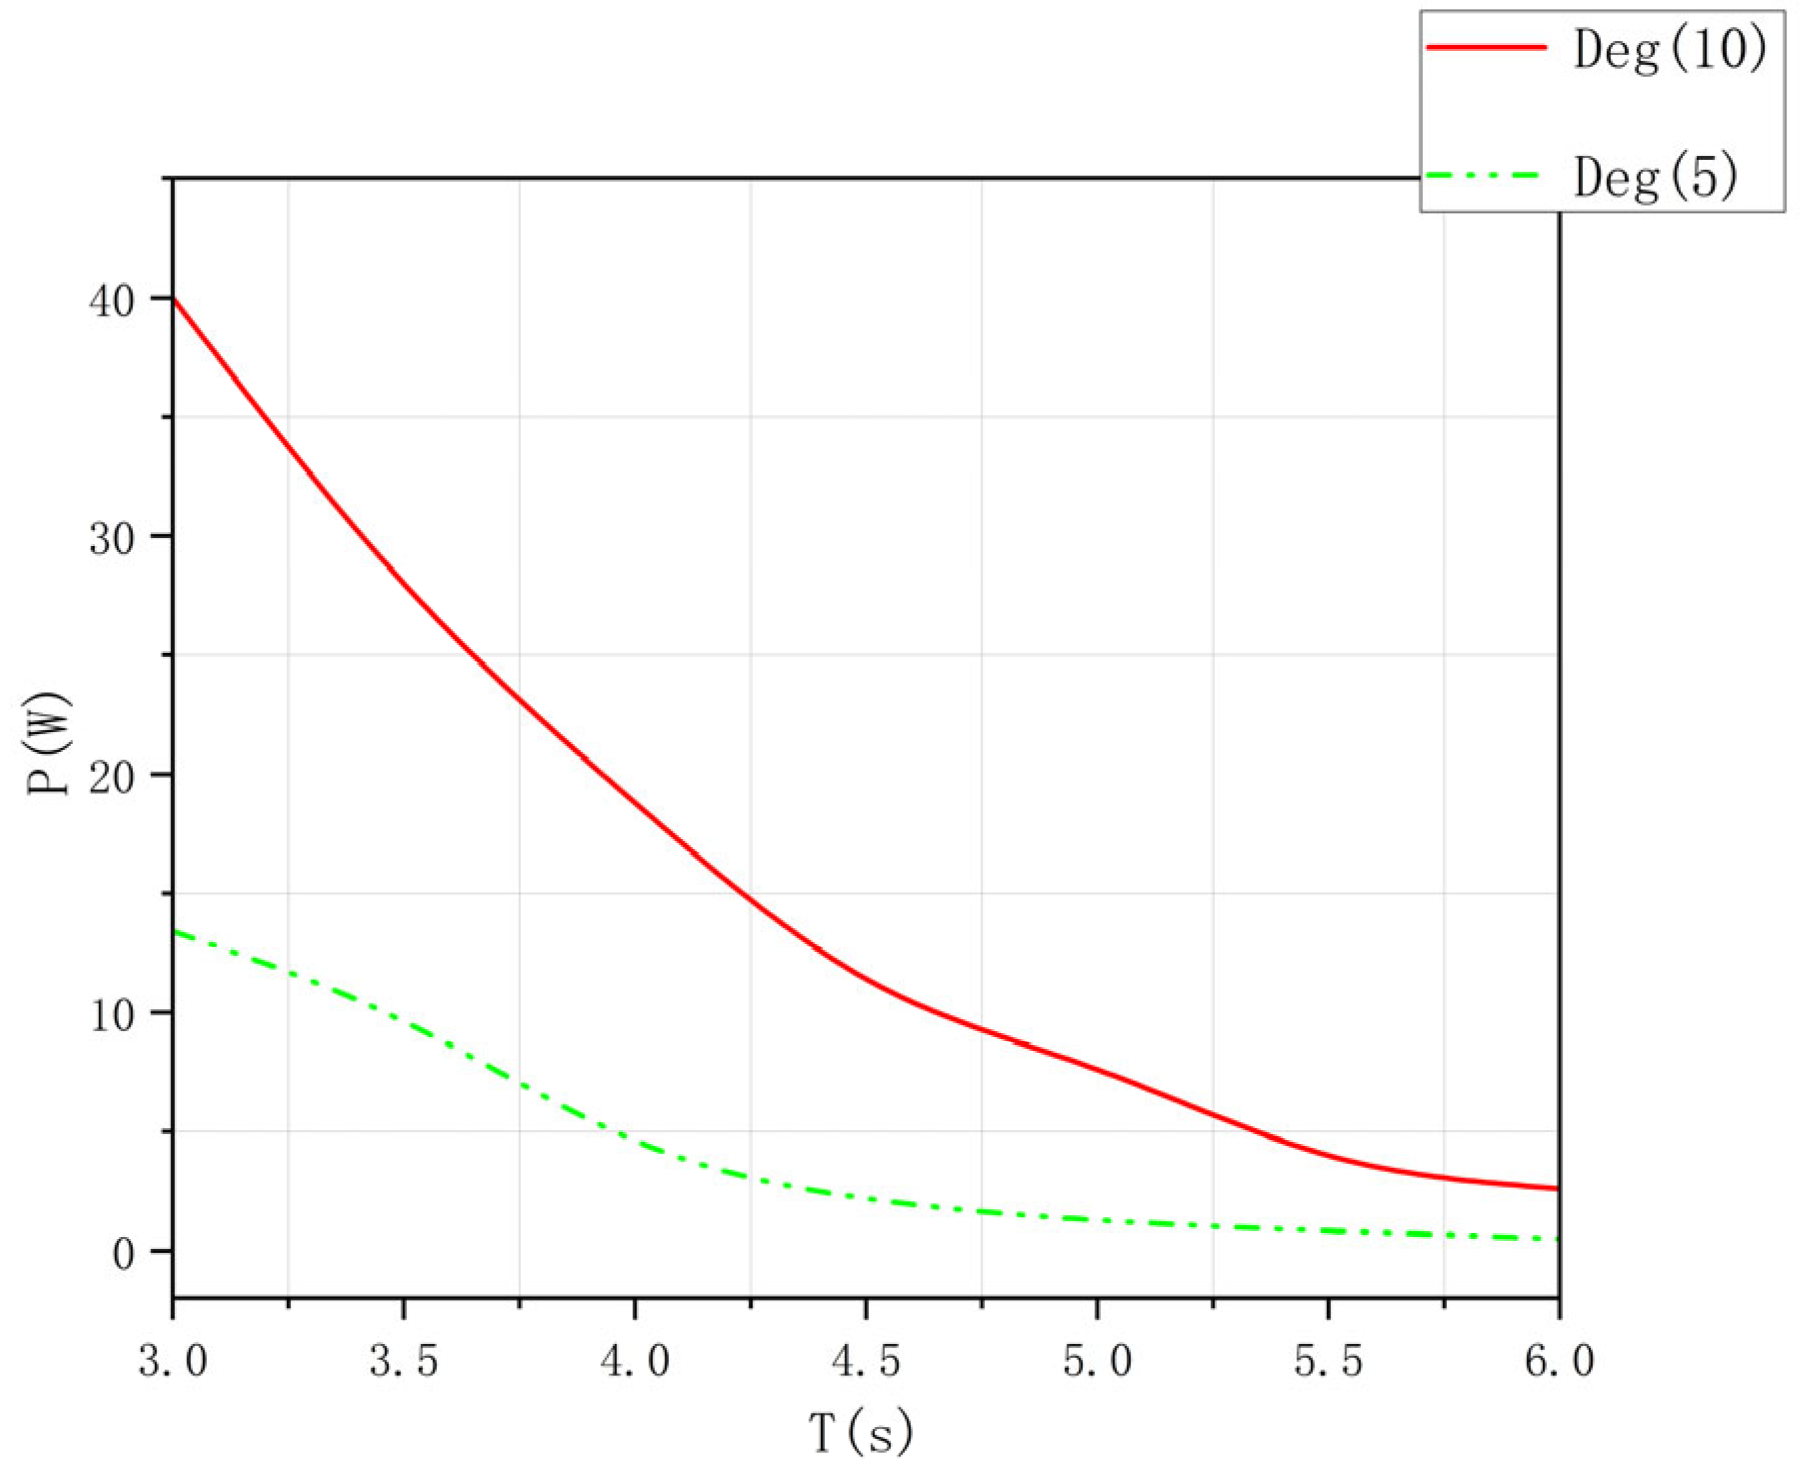
5.7. The Impact of Sloshing Angle on the Aerodynamic Power of the Device
5.8. Simulation Conclusions
- (1)
- The numerical simulation results show that changing the length, width of the device, and the height of the bottom channel of the device has a significant impact on the generated aerodynamic power. Specifically, increasing the length and width of the device can increase the generated aerodynamic power; reducing the height of the bottom channel of the device can also increase the generated aerodynamic power. Adjusting these three groups of variables also has a relatively obvious effect on the change of aerodynamic power.
- (2)
- Numerical simulations indicate that modifying the air chamber height and U-tube width has minimal effect on aerodynamic power. However, subtle refinements to the U-tube width may yield marginal improvements in power generation under specific conditions.
6. Conclusions
- (1)
- A novel U-tube dual-chamber OWC device is proposed, targeting enhanced adaptability and efficiency in wave energy conversion, thereby broadening the operational scope of existing OWC technologies.
- (2)
- Fluid dynamics modeling and simulations were conducted to evaluate the device’s structural and operational dynamics. By systematically varying parameters such as length, width, and bottom channel height, the study quantifies their impact on aerodynamic power efficiency, establishing data-driven design guidelines.
Author Contributions
Funding
Data Availability Statement
Conflicts of Interest
References
- Pennock, S.; Noble, D.R.; Vardanyan, Y.; Delahaye, T.; Jeffrey, H. A modelling framework to quantify the power system benefits from ocean energy deployments. Appl. Energy 2023, 347, 12. [Google Scholar] [CrossRef]
- Rehman, S.; Alhems, L.M.; Alam, M.M.; Wang, L.J.; Toor, Z. A review of energy extraction from wind and ocean: Technologies, merits, efficiencies, and cost. Ocean Eng. 2023, 267, 38. [Google Scholar] [CrossRef]
- Wan, L.; Moan, T.; Gao, Z.; Shi, W. A review on the technical development of combined wind and wave energy conversion systems. Energy 2024, 294, 19. [Google Scholar] [CrossRef]
- Drew, B.; Plummer, A.R.; Sahinkaya, M.N. A review of wave energy converter technology. Proc. Inst. Mech. Eng. Part J. Power Energy 2009, 223, 887–902. [Google Scholar] [CrossRef]
- Ozkop, E.; Altas, I.H. Control, power and electrical components in wave energy conversion systems: A review of the technologies. Renew. Sust. Energ. Rev. 2017, 67, 106–115. [Google Scholar] [CrossRef]
- Chen, P.H.; Wu, D.W. A review of hybrid wave-tidal energy conversion technology. Ocean Eng. 2024, 303, 14. [Google Scholar] [CrossRef]
- Shi, X.L.; Liang, B.C.; Li, S.W.; Zhao, J.C.; Wang, J.H.; Wang, Z.L. Wave energy resource classification system for the China East Adjacent Seas based on multivariate clustering. Energy 2024, 299, 23. [Google Scholar] [CrossRef]
- Adibzade, M.; Akbari, H. Spectral approach to evaluate multi-body floating wave energy converters in complex sea states. Ocean Eng. 2023, 286, 115567. [Google Scholar] [CrossRef]
- Falcao, A.F.O.; Henriques, J.C.C. Oscillating-water-column wave energy converters and air turbines: A review. Renew. Energy 2016, 85, 1391–1424. [Google Scholar] [CrossRef]
- Falcão, A.F.O. Developments in oscillating water column wave energy converters and air turbines. In Renewable Energies Offshore; CRC Press: Boca Raton, FL, USA, 2015. [Google Scholar]
- Çelik, A.; Altunkaynak, A. Experimental and analytical investigation on chamber water surface fluctuations and motion behaviours of water column type wave energy converter. Ocean Eng. 2018, 150, 209–220. [Google Scholar] [CrossRef]
- Çelik, A.; Altunkaynak, A. Determination of hydrodynamic parameters of a fixed OWC by performing experimental and numerical free decay tests. Ocean Eng. 2020, 204, 106827. [Google Scholar] [CrossRef]
- Mandev, M.B.; Çelik, A.; Altunkaynak, A. Maximizing oscillating water column efficiency: The impact of vertical plate and guide vane. Energy 2024, 308, 132901. [Google Scholar] [CrossRef]
- Heath, T. The development and installation of the LIMPET wave energy converter. In World Renewable Energy Congress VI; Elsevier: Amsterdam, The Netherlands, 2000. [Google Scholar]
- Arena, F.; Romolo, A.; Malara, G.; Fiamma, V.; Laface, V.L.A. The first worldwide application at full-scale of the REWEC3 device in the Port of Civitavecchia: Initial energetic performances. In Proceedings of the 2nd International Conference on Renewable Energies Offshore (RENEW2016), Lisbon, Portugal, 24–26 October 2016. [Google Scholar]
- Liu, Z.; Zhang, X.; Ding, L.; Han, Z.; Ni, H. Hydrodynamic and energy-harvesting performances of a compact-array OWC device: An experimental study. Energy 2024, 310, 133209. [Google Scholar] [CrossRef]
- Froude, W. On the rolling of Ships. Available online: http://books.google.com/books?id=xDMDAAAAQAAJ&printsec=frontcover&hl=zh-CN#v=onepage&q&f=false (accessed on 24 December 2024).
- Stigter, C. The performance of U-tanks as a passive anti-rolling device. Int. Shipbuild. Prog. 1966, 13, 249–275. [Google Scholar] [CrossRef]
- Holder, L.A. Seakeeping–Ship Behaviour in Rough Weather. A. R. J. M. Lloyd. 486 pages, 17 × 24.5 cm, Ellis Horwood, 1989. £59.50. J. Navig. 1990, 43, 140. [Google Scholar] [CrossRef]
- Zhong, Z.Y.; Falzarano, M.; Fithen, R. A Numerical Study of U-Tube Passive Anti-Rolling Tanks. In Proceedings of the Eighth International Offshore and Polar Engineering Conference, Montreal, QC, Canada, 24–29 May 1998. [Google Scholar]
- Daalen, E.V.; Kleefsman, K.M.T.; Gerrits, J.; Luth, H.R.; Veldman, A.E.P. Anti-Roll Tank Simulations with a Volume of Fluid (VOF) Based Navier-Stokes Solver; University of Groningen, Johann Bernoulli Institute for Mathematics and Computer Science: Groningen, The Netherlands, 2001. [Google Scholar]
- Taskar, B.U.; DasGupta, D.; Nagarajan, V.; Chakraborty, S.; Chatterjee, A.; Sha, O.P. CFD aided modelling of anti-rolling tanks towards more accurate ship dynamics. Ocean Eng. 2014, 92, 296–303. [Google Scholar] [CrossRef]
- Fontana, M.; Giorgi, G.; Accardi, M.; Giorcelli, E.; Brizzolara, S.; Sirigu, S.A.; Dos Santos, E.D.; Isoldi, L.A. Numerical and Experimental Investigation of the Dynamics of a U-Shaped Sloshing Tank to Increase the Performance of Wave Energy Converters. J. Mar. Sci. Eng. 2023, 11, 2339. [Google Scholar] [CrossRef]
- Gawad, A.F.A.; Ragab, S.; Nayfeh, A.H.; Mook, D.T. Roll stabilization by anti-roll passive tanks. Ocean Eng. 2001, 28, 457–469. [Google Scholar] [CrossRef]
- Moaleji, R.; Greig, A. On the development of ship anti-roll tanks. Ocean Eng. 2007, 34, 103–121. [Google Scholar] [CrossRef]
- Yang, S.; Zhu, W.; Tu, Y.; Cao, G.; Chen, X.; Du, Z.; Fan, J.; Huang, Y. Study on the influence of heave plate on energy capture performance of central pipe oscillating water column wave energy converter. Energy 2024, 312, 133517. [Google Scholar] [CrossRef]
- Guo, P.; Zhang, Y.; Chen, W. Numerical analysis on a self-rectifying impulse turbine with U-shaped duct for oscillating water column wave energy conversion. Energy 2023, 274, 127359. [Google Scholar] [CrossRef]
- Licheri, F.; Ghisu, T.; Cambuli, F.; Puddu, P. Experimental reconstruction of the local flow field in a Wells turbine using a three-dimensional pressure probe. Energy 2024, 296, 131062. [Google Scholar] [CrossRef]
- Gato, L.M.C.; Maduro, A.R.; Carrelhas, A.A.D.; Henriques, J.C.C.; Ferreira, D.N. Performance improvement of the biradial self-rectifying impulse air-turbine for wave energy conversion by multi-row guide vanes: Design and experimental results. Energy 2021, 216, 119110. [Google Scholar] [CrossRef]
- Wang, C.; Zhang, Y. Numerical investigation on the wave power extraction for a 3D dual-chamber oscillating water column system composed of two closely connected circular sub-units. Appl. Energy 2021, 295, 117009. [Google Scholar] [CrossRef]
- Fleming, A.; Macfarlane, G. In-situ orifice calibration for reversing oscillating flow and improved performance prediction for oscillating water column model test experiments. Int. J. Mar. Energy 2017, 17, 147–155. [Google Scholar] [CrossRef]
- ANSYS. ANSYS Fluent Theory Guide 17.2; ANSYS: Canonsburg, PA, USA, 2016. [Google Scholar]
- Sheng, W.; Alcorn, R.; Lewis, A.W. Primary wave energy conversions of oscillating water columns. In Proceedings of the 10th European Wave and Tidal Energy Conference, Aalborg, Denmark, 2–5 September 2013. [Google Scholar]
- Adibzade, M.; Akbari, H. Fully spectral approach to evaluate the performance of floating wave energy converters in directional complex sea states. Ocean Eng. 2024, 306, 117999. [Google Scholar] [CrossRef]
- Zheng, C.; Li, X.; Sun, C.; Su, S.; Chen, X. In Meticulous Simulation of Seasonal Characteristics of the China Sea Wave Period. Adv. Mar. Sci. 2014, 1, 44–49. [Google Scholar] [CrossRef]
- Wan, Y.; Zhang, J.; Meng, J.M.; Wang, J. A wave energy resource assessment in the China’s seas based on multi-satellite merged radar altimeter data. Acta Oceanol. Sin. 2015, 34, 115–124. [Google Scholar] [CrossRef]
- Youn, D.H.; Choi, L.K.; Kim, J. Motion Response Characteristics of Small Fishing Vessels of Different Sizes among Regular Waves. J. Ocean. Eng. Technol. 2023, 37, 1–7. [Google Scholar] [CrossRef]
- Yu, T.; He, S.; Shi, H.; Chen, X.; Guo, Q. Numerical investigation of hydrodynamic performance and efficiency of a dual-chamber oscillating water column under different damping and chamber breadth ratio combination. Ocean Eng. 2022, 266, 113008. [Google Scholar] [CrossRef]

| L(1100) | L(1200) | L(1300) | L(1400) | |
|---|---|---|---|---|
| Device length (mm) | 1100 | 1200 | 1300 | 1400 |
| Cross-sectional area of the air chamber exit passage (m2) | 0.00699 | 0.00699 | 0.00699 | 0.00699 |
| Maximum aerodynamic power (W) | 5.7 | 10.4 | 17.4 | 26.8 |
| W(800) | W(1000) | W(1200) | W(1400) | |
|---|---|---|---|---|
| Device width (mm) | 800 | 1000 | 1200 | 1400 |
| Cross-sectional area of the air chamber exit passage (m2) | 0.00478 | 0.00599 | 0.00717 | 0.00839 |
| Maximum aerodynamic power (W) | 14.2 | 19.9 | 24 | 27.6 |
| H(200) | H(300) | H(400) | H(500) | |
|---|---|---|---|---|
| Device height (mm) | 200 | 300 | 400 | 500 |
| Cross-sectional area of the air chamber exit passage (m2) | 0.00839 | 0.00839 | 0.00839 | 0.00839 |
| Maximum aerodynamic power (W) | 27.4 | 27.6 | 26 | 27.4 |
| T(300) | T(400) | T(500) | T(600) | |
|---|---|---|---|---|
| Device passage width (mm) | 300 | 400 | 500 | 600 |
| Cross-sectional area of the air chamber exit passage (m2) | 0.00418 | 0.00559 | 0.00699 | 0.00839 |
| Maximum aerodynamic power (W) | 27.6 | 32 | 26.8 | 25.4 |
| D(100) | D(200) | D(300) | D(400) | |
|---|---|---|---|---|
| Bottom channel height (mm) | 100 | 200 | 300 | 400 |
| Cross-sectional area of the air chamber exit passage (m2) | 0.00559 | 0.00559 | 0.00559 | 0.00559 |
| Maximum aerodynamic power (W) | 40 | 34 | 30 | 28 |
| Deg(10) | Deg(5) | |
|---|---|---|
| Sloshing angle (°) | 10 | 5 |
| Cross-sectional area of the air chamber exit passage (m2) | 0.00559 | 0.00559 |
| Maximum aerodynamic power (W) | 40 | 13.4 |
Disclaimer/Publisher’s Note: The statements, opinions and data contained in all publications are solely those of the individual author(s) and contributor(s) and not of MDPI and/or the editor(s). MDPI and/or the editor(s) disclaim responsibility for any injury to people or property resulting from any ideas, methods, instructions or products referred to in the content. |
© 2025 by the authors. Licensee MDPI, Basel, Switzerland. This article is an open access article distributed under the terms and conditions of the Creative Commons Attribution (CC BY) license (https://creativecommons.org/licenses/by/4.0/).
Share and Cite
Yang, S.; Li, H.; Huang, Y.; Fan, J.; Du, Z.; Tu, Y.; Li, C.; Lin, B. Research and Simulation Analysis on a Novel U-Tube Type Dual-Chamber Oscillating Water Column Wave Energy Conversion Device. Energies 2025, 18, 4141. https://doi.org/10.3390/en18154141
Yang S, Li H, Huang Y, Fan J, Du Z, Tu Y, Li C, Lin B. Research and Simulation Analysis on a Novel U-Tube Type Dual-Chamber Oscillating Water Column Wave Energy Conversion Device. Energies. 2025; 18(15):4141. https://doi.org/10.3390/en18154141
Chicago/Turabian StyleYang, Shaohui, Haijian Li, Yan Huang, Jianyu Fan, Zhichang Du, Yongqiang Tu, Chenglong Li, and Beichen Lin. 2025. "Research and Simulation Analysis on a Novel U-Tube Type Dual-Chamber Oscillating Water Column Wave Energy Conversion Device" Energies 18, no. 15: 4141. https://doi.org/10.3390/en18154141
APA StyleYang, S., Li, H., Huang, Y., Fan, J., Du, Z., Tu, Y., Li, C., & Lin, B. (2025). Research and Simulation Analysis on a Novel U-Tube Type Dual-Chamber Oscillating Water Column Wave Energy Conversion Device. Energies, 18(15), 4141. https://doi.org/10.3390/en18154141