Article

A New Criterion for Transformer Excitation Inrush Current Identification Based on the Wasserstein Distance Algorithm

1
National Virtual Simulation Experiment Centre for Electrical Engineering, China Three Gorges University, Yichang 443002, China
2
Super High Voltage Company of State Grid Hubei Electric Power Co., Ltd., Wuhan 430050, China
*
Author to whom correspondence should be addressed.
Energies 2025, 18(14), 3872; https://doi.org/10.3390/en18143872
Submission received: 11 June 2025 / Revised: 7 July 2025 / Accepted: 14 July 2025 / Published: 21 July 2025

Abstract

To circumvent the computational bottlenecks associated with the intermediate steps (e.g., least squares fitting) in conventional sine wave similarity principles and directly acquire the energy metrics required for stabilized sinusoidal waveform characterization, this study leverages time domain probability distribution theory. From a complementary advantage perspective, a novel transformer inrush current identification criterion is developed using the Wasserstein distance metric. The methodology employs feature discretization to extract target/template signals, transforming them into state vectors for sample labelling. By quantifying inter-signal energy distribution disparities through this framework, it achieves a precise waveform similarity assessment in sinusoidal regimes. The theoretical analysis and simulations demonstrate that the approach eliminates frequency domain computations while maintaining implementation simplicity. Compared with conventional sine wave similarity methods, the solution streamlines protection logic and significantly enhances practical applicability with accelerated response times. Furthermore, tests conducted on field-recorded circuit breaker closing waveforms using MATLAB R2022a confirm the effectiveness of the proposed method in improving transformer protection performance.

1. Introduction

As the main source of unbalanced current in a transformer differential circuit, excitation inrush current must be countered. Therefore, the prevention of differential protection misoperation caused by excitation inrush current is still one of the most important research topics of transformer main protection [1,2,3].
At present, the second harmonic braking principle is commonly used in engineering [4,5], but due to the great dispersion of the second harmonic components of different phases, to ensure that the differential protection does not operate incorrectly during the transformer idle period, it usually adopts the single-phase braking, three-phase, or gate braking method. Although this reduces the probability of the excitation inrush current causing the differential protection to malfunction, in the case of the inrush current and fault current at the same time, the protection has the risk of false blocking, which may lead to a prolonged opening time of the differential element [6,7]. In order to improve the reliability and sensitivity of transformer differential protection, previous studies [8,9,10,11] proposed that the voltage quantity can make the collected information more comprehensive, which is conducive to the protection of comprehensive research and judgement. Previous studies [12,13] analysed the differences in waveform sinusoidality according to the initial 3~4 points using the least squares method to fit the standard sine wave, and then used the correlation analysis method to comprehensively characterize the degree of current distortion. A previous study [14,15] highlighted that when using differential filtering means to remove the non-periodic components at the same time, this will have an amplifying effect on the high-frequency components in the current waveform, which will increase the risk of the failure of the former on the template prediction. Based on another study [16], to ensure the effectiveness and accuracy of the template prediction, additional algorithms are required for the complete circumferential current data to correctly extract the effective data segments in the non-saturated region, which results in a long protection action time, and therefore it is more difficult to further improve the fast-acting nature of the protection [17,18,19]. If the template can be fixed in a certain way, the introduction of intermediate links, such as the least squares method, can be eliminated. In this way, the computational burden of intelligent electronic devices can be greatly reduced, reducing the data processing delay and thus improving the performance of microcomputer protection.
To cope with the above problems, the combination of probabilistic statistical class algorithms can avoid the introduction of intermediate links and can be characterized by a data window down to 10 ms [20,21]. It is also known from the correlation analysis method in the sinusoidal similarity principle that the desired second harmonic components through the Fourier transform do not need to be obtained, so it is more resistant to the influence of harmonics [22,23,24]. Therefore, in order to further reduce the length of the data window, the advantages of both can be combined if the probability density function is selected as the input to the distance algorithm.
In summary, based on the advantages of sinusoidal homology–probability space synergy, this paper introduces the Wasserstein distance and combines the absolute value processing for the matching operation of the energy distribution, which more reasonably reflects the multiple characteristics of the excitation inrush current, and constructs a set of inrush current blocking schemes that take into account the quick motion and high reliability. Finally, the effectiveness of this scheme is verified by simulation on the PSCAD/EMTDC platform.

2. Fundamental Principle

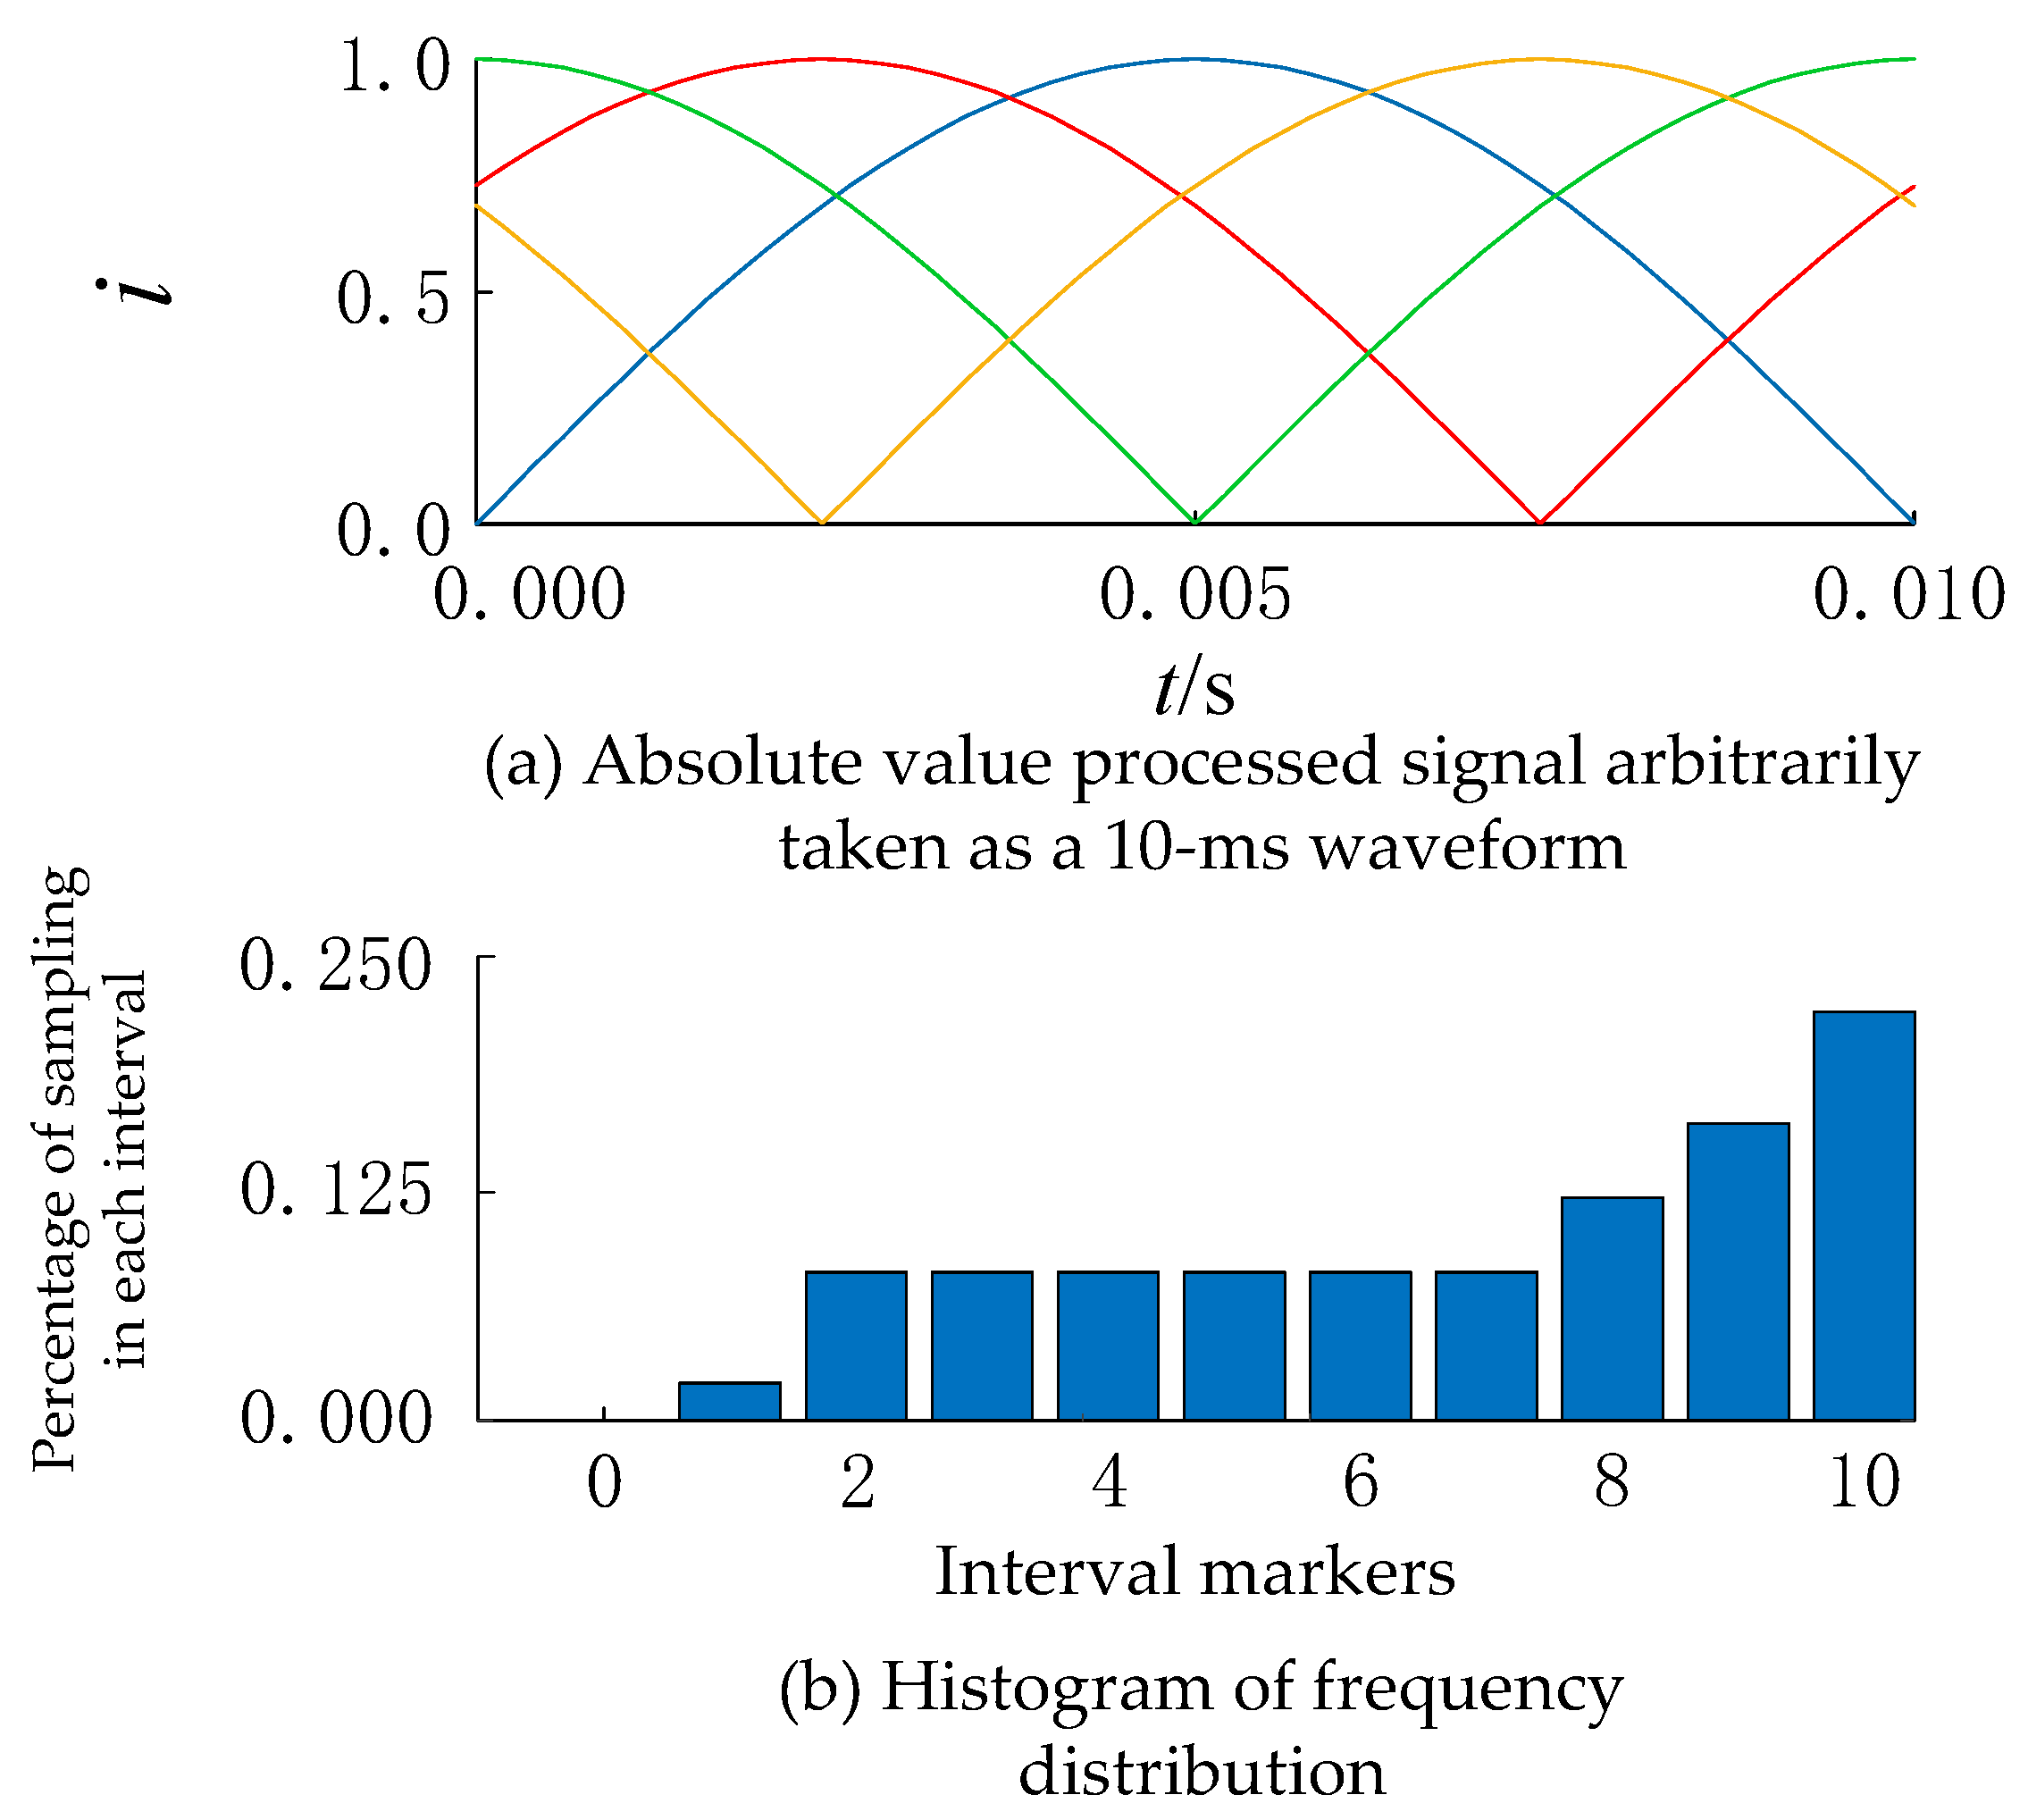
2.1. Histogram of the Frequency Distribution of Half-Cycle Fault Current

The degree of time domain similarity between two sets of current waveforms is related to both the amplitude and phase of the signals. In general, two sets of current waveforms with identical morphologies can be considered not to be perfectly correlated as long as their phases are different. For example, if the phase of the sine and cosine signals differ by 90°, and the vectors corresponding to them are perfectly orthogonal, the Pearson correlation coefficient between them is not 1, but the two sets of signals are homologous (identical) [25].
Under the ideal sampling signal, the half cycle sine waveforms at 0°, 90°, 180°, and 270° are shown in Figure 1a (the current in the figure is the per unit value). The standard sinusoidal waveform after absolute value processing is equivalent to the open square of the current energy, which still has the cyclic smooth characteristic under the action of the second-order or higher-order statistics. In order to more intuitively show the energy distribution of the current signal, from the perspective of the frequency distribution histogram, as can be seen in Figure 1b, the signal that arbitrarily intercepted a 10 ms data window probability distribution (energy information) is largely the same.
Therefore, the sine waveform may be regarded as a vibration signal, assuming that the excitation source is unknown and the phase has no corresponding physical significance, using the geometric fact that the absolute value-processed sine waveform still has a cyclic smooth characteristic, and preparing in advance a half-period standard sinusoidal template of any initial phase (with the same sampling rate as that in the field, which also has a cyclic smooth characteristic), the fixing of the template can be accomplished. This method avoids the problem of introducing intermediate links, and at the same time, significantly improves the rapidity of the protection.

2.2. Histogram of Frequency Distribution of Half-Cycle Excitation Inrush Current

The histogram of the excitation inrush half-cycle waveform and its frequency distribution is shown in Figure 2, and it can be seen that the sampling value of more partitions accounts for a very low percentage, which forms a big difference with the frequency distribution of the half-cycle sinusoidal waveform.
Therefore, the cyclic smooth characteristics of the signal can be used while combining the classical related ideas, and the phase trend can be fully integrated into the similarity of the discrimination process. Then, through the appropriate threshold value, the signal other than the template will be regarded as the interference source, so as to complete the target signal sorting purpose. Based on this, the periodicity and smooth transition characteristics of the current waveform provide a good analysis environment for the distance algorithm based on probability statistics.
In summary, it is clear from the relevant theory that the degree of irregularity of the template is equivalent to whether the distribution is uniform or not reflected in the signal. If the calculated W value is close to 0, it means that the signal is less irregular, i.e., the fewer aberrant components it contains, and the closer it is to the template sinusoidal waveform; otherwise, it indicates that there are more distorted components, which means that the signal is more irregular and farther away from the set template. Therefore, the Wasserstein distance combined with absolute value processing can be used to characterize the uncertainty of the energy distribution of the current waveform relative to the template signal to effectively analyze and identify the type of current signal.

3. Wasserstein Distance Calculation

3.1. Wasserstein Distance

The Wasserstein distance comes from optimal transmission theory. If two probability distributions, P r and P g , exist then their Wasserstein distance on the probability space is defined as follows [26]:
W ( P , Q ) = inf γ Π ( P r ,   Q g ) γ ( x , y ) d ( x , y ) d x d y
where ( P r , P g ) is the set of all possible joint distributions with P r and P g as the marginal distributions; E denotes the expected distance of the joint distributions; in all joint distributions of γ, inf denotes the lower definitive bound of the expected distance; and W is the Wasserstein distance between the two distributions.
The Wasserstein distance has gradually replaced traditional distance algorithms in recent years, and has been widely used in various similarity-related technical processing scenarios, such as image matching [27,28], bearing diagnosis [29,30], and bad data identification [31,32], but has not yet been seen to be applied in the field of relay protection. Given the successful application of the Wasserstein distance in the aforementioned high-dimensional scenarios, this paper will explore the idea of using the algorithm to process one-dimensional current data for transformer excitation inrush identification.

3.2. Discretization Solution

(1)
Matrix form
After analyzing the implications term by term, and then restating the problem in full, Equation (1) is actually solving for the minimum value of Equation (2) as follows:
γ ( x , y ) d ( x , y ) d x d y
where d(x, y) is taken to x y 1 in this paper, and this minimum is subject to the following constraints:
γ ( x , y ) d y = p ( x ) γ ( x , y ) d x = q ( y ) γ ( x , y ) 0
Whereas integration is just another form of expression for limit summation, it is useful to describe γ(x,y) and d(x,y) abstractly discretized and viewed as vectors Γ and D.
Γ = γ x 1 , y 1 γ x 1 , y 2 γ x 2 , y 1 γ x 2 , y 2 γ x n , y 1 γ x n , y 2 , D = d x 1 , y 1 d x 1 , y 2 d x 2 , y 1 d x 2 , y 2 d x n , y 1 d x n , y 2
Therefore, Equation (2) is transformed into the summation of element-wise multiplication between Γ and D, expressed as the inner product <Γ, D>. Similarly, by treating p(x) and q(x) as concatenated column vectors, the constraint condition (3) can be written in matrix form as = b.
1 1 0 0 0 1 0 0 0 1 0 1 0 1 0 0 0 0 0 0 1 0 1 0 A γ x 1 , y 1 γ x 1 , y 2 γ x 2 , y 1 ¯ γ x 2 , y 2 γ x n , y 1 γ x n , y 2   Γ = p x 1 p x 2 p x n q y 1 q y 2 q y n b
(2)
Linear programming
Ultimately, Equation (1) is transformed into the following:
min Γ { Γ ,   D A Γ = b   ,   Γ 0 }
It can be seen that although the original problem is sufficiently complex, it is essentially a linear programming problem that is not difficult to understand after the rewriting of the abstract discretization.
(3)
Pairwise form
Equation (1) is defined based on two continuous distributions, and the distribution used is not simply its probability distribution but the joint probability distribution between the two. Obviously, it is inappropriate to use it directly for practical metrics because we cannot find the analytical solution of the joint probability distribution of any two sets. It can only be derived in a different way. Since it is very difficult to directly use it to calculate the Wasserstein distance between any two distributions, based on the Kantorovich–Rubinstein pairwise principle, it can be equivalently transformed into the optimal transmission problem in linear programming, so that the Wasserstein distance can be directly calculated for any two discrete data sample sets [33,34,35].
Taking phase A as an example, the two sets of current sample data are shown as follows:
S 1 a = I s a 1 1 , I s a 1 2 , , I s a 1 m S 2 a = I s a 2 1 , I s a 2 2 , , I s a 2 n
where S 1 a data length is m; S 2 a data length is n.
Intuitively, we can understand S 1 a and S 2 a as two mounds: the mound S 1 a has m pits, and the soil inside the i-th pit is I sa 1 i (i = 1, 2, …, m), and the mound S 2 a has n pits, and the soil inside the j-th pit is I sa 2 j (j = 1, 2,…, n), then the distance from the i-th mound of S 1 a to the j-th mound of S 2 a is as follows:
d i j = | i j | ( i = 1 , 2 , , m   ;   j = 1 , 2 , , n )
Now it is necessary to transfer the mound S 1 a to mound S 2 a and it is necessary to transfer f i j units of earth from the i-th mound of S 1 a to the j-th mound of S 2 a , while the amount of work required for the transfer is f ij | i j | . Extending to all values of i and j, the minimum amount of work required to transfer the mound S 1 a to mound S 2 a divided by the amount of soil transferred for all combinations of paths is the Wasserstein distance.
Then the objective function is as follows:
F work = min m i = 1 n j = 1 d i j f i j
The constraints are as follows:
f i j 0 ,   i = 1 n f i j I s a 1 i ,   j = 1 m f i j I s a 2 j
Solving to obtain f ij , the Wasserstein distance is as follows:
W = m i = 1 n j = 1 d i j f i j m i = 1 n j = 1 f i j
Applying the above feature discretization to solve for the Wasserstein distance between the absolute value-processed differential currents and the template currents allows for a real-time measure of sinusoidal similarity for all current samples to be analyzed. The method has the advantage of facilitating subsequent excitation inrush and fault current discrimination work.

4. Protection Programme

4.1. Specific Steps

The transformer excitation inrush identification method using the Wasserstein distance discretizes the continuous probability distribution features and asymptotically solves the Wasserstein distance directly based on the sampled values. By finding the minimum expected distance of the set of target scenes that satisfy the set of conditions, the homologous scene that is highly similar to the template signal can be found. The specific recognition algorithm steps are as follows:
(1)
Selection of data window length: There is no current data before the transformer no-load closing. If we want to improve the action speed of the protection, it is inevitable to shorten the length of the data window, so in this paper, we take a half-cycle sliding window to deal with the current data.
(2)
Setting startup current: In order to avoid the algorithm calculating all the current data, it is necessary to set the startup current; if it exceeds, it will be judged that the differential current threshold oversteps the limit, and the algorithm starts.
(3)
Difference amplification principle: According to the sequence of the mutated differential current obtained in step (2), the proposed algorithm is used to calculate the corresponding W value, and then, according to reference [36], for the two-take-one target classification, a statistical formula is adopted to substitute the W value as a presumed object into Equation (12) to further amplify the numerical difference between the excitation inrush current and the fault current, so as to facilitate the threshold setting as follows:
W S = std W i d ( t ) , i m ( t ) 1 std W i d ( t ) , i m ( t )
where i d t is the absolute value-processed differential current and i m t is the template current; std is the standard deviation of the sequence of W values within the sliding window; and W S is the differentiation index, defined as the restraint value.
For each current sample in the sliding window, if it is normal fault current data, the calculated W value will be 0 and remain unchanged, so the W S value is almost 0. However, if the differential current is not a fault current, the W value will be large at this time, and the denominator of the corresponding Equation (7) becomes smaller, and the W S value is subsequently increased. As a result, the integrating space of the threshold value is increased, the possibility of fault current misjudgment is reduced, and the difficulty of classification of the target feature is greatly reduced.

4.2. Determination of Threshold

Since the algorithm proposed in this paper naturally comes with a normalization function, the value of W ranges from [0, 1], then the value of Equation (8) theoretically ranges from [0, +∞), and as can be seen in Section 3.1, the value of W S of the normal fault current is almost 0. Therefore, an identification threshold ε can be set to quantify the degree of distortion of the waveform as a way of identifying the excitation inrush current, and the criterion can be obtained as follows:
W S ε , t h e   c u r r e n t   i n   t h e   s l i d i n g   w i n d o w   i s   a n   e x c i t a t i o n   i n r u s h   c u r r e n t . W S < ε , t h e   c u r r e n t   i n   t h e   s l i d i n g   w i n d o w   i s   a   f a u l t   c u r r e n t .
Through a large number of simulation test results, ε can be selected in the range of 0.1–0.25. However, taking into account the current transformer saturation, measurement error and non-periodic components, and other factors, this paper ensures that the fault condition does not refuse to act. In order to ensure that the protection does not refuse to operate in case of faults and to prevent protection misoperation caused by inrush current to the maximum extent possible, ε is taken as 0.2. The overall implementation of the algorithm is shown in Figure 3.

5. Simulation Tests

An infinity system is used for modelling and simulation, as shown in Figure 4, which consists of an infinity power supply, a single-circuit transmission line, a transformer, and an electrical load. The sampling frequency is set to 4000 Hz, i.e., 80 points are sampled per weekly wave. In the following experiments, simulation tests are carried out on transformer no-load closing at normal time, no-load closing at internal fault, internal ground fault during operation, and current transformer saturation. The extracted currents under different operating conditions are recorded, and a series of values such as W , W S , etc. are calculated using MATLAB to obtain the restraint value under different operating conditions. The simulation results are all based on the A phase as an example, and the current waveforms are normalized.

5.1. Normal No-Load Closing

When the transformer is closed at normal no-load situation, the inrush current waveform and the corresponding W S braking value are measured and shown in Figure 5. It can be seen that the overall fluctuation amplitude of the unidirectional excitation inrush current W S braking value is larger than the symmetrical excitation inrush current, and its lower envelope shows a more obvious upward trend. The results confirm that the sine difference of unidirectional excitation inrush current is greater, and the degree of waveform distortion is more severe than that of symmetrical excitation inrush current. It can be seen that, regardless of unidirectional or symmetrical excitation inrush current, both of the W S brake values are greater than the threshold value, so the protection can be reliably blocked after 10 ms.

5.2. Transformer Internal Ground Faults in Operation

When an internal three-phase ground fault occurs on the Δ side of the transformer, it can be seen from Figure 6a that the fault current exhibits a typical sinusoidal characteristic. This algorithm is based on the idea of sinusoidal similarity, so the W S value is very close to 0, as shown in Figure 6b. Therefore, this criterion only needs 10 ms recognition time, and the protection then correctly issues a trip command.

5.3. Closing on Minor Turn-to-Turn Short-Circuit Faults

No-load inputs in the field are generally in the form of fault currents (no-load input transformer turn-to-turn faults), which are less likely to produce excitation inrush currents (slightly less than one-third), but still need to be guarded against. The analysis is as follows: when putting a transformer with a slight inter-turn fault at no load, the loss of main flux in the core is relatively small because the fault is not serious. Similar to the case of closing on a lossless transformer, the flux cannot change abruptly, so it is still possible to generate a considerable excitation inrush current content during a minor turn-to-turn fault. However, at this time, the main magnetic flux has been lost compared with the intact transformer, so the chance of excitation inrush is not too great, and even if it occurs, the inrush characteristics are not too typical.
Figure 7a shows the differential current waveform of no-load closing at the transformer ∆-side phase A with 5% inter-turn faults, where fault current and excitation inrush current exist simultaneously because the fault severity is not high. It is not difficult to find that the W S restraint value by the excitation inrush current distortion characteristics of the additive, from the initial period away from the threshold value, is very close. However, since the fault current does not decay, as long as the inrush current is slightly attenuated, the sinusoidal similarity of the phase current will rise greatly, and the differential protection can act after a short delay. Therefore, the split-phase blocking principle can be used, as shown in Figure 7b, and the protection can be opened with a delay of about 11 ms in this case. As for the second harmonic braking principle, as shown in Figure A1 in the Appendix A, the delay is about 310 ms to open the protection, and the proposed criterion in this paper produces a significant improvement in the opening speed.

5.4. Current Transformer Saturation During No-Load Closing

For the case where the excitation inrush is accompanied by CT saturation, the development of the inrush spike feature is further exacerbated by the backcharging of the secondary-side current due to the storage of magnetic energy, as shown in Figure 8a, resulting in a severe weakening of the amplitude feature. Compared with the CT is not saturated, as shown in Figure 8b, the W S restraint value decreases. However, its overall lower envelope still shows a clear upward trend. It can be seen that the W S restraint value capacity is stable above the braking threshold, and the protection will not be activated incorrectly.

5.5. Current Transformer Saturation During Internal Ground Faults

After CT saturation occurs, as shown in Figure 9a, the secondary side currents have a more serious ‘clipping phenomenon’, but the phases are still approximately the same, and fully meet the cyclic smooth characteristics of the signal. Therefore, this algorithm makes use of the phase constraint idea of probability distance and suppresses the overall amplitude difference according to the global concept, so that the fault differential current in the area under CT saturation still maintains high sinusoidal homologous characteristics. As shown in Figure 9b, the method does not affect the correct operation of the protection.

5.6. Severe Internal Faults

The occurrence of a severe internal fault within the transformer area is distinguished from the situation when no-load is put into a minor turn-to-turn fault, which does not contain an excitation inrush. As shown in Figure 10a, it contains not only non-periodic components, but also resonances caused by inductance and capacitance, which will lead to an elevation of the second harmonic in the differential current.
The fundamental frequency part of the short-circuit current signal spectrum is dominant, and the overall properties in the time domain still exhibit strong periodicity. Therefore, the redundancy of its spectrum and the nature of the cyclic frequency set can be exploited. By correlating the energy densities of the template signals with each other, the co-band interference of other different cyclic frequencies is avoided to a large extent, thus greatly improving the signal-to-noise ratio of the observed signals. As shown in Figure 10b, 10 ms after the fault occurrence, the calculated first W S restraint value is below the rectification threshold, and the protection is open to action. Therefore, the proposed criterion in this paper is highly adaptable to the effect of harmonics. Compared with the second harmonic braking principle, as shown in Figure A2 in the Appendix A, the 15% rectification value can no longer meet the needs in this scenario, and the protection has to be delayed for a long time before exporting the action, which brings some difficulties to the rectification of the braking ratio.

6. Algorithm Comparison

6.1. Traditional Second Harmonic Restraint Principle

Under the same simulation model, extensive simulations of various transformer fault scenarios were conducted to compare the proposed algorithm with the traditional second harmonic restraint principle. As evidenced in Table 1, while the traditional second harmonic criterion enables rapid decision-making in most cases, it exhibits a prolonged restraint time for interturn faults and energizing on pre-existing faults. In contrast, the proposed algorithm enables protection operation within a significantly shorter timeframe. For instance, during energizing on a minor interturn fault, the second harmonic restraint scheme requires 310 ms to operate, whereas the proposed criterion reduces this time by approximately 299 ms compared with the second harmonic method.

6.2. Comparison of Probabilistic Distance Algorithms

With advancing research, an increasing number of novel algorithms have enriched the protection algorithm repository. It is essential to conduct a comparative analysis of two recently emerged probabilistic distance algorithms to fully demonstrate the advantages of our proposed method. (Both algorithms can employ fixed templates under 10 ms data windows, thus, maintaining data window consistency with this study is critical for highlighting their distinctions).
K L ( P Q ) = p ( x ) log p ( x ) q ( y ) d x
Strictly speaking, the Kullback–Leibler (KL) divergence does not belong to the category of distance metrics because it fails to satisfy symmetry. Observing Equation (14) reveals that swapping signals P and Q produces diametrically different results unless their distributions are identical. This occurs because the template signal’s data points fully occupy the data window, whereas inrush currents exhibit globally smaller probability distributions due to discontinuity angles. Therefore, designating signal Q as the template would force p(x)/q(y) < 1, rendering the results meaningless. Consequently, during KL divergence simulations, signal Q must be designated as the target identification signal.
The selection of this solution direction ensures numerical correctness. As shown in Figure 11, the blue waveform represents the braking quantity under KL algorithm, and the red line represents the threshold. The results are entirely meaningful, yet they fail to distinguish between inrush currents and fault differential currents under identical conditions. This occurs because the logarithm is a monotonically increasing function, and its derivative reveals strong nonlinear compression effects on signal growth. Consequently, when the discontinuity angles of inrush currents are covered by the data window, such differences are overlooked by KL divergence and cannot be accurately reflected. Therefore, Reference [37] adopts a 1/10-cycle data window where p(x)/q(y) approaches 1/0 when differential currents are at a dead angle. At this point, the logarithm’s argument tends toward infinity, thereby extremely amplifying differences. This causes obvious serrated phenomena in KL operating quantities, generating numerous extreme value clusters that complicate threshold setting. To mitigate the adverse effects of extreme value clusters on setting, the solution additionally introduces variance calculation algorithms with intra-window normalization. Evidently, the supplementary algorithms fail to achieve the expected results: extreme value clusters persist with only quantitative reduction rather than complete elimination. Thus, its operating trajectory remains obscured by serrated phenomena, making patterns difficult to discern. Situations where “serrations” fall within operating zones remain entirely possible. Consequently, this method’s reliability requires further enhancement.
B C ( P , Q ) = p ( x ) q ( x )
In the equation, BC is termed the Bhattacharyya coefficient, with 0 ≤ BC ≤ 1.
The Bhattacharyya distance avoids symmetry issues but requires probability extraction from discrete samples via histogram techniques prior to definition. Similar to KL divergence, the Bhattacharyya coefficient suffers from significantly degraded discrimination effectiveness when distributions exhibit a high overlap (as shown in Figure 12, the blue waveform represents the braking quantity under BC algorithm, and the red line represents the threshold), except when distributions are identical. Specifically, the Bhattacharyya coefficient increases when:
(i)
Corresponding bins contain overlapping samples from both distributions.
(ii)
Bins encompass large overlapping sample regions.
This critically affects inrush currents whose probability distributions become entirely enveloped by template distributions, causing the overestimation of overlapping regions and the loss of selectivity [38]. Consequently, data windows must be shortened to create probability voids in discontinuous sections—forming window depressions that reduce BC values. While this enhances signal search capability through narrowed target ranges and corrects differential feedback, it introduces extensive numerical fluctuations from truncated windows, mirroring the reliability issues observed in KL divergence.
The window length selection for both aforementioned methods, based on the discontinuity angle characteristics of typical waveforms, is readily comprehensible. In scenarios where discontinuity angles vanish, although the discontinuous sections at sliding window transitions remain continuous, they still cannot alter the deformation caused by distribution inconsistencies on both sides. Consequently, shortening data windows enables the more effective utilization of discontinuity angle information without being entirely constrained by their disappearance, thus exhibiting anti-CT-saturation capability. Additionally, truncated windows disrupt the periodic stationarity of template sinusoidal signals, preventing fixed template operations. Both methods therefore employ least squares fitting to dynamically generate standard sine wave functions.
In summary, the stability of operating quantities is intrinsically linked to criterion setting and protection reliability. The demonstrated stability and monotonic boundedness of the Wasserstein distance are remarkable—transcending simplistic point-to-point probability correspondence. This complex process fundamentally represents the infimum of expected sets for joint probability distributions of observed phenomena, interconnecting analyzed entities through probability spaces to jointly interpret evolutionary trends and progressive logic. Consequently, it embodies all of the advantages of conventional time domain signal similarity metrics.

7. Recorded Wave Signal Analysis

The closing waveforms in real engineering are usually accompanied by the existence of non-periodic components. In order to verify the adaptability of the scheme proposed in this paper in engineering practice, the field test-recorded waveform data are used for testing and analysis. The recorded waveform data is captured by the online monitoring terminal at the site, and the signal sampling frequency is 4 kHz, which is imported into MATLAB R2022a for display, and the waveform is shown in Figure 13a.
As shown in Figure 13b, the restraint value W S is rapidly larger than the threshold value after no-load closing. Even in the case of the C phase differential current containing a certain non-periodic component, the protection can be reliably blocked, thus proving the broad application prospects of this scheme in engineering practice.
In summary, the organic combination of sinusoidal similarity theory and probability distribution is similar to the grey-scale-based matching calculation in the field of image recognition, which effectively integrates the advantages of both. Therefore, the proposed algorithm has a strict theoretical foundation of digital signal analysis and is a feasible scheme for excitation inrush identification.
The above simulation results show that the scheme proposed in this paper can quickly distinguish the internal fault current and the excitation inrush current, and at the same time (taking into account the effects of current transformer saturation, measurement error, and non-periodic component, etc.), it ensures that the protection does not refuse to operate under fault conditions, and prevents the protection malfunction caused by the excitation inrush current to the maximum extent. It provides a useful theoretical supplement for improving the performance of transformer differential protection and promoting the application of the sinusoidal similarity principle.

8. Conclusions

In this paper, starting from the application of the sinusoidal similarity principle in the identification of transformer excitation inrush current, the one-dimensional time series of the probability density function is selected as the input of the distance algorithm, and the inrush current blocking scheme based on the sinusoidal homology–probability space co-complementarity is proposed, the following research conclusions are drawn:
(1)
The proposed scheme skillfully combines the advantages of probabilistic statistical class algorithms and introduces absolute value processing into the fixing process of the standard template, thus dispensing with the structural delay problem caused by the traditional sinusoidal similarity principle that requires the intervention of the intermediate link, and greatly improves the protection of the speedy movement.
(2)
Fully exploiting the cyclic smoothness property of the template sinusoidal waveform, the joint classical correlation idea makes the algorithm have natural immunity to the phase of the unknown excitation source in the framework of a 10 ms data window.
(3)
The algorithm is based on the statistical concept of information metric means, which is only related to the energy distribution of the signal in the time domain within the sliding window, so the output result of the algorithm is less affected by harmonics, thus improving the practical adaptability of the criterion.
(4)
The self-normalization property of the probability-constrained amplitude is utilized, and the CT saturation resistance of the criterion is further improved by combining the principle of differential amplification, which makes the selection of the threshold value more reliable and independent of the absolute amplitude of the differential current.
The theoretical analysis and simulation results show that this method can quickly distinguish between internal fault current and excitation inrush current. Finally, the correctness of this method is further verified by the data calculation of field recordings, which provides a useful theoretical supplement for improving the performance of transformer differential protection and promoting the application of the sinusoidal similarity principle.
At the same time, we recognize that the novel low-loss amorphous alloy materials in large power transformers progressively lower the magnetic saturation points of transformer cores. When specific conditions align (core remanence, closing angle, etc.), the second harmonic content in three-phase inrush currents diminishes significantly, potentially falling below 15% across phases with the minimum phase ≤ 7%, corresponding to discontinuity angles < 30°. Under these extreme conditions, like most waveform-feature-based inrush restraint methods, our approach faces similar challenges and risks criterion failure. Current research focuses on replacing the Euclidean norm in the Wasserstein formulation with K-means centroid clustering to enhance manifold dimension reduction in state space auxiliary variables, aiming to identify such challenging inrush scenarios.

Author Contributions

Conceptualization, S.Z. and J.H.; methodology, S.Z.; software, Y.Z.; validation, S.Z., Y.Z., and Y.L.; formal analysis, S.Z.; investigation, S.Z.; resources, Y.Z.; data curation, S.Z.; writing—original draft preparation, S.Z.; writing—review and editing, S.Z.; visualization, Y.Z.; supervision, J.H.; project administration, Y.Z. All authors have read and agreed to the published version of the manuscript.

Funding

This work was supported by the National Natural Science Foundation of China, grant number 51877088.

Data Availability Statement

The original contributions presented in the study are included in the article. Further inquiries can be directed to the corresponding author.

Conflicts of Interest

Author Yuanning Zhang was employed by the company Super High Voltage Company of State Grid Hubei Electric Power Co., Ltd. The remaining authors declare that the research was conducted in the absence of any commercial or financial relationships that could be construed as a potential conflict of interest.

Appendix A

Figure A1. Second harmonic ratio when 5% inter-turn short fault is closed.
Energies 18 03872 g0a1
Figure A2. Second harmonic ratio under a serious internal grounding fault.
Energies 18 03872 g0a2

References

  1. Hu, S.; Jiang, Y.Q.; Huang, C.; Gao, Y.P. Excitation inrush identification method based on PWM waveform characteristics. Electr. Power Autom. Equip. 2018, 38, 135–140. [Google Scholar] [CrossRef]
  2. Tajdinian, M.; Samet, H.; Ali, Z.M. A Sub-Cycle phase angle distance measure algorithm for power transformer differential protection. Int. J. Electr. Power Energy Syst. 2022, 137, 107880. [Google Scholar] [CrossRef]
  3. Vidhya, R.; Ranjan, P.V.; Shanker, N.R. Transformer Internal and Inrush Current Fault Detection Using Machine Learning. Intell. Autom. Soft Comput. 2023, 36, 153–168. [Google Scholar] [CrossRef]
  4. Su, L.; He, J.N.; Xiong, J.H.; Lin, Z.X.; Hao, Z.G.; Man, Z.L. Identification of transformer excitation inrush and fault current based on waveform partition reconstruction. Power Syst. Clean Energy 2023, 39, 16–23, 32. [Google Scholar]
  5. Liu, P.H.; Jiao, B.H.; Guo, X.W. Identification of excitation inrush in power transformers considering CT saturation interference. Power Syst. Technol. 2022, 46, 3633–3641. [Google Scholar] [CrossRef]
  6. Mishra, P.; Swain, A.; Pradhan, A.K.; Bajpai, P. Sequence Current-Based Inrush Detection in High-Permeability Core Transformers. IEEE Trans. Instrum. Meas. 2023, 72, 1–9. [Google Scholar] [CrossRef]
  7. Long, Q.; Yang, X.; Xu, S.P.; Li, W.G.; Peng, X.; Yang, G.H.; Duan, X.Y.; Liao, M.F. A study on the identification of excitation inrush current of converter transformer based on circular coordinate characterization method. Power Syst. Prot. Control. 2025, 53, 118–129. [Google Scholar] [CrossRef]
  8. Tan, J.P. A new method for transformer excitation inrush identification based on flux trajectory characteristics. Electr. Power Autom. Equip. 2008, 28, 77–80. [Google Scholar]
  9. Moradi, A.; Madani, S.M. Predictive Formulas to Improve Transformer Protection During Inrush Current Using the Proposed DC Equivalent Circuit. IEEE Trans. Power Deliv. 2020, 35, 919–928. [Google Scholar] [CrossRef]
  10. Yan, J.P.; Hao, Z.G.; Zhang, B.H.; Shao, B.; Yu, A.B. Analysis of transformer protection principle based on voltage and current information. Electr. Power Autom. Equip. 2010, 30, 37–41. [Google Scholar]
  11. Ling, G.; Yao, W.X. A new method for calculating the circulating current in the delta side of Y/△ wiring transformer. Electr. Power Autom. Equip. 2015, 35, 157–162. [Google Scholar] [CrossRef]
  12. Weng, H.L.; Liu, H.; Lin, X.N.; Wan, Y.; Li, Z.X.; Huang, J.G.; Lu, J.S. A new criterion for transformer differential protection based on Hausdorff distance algorithm. Proc. CSEE 2018, 38, 475–483, 678. [Google Scholar] [CrossRef]
  13. Samet, H.; Ghanbari, T.; Ahmadi, M. An Auto-correlation Function Based Technique for Discrimination of Internal Fault and Magnetizing Inrush Current in Power Transformers. Electr. Power Compon. Syst. 2015, 43, 399–411. [Google Scholar] [CrossRef]
  14. Suonan, J.L.; Jiao, Z.B.; Zhang, Y.N.; Liu, W.T.; Liu, D. Fast identification algorithm for transformer excitation inrush based on waveform coefficients. Power Syst. Technol. 2006, 11, 71–76. [Google Scholar] [CrossRef]
  15. Etumi, A.A.A.; Anayi, F.J. Current signal processing-based methods to discriminate internal faults from magnetizing inrush current. Electr. Eng. 2021, 103, 743–751. [Google Scholar] [CrossRef]
  16. Bi, D.Q.; Zhang, X.A.; Yang, H.H.; Yu, G.W.; Wang, X.H.; Wang, W.J. Excitation inrush identification method based on waveform correlation analysis in unsaturated region. Autom. Electr. Syst. 2006, 16–20, 24. [Google Scholar]
  17. Li, L.; Du, H.J.; Liu, L.X.; Yao, T.T. Calculation of harmonic ratios to determine saturation of current transformers in busbar protection. Electr. Power Autom. Equip. 2003, 69–72. [Google Scholar]
  18. Hooshyar, A.; Sanaye-Pasand, M.; El-Saadany, E.F. CT Saturation Detection Based on Waveshape Properties of Current Difference Functions. IEEE Trans. Power Deliv. 2013, 28, 2254–2263. [Google Scholar] [CrossRef]
  19. You, B.X.; Bu, J.; Yin, M.H. Improved current transformer saturation identification based on instantaneous current features. Electr. Power Autom. Equip. 2018, 38, 29–35. [Google Scholar] [CrossRef]
  20. Zhang, Y.N.; Huang, J.G.; Zhang, Y.H.; Yu, N.; Chen, Y.; Weng, H.L.; Jia, Y.B.; Li, Z.X. Higher-order statistical principles for identifying transformer excitation inrush currents using dual eigenquantities. Power Syst. Prot. Control. 2021, 49, 21–30. [Google Scholar] [CrossRef]
  21. Wang, X.; Wang, Z.P. Transformer excitation inrush identification based on waveform time-domain distribution characteristics. Trans. China Electrotech. Soc. 2012, 27, 148–154. [Google Scholar] [CrossRef]
  22. Li, X.B.; Xiao, S.W.; Liu, W.S.; Zheng, T. Transformer current correlation protection scheme based on morphological filtering. Proc. CSEE 2006, 8–13. [Google Scholar]
  23. Jinpeng, W. A new algorithm of identifying magnetizing inrush current based on waveform sinusoidal correlation degree. In Proceedings of the 2017 Chinese Automation Congress (CAC), Jinan, China, 20–22 October 2017; pp. 3718–3722. [Google Scholar]
  24. Ma, J.; Wang, Z.P.; Xu, Y. A new method for identifying transformer excitation inrush and short-circuit currents using the correlation function principle. Power Syst. Technol. 2005, 78–81. [Google Scholar]
  25. Li, G.C.; Liu, W.S.; Liu, J.F.; Teng, L.; Liu, Y. A new principle for identifying transformer excitation inrush and short-circuit currents by waveform fitting method. Autom. Electr. Syst. 2001, 15–18. [Google Scholar]
  26. Kantorovich, L.V. Mathematical methods of organizing and planning production. Manag. Sci. 1960, 6, 36–422. [Google Scholar] [CrossRef]
  27. Schmitzer, B.; Schnörr, C. Globally Optimal Joint Image Segmentation and Shape Matching Based on Wasserstein Modes. J. Math. Imaging Vis. 2015, 52, 436–458. [Google Scholar] [CrossRef]
  28. Wang, D.W.; Li, Y.D. Insulator target detection based on WGAN image deblurring. Electr. Power Autom. Equip. 2020, 40, 188–198. [Google Scholar] [CrossRef]
  29. He, Q.; Tang, X.H.; Li, C.J.; Lu, J.G.; Chen, J.D. Bearing Fault Diagnosis with Small Sample Data under Load Imbalance. China Mech. Eng. 2021, 32, 1164–1171, 1180. [Google Scholar]
  30. Luo, P.E.; Yin, Z.G.; Yuan, D.S.; Gao, F.T.; Liu, J. An Intelligent Method for Early Motor Bearing Fault Diagnosis Based on Wasserstein Distance Generative Adversarial Networks Meta Learning. IEEE Trans. Instrum. Meas. 2023, 72, 1–11. [Google Scholar] [CrossRef]
  31. Zang, H.X.; Guo, J.W.; Huang, M.Y.; Wei, Z.N.; Sun, G.Q.; Zhao, J.W. Power system bad data identification based on improved Wasserstein generative adversarial network. Electr. Power Autom. Equip. 2022, 42, 50–56, 110. [Google Scholar] [CrossRef]
  32. Feng, G.; Lao, K.-W. Wasserstein adversarial learning for identification of power quality disturbances with incomplete data. IEEE Trans. Ind. Inform. 2023, 19, 10401–10411. [Google Scholar] [CrossRef]
  33. Villani, C. Topics in Optimal Transportation. AMS Grad. Stud. Math. 2003, 247–283. [Google Scholar]
  34. Xiao, X.Y.; Gui, L.Y.; Li, C.X.; Zhang, H.Y.; Li, H.X.; Wang, Q. Homologous Detection of Multiple Voltage Transient Events Based on Wasserstein Distance. Power Syst. Technol. 2020, 44, 4684–4693. [Google Scholar] [CrossRef]
  35. Li, W.; Liu, W.; Chen, J.; Wu, L.; Flynn, P.D.; Ding, W.; Chen, P. Reducing Mode Collapse with Monge-Kantorovich Optimal Transport for Generative Adversarial Networks. IEEE Trans Cybern 2024, 54, 4539–4552. [Google Scholar] [CrossRef]
  36. Ru, S.S.; Wang, J.L.; Pu, X.L. Advanced Mathematical Statistics; Higher Education Press: Beijing, China, 2006; pp. 35–36. [Google Scholar]
  37. Weng, H.L.; Chen, H.; Wan, Y.; Rao, D.Q.; Liu, H.; Li, Z.X.; Huang, J.G. A new criterion for identifying transformer excitation inrush current and fault differential current based on barotropic coefficient. Power Syst. Prot. Control. 2020, 48, 113–122. [Google Scholar] [CrossRef]
  38. Tajdinian, M.; Samet, H. Divergence Distance Based Index for Discriminating Inrush and Internal Fault Currents in Power Transformers. IEEE Trans. Ind. Electron. 2022, 69, 5287–5294. [Google Scholar] [CrossRef]
Figure 1. Half-cycle fault current waveforms and frequency distribution square diagram.
Energies 18 03872 g001
Figure 2. Half-cycle inrush current waveforms and frequency distribution square diagrams.
Energies 18 03872 g002
Figure 3. Flow chart of the protection criterion.
Energies 18 03872 g003
Figure 4. Simulation system model.
Energies 18 03872 g004
Figure 5. Inrush current waveforms and its W S values.
Energies 18 03872 g005
Figure 6. Current waveform under an internal grounding fault and its W S value.
Energies 18 03872 g006
Figure 7. Current waveform at no-load closing at 5% inter-turn short circuit fault and its W S value.
Energies 18 03872 g007
Figure 8. Current waveform under no-load closing with CT saturation and its W S value.
Energies 18 03872 g008
Figure 9. Current waveform under grounding internal fault with CT saturation and its W S value.
Energies 18 03872 g009
Figure 10. Current waveform under a serious internal grounding fault and its W S value.
Energies 18 03872 g010
Figure 11. Action trajectory of KL dispersion under typical waveforms.
Energies 18 03872 g011
Figure 12. Action trajectory of barotropic distance with typical waveforms.
Energies 18 03872 g012
Figure 13. Three-phase differential current waveforms under field wave recording data and its values.
Energies 18 03872 g013
Table 1. Comparison of Wasserstein algorithm and second harmonic criterion.
TypeSecond Harmonic RestraintWasserstein
Single-Phase Ground Fault22 ms10 ms
Double-Phase Ground Fault27 ms10 ms
Three-Phase Short Circuit30 ms10 ms
Phase-to-Phase Fault32 ms10 ms
Interturn Fault37 ms10 ms
Differential Current with Second Harmonic >15%Maloperation10 ms
Transformer EnergizingReliable restraintReliable restraint
Energizing on Phase-to-Phase Fault40 ms10 ms
Energizing on Three-Phase Ground Fault45 ms10 ms
Energizing on Interturn Fault310 ms11 ms
Disclaimer/Publisher’s Note: The statements, opinions and data contained in all publications are solely those of the individual author(s) and contributor(s) and not of MDPI and/or the editor(s). MDPI and/or the editor(s) disclaim responsibility for any injury to people or property resulting from any ideas, methods, instructions or products referred to in the content.

