Abstract
Road transport plays a significant role in the economic growth of a country. Conventional internal combustion engines (ICEs) are widely used in automobiles, with an efficiency range of 25% to 35%, while the remaining energy is lost through cooling and exhaust gases. Additionally, two parasitic loads—the alternator and the air conditioning (AC) compressor—are driven by the ICE via a belt, further reducing efficiency. In this paper, energy and exergy analysis of the waste heat of exhaust gases has been performed for automobiles equipped with ICEs, i.e., R06A, F8B, K10B, 2NZ-FE, and 2ZR-FE, to evaluate their potential to drive these parasitic loads. The working cycles of these ICE models were simulated using a zero-dimensional MATLAB model based on fundamental governing equations. The results indicate that approximately 10–40 kW of energy is lost through exhaust gases under varying operating conditions for the examined ICEs. The average exhaust gas temperature and mass flow rate for these ICEs are approximately 900 K and 0.016 kg/s, respectively. Based on these findings, an E-turbine retrofit system is proposed to operate under these conditions, recovering exhaust energy to power the alternator and AC compressor. The results showed that the E-turbine generated 6.8 kW of mechanical power, which was converted into 4 kW of electrical power by the generator. This electrical power was used to supply the parasitic loads, thereby enhancing the overall efficiency of ICE.
1. Introduction
The world has limited reserves of fossil fuel resources and the transportation sector is one of the major consumers of these resources. Oil and natural gas are currently significant energy carriers in transportation. Across International Energy Agency (IEA) countries, the transport sector has consumed 106.41 exajoules (EJ) of oil and 5.25 EJ of natural gas in 2022 [1]. According to projections, global demand for oil and natural gas is expected to peak before 2030 [2]. The combustion of fossil fuels also causes a major portion of CO2 emissions, which contributes to global warming. In the past decade, out of the world’s total CO2 emissions, 23% were emitted by the transportation sector, which includes 17% by road transport. In 2022, road transport accounted for the largest share of CO2 emissions within the transportation sector, emitting approximately 5.87 gigatonnes (Gt) of CO2 [3].
Road transport is powered mainly by internal combustion engines (ICEs). The thermal efficiency of ICEs is around 25–35%, while the rest of the fuel energy is wasted in cooling water and exhaust gases [4]. The cooling water carries heat to keep the ICE in a safe condition and usually has a temperature of 373–400 K. Another major portion of fuel energy is wasted through the exhaust gases which need to be recovered to improve the fuel consumption of the vehicle. The temperature of the exhaust gases is usually between 600 and 1100 K, depending upon the ICE type and operation [5].
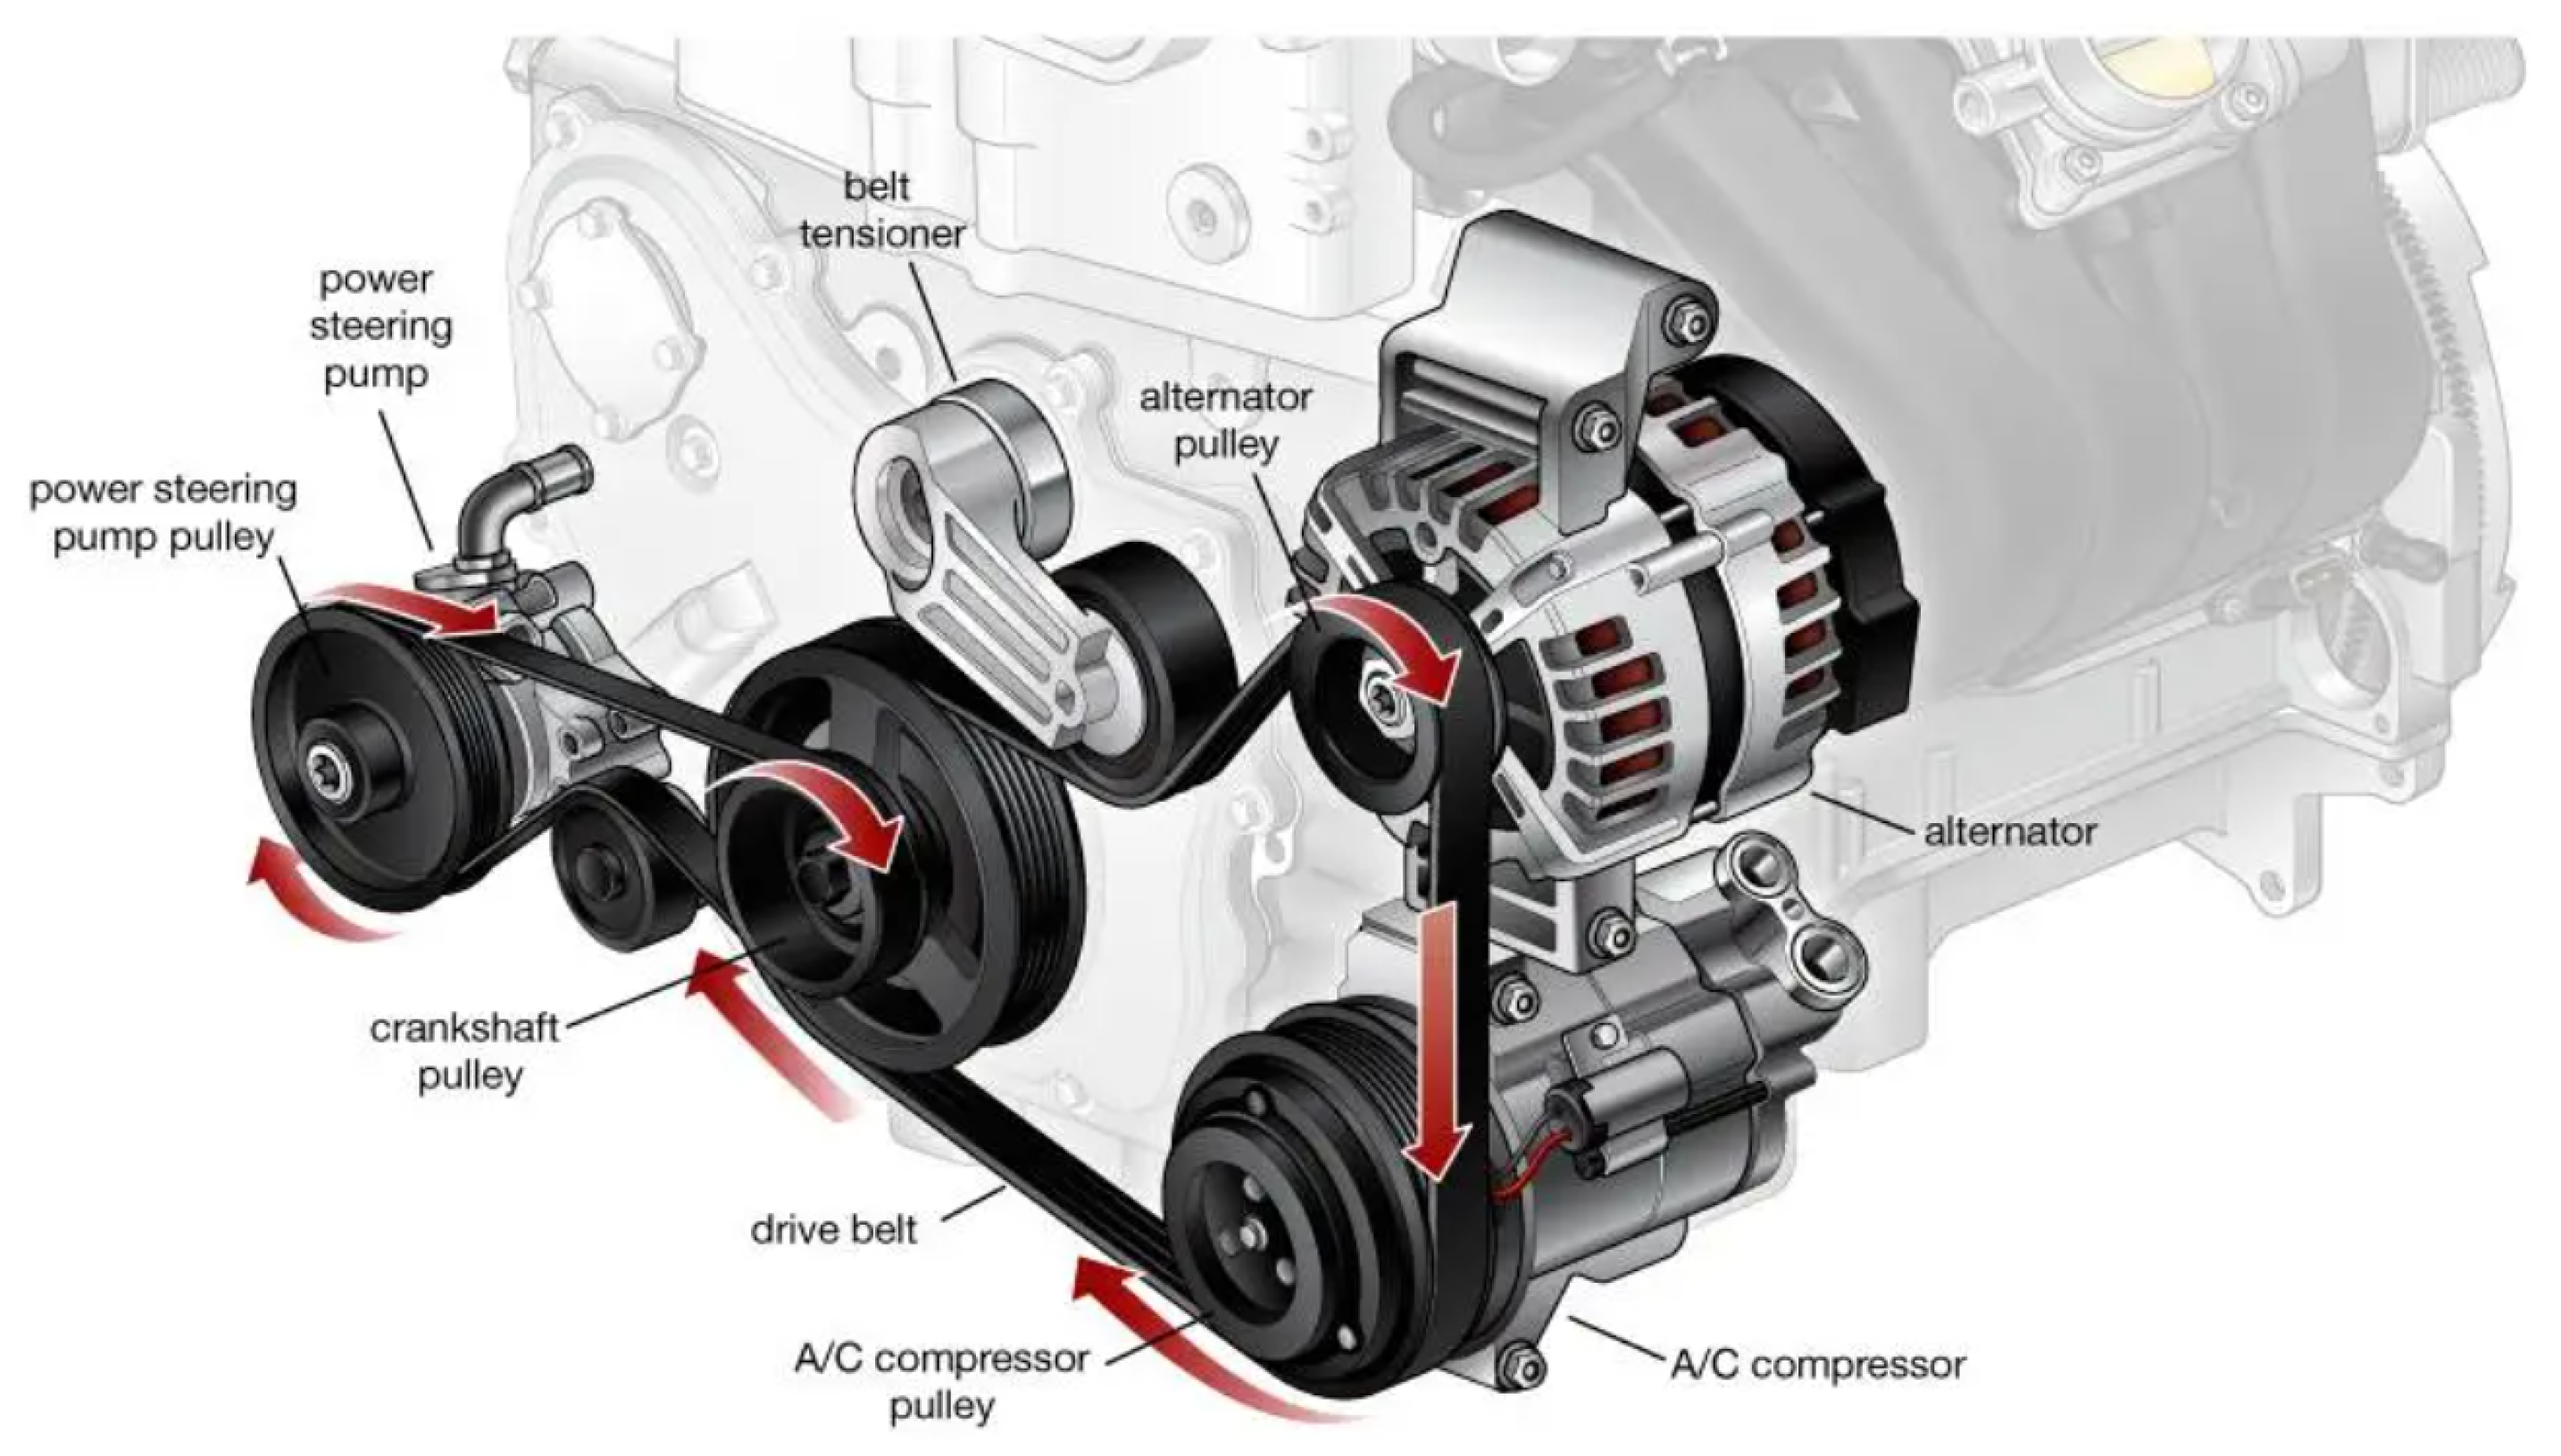
Conventional ICE automobiles utilize engine power to drive auxiliary components such as the air conditioning (AC) compressor and alternator via a belt drive system. These parasitic loads increase the mechanical demand on the engine, thereby negatively impacting fuel consumption and reducing overall fuel economy. The typical ICE configuration in conventional automobiles is illustrated in Figure 1. AC usage can reduce fuel economy by approximately 5–25% in urban driving conditions. This reduction is influenced by several factors, including vehicle size, AC system efficiency, and ambient temperature [6,7]. The alternator draws mechanical energy from the ICE to recharge the vehicle’s battery and supply power to electrical systems and accessories [8]. Conventional automotive alternators typically operate with an efficiency of around 65%; therefore, they consume a significant amount of energy from ICE [9].

Figure 1.
Conventional automobile’s ICE setup.
Several waste heat recovery technologies (WHRTs) have been introduced to make use of exhaust gases that are wasted to the environment [10]. A turbocharger is a type of supercharger that utilizes the energy from an ICE’s exhaust gases to compress the intake air, thereby increasing the ICE’s efficiency and power output. Another type of supercharger is driven by ICE through a belt-drive system [11,12]. Thermoelectric generators (TEGs) represent a promising technology for automotive waste heat recovery, as they enable the direct conversion of exhaust heat into electrical energy [13,14]. TEGs operate based on the Seebeck effect, whereby a temperature gradient across a thermoelectric material induces a voltage, allowing thermal energy to be directly converted into electrical energy. In automotive applications, TEGs are typically positioned between the hot exhaust gas stream and a cooler medium, such as ICE coolant, to establish the required temperature differential. Due to the absence of moving or complex mechanical components, TEGs offer silent operation and high reliability [15]. The Organic Rankine Cycle (ORC) is another promising technology for recovering waste heat. It converts the low-grade thermal energy from exhaust gases into mechanical work; however, it requires multiple complex mechanical components for its operation [16,17]. All the WHRTs discussed cannot be implemented as retrofit solutions in conventional ICE systems, as they typically require dedicated design modifications to the ICE architecture [18].
The automotive manufacturing industry plays a significant role in the global economy, contributing approximately 3.5% to the global gross domestic product (GDP) [19]. As of 2023, approximately 1.47 billion vehicles are in operation worldwide [20]. Conventional ICE automobiles continued to dominate global new car sales in 2023, accounting for approximately 80% of the market, while electric vehicles (EVs) made up around 18% [21].
On one hand, a substantial amount of exhaust energy from ICEs is lost to the environment; on the other hand, parasitic loads such as the alternator and AC compressor negatively impact fuel economy. Moreover, most existing WHRTs have technological complexities and require modifications to the ICE architecture, limiting their applicability in conventional vehicles. Thermoelectric generators (TEGs) typically suffer from low energy conversion efficiencies and rely on rare and expensive materials, many of which have limited thermal stability at elevated temperatures [22,23]. On the other hand, Organic Rankine Cycles (ORCs) involve multiple complex components such as pumps, evaporators, and condensers. They also require a separate working fluid, the selection of which is critical due to common issues of flammability and toxicity [24,25]. To address these issues, this study proposes a retrofit WHRT solution—an E-turbine system—to recover exhaust energy and power the parasitic loads without altering the existing ICE setup. In contrast to TEGs and ORCs, the E-turbine system offers a compact and simpler design with only a single rotating component. It does not require an additional working fluid and is capable of directly responding to transient loads. Moreover, it provides high power density. Energy and exergy analyses of the exhaust gases from five commonly used ICE models (R06A, F8B, K10B, 2NZ-FE, and 2ZR-FE) have been conducted to assess their potential for driving these auxiliary components. The key data specifications are listed in Table 1.

Table 1.
Key specifications of ICEs studied.
The objectives of this research are as follows:
- (1)
- To perform energy and exergy analyses of the exhaust gases from ICEs commonly used in conventional automobiles.
- (2)
- To propose a retrofit E-turbine design for recovering waste heat and replacing ICE-driven parasitic loads.
2. E-Turbine System Description
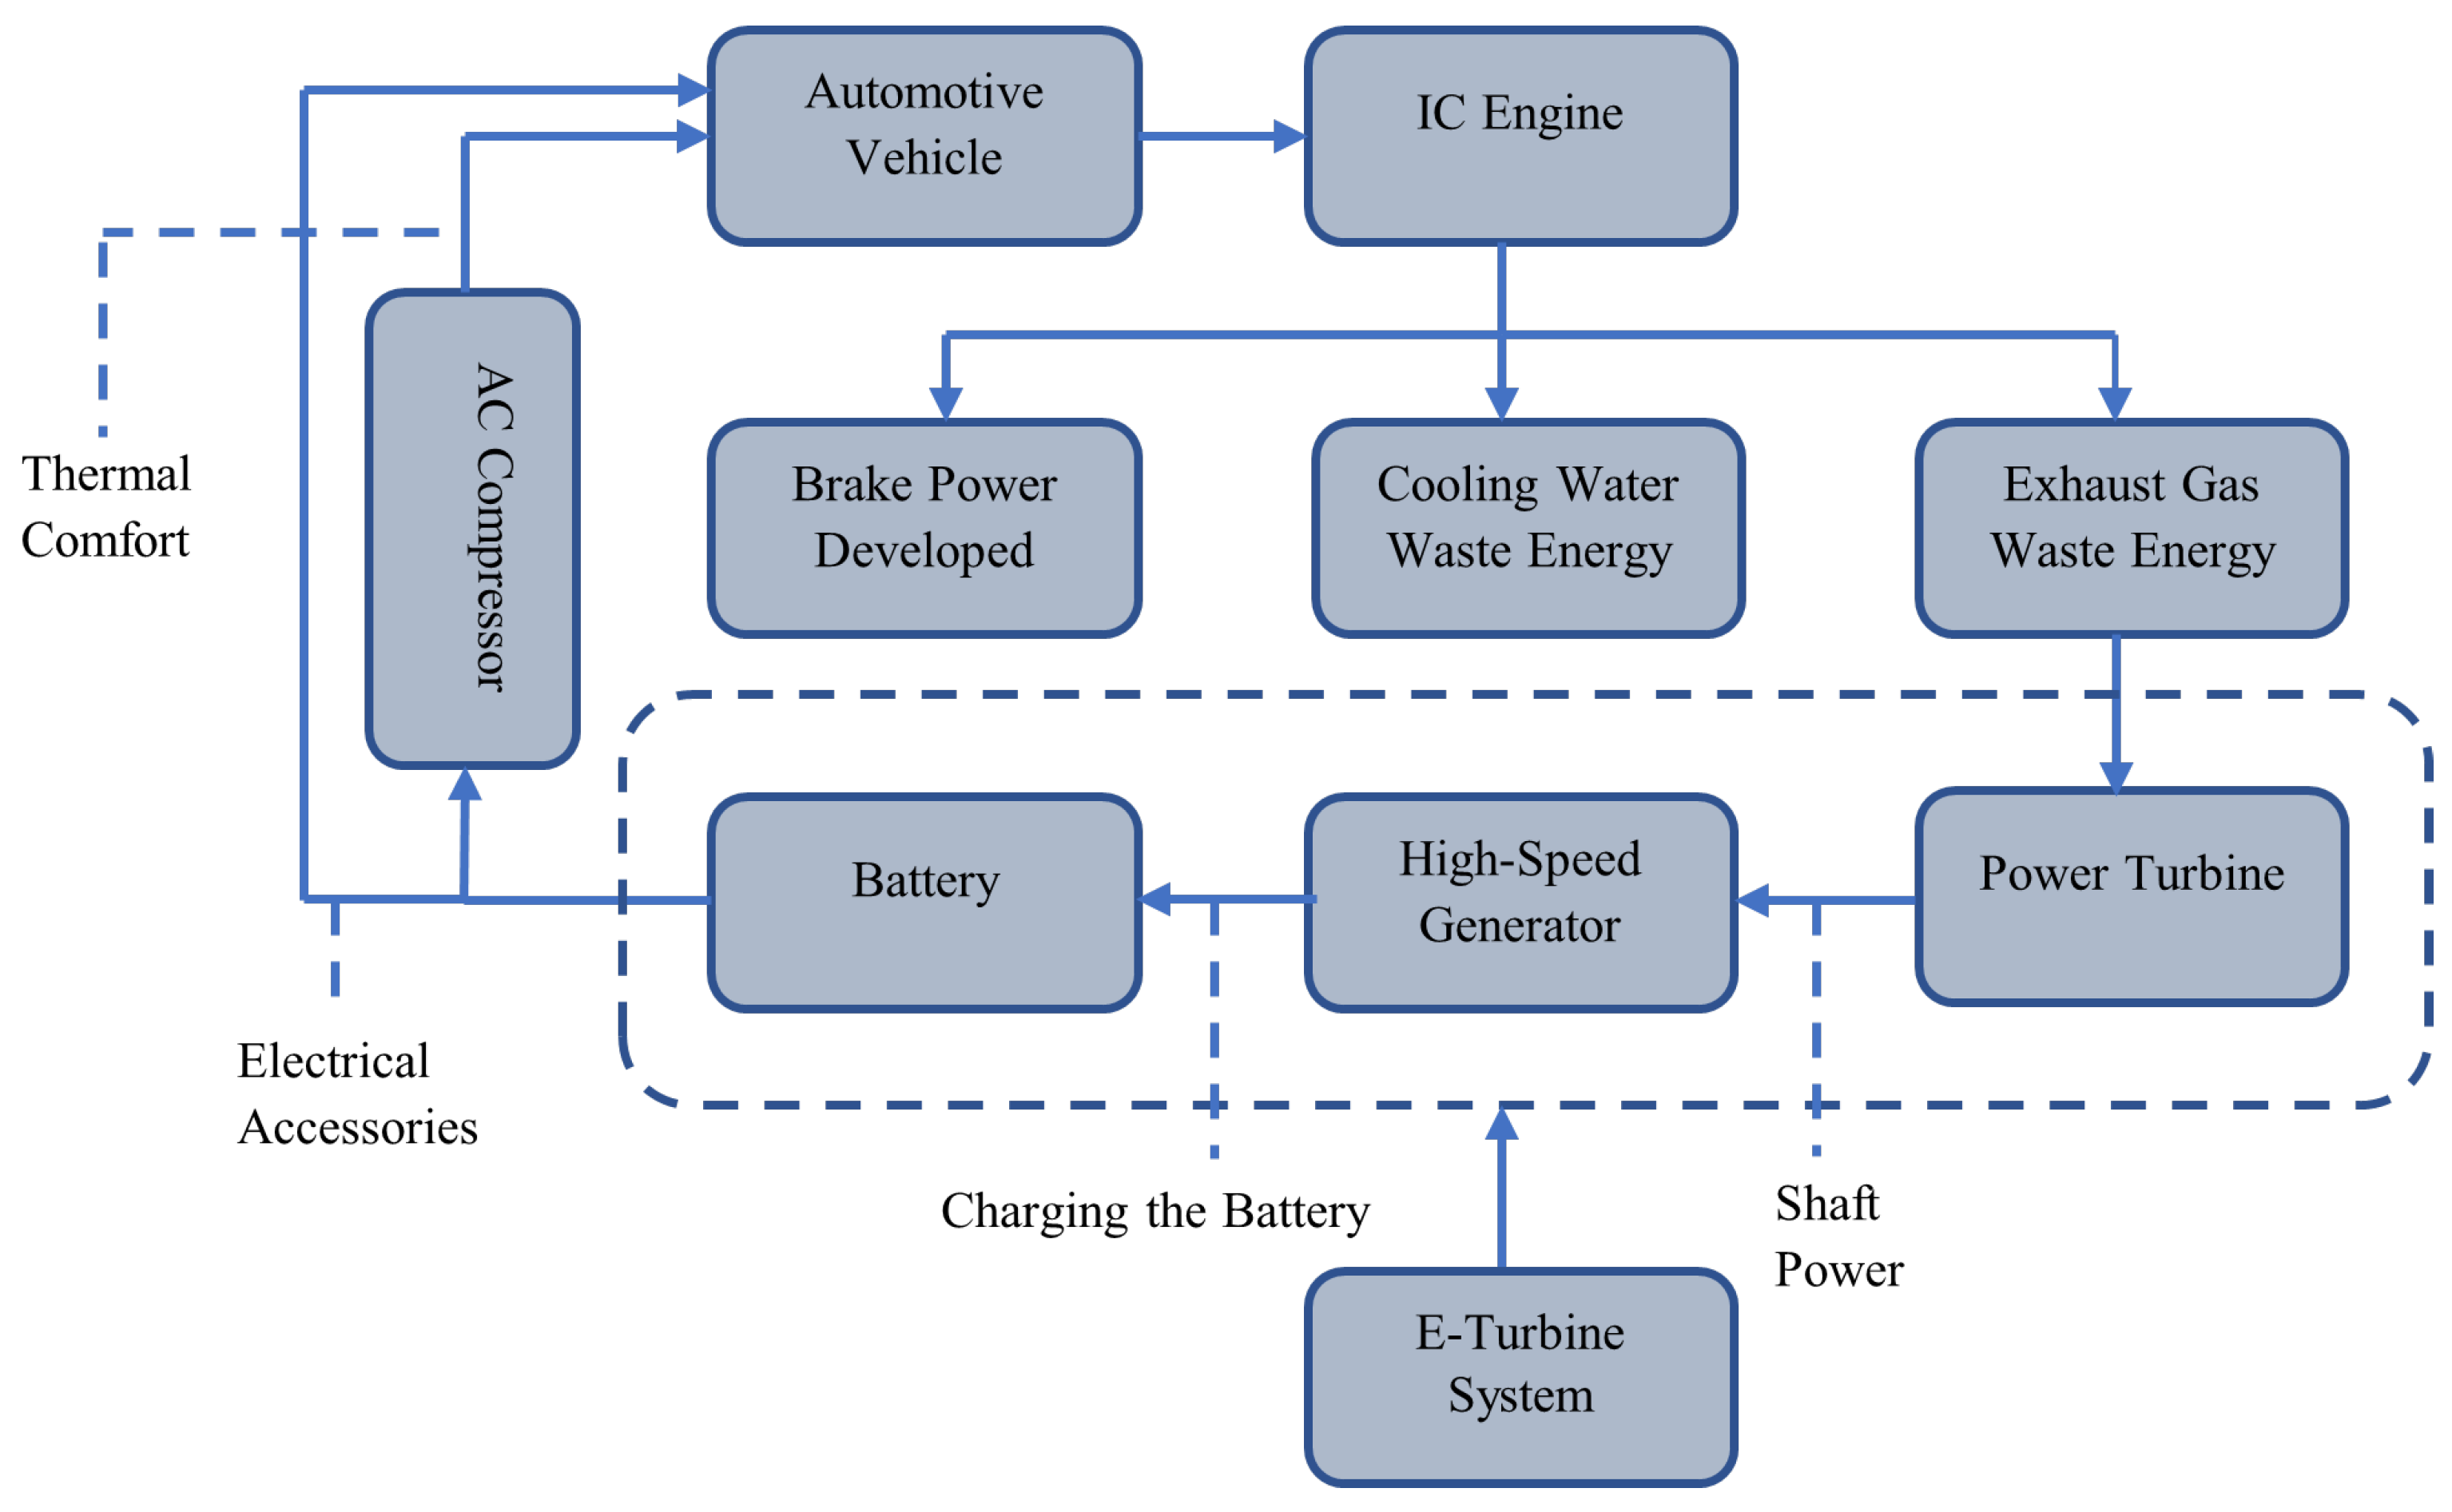
The E-turbine system primarily comprises a power turbine, a high-speed generator, and a battery unit. Its operating principle is based on harnessing the waste heat energy from exhaust gases. The power turbine is integrated into the exhaust manifold, where it is driven by the flow of high-temperature exhaust gases, thereby generating mechanical shaft power. This shaft is directly coupled to a high-speed generator, which converts the mechanical energy into electrical energy. The generated electricity is then used to drive an electric AC compressor and charge the battery, effectively replacing parasitic loads on the ICE and improving overall fuel efficiency through exhaust heat recovery. The system description is shown in Figure 2.

Figure 2.
Description of E-turbine system.
3. E-Turbine System Governing Models and Implementation
3.1. ICE Governing Models
The mentioned ICEs are modeled in MATLAB® Version 2013 using established mathematical formulations [8]. These models simulate ICE behavior with respect to the crank angle. The cylinder volume as a function of crank angle is given by:
where:
Here, is the clearance volume, B is the bore diameter, l is the connecting rod length, a is the crank radius, and is the crank angle. The Wiebe model is applied to represent the energy release during the combustion process [26]:
where is the mass fraction of fuel burned, a is the efficiency factor, n is the form factor, is the start of combustion w.r.t. crank angle, and is the combustion duration w.r.t. crank angle. The heat release rate is expressed as:
where is the heat input to the cylinder, dependent on the fuel’s lower heating value (44,000 kJ/kg for gasoline). The in-cylinder pressure is modeled as:
Here, P is the in-cylinder pressure, is the specific heat ratio, is the crankshaft speed in radians, m is the in-cylinder mass, and is the mass blow-by rate. The blow-by coefficient is . The in-cylinder temperature is modeled by:
with
Finally, the indicated work is calculated as:
The brake power at the crankshaft is determined by accounting for mechanical efficiency:
where is the number of cylinders, and is the mechanical efficiency. The equation is divided by 2 because, in a 4-stroke ICE, the power stroke occurs every two crankshaft revolutions. The torque of the ICE is given by:
The law of conservation of mass is used to calculate the mass flow rate of exhaust gases, stating that the mass flow in is equal to the mass flow out:
The thermal efficiency is expressed as:
Thus, the mass flow rate of fuel is:
The air–fuel ratio (AFR) is:
The exhaust mass flow rate is the sum of the air and fuel mass flow rates:
The exhaust energy is calculated by:
Finally, the available energy in the exhaust gases is calculated at certain conditions by the following equation [27,28]:
where is the exhaust gas temperature, is the ambient temperature, is the ambient pressure, is the exhaust pressure, is the specific heat capacity of the exhaust gases, and is the exhaust gas constant. It is assumed that the exhaust products are primarily composed of air; therefore, the properties of air at the corresponding temperatures are used. Based on this assumption, it is reasonable to consider only physical exergy in the analysis. When the chemical composition of the working fluid remains unchanged or is not a focus of the study, the difference between physical and total exergy is typically minimal, making the exclusion of chemical exergy justifiable [29,30,31].
3.2. Power Turbine Governing Models
The mathematical models used for the preliminary sizing of the power turbine are as follows [32]:
The isentropic enthalpy drop across the power turbine is given by:
where is the pressure ratio across the power turbine, and represents the isentropic enthalpy change. The specific speed and specific diameter of the turbine are defined as:
Here, is the density of exhaust gases.
3.3. MATLAB® Model
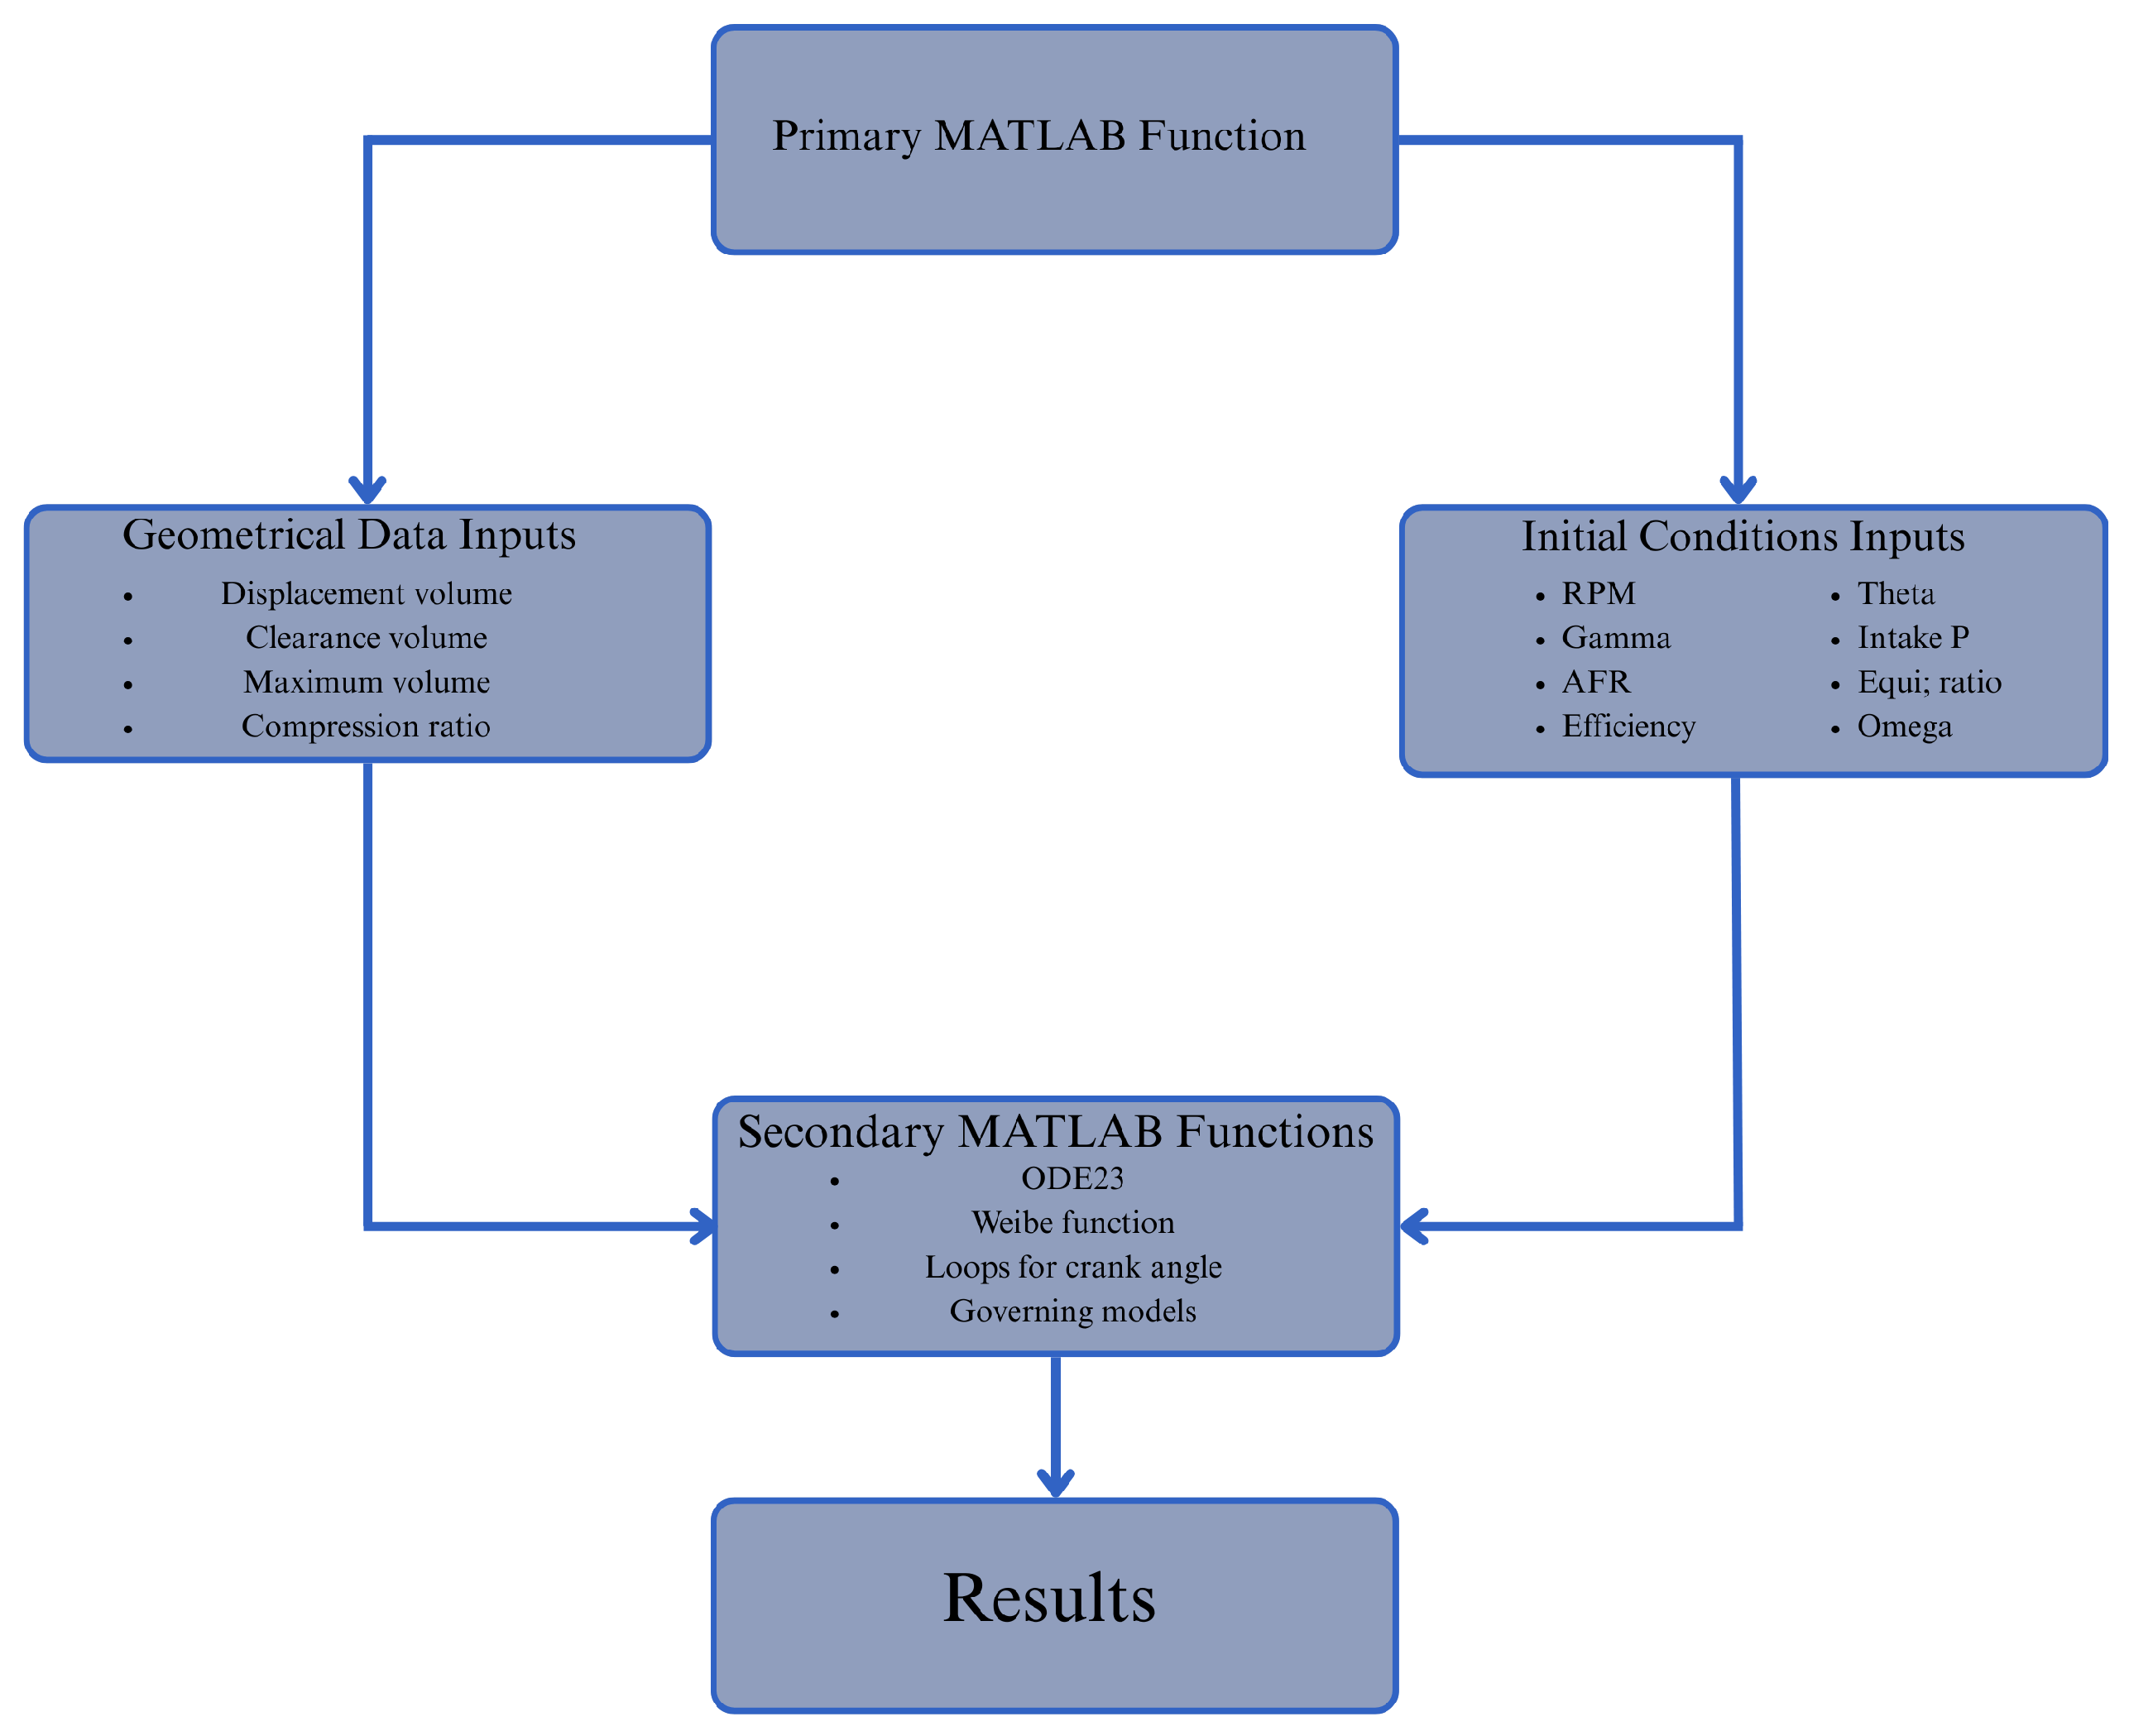
The ICEs R06A, F8B, K10B, 2NZ-FE, and 2ZR-FE, with displacement volumes of 0.6 L, 0.8 L, 1 L, 1.3 L, and 1.8 L, respectively, are modeled in MATLAB®. A zero-dimensional model is created for this study, which is termed “zero-dimensional” because it only depends on the crank angle of the crankshaft, without considering any spatial coordinates. The MATLAB model uses the built-in ODE23 function to solve multiple differential equations simultaneously [33]. The ICE’s performance depends on key geometrical inputs, such as displacement volume , clearance volume , maximum volume , and compression ratio . The initial conditions required for the MATLAB® model include the specific heat ratio (), crankshaft speed (), ICE rotational speed (rpm), spark ignition timing (), and combustion duration (). The model calculates results at each crank angle from to . To account for the combustion process—specifically spark timing and combustion duration—a for loop is used to implement the Wiebe function within the range (the angles show the position of the piston in terms of the crank angle). The model first calculates the in-cylinder pressure and temperature with respect to the crank angle, and then computes the indicated work, brake power, torque, exhaust energy, mass flow rate, and exergy of the exhaust gas. The scheme of the model is shown in Figure 3.
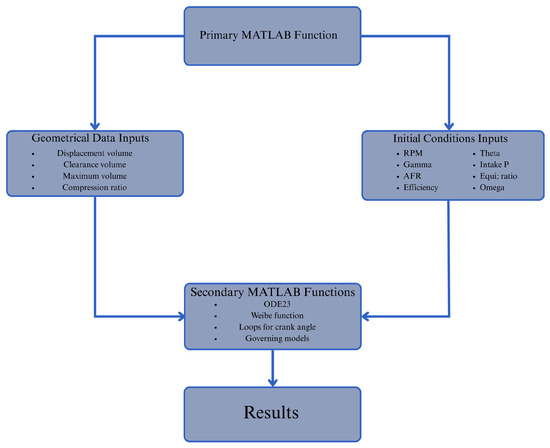
Figure 3.
Scheme of MATLAB® model implementation.
3.4. Validation of MATLAB® Model
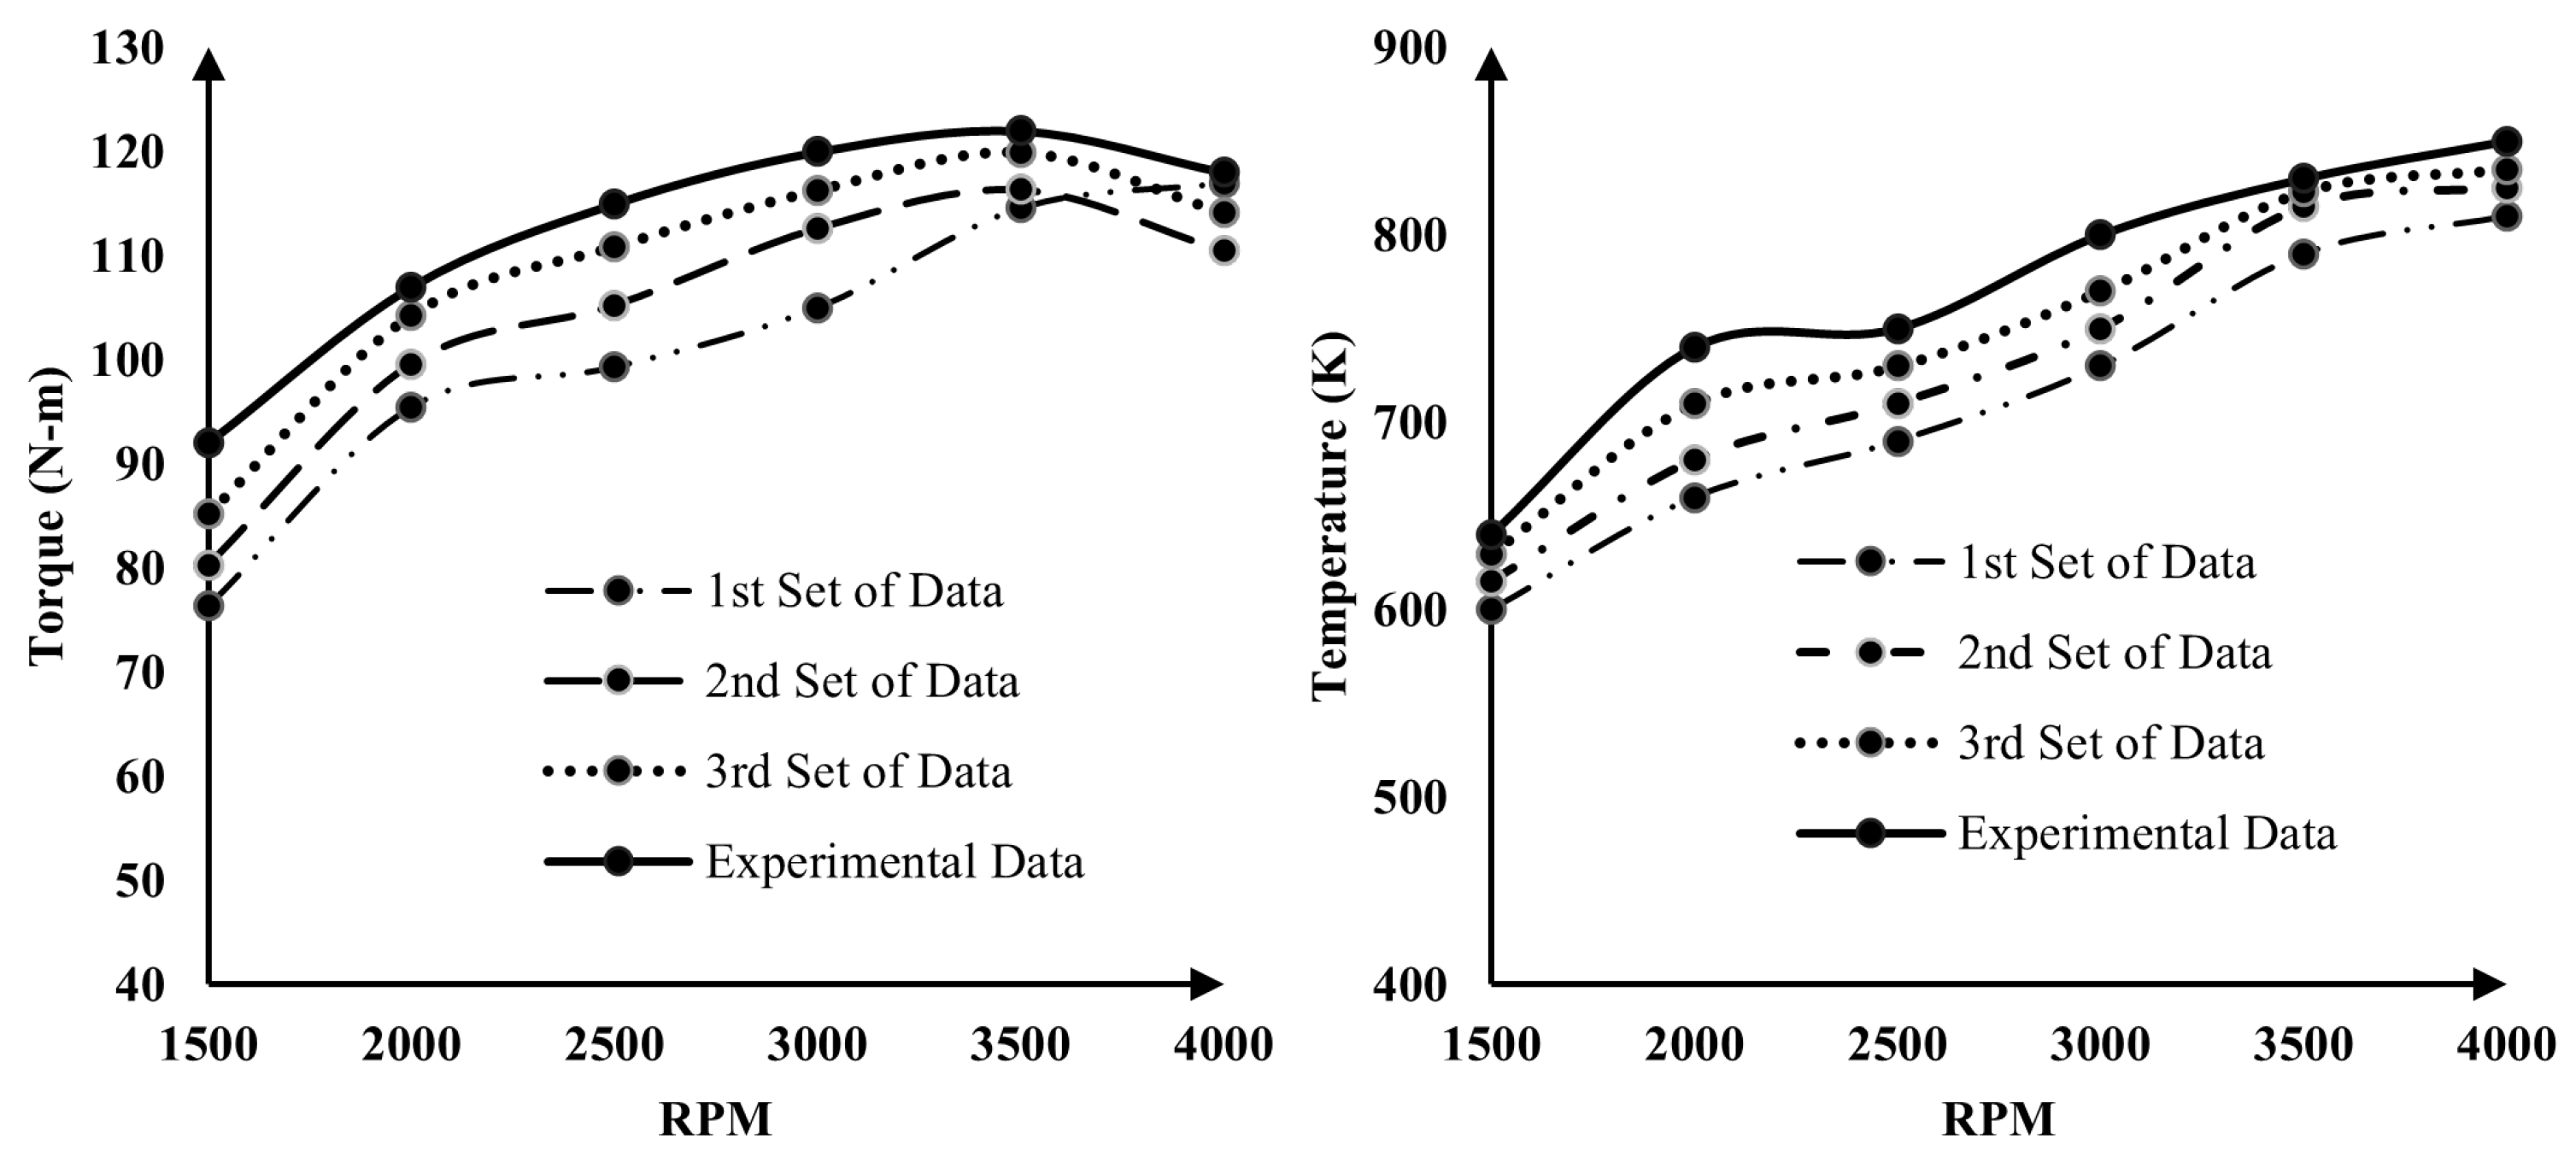
The model developed in this study was validated using experimental data from a 1.4 L ICE [34]. Three distinct sets of operating conditions were simulated, and the corresponding results were analyzed. For the first data set, the operating parameters were = 1.24, = , = , n = 2, and a = 3. The second data set included = 1.26, = , = , n = 3, and a = 4. The third set comprised = 1.28, = , = , n = 3, and a = 5. These conditions were implemented within a MATLAB-based model replicating the engine studied in the referenced experimental work. The simulated outputs for torque and exhaust gas temperature showed good agreement with the experimental results, capturing similar trends as illustrated in Figure 4.

Figure 4.
Validation of MATLAB model with the experimental data for torque and temperature of the exhaust gases for different operating conditions.
Reliability analysis has been conducted for both experimental and simulated data sets. The percentage differences in torque between experimental and simulated values for the 1st, 2nd, and 3rd data sets are 9.8%, 7.5%, and 3.5%, respectively. Similarly, for exhaust gas temperature, the percentage differences are 7.22%, 4.7%, and 2.4% for the 1st, 2nd, and 3rd data sets, respectively.
4. Results and Discussion
4.1. Energy and Exergy Analysis of Exhaust Gases
The performance parameters such as brake power, temperature of exhaust gases, mass flow rate, energy and exergy of exhaust gases for all these mentioned ICEs are plotted against rpm at full load and part load and shown in Figure 5, Figure 6, Figure 7, Figure 8, Figure 9, Figure 10, Figure 11, Figure 12, Figure 13 and Figure 14. Brake power initially increases with speed but begins to decline beyond a certain point due to reduced mechanical efficiency. The brake power at full load is shown in Figure 5, while at part load is shown in Figure 6.
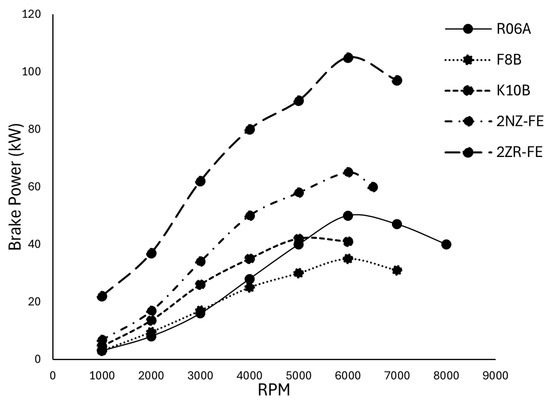
Figure 5.
Illustration of variation of brake power (kW) against rpm at full load for the studied ICEs.
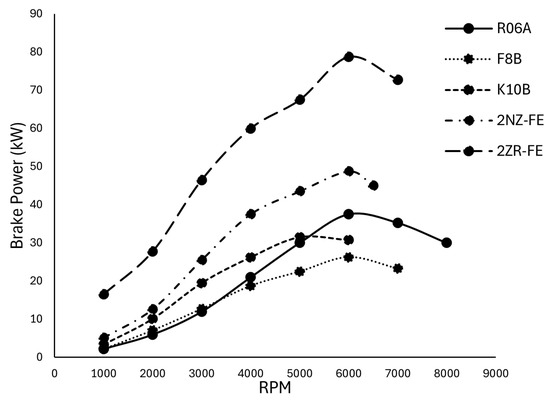
Figure 6.
Illustration of variation of brake power (kW) against rpm at part load for the studied ICEs.
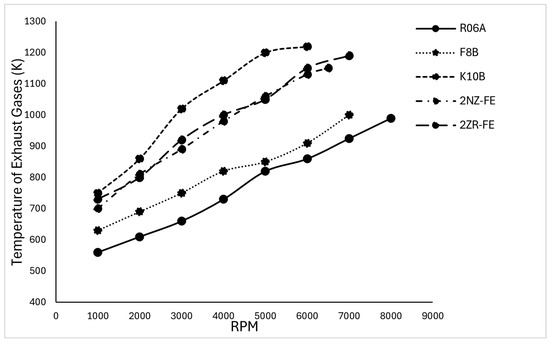
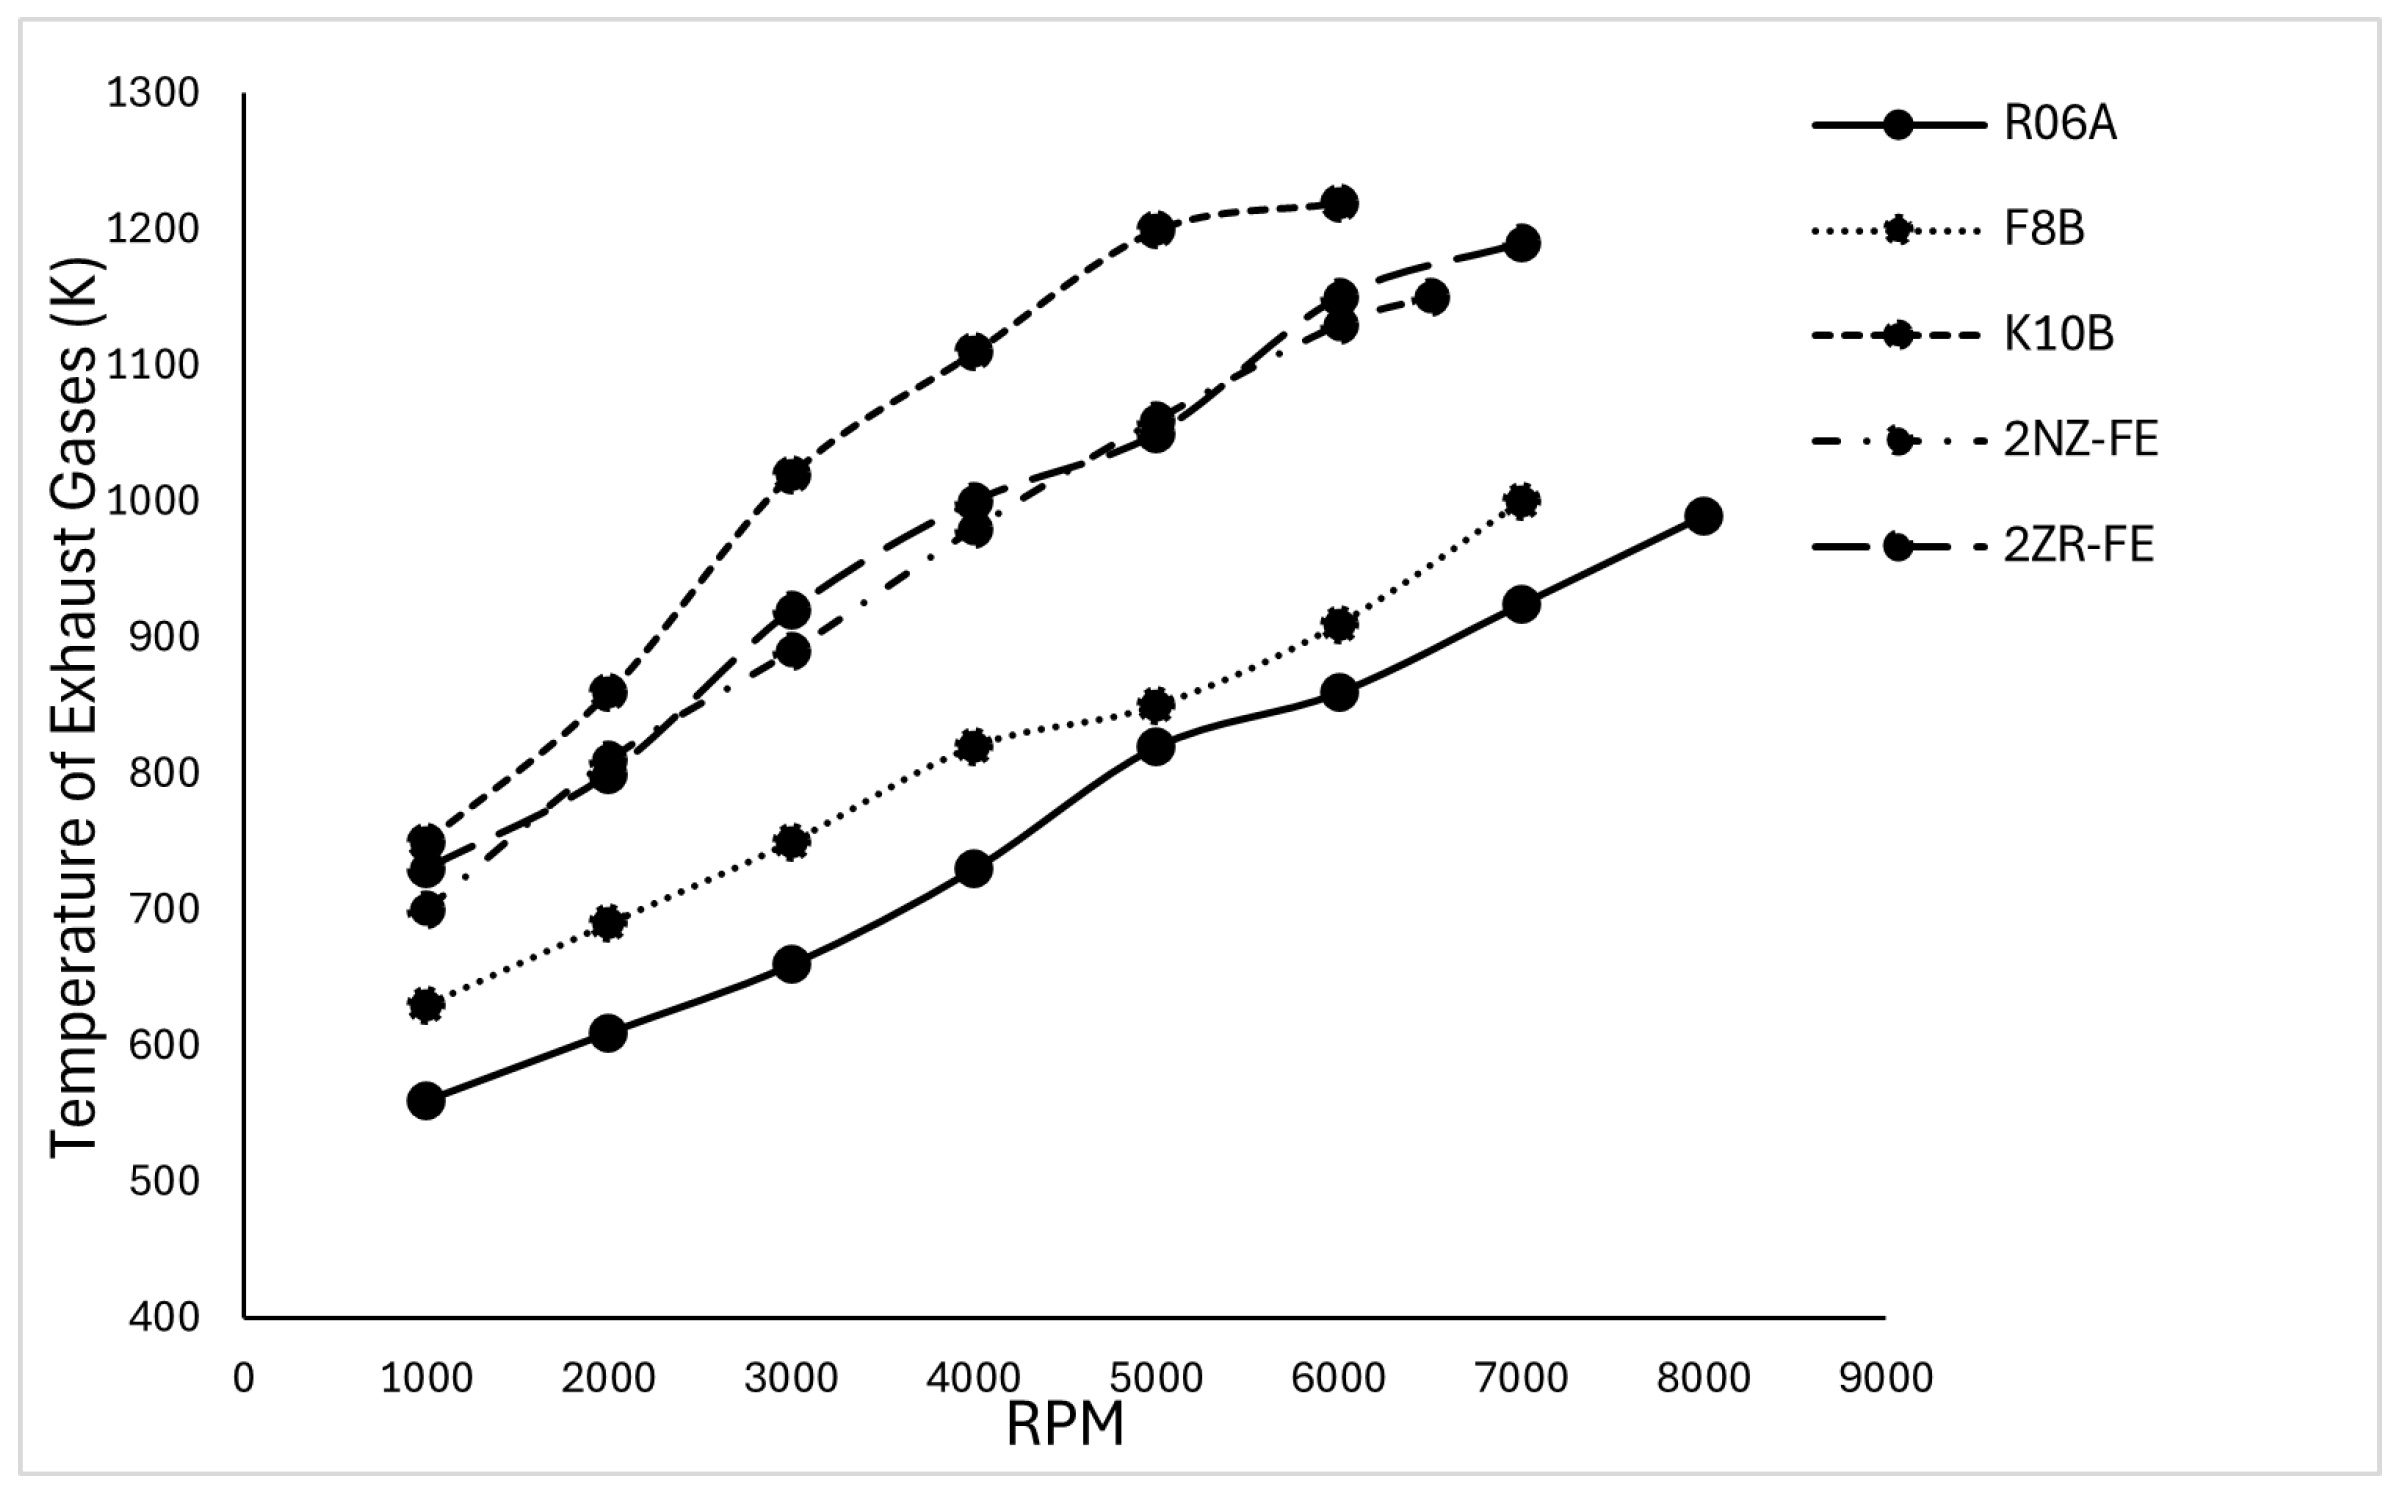
Figure 7.
Illustration of relation between exhaust gas temperature (K) and rpm at full load for the studied ICEs.

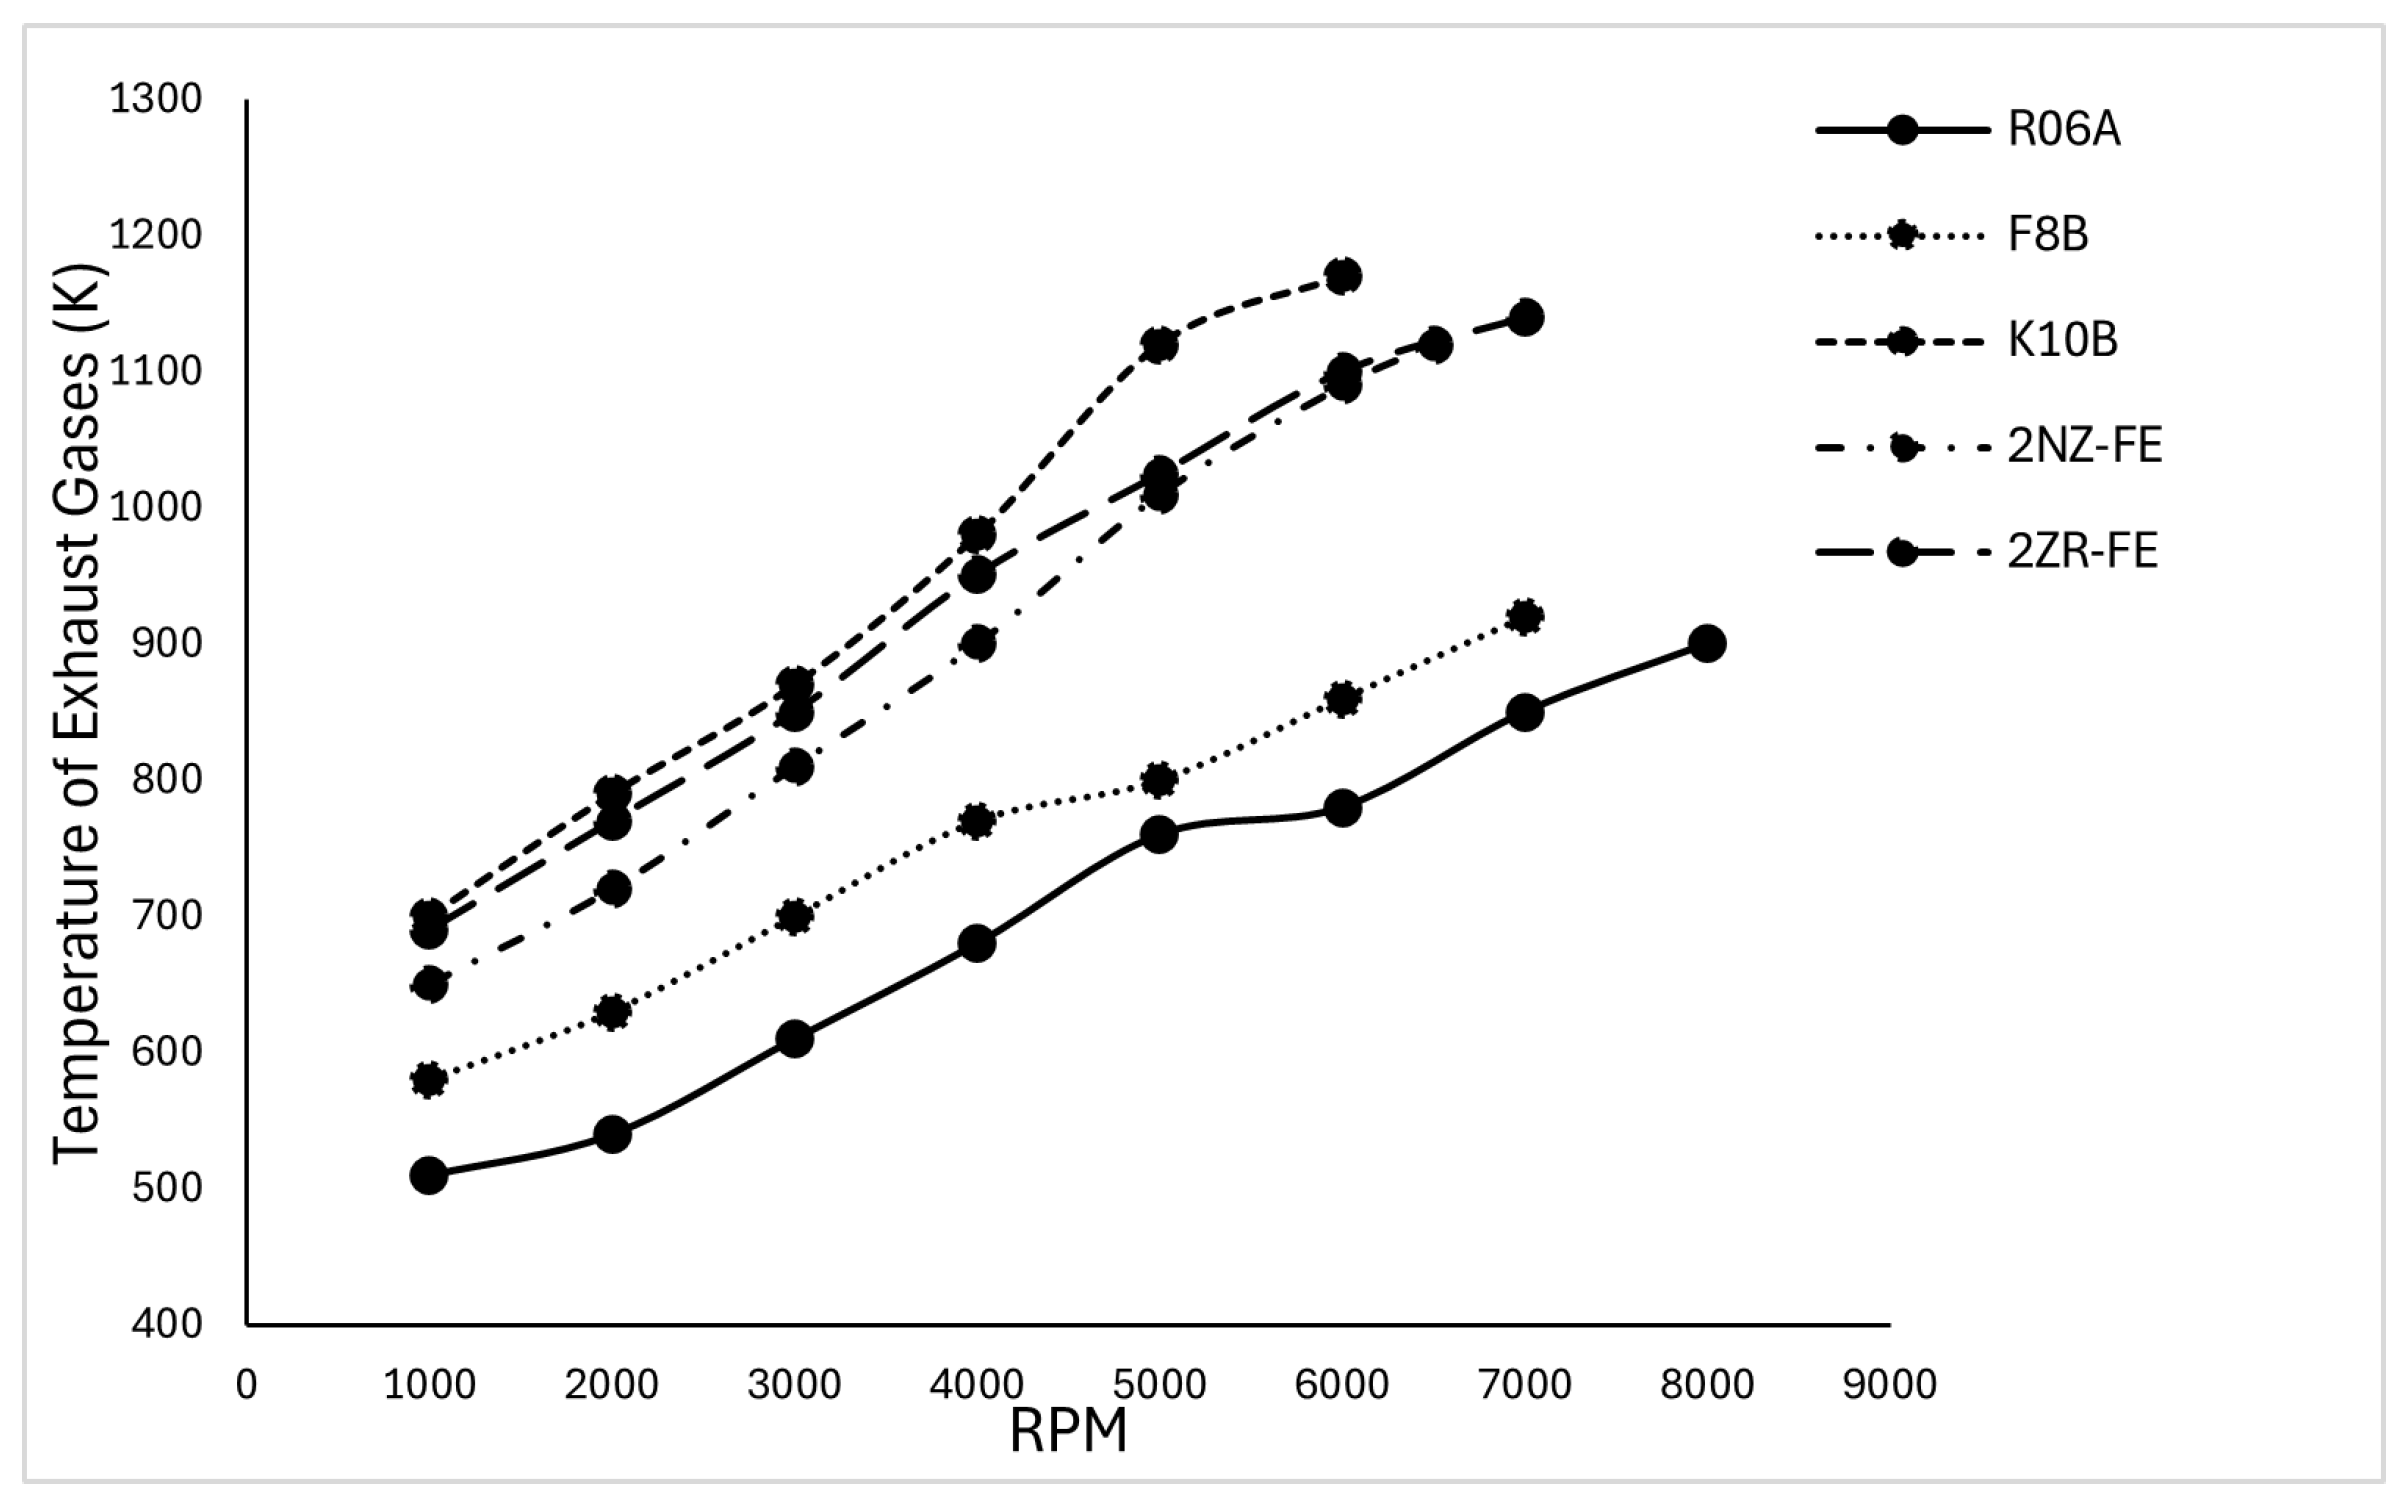
Figure 8.
Illustration of relation between exhaust gas temperature (K) and rpm at part load for the studied ICEs.
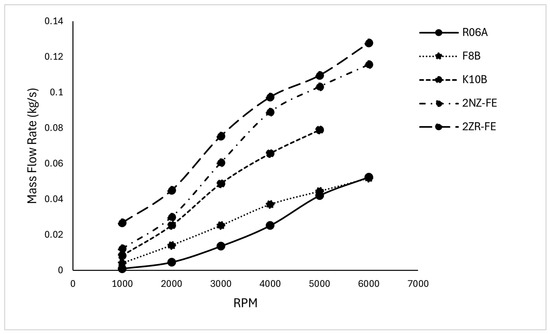
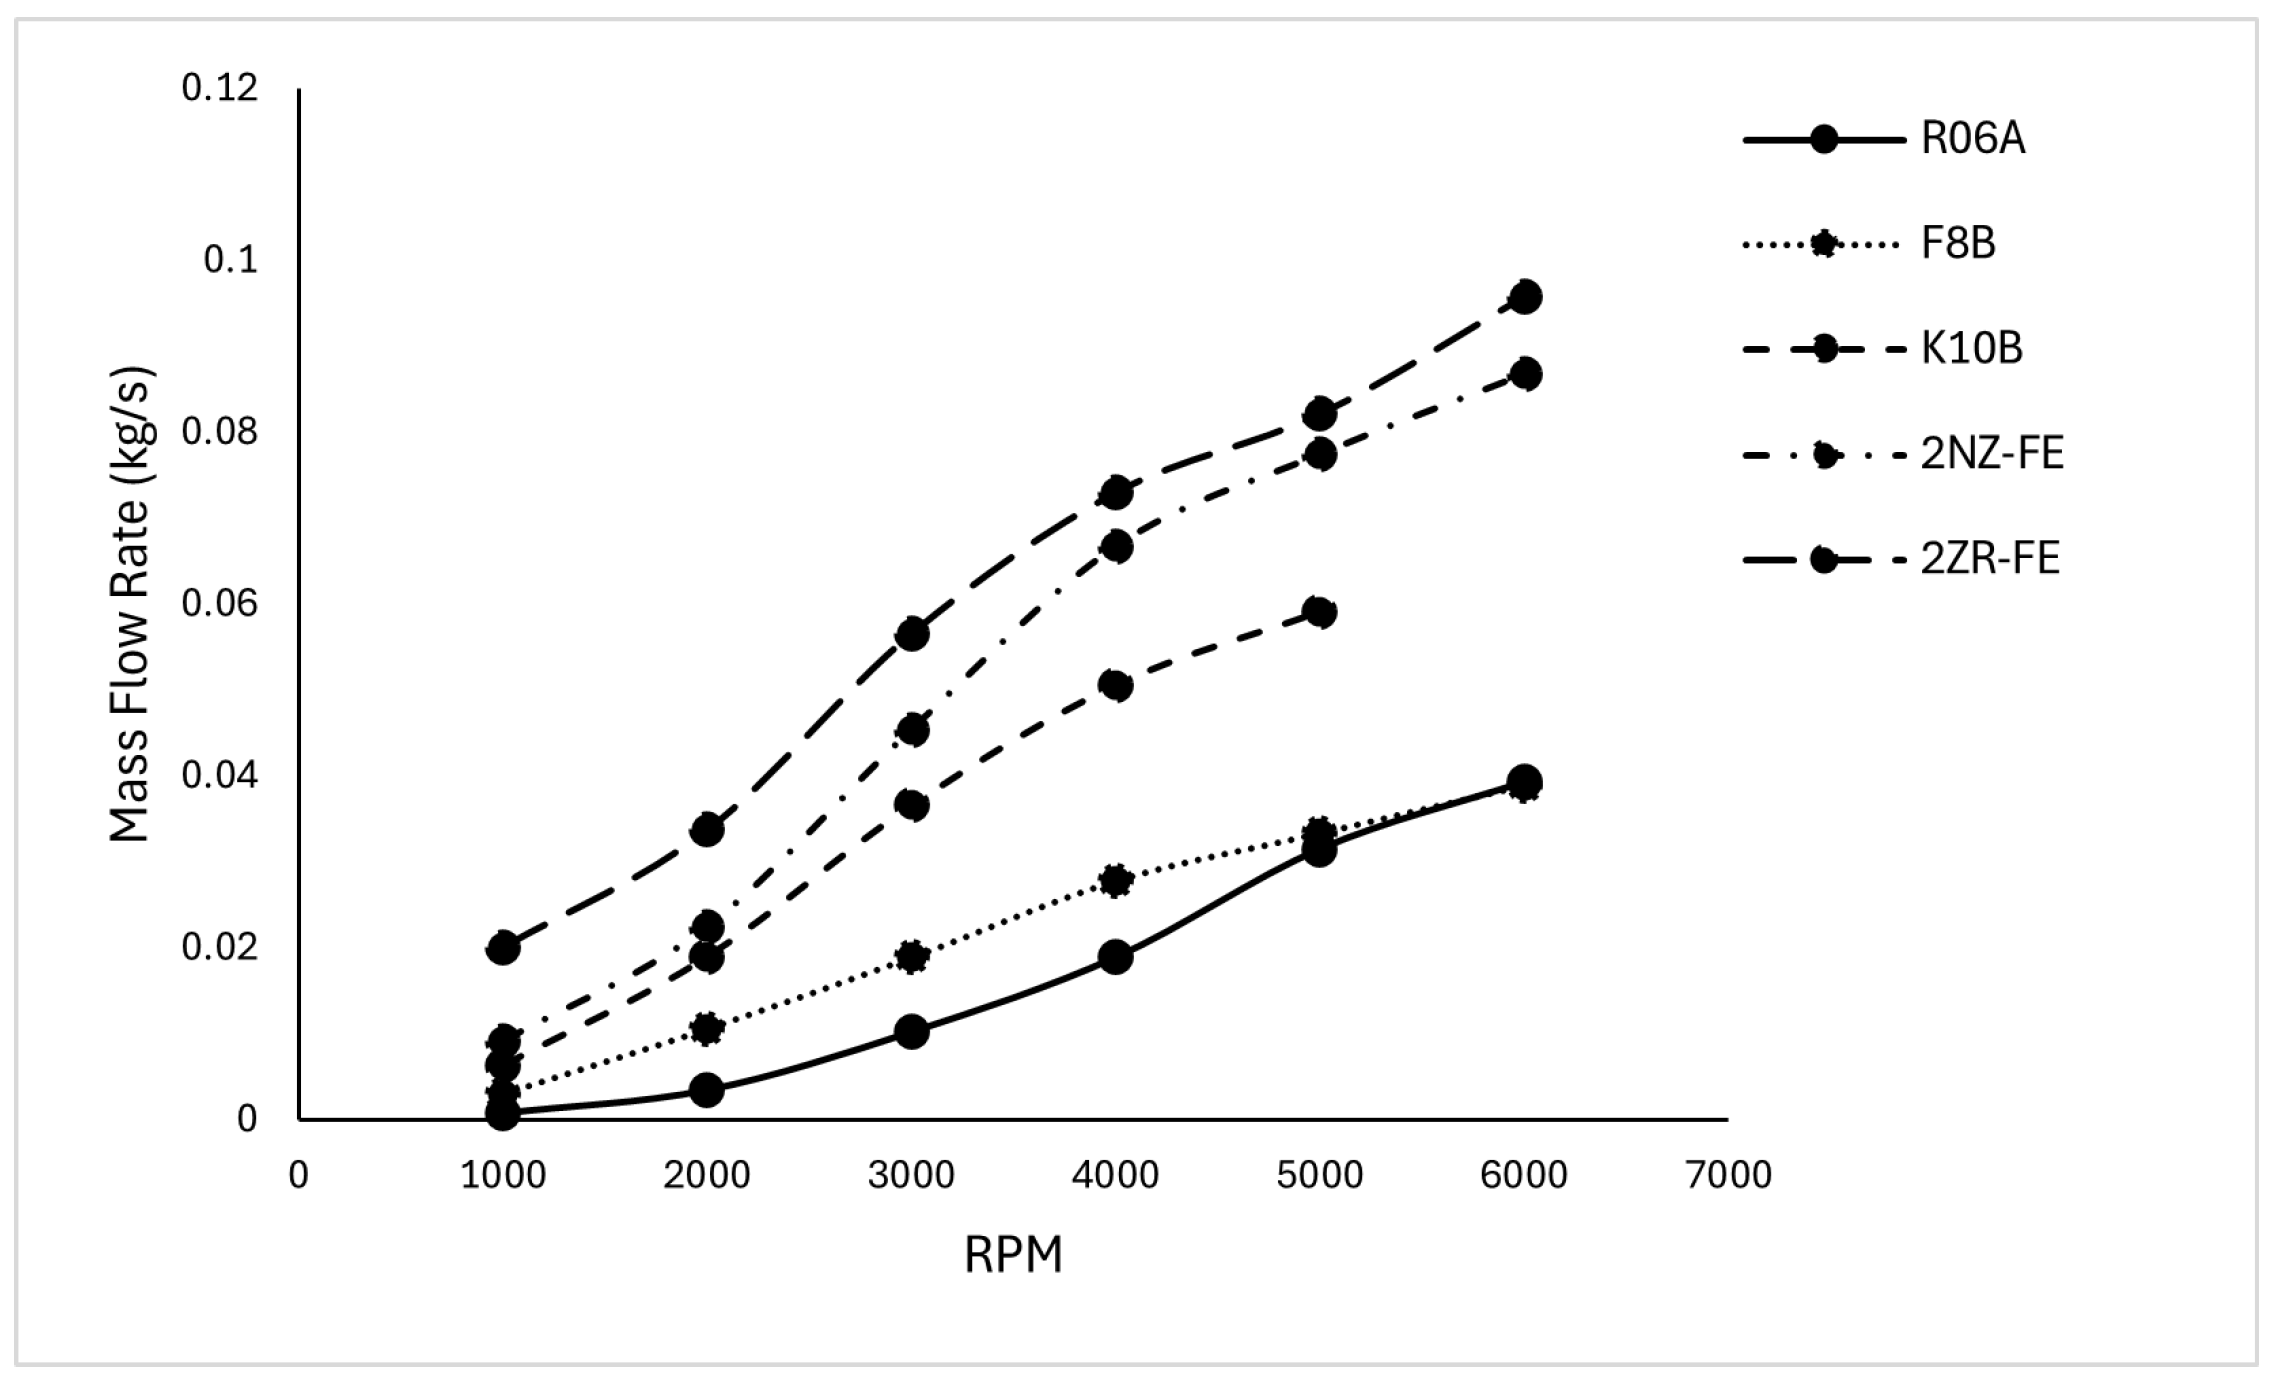
Figure 9.
Illustration of variation of mass flow rate (kg/s) of exhaust gases against rpm at full load for the studied ICEs.
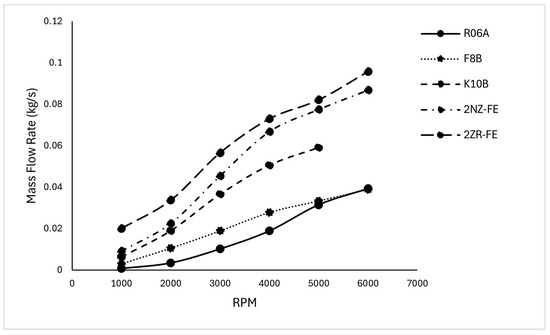
Figure 10.
Illustration of variation of mass flow rate (kg/s) of exhaust gases against rpm at part load for the studied ICEs.

Figure 11.
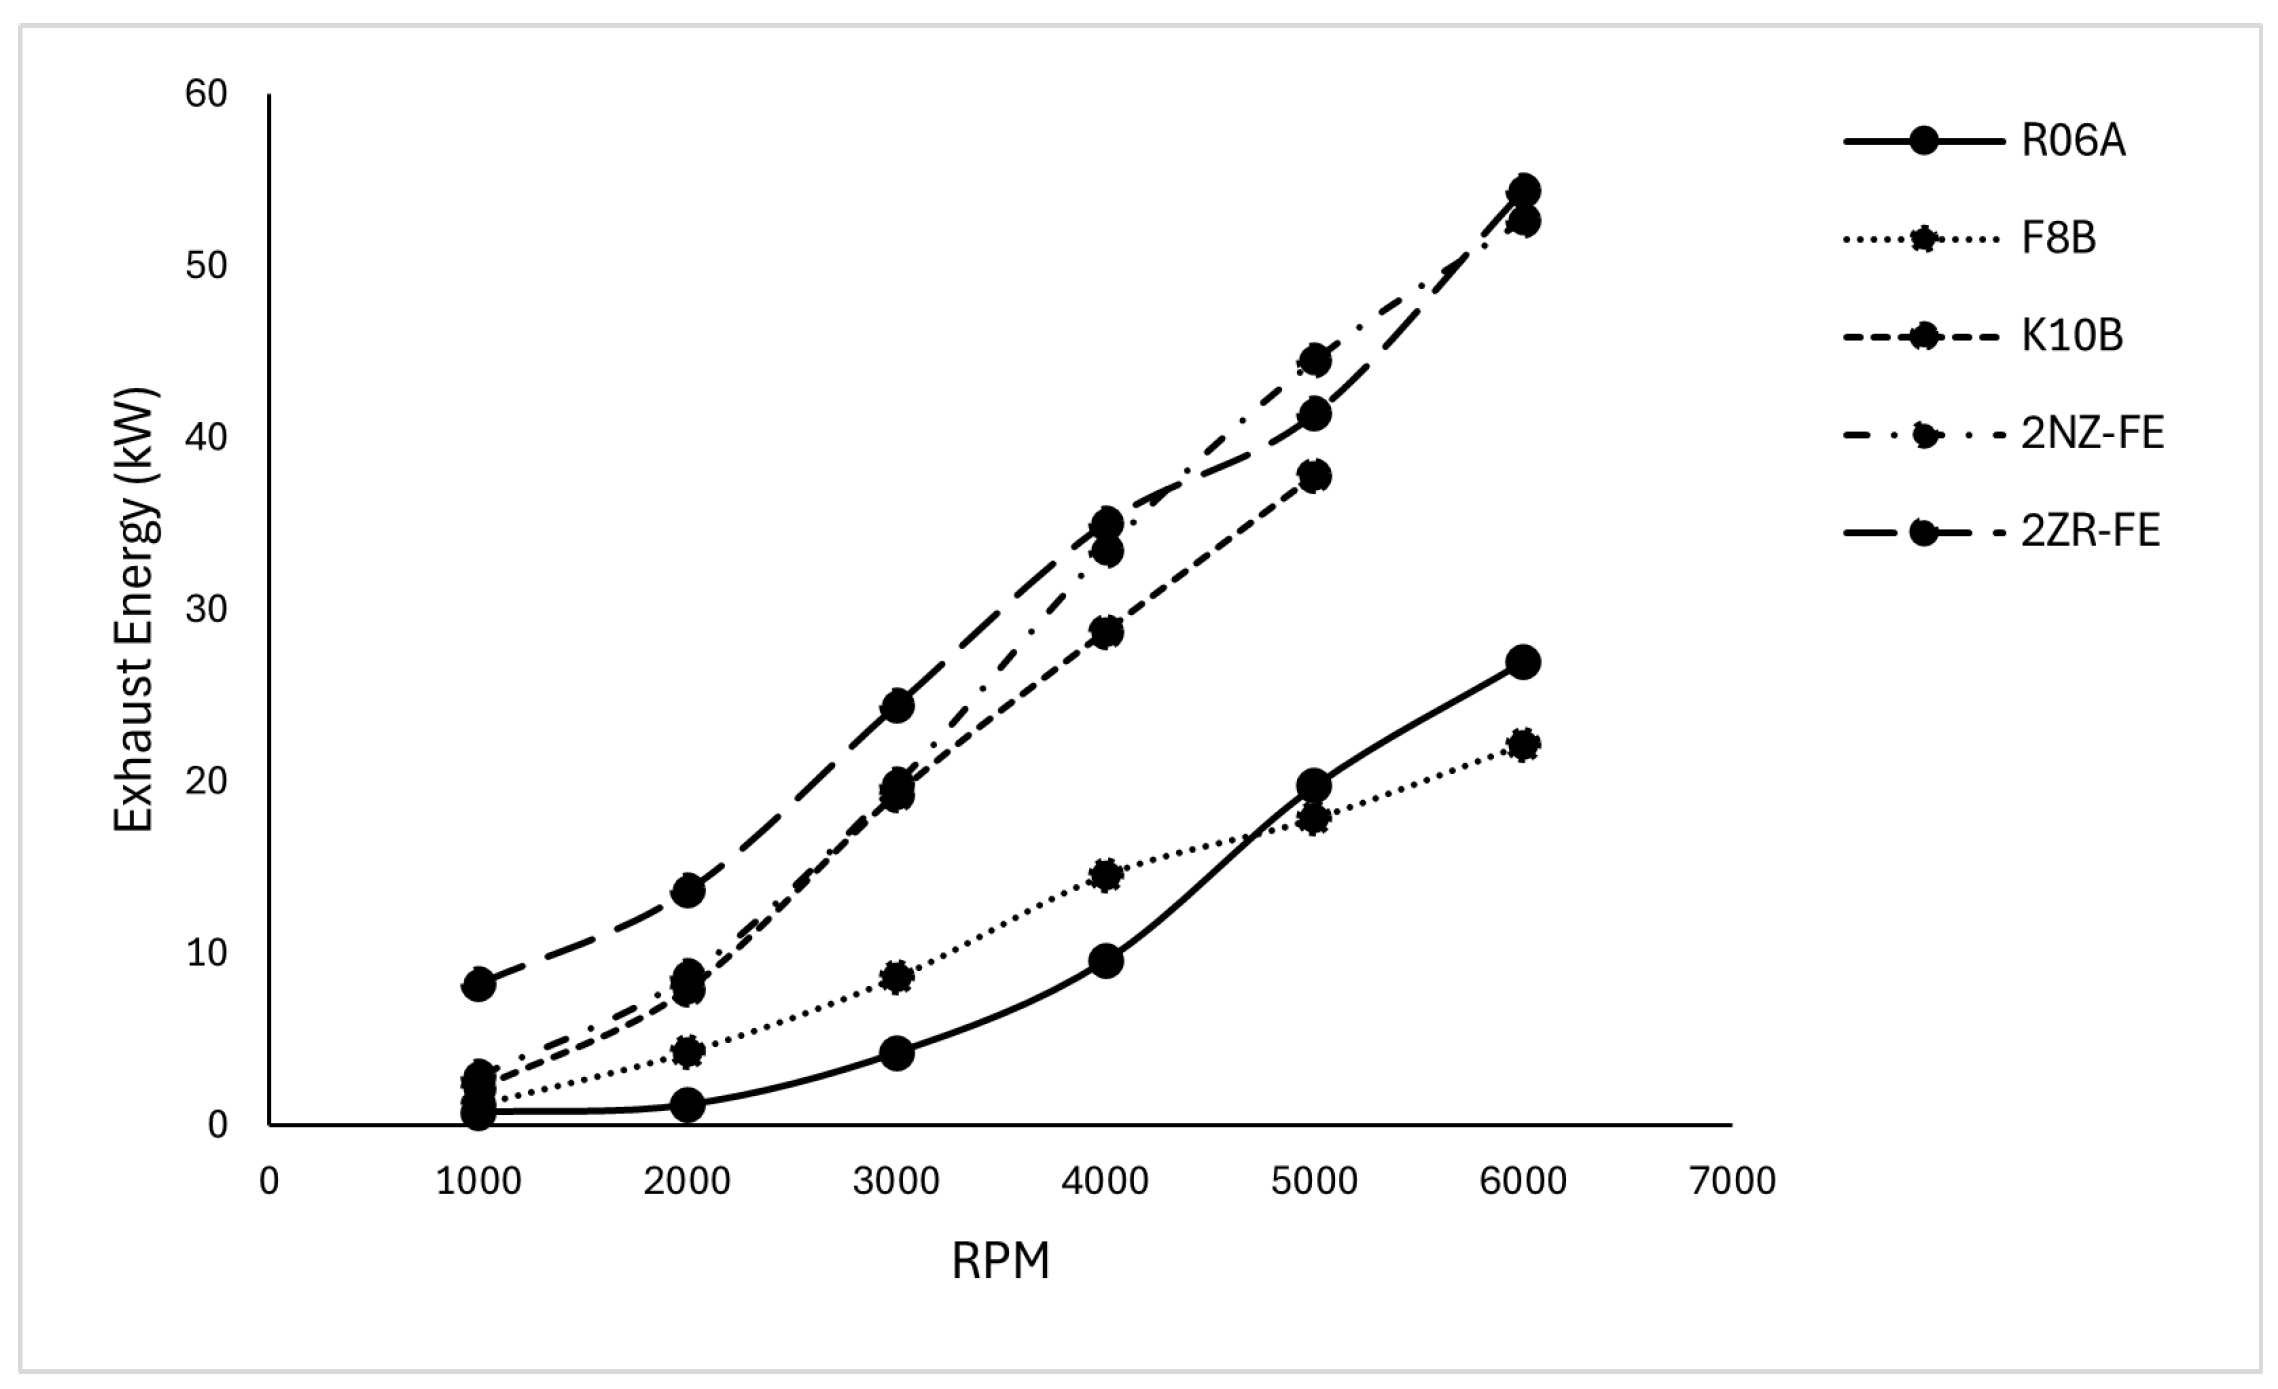
Illustration of variation of energy of exhaust gases (kW) against rpm at full load for the studied ICEs.
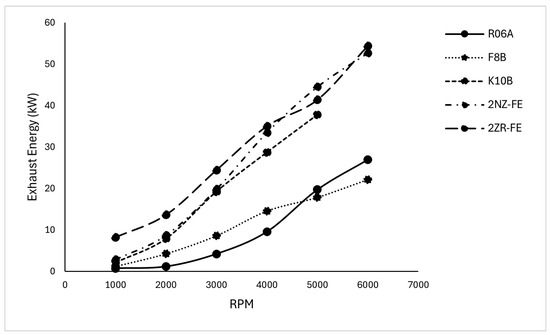
Figure 12.
Illustration of variation of energy of exhaust gases (kW) against rpm at part load for the studied ICEs.

Figure 13.
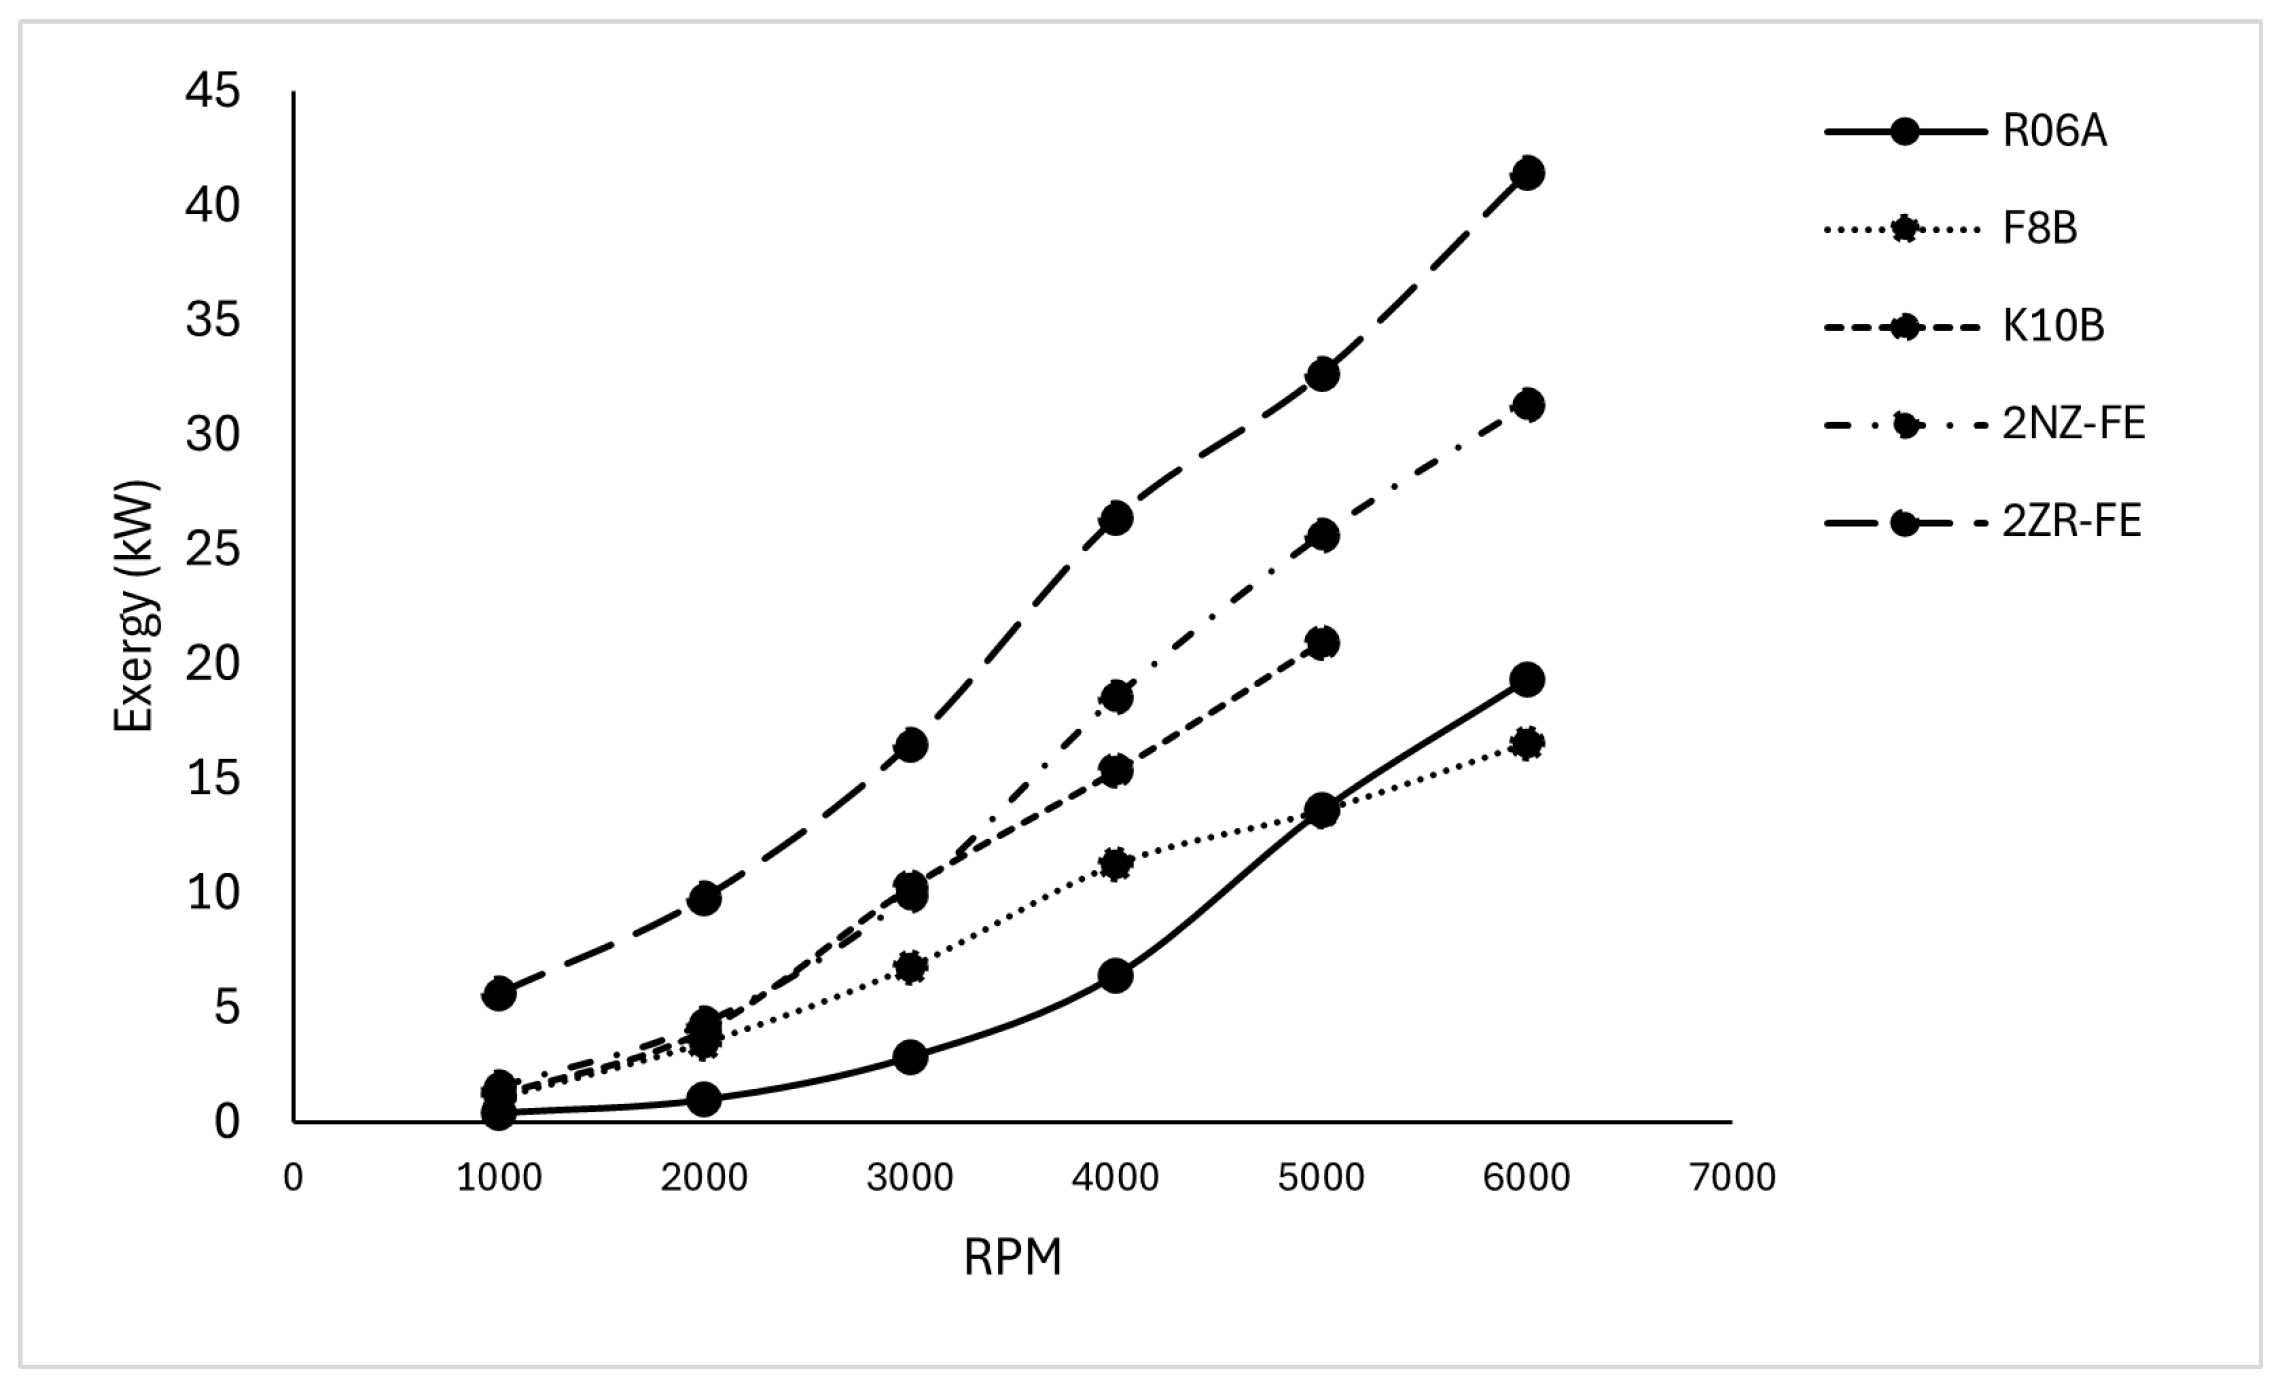
Variation of exergy of exhaust gases (kW) against rpm at full load for the studied ICEs.

Figure 14.
Variation of exergy of exhaust gases (kW) against rpm at part load for the studied ICEs.
Exhaust gas temperatures are plotted at full load and part load against rpm as illustrated in the Figure 7 and Figure 8, respectively.
The mass flow rate of exhaust gases is also the key parameter for designing the E-turbine; therefore, it is plotted at full and part load against rpm, as shown in Figure 9 and Figure 10, respectively.
The energy and exergy of exhaust gases are plotted at full and part load against rpm, as illustrated in Figure 11, Figure 12, Figure 13 and Figure 14.
A prominent trend across all ICEs is the rise in brake power and torque with increasing engine speed up to a certain threshold, beyond which a decline is observed. Initially, increasing ICE speed leads to higher combustion events per unit time, enhancing power output. However, at elevated rpms, increased frictional losses, thermal constraints, and reduced volumetric efficiency contribute to a fall in net brake power and torque. The mass flow rate of the air–fuel mixture and exhaust gases shows a generally increasing trend with ICE speed, consistent with higher combustion rates.
The analysis of exhaust gas parameters, particularly temperature, energy, and exergy, offers critical insight into the thermodynamic efficiency and potential for energy recovery. All ICEs exhibit a monotonically increasing trend in exhaust temperature and exergy with rising rpm. This suggests that at higher speeds, although mechanical efficiency declines, the amount of energy rejected in the exhaust also increases due to incomplete energy conversion within the cylinder. The high exhaust exergy at elevated speeds signifies greater potential for energy recovery.
4.2. Design of E-Turbine System
4.2.1. AC Compressor
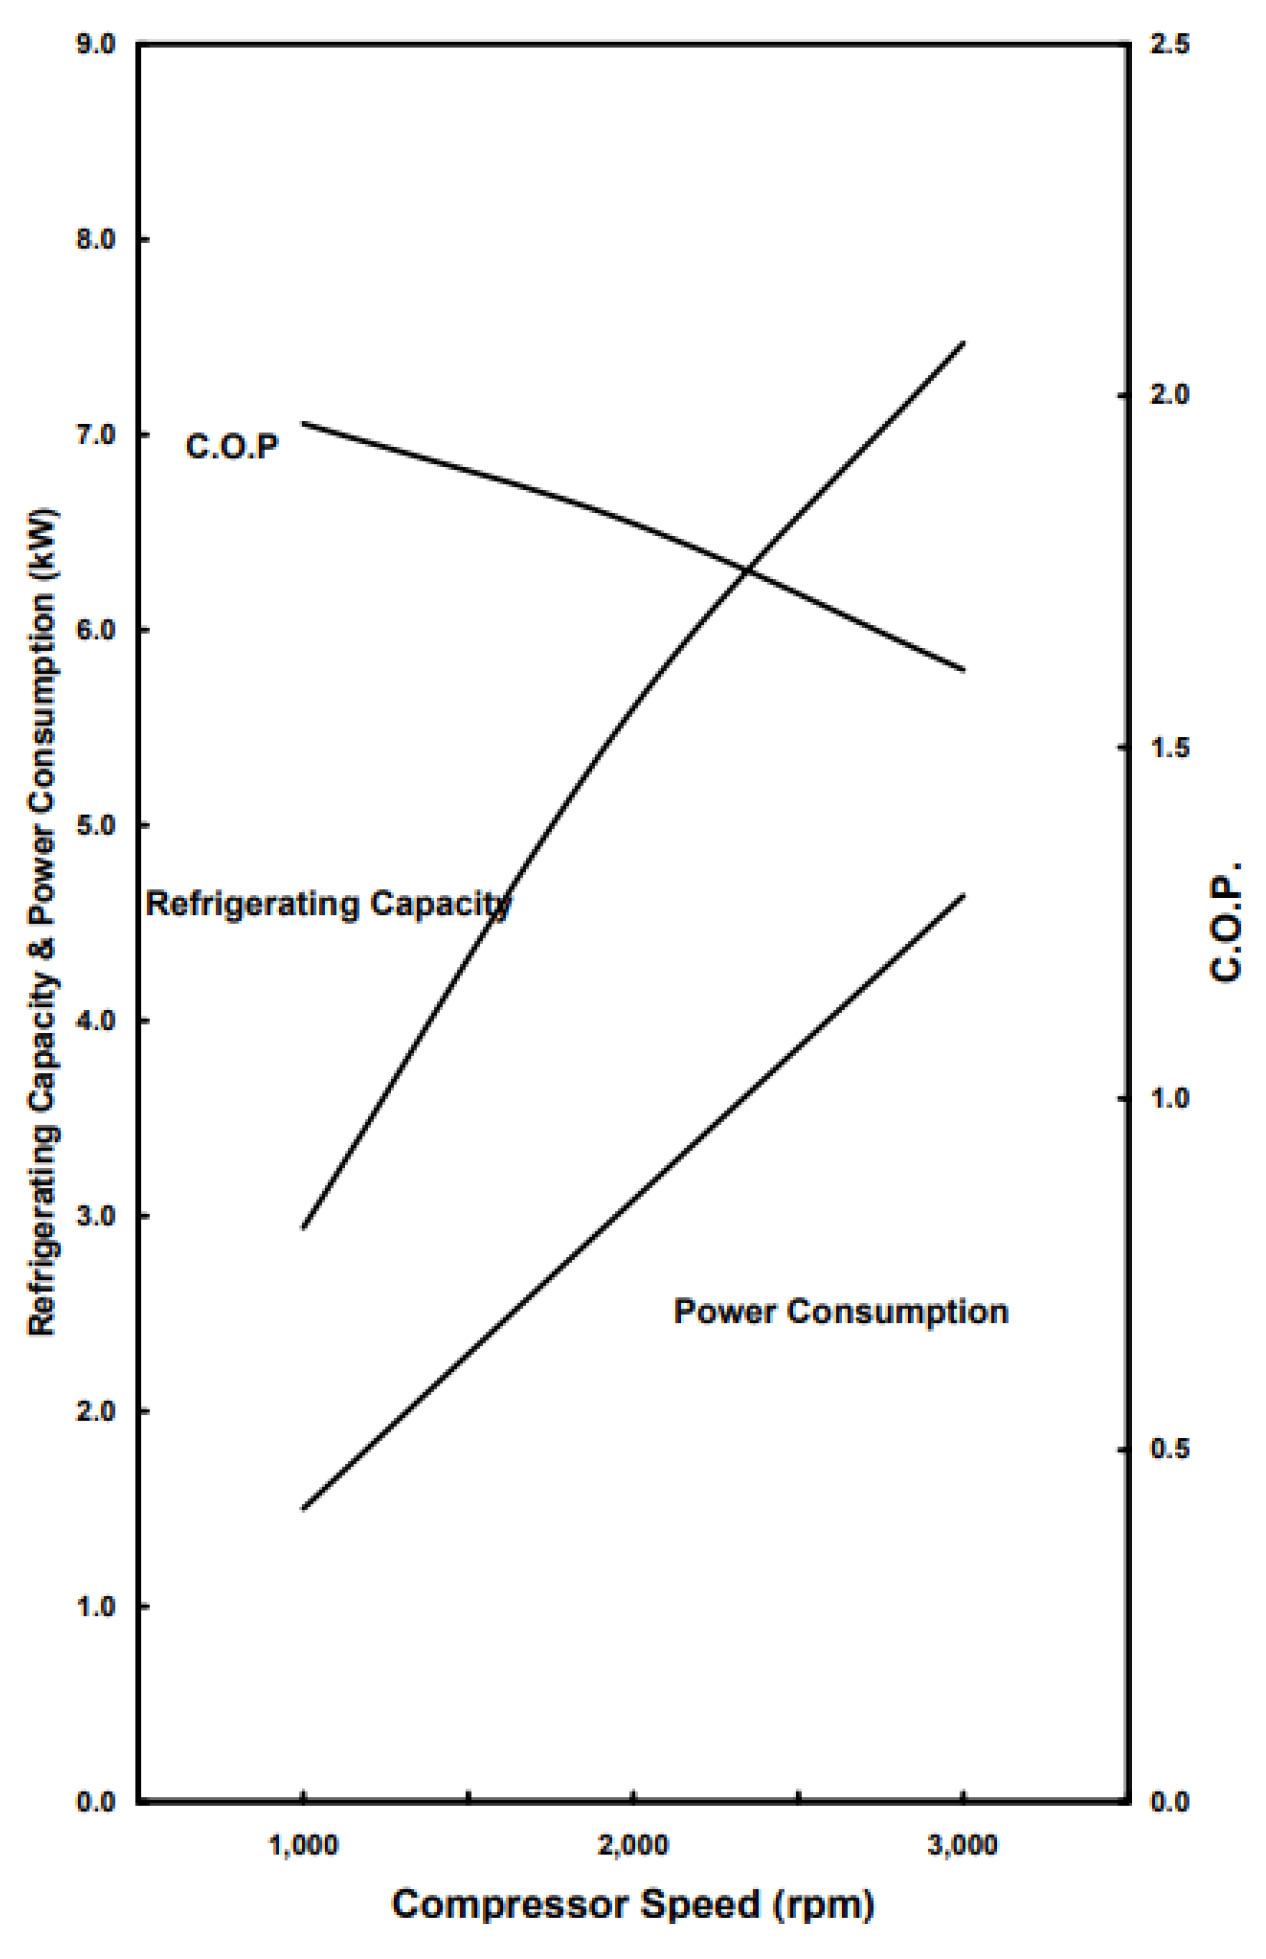
Sanden AC compressors are widely used in automotive vehicles. SD7H15 is chosen for the analysis in this study. The performance map shown in Figure 15 shows that it draws 4–5 kW of shaft power from the ICE operating at its maximum refrigerating capacity [35].
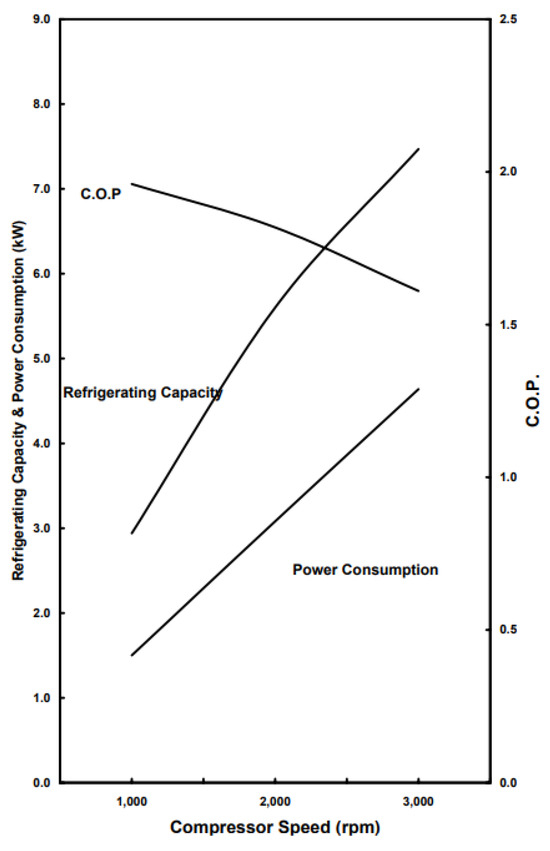
Figure 15.
Performance map of SD7H15 compressor.
4.2.2. Design Point Selection
The K10B ICE operating at a rotational speed of 3500 rpm is selected as the design point for the preliminary sizing of the turbine. This ICE and design point were chosen because engines with this displacement volume are more commonly used. Additionally, the selected design point represents the practical rpm and operating conditions typically encountered during both highway and urban driving. At this operating condition, the exhaust gas exergy is 13.64 kW with a corresponding mass flow rate of 0.06 kg/s. However, to ensure a more compact turbine design, the turbine is sized based on a reduced mass flow rate of 0.04 kg/s.
4.2.3. Preliminary Turbine Sizing
The preliminary turbine sizing has been determined from the – turbine chart (Figure 16). The turbine is selected against = 0.42, = 2, and = 0.77. Using Equations (18) and (19), the diameter of the turbine is 0.061 m, having a blade tip speed of 500 m/s after calculation. The power developed by the turbine is 6.8 kW, which is more than enough to drive the high-speed generator’s shaft and produce the electric current to charge the battery.
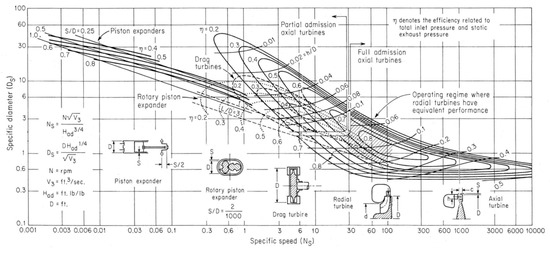
Figure 16.
– turbine chart.
4.2.4. High-Speed Permanent Magnet Synchronous Generator (PMSG)
The high-speed permanent magnet synchronous generator is selected from the literature [36]. PMSG is simple to design because no field excitation circuit is involved, which is complex to design. Mechanical design includes the air gap which is 1.5 mm, and the optimum shaft diameter is 15 mm. The stator has 2 poles and 6 slots. A total of 4 kW of electrical power is produced by the generator, which is then transferred to the battery for charging it.
4.2.5. Battery Sizing
A battery is used to store the electrical energy. The electrical AC compressor of automotive vehicles operates on 12 volts and draws 60 amperes of current. The energy needed to drive the electrical AC compressor is 60 Ah. Other electrical accessories installed in the vehicle are assumed to draw 30 Ah of electrical energy. This power consumption corresponds to the peak load condition. Therefore, the total energy needed from the battery is 90 Ah. A 12-volt battery having an energy storage capacity of 90 Ah is chosen for this study. The state of charge (SOC) is selected as 20%.
The power loss factor between the high-speed generator and battery is taken as 20%, so we multiply the power by 80%, and then the time required to charge the battery is calculated.
The time required to completely recharge the battery is given by
4.2.6. Limitations in the Integration of an E-Turbine as a Retrofit System
There are several limitations and integration challenges associated with implementing an E-turbine as a retrofit system in the exhaust manifold of an automobile. One of the primary concerns is the increase in back pressure resulting from the additional flow resistance introduced by the system. This elevated exhaust pressure can negatively impact engine efficiency. To mitigate this issue, the turbine size was deliberately selected to be smaller than the design mass flow rate, as described in Section 4.2.2, thereby reducing its impact on exhaust dynamics.
Another significant constraint is the limited space available in the vehicle’s underbody for retrofitting additional components. This challenge is addressed by integrating the turbine shaft directly into the PMSG, enabling a more compact and mechanically integrated configuration that enhances system reliability.
Furthermore, the design point was selected to ensure suitability for a wide range of operating environments, including both urban and rural settings. This enables the system to accommodate certain transient load variations. However, for optimal performance under dynamic driving conditions, the implementation of real-time control strategies will be necessary in future developments.
5. Conclusions
The objectives of this study were to perform the energy and exergy analysis of exhaust gases of automobiles and to develop a retrofit E-turbine system to recover the waste energy for driving parasitic loads. In this regard, a comprehensive analysis of the R06A, F8B, K10B, 2NZ-FE, and 2ZR-FE ICEs was performed, focusing on their exhaust energy and exergy characteristics under both full and part load conditions. Across all engines, a consistent trend was observed: brake power and torque increases with engine speed up to a peak point, beyond which mechanical efficiency declines, resulting in reduced output. In contrast, exhaust temperature, energy, and exergy continue to rise with increasing engine speed.
The SD7H15 air conditioning compressor was selected for auxiliary load analysis, and its performance map revealed a shaft power requirement of 4–5 kW under peak operating conditions. Furthermore, the K10B engine operating at 3500 rpm was chosen as the design point for preliminary turbine sizing. While the exhaust exergy at this condition was 13.64 kW with a mass flow rate of 0.06 kg/s, a design mass flow rate of 0.04 kg/s was adopted to maintain a compact turbine size. The designed turbine produced 6.8 kW of power, which was utilized to charge the battery within 17 min and to supply energy to parasitic loads such as the air conditioning (AC) compressor and alternator. This integration can contribute to an overall improvement in fuel economy by reducing the mechanical load on the ICE. However, the E-turbine retrofit system involves certain complexities that may affect the ICE’s exhaust pressure due to the back pressure it generates. Therefore, the system should be designed for specific operating conditions to achieve an optimal balance—minimizing back pressure while maximizing waste heat recovery.
Author Contributions
Conceptualization, M.I.K., L.M. and F.C.; methodology, M.I.K.; software, M.I.K.; validation, M.I.K.; formal analysis, M.I.K.; investigation, M.I.K.; resources, F.C.; data curation, M.I.K.; writing—original draft preparation, M.I.K.; writing—review and editing, M.I.K., L.M. and F.C.; visualization, M.I.K.; supervision, L.M. and F.C.; project administration, F.C. All authors have read and agreed to the published version of the manuscript.
Funding
This research received no external funding.
Data Availability Statement
The original contributions presented in the study are included in the article, further inquiries can be directed to the corresponding author.
Conflicts of Interest
The authors declare no conflicts of interest.
References
- International Energy Agency. Energy Consumption in Transport by Fuel in the Net Zero Scenario, 1975–2030; IEA: Paris, France, 2023; Available online: https://www.iea.org/data-and-statistics/charts/energy-consumption-in-transport-by-fuel-in-the-net-zero-scenario-1975-2030 (accessed on 17 May 2025).
- International Energy Agency. World Energy Outlook 2024; IEA: Paris, France, 2024; Available online: https://www.iea.org/reports/world-energy-outlook-2024 (accessed on 17 May 2025).
- International Energy Agency. Global CO2 Emissions from Transport by Sub-Sector in the Net Zero Scenario, 2000–2030; IEA: Paris, France, 2023; Available online: https://www.iea.org/data-and-statistics/charts/global-co2-emissions-from-transport-by-sub-sector-in-the-net-zero-scenario-2000-2030-2 (accessed on 17 May 2025).
- Heidrich, P.; Krisch, T. Assessment of waste heat recovery options in passenger car applications by various Rankine cycles. Heat Transf. Eng. 2015, 36, 1321–1331. [Google Scholar] [CrossRef]
- Chammas, R.; Clodic, D. Combined Cycle for Hybrid Vehicles; SAE Technical Paper number 2005-01-1171; SAE International: Warrendale, PA, USA, 2005. [Google Scholar]
- Nashville Performance. Impact of Air Conditioning on Fuel Efficiency. 2023. Available online: https://nashvilleperformance.com/impact-of-air-conditioning-on-fuel-efficiency (accessed on 17 May 2025).
- Welstand, J.S.; Haskew, H.H.; Gunst, R.F.; Bevilacqua, O.M. Evaluation of the Effects of Air Conditioning Operation and Associated Environmental Conditions on Vehicle Emissions and Fuel Economy; Technical Report 2003-01-2247; SAE International: Warrendale, PA, USA, 2003. [Google Scholar]
- Heywood, J.B. Internal Combustion Engine Fundamentals; McGraw-Hill Education: New York, NY, USA, 1988. [Google Scholar]
- National Research Council. Cost, Effectiveness, and Deployment of Fuel Economy Technologies for Light-Duty Vehicles; The National Academies Press: Washington, DC, USA, 2015. [Google Scholar]
- Armstead, J.R.; Miers, S.A. Review of waste heat recovery mechanisms for internal combustion engines. J. Therm. Sci. Eng. Appl. 2014, 6, 014001. [Google Scholar] [CrossRef]
- Schwitzer. Introduction to Turbochargers; Schwitzer Turbochargers: Indianapolis, IN, USA, 1991. [Google Scholar]
- Baines, N.C. Fundamentals of Turbocharging; Concepts NREC: White River Junction, VT, USA, 2005. [Google Scholar]
- He, W.; Zhang, G.; Zhang, X.; Zhao, X.; Xu, J.; Li, G. Recent development and application of thermoelectric generator and cooler. Appl. Energy 2015, 143, 1–25. [Google Scholar] [CrossRef]
- Snyder, G.J.; Toberer, E.S. Complex thermoelectric materials. Nat. Mater. 2008, 7, 105–114. [Google Scholar] [CrossRef] [PubMed]
- Demir, M.; Dincer, I. Performance assessment of a thermoelectric generator applied to exhaust waste heat recovery. Appl. Therm. Eng. 2017, 120, 694–707. [Google Scholar] [CrossRef]
- Shi, L.; Shu, G.; Tian, H.; Deng, S. A review of modified Organic Rankine cycles (ORCs) for internal combustion engine waste heat recovery (ICE-WHR). Renew. Sustain. Energy Rev. 2017, 68, 638–658. [Google Scholar] [CrossRef]
- Sprouse, C.; Depcik, C. Review of Organic Rankine Cycles for Internal Combustion Engine Exhaust Waste Heat Recovery. Appl. Therm. Eng. 2013, 51, 711–722. [Google Scholar] [CrossRef]
- Xie, J.; Wang, L. Waste heat recovery technologies in internal combustion engines: A review. Energy 2012, 38, 8–16. [Google Scholar]
- Moore, S. The Current State of the Global Automotive Manufacturing Market. AZoM 2022. Available online: https://www.azom.com/article.aspx?ArticleID=22236 (accessed on 14 May 2025).
- Hedges Company. How Many Cars Are There in the World in 2023? 2023. Available online: https://hedgescompany.com/blog/2021/06/how-many-cars-are-there-in-the-world/ (accessed on 14 May 2025).
- International Energy Agency. Global EV Outlook 2023; IEA: Paris, France, 2023. [Google Scholar]
- Rowe, D.M. (Ed.) Thermoelectrics and Its Energy Harvesting; CRC Press: Boca Raton, FL, USA, 2018. [Google Scholar]
- Snyder, G.J. Small Thermoelectric Generators. Electrochem. Soc. Interface 2008, 17, 54–56. [Google Scholar] [CrossRef]
- Quoilin, S.; Van Den Broek, M.; Declaye, S.; Dewallef, P.; Lemort, V. Techno-economic Survey of Organic Rankine Cycle (ORC) Systems. Renew. Sustain. Energy Rev. 2013, 22, 168–186. [Google Scholar] [CrossRef]
- Tchanche, B.F.; Lambrinos, G.; Frangoudakis, A.; Papadakis, G. Low-grade Heat Conversion into Power Using Organic Rankine Cycles—A Review of Various Applications. Renew. Sustain. Energy Rev. 2011, 15, 3963–3979. [Google Scholar] [CrossRef]
- Ghojel, J.I. Review of the Development and Applications of the Wiebe Function: A Tribute to the Contribution of Ivan Wiebe to Engine Research. Int. J. Engine Res. 2010, 11, 297–312. [Google Scholar] [CrossRef]
- Stobart, R.K. An availability approach to thermal energy recovery in vehicles. Proc. Inst. Mech. Eng. Part D J. Automob. Eng. 2007, 221, 1011–1021. [Google Scholar] [CrossRef]
- Yadav, R.M.; Berwal, A.K. Availability Analysis in the Exhaust of Multi Cylinder Gasoline Engine. IAETSD J. Adv. Res. Appl. Sci. 2018, 5, 122–128. [Google Scholar]
- Moran, M.J.; Shapiro, H.N.; Boettner, D.D.; Bailey, M.B. Fundamentals of Engineering Thermodynamics, 7th ed.; Wiley: Hoboken, NJ, USA, 2010. [Google Scholar]
- Dincer, I.; Rosen, M.A. Exergy: Energy, Environment and Sustainable Development; Elsevier: Amsterdam, The Netherlands, 2012. [Google Scholar]
- Szargut, J.; Morris, D.R.; Steward, F.R. Exergy Analysis of Thermal, Chemical, and Metallurgical Processes; Hemisphere Publishing: New York, NY, USA, 1988. [Google Scholar]
- Dixon, S.L.; Hall, C.A. Fluid Mechanics and Thermodynamics of Turbomachinery, 6th ed.; Butterworth-Heinemann: Oxford, UK, 2005. [Google Scholar]
- The MathWorks Inc. ODE23-Solve Differential Equations Using 2nd and 3rd Order Runge-Kutta. 2025. Available online: https://www.mathworks.com/help/matlab/ref/ode23.html (accessed on 24 April 2025).
- Peng, Z.; Wang, T.; He, Y.; Yang, X.; Lu, L. Analysis of environmental and economic benefits of integrated Exhaust Energy Recovery (EER) for vehicles. Appl. Energy 2013, 105, 238–243. [Google Scholar] [CrossRef]
- Sanden International (Singapore) Pte Ltd. Sanden Singapore SD7 Series Compressor Catalogue; Sanden International (Singapore) Pte Ltd.: Singapore, 2011. [Google Scholar]
- Akhave, A.; Chrysakis, G.; Gupta, A. Design and evaluation of a turbo-generator as an auxiliary power unit for hybrid vehicles. In Proceedings of the 5th IET Hybrid and Electric Vehicles Conference (HEVC 2014), London, UK, 5–6 November 2014; pp. 1–7. [Google Scholar]


Disclaimer/Publisher’s Note: The statements, opinions and data contained in all publications are solely those of the individual author(s) and contributor(s) and not of MDPI and/or the editor(s). MDPI and/or the editor(s) disclaim responsibility for any injury to people or property resulting from any ideas, methods, instructions or products referred to in the content. |
© 2025 by the authors. Licensee MDPI, Basel, Switzerland. This article is an open access article distributed under the terms and conditions of the Creative Commons Attribution (CC BY) license (https://creativecommons.org/licenses/by/4.0/).