Abstract
This paper proposes a practical framework for developing a net-zero electricity mix scenario (NEMS), which considers detailed conditions for supply of each energy. NEMS means a path scenario for power generation amount by year of each generation resource required to achieve carbon neutrality in 2050. NEMS framework refers to a methodological framework that contains procedures and requirements to continuously update the NEMS by comprehensively reflecting policy changes. For evaluation of NEMS, indicators such as a system inertia resource ratio (SIRR) and a fuel conversion rate (FCR) are proposed. The proposed framework and indicators are applied for the 2050 NEMS in Korea’s electricity sector. The SIRR, indicating the ratio of inertial resources to total resources, projects values of 49% and 15% for the years 2030 and 2050, respectively. Furthermore, the FCR, reflecting the ratio of fuel conversion for resources undergoing this process, predicts that all targeted resources will have completed conversion by the year 2043.
1. Introduction
South Korea’s electricity mix (EM) has been greatly influenced by government-led policy decisions. A representative policy is the Basic Plan for Long-Term Electricity Supply and Demand (BPE), which has been established every 2 years since 2002 under the Electricity Business Act [1]. The plan includes generation and capacity forecasts for each power source for the next 15 years. In particular, the target quantities of nuclear power and new and renewable energies (NRE), referred to as “policy power sources,” are reflected in a separate procedure. In September 2021, the government established a policy decision aimed at heavily influencing the long-term energy mix in South Korea for the next 30 years. It legislated the Framework Act on Carbon Neutrality and Green Growth for coping with climate crisis (Carbon Neutrality Act) and devised energy mix plans, namely the 2030 Nationally Determined Contribution (NDC) Enhancement Plan and 2050 Carbon Neutrality Scenario Plan, based on the bill [2,3]. Both plans include the EM forecasts for 2030 (the first target year) and 2050 (the final target year), with the goal of achieving carbon neutrality by 2050. Accordingly, to gauge the future changes in the electricity supply environment and forecast the EM, a preliminary review of these major plans is essential.
1.1. Review of the 2050 Carbon Neutrality Scenario and 2030 Nationally Determined Contribution (NDC) Enhancement Plans
In October 2020, the South Korean government announced its goal to achieve carbon neutrality by 2050. Following this announcement, from January 2021 to June 2021, a technical working group of 10 sub-sectors developed a draft of the carbon neutrality scenario. In August 2021, the Presidential Carbon Neutrality Committee deliberated on the draft. The public’s opinion was collected through the Carbon Neutrality Citizens’ Assembly until September 2021 and through the second plenary meeting of the Carbon Neutrality Committee conducted in October 2021, and the 2050 Carbon Neutrality Scenario Plan and 2030 NDC Enhancement Plan were finally, deliberated on and resolved.
According to the 2030 NDC Enhancement Plan, the target reduction in carbon emissions from 2018 to 2030 is set at 40%, in which the electricity sector has a higher target reduction (44.4%). This is high, relative to the targets set for other high-emitting sectors, such as the industrial (14.5%), building (32.8%), and transportation (37.8%) sectors. The aim of the plan is to reduce indirect emissions (from electricity usage), based on the decarbonization of the electricity sector and the electrification of various sectors. This direction was adopted by not only South Korea, but also several other countries worldwide. The International Energy Agency cites electrification as a key pillar of the decarbonization strategy in a net-zero scenario, along with energy efficiency and behavioral changes. Notably, the agency states that the electricity sector must reach carbon neutrality by 2040, to achieve carbon neutrality by 2050 [4].
The forecasted electricity consumption for 2030 is 612.4 TWh (transmission end); the EM to meet this is nuclear energy (23.9%), coal (21.8%), liquefied natural gas (LNG) (19.5%), NRE (30.2%), ammonia-fueled energy (3.6%), and energy from other resources (1.0%). Note that a blend of coal fuel is planned to be used for ammonia power generation in 2030 [5]. Compared to the 9th BPE established in 2020, the proportions of nuclear energy, coal, and LNG are reduced by 1.1%, 8.1% and 3.8%, respectively, whereas those of NRE and ammonia-fueled energy have been increased by 9.4% and 3.6%, respectively. Hence, the share of coal power has been reduced greatly, whereas that of NRE has been increased. The share of renewable energy (wind, solar, hydro, marine energy, and bioenergy) is approximately 27%, up 8 percentage points from that considered in the 9th BPE. Notably, major revisions to the existing power plans are unavoidable, to keep up with the ever-changing energy trends and demands of the country.
In the 2050 Carbon Neutrality Scenario, the renewable energy target for 2050 is approximately 890 TWh (based on sales consumption), nearly 31 times higher than the consumption in 2020 (29 TWh). Based on a simple estimate, renewable energy must be expanded by ~20 GW/year to achieve this goal. However, if the expansion of renewable energy accelerates, the proportion of synchronous generators in the power system will decrease, resulting in instability problems, such as reduced system inertia. The European Union (EU)-funded project called Massive InteGRATion of power Electronic devices (MIGRATE) has already reported a related issue [6]. Building a net-zero power grid in the future requires managing the problem of reduced system inertia.
The 2050 electricity consumption forecast is 1257.7 TWh (end-user), and the 2050 net-zero EM target required meet this is consumption is 6.1% nuclear energy, 0% coal, 0% LNG, 70.8% renewable energy, 1.4% fuel cells, 21.5% carbon-free turbines, and 0.3% byproduct gas. Note that in this mix, all sources, except for nuclear energy and byproduct gas, are classified as NRE, with NRE comprising of approximately 94% of the total EM in 2050. Carbon-free turbines use hydrogen or ammonia, rather than conventional fossil fuels, for power generation. Fuel conversion through carbon-free turbines is important to not only simply the use of carbon-free fuels, but also minimize the formation of stranded assets from existing power facilities. Overall, to establish a net-zero power grid in the future, it is necessary to manage the fuel conversion for each power source.
1.2. Review of 9th Basic Plan for Long-Term Electricity Supply and Demand (BPE)
To forecast the mid- to long-term electricity demand and expand the electricity facilities in South Korea accordingly, the BPE is established every 2 years, in accordance with Article 25 of the Electricity Business Act and Article 15 of the Enforcement Decree. The 1st BPE was established in 2002. The establishment process is as follows: A working group first creates a draft and then performs a strategic environmental impact assessment, after which a government draft is finally prepared through ministry consultation. The Standing Committee of the National Assembly then prepares a report and holds a public hearing; the report is finalized through deliberations with the Electricity Policy Deliberation Council. The plan is established based on the letters of intent regarding the investment in new facilities (submitted by power producers); coal, nuclear, and NRE, which are policy power sources, can be counted toward the target without additional evaluation.
Figure 1 shows the share of NRE generation from 2021 to 2034, as per the 9th BPE. According to the future growth of NREs above the 20% baseline in 2021, the share of bioenergy will decrease from ~25% in 2021 to ~9% in 2024, whereas the combined share of PV (photovoltaic) and wind, which are volatile resources, will increase from ~52% to ~73%. The forecasts for wind and PV resources in each version of BPE vary greatly. Wind power forecasts declined from the 8th to the 9th plans, by ~41% in 2021 and by ~6% in 2030. PV power forecasts increased from the 8th to the 9th plans, by ~59% in 2021 and by ~36% in 2030. Note that even though the forecasts indicate an increase in the energy derived from PV resources, PV power has surpassed the annual supply target for the past 4 years (2019–2022).
Figure 1.
Share of new and renewable energies (NRE) generation by type from 2021 to 2034; integrated coal gasification combined cycle (IGCC), Photovoltaic (PV).
Among all the resources having a small share, hydropower and marine energy remained at their current levels, or increased slightly, but their relative shares were forecasted to decline after 2021. In general, hydropower is classified into conventional hydro (large and medium) and small hydro. The latter can be installed at small scales; thus, site selection and approval are easier in small hydro, compared to conventional hydropower. Therefore, the generation and capacity of hydropower is increasing every year. There are no plans to install additional integrated gasification combined cycle (IGCC) capacity until 2034. Note that IGCC generates less pollutants and carbon dioxide emissions than coal but is not a carbon-free power source. The BPE considers such resource-specific characteristics when developing novel plans.
1.3. Proposal
A net-zero electricity mix scenario (NEMS) refers to the yearly forecasts of power generation (by source) required to achieve carbon neutrality by 2050. Based on the previous review, the following are three major considerations required when establishing a practical NEMS.
- A framework that continuously reflects the changes in EM-related energy plans must be established.
- Domestic characteristics regarding the supply of each energy source must be considered.
- Management of the scale of system inertia and fuel-conversion levels is necessary.
To effectively consider the first and second points, a practical framework is required to identify and reflect the different energy-specific policy/practical changes, when devising a domestic NEMS through a pragmatic approach. Additionally, it is important to continuously update the framework in the future. The literature on the NEMS framework contains case studies on several countries, including Portugal, Iran, Chile, and the United Kingdom [7,8,9,10,11,12,13]. They focus mainly on “evaluating and analyzing” the policy effects, scenario-specific costs, and macro-environmental impacts. Among these studies, Pina et al. [8] and Gaete-Morales et al. [9] cover the NEMS establishment framework. Pina et al. [8] carried out a case study of Portugal by applying an NRE investment planning framework while considering fossil-fuel and technology prices and NRE characteristics. To analyze the NEMS for Chile, Gaete-Morales et al. [9] applied an NRE supply planning framework, based on an integrated model that could optimize generation expansion planning and economic dispatch planning. Additionally, in previous studies, authors applied NEMS-related evaluation methodologies and analyses methods to forecast the EM of South Korea [14,15,16]. Most of these studies focused on evaluating the policies and scenarios related to sustainability and emission reduction effects. Min et al. [16] applied an advanced framework for calculating the EM of South Korea and evaluating its flexibility and reliability, based on the operational generation plan. However, they focused on a scenario analysis and did not consider the characteristics of each power source and the type NRE, which is important given South Korea’s policymaking approach.
In this study, we propose a practical framework for developing a practical NEMS framework for South Korea. The NEMS calculation process for the proposed framework comprised three steps. First, we forecasted the total electricity consumption and demand patterns by year; second, we projected the generation and capacity by NRE type and region; and third, we estimated the generation and capacity of all the resources subject to fuel conversion and nuclear power. Moreover, to reflect the third consideration when establishing a viable NEMS, we propose using the system inertia resource ratio (SIRR) and fuel conversion rate (FCR) as evaluation and management indicators. In this study, these indicators were applied to the NEMS results for South Korea.
The structure of this paper is as follows. Section 2 outlines the proposed practical framework for the NEMS developed for South Korea. Section 3 explains the forecast of the total electricity consumption and demand patterns for the country by year, based on the proposed framework. In Section 4, we explain the forecast for the generation and capacity of all the resources by NRE type and region. In Section 5, we provide the forecasts of the generation and capacity of all the resources, subject to fuel conversion and nuclear power while calculating the SIRR and FCR for the base year. Section 6 explains the major conclusions of this study.
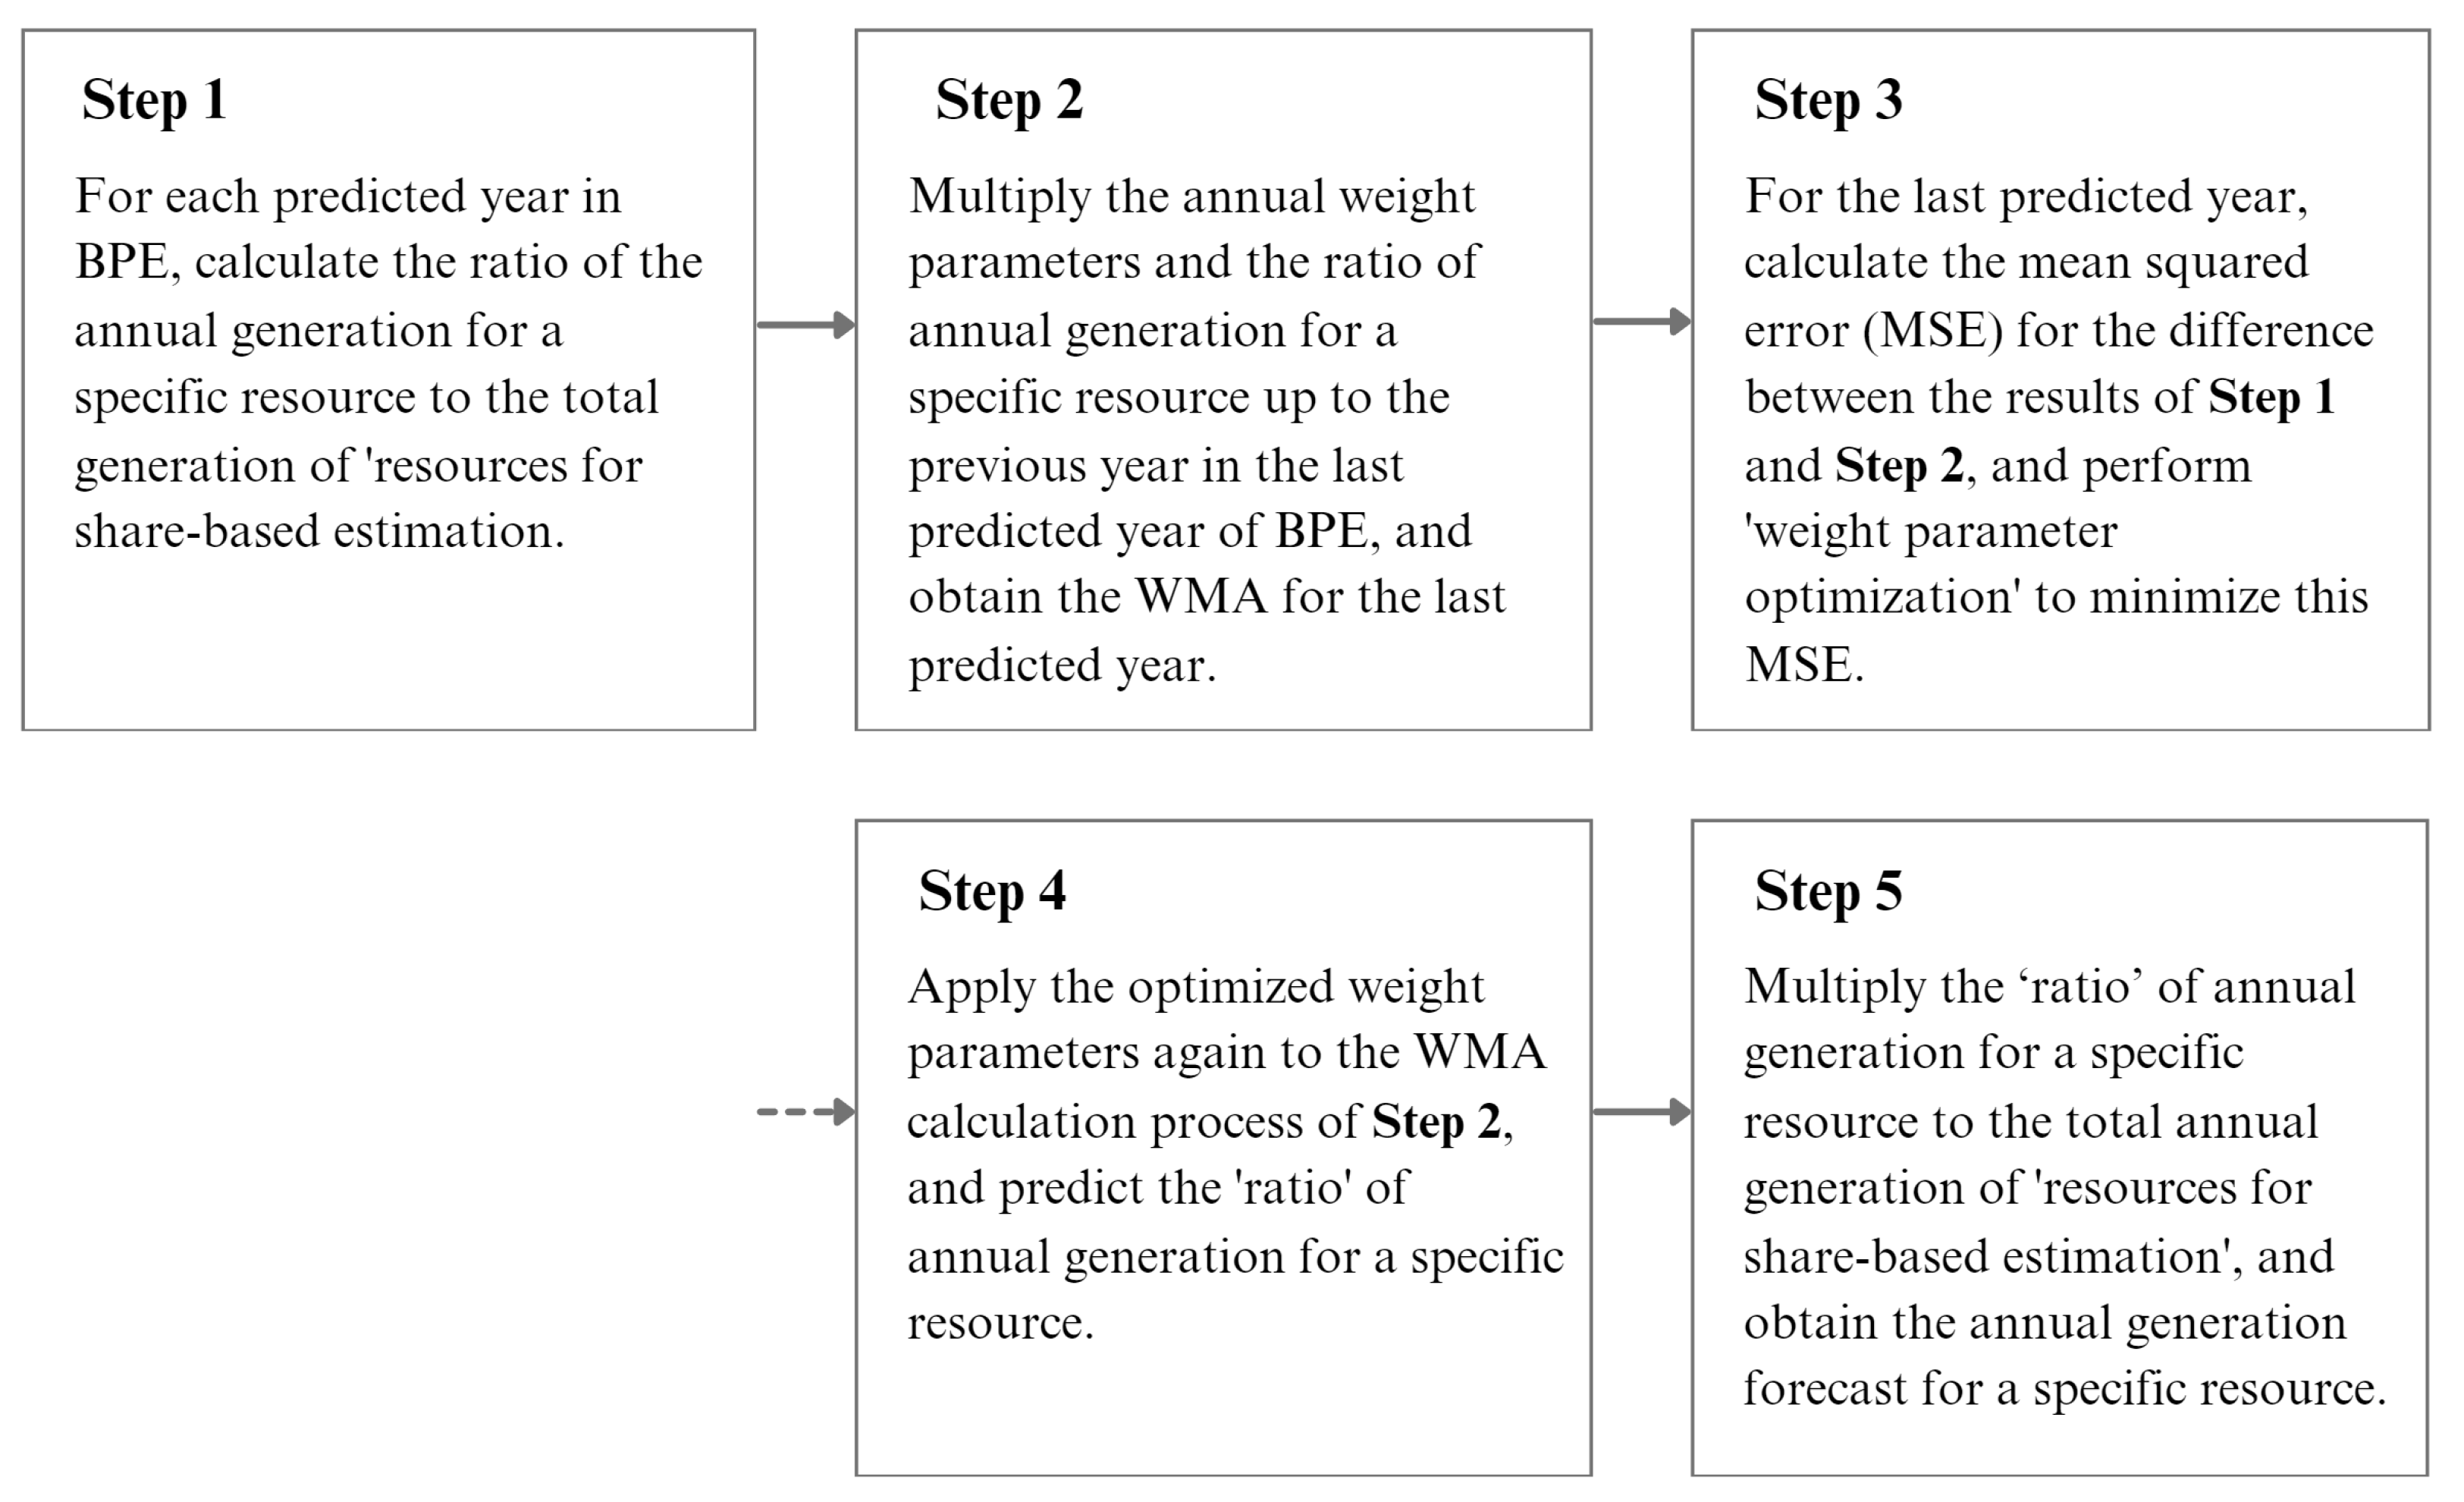
2. Overview of the Proposed Practical Net-Zero Electricity Mix Scenario (NEMS) Framework for South Korea
Figure 2 shows the step-by-step methodology applied for developing the NEMS for South Korea proposed in this study. Further details of each step are explained below.
Figure 2.
Practical framework for net-zero electricity mix scenario (NEMS) for South Korea proposed in this study; compound annual growth rate (CAGR), demand pattern forecast algorithm (DPFA), weighted moving average (WMA), system inertia resource ratio (SIRR), and fuel conversion rate (FCR).
First, we forecasted the total electricity consumption and demand patterns of South Korea. A compound annual growth rate (CAGR) based on the base-year forecast was applied, to calculate the total electricity consumption for each year. The CAGR is a measure used to represent the annualized rate of return for an investment or business over a specified period, assuming that the growth occurs steadily and consistently throughout that time frame. To forecast the demand pattern, the demand pattern forecast algorithm (DPFA) method was applied to the most recent annual demand pattern.
Second, we forecasted the NRE generation and capacity for South Korea. The total NRE generation was calculated by applying the CAGR based on the base-year forecasts. To calculate the NRE generation by type and region, we used the share of generation of all the NRE types estimated using a forecasting technique that was based on weighted moving average (WMA) and the share of generation for all the regions calculated from the most recent data. Furthermore, the capacity of each NRE type and region was calculated using the capacity factor estimated by the WMA-based forecasting technique. However, the capacity forecasts excluded the generation of NREs for fuel conversion used in the form of mixed or full combustion. This is because no additional facilities are needed for these types of power generation.
Finally, we forecasted the generation and capacity of all the resources, subject to fuel conversion and nuclear power. The NRE generation pattern (estimated separately) was subtracted from the demand pattern obtained in Step 1, to obtain the net load pattern. Based on this net load pattern, the annual operational generation schedule was established, to obtain the annual generation of resources subject to fuel conversion and nuclear power. The annual capacities of these resources were generally determined based on the commissioning and decommissioning dates, based on the generation source specified in the BPE. However, these estimations may be adjusted according to the rate of fuel conversion. Finally, based on the proposed SIRR and FCR indicators, the scale of system inertia and the fuel conversion level of the NEMS were evaluated.
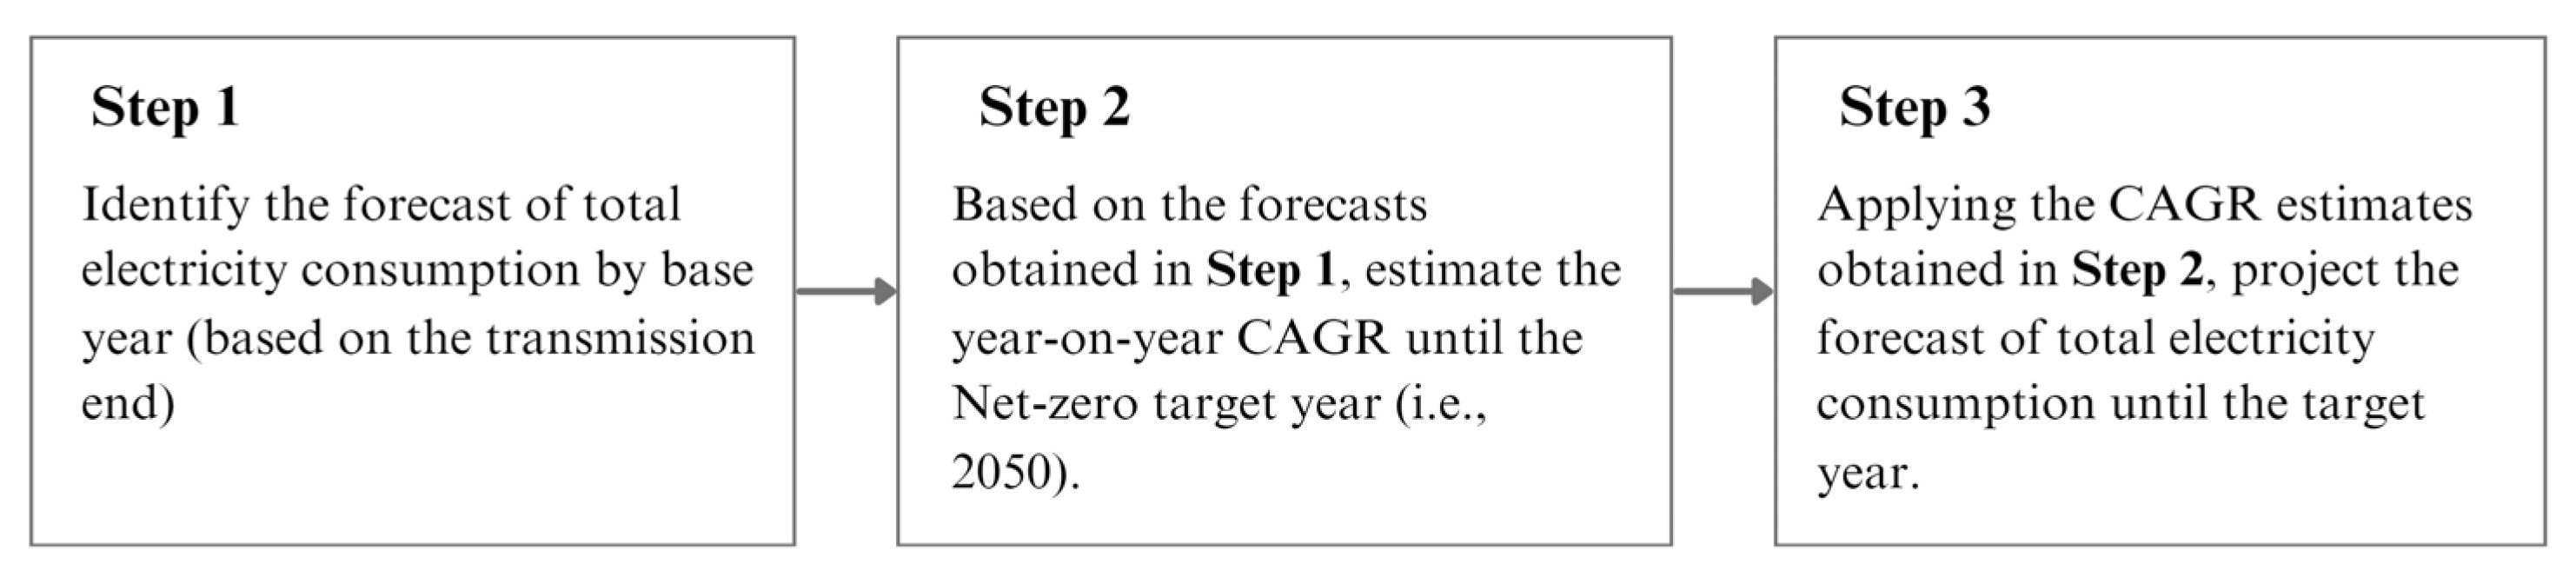
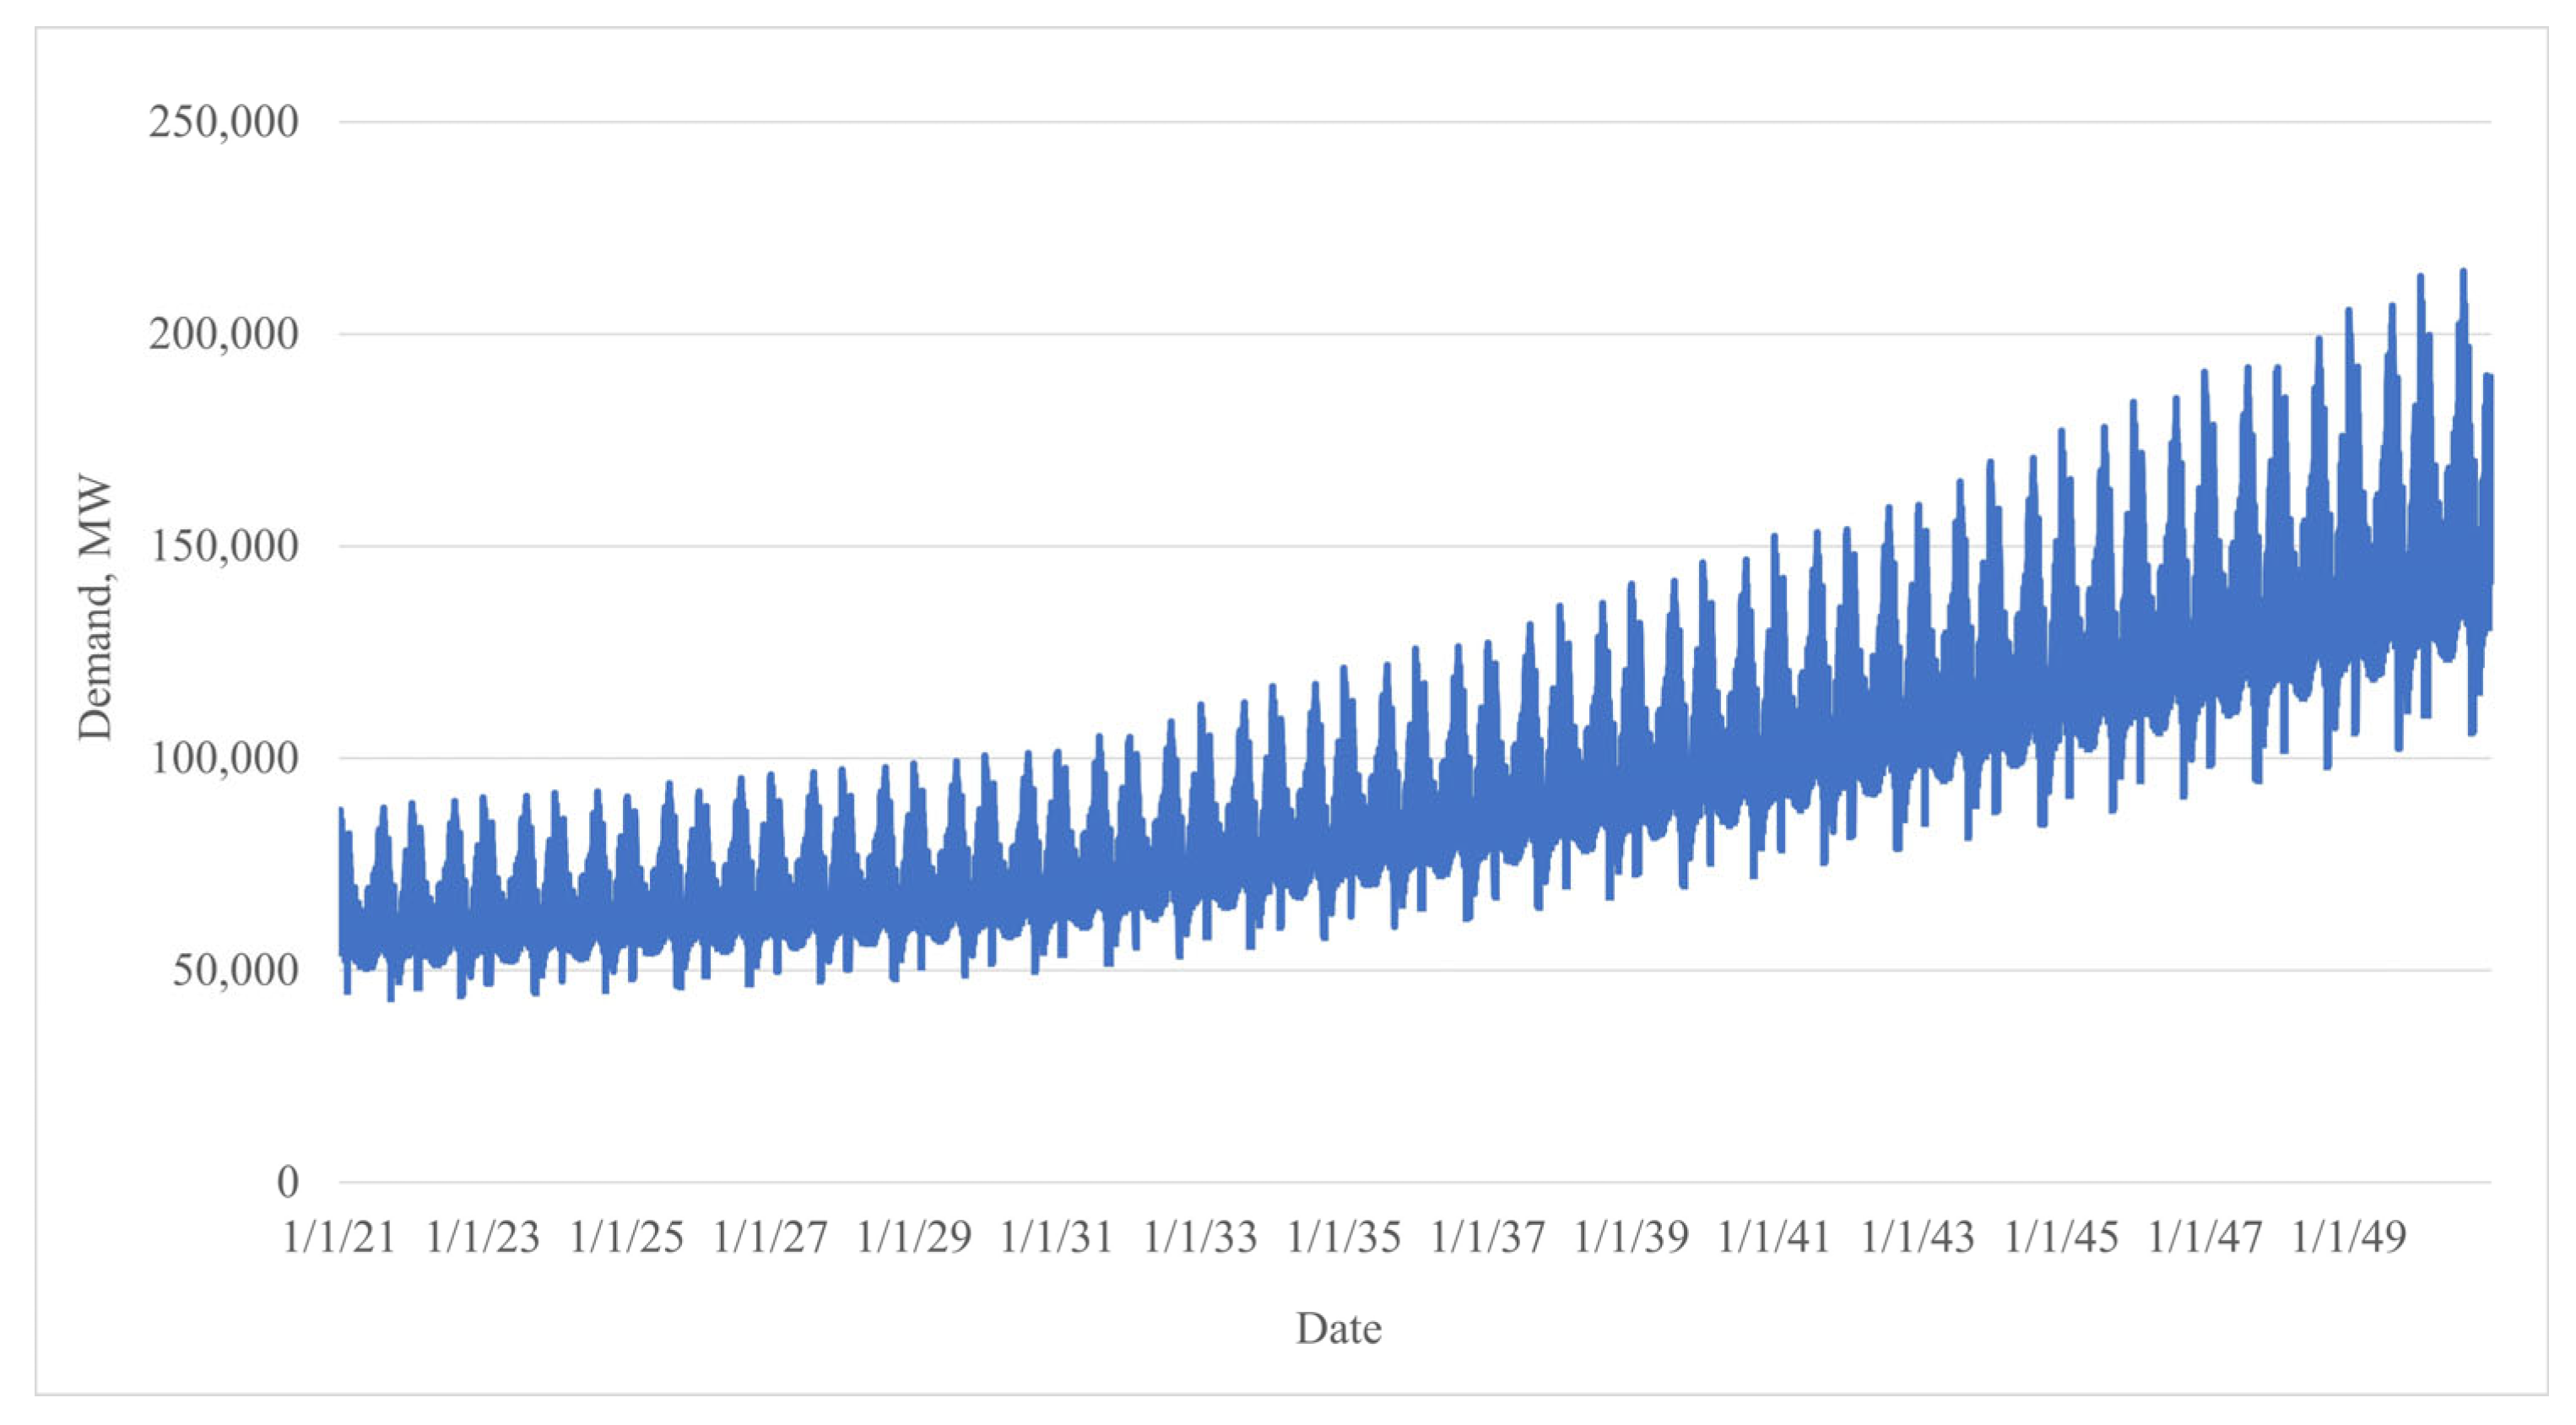
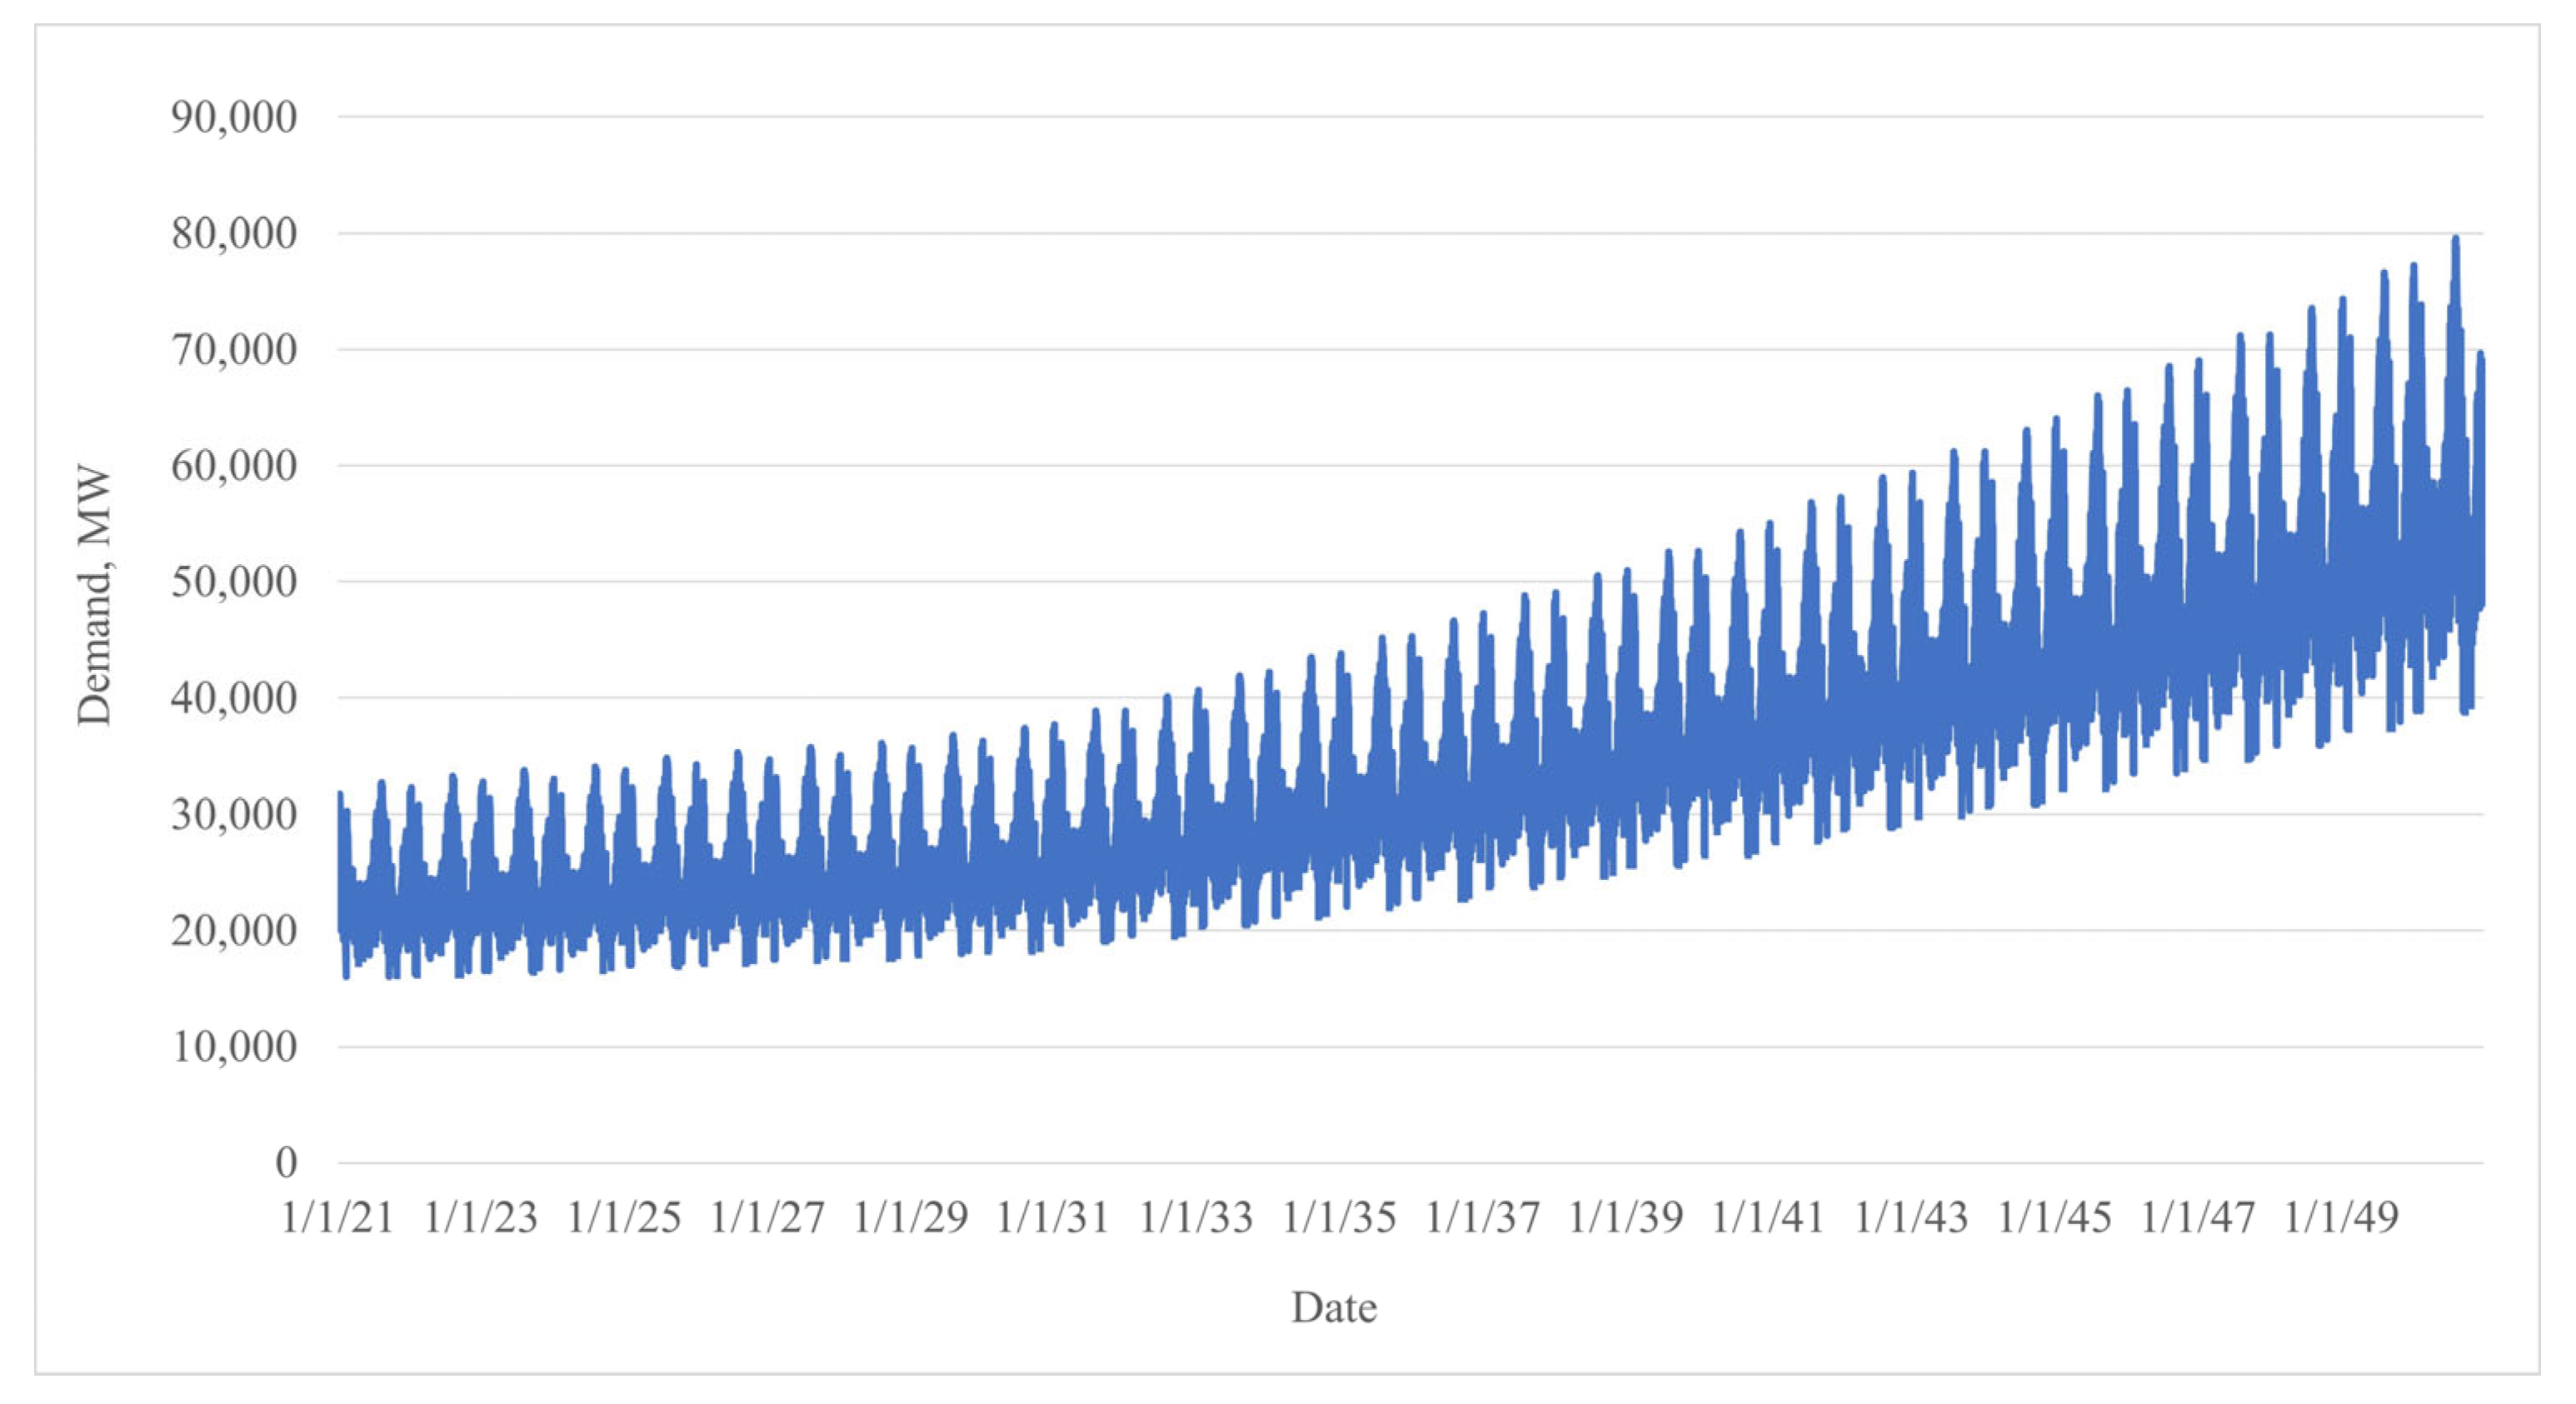
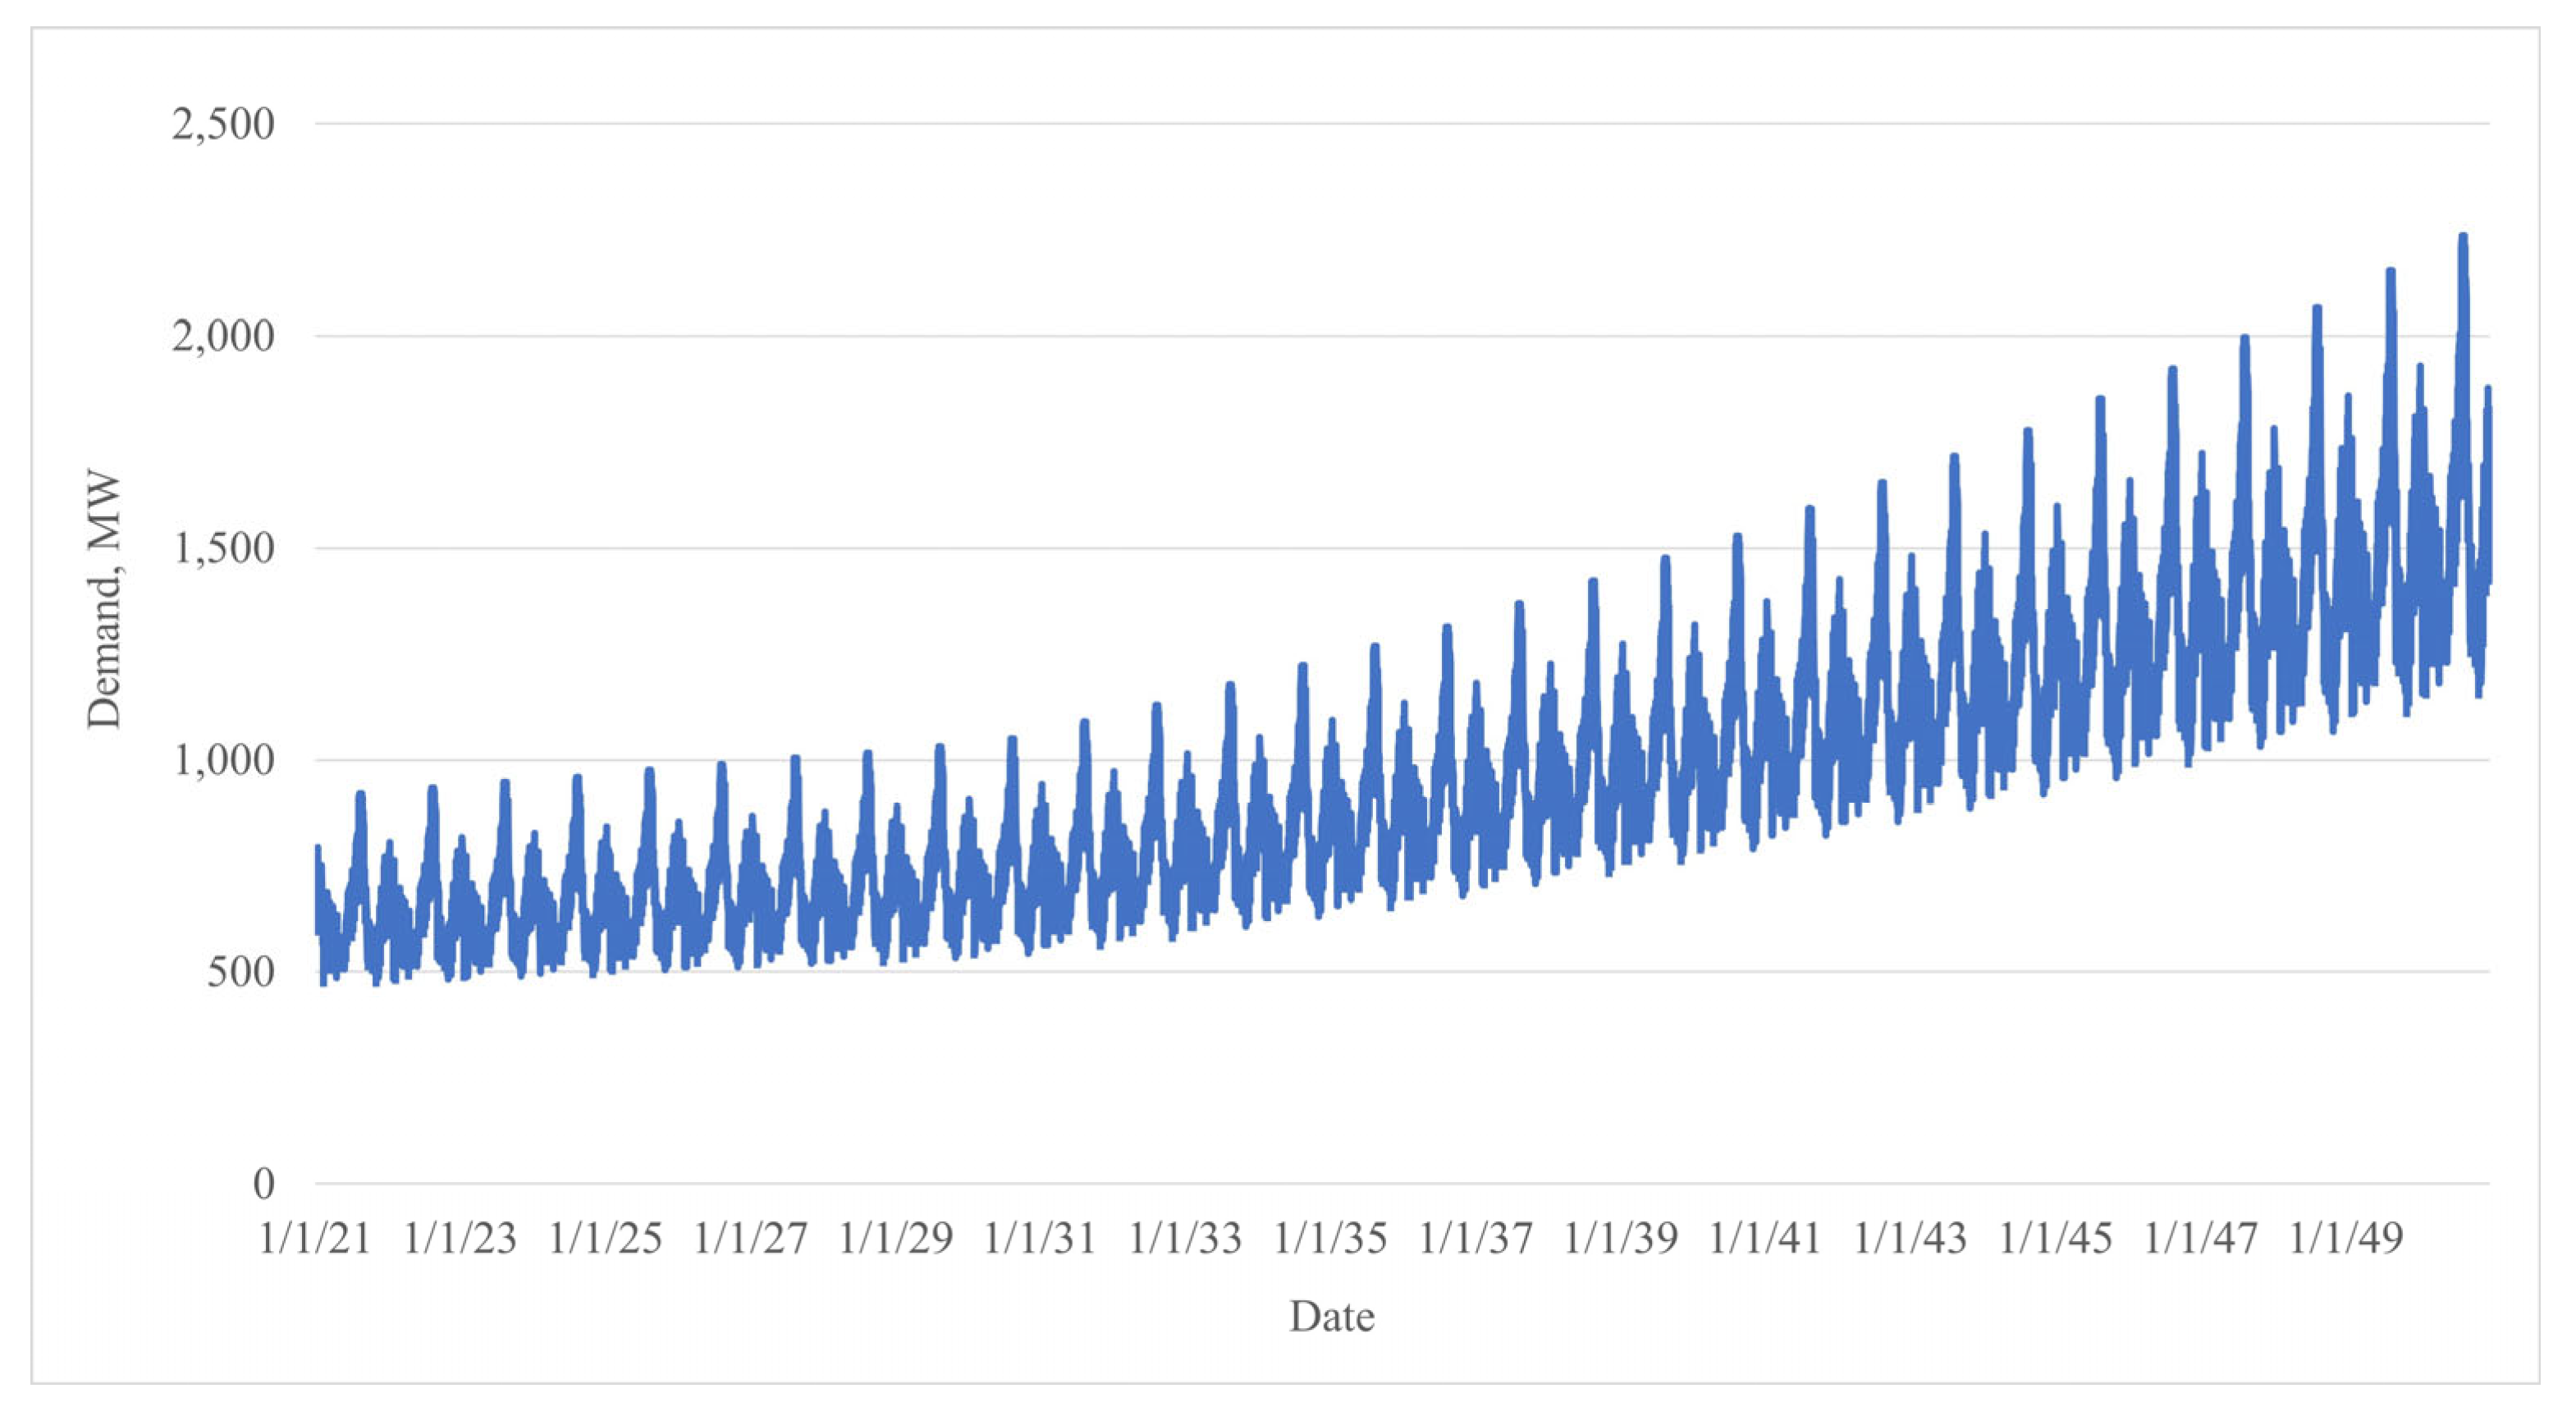
3. Step 1: Total Electricity Consumption and Demand Pattern Forecast
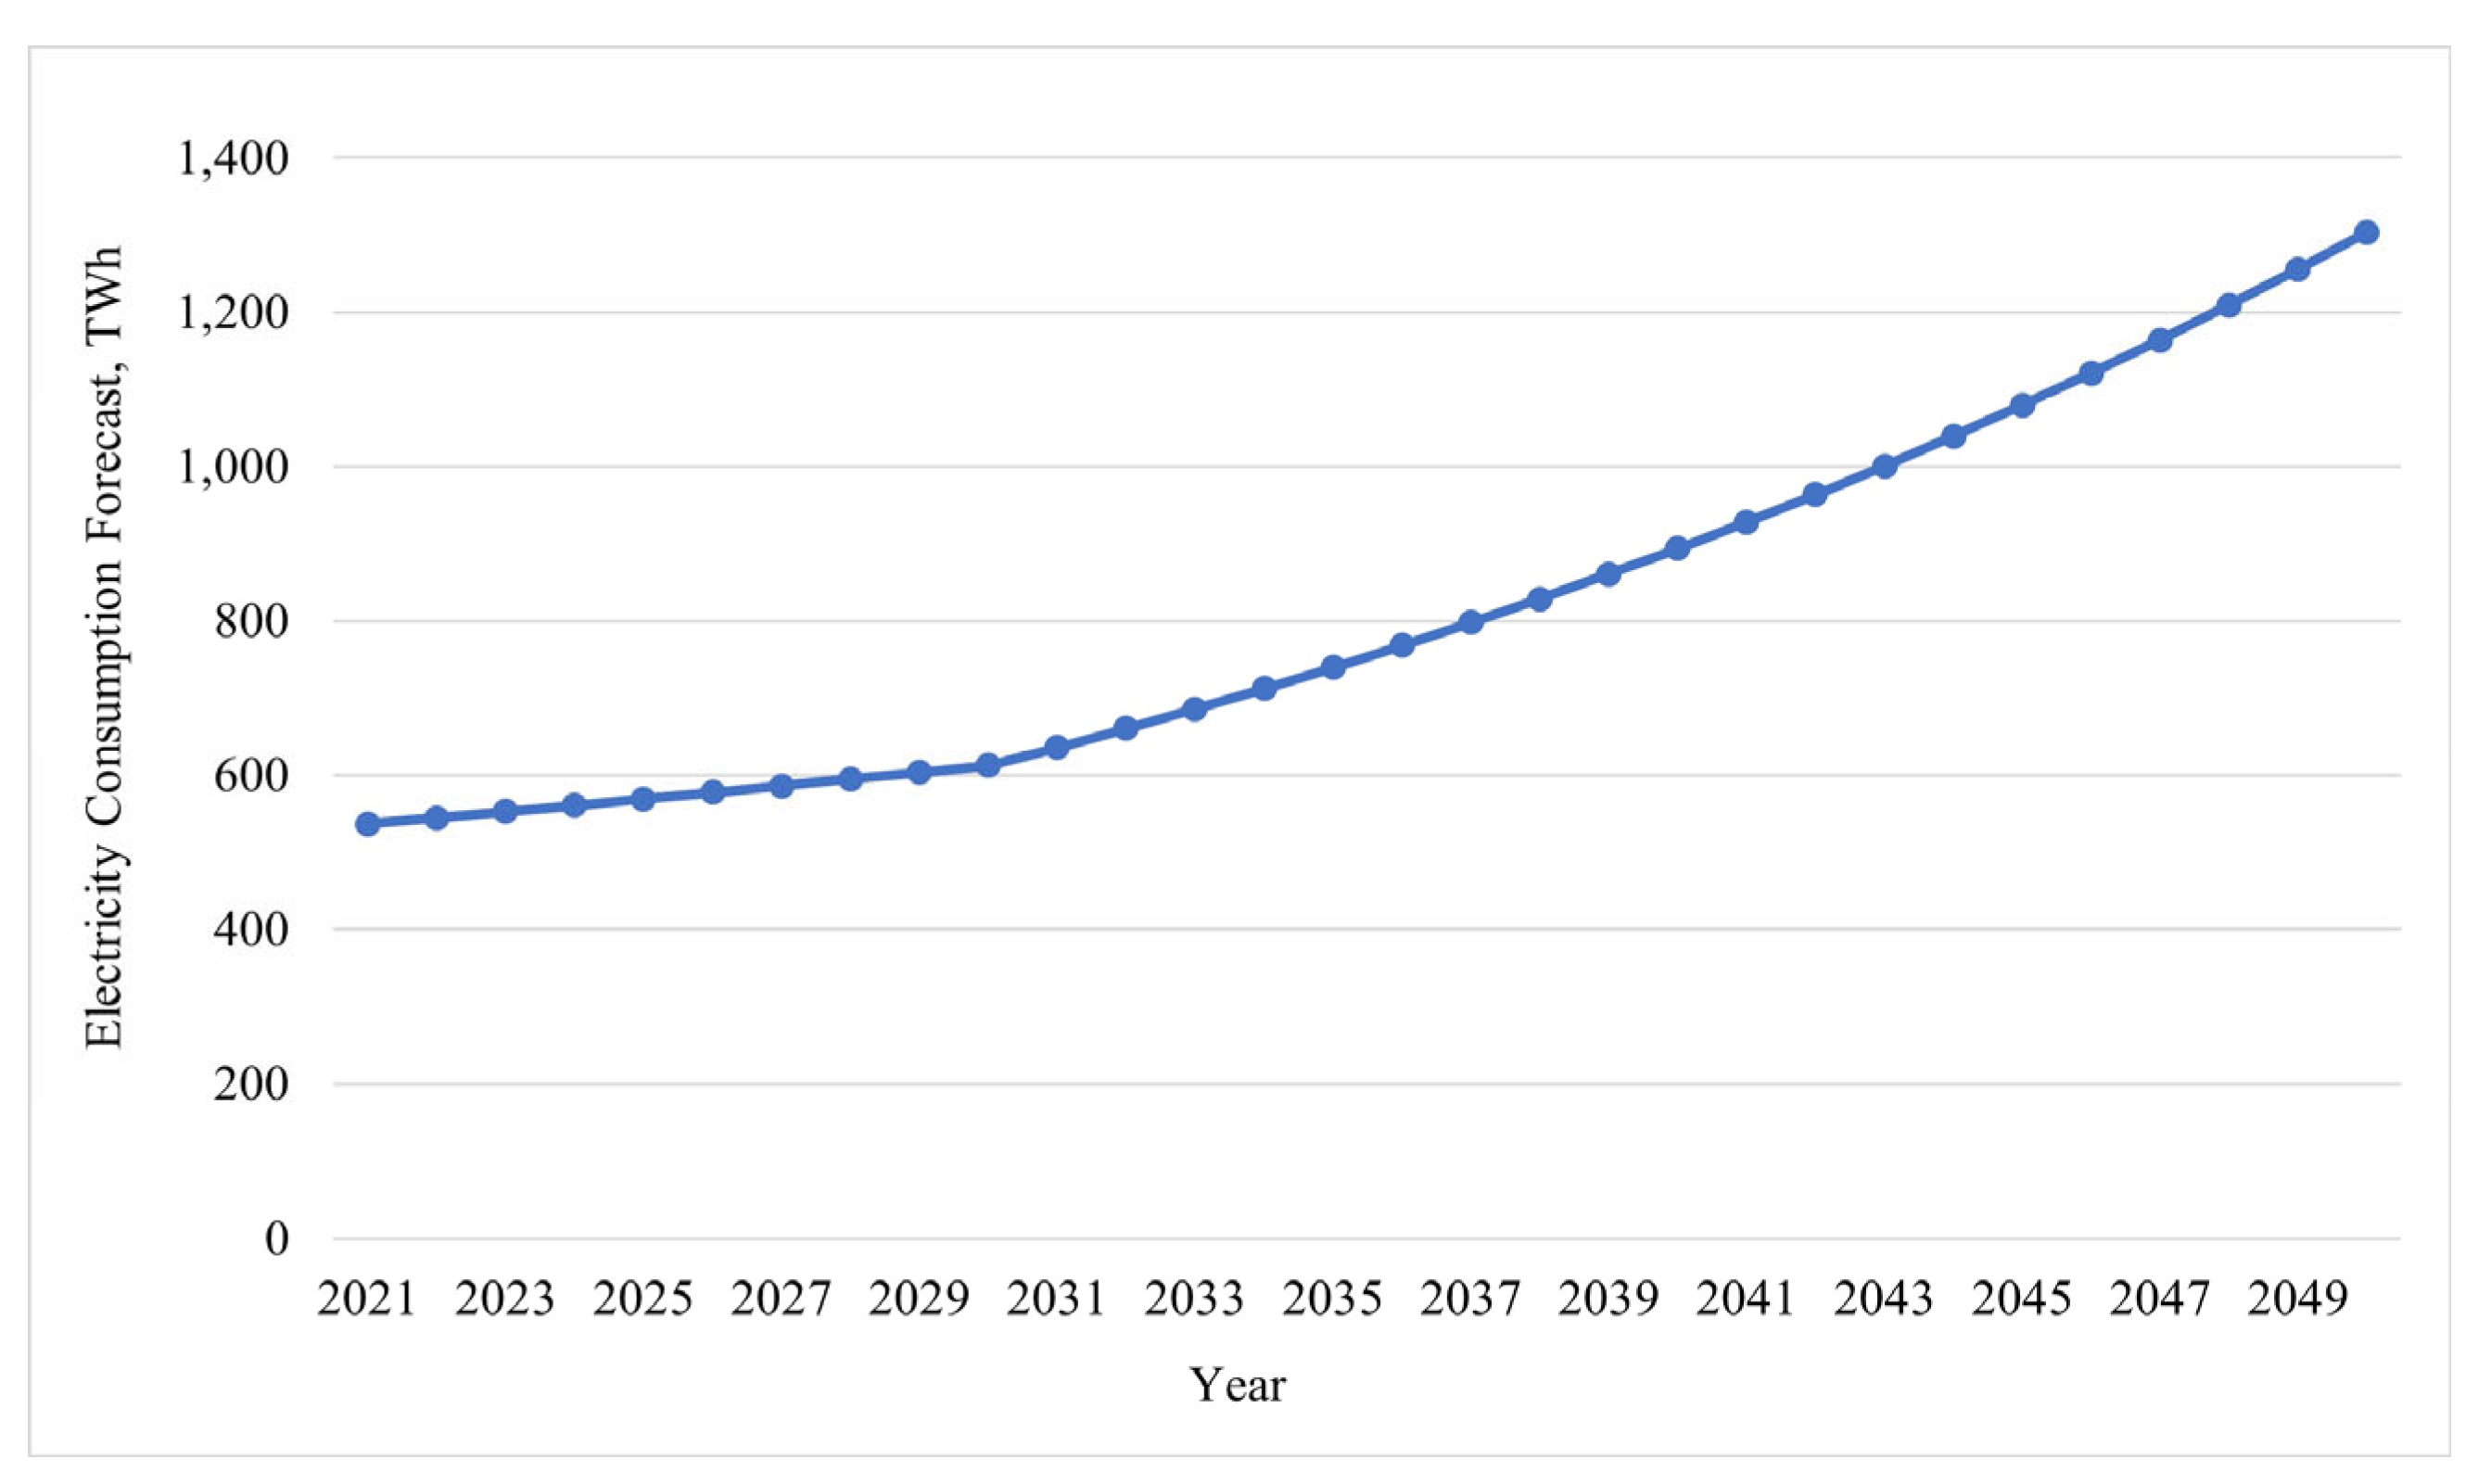
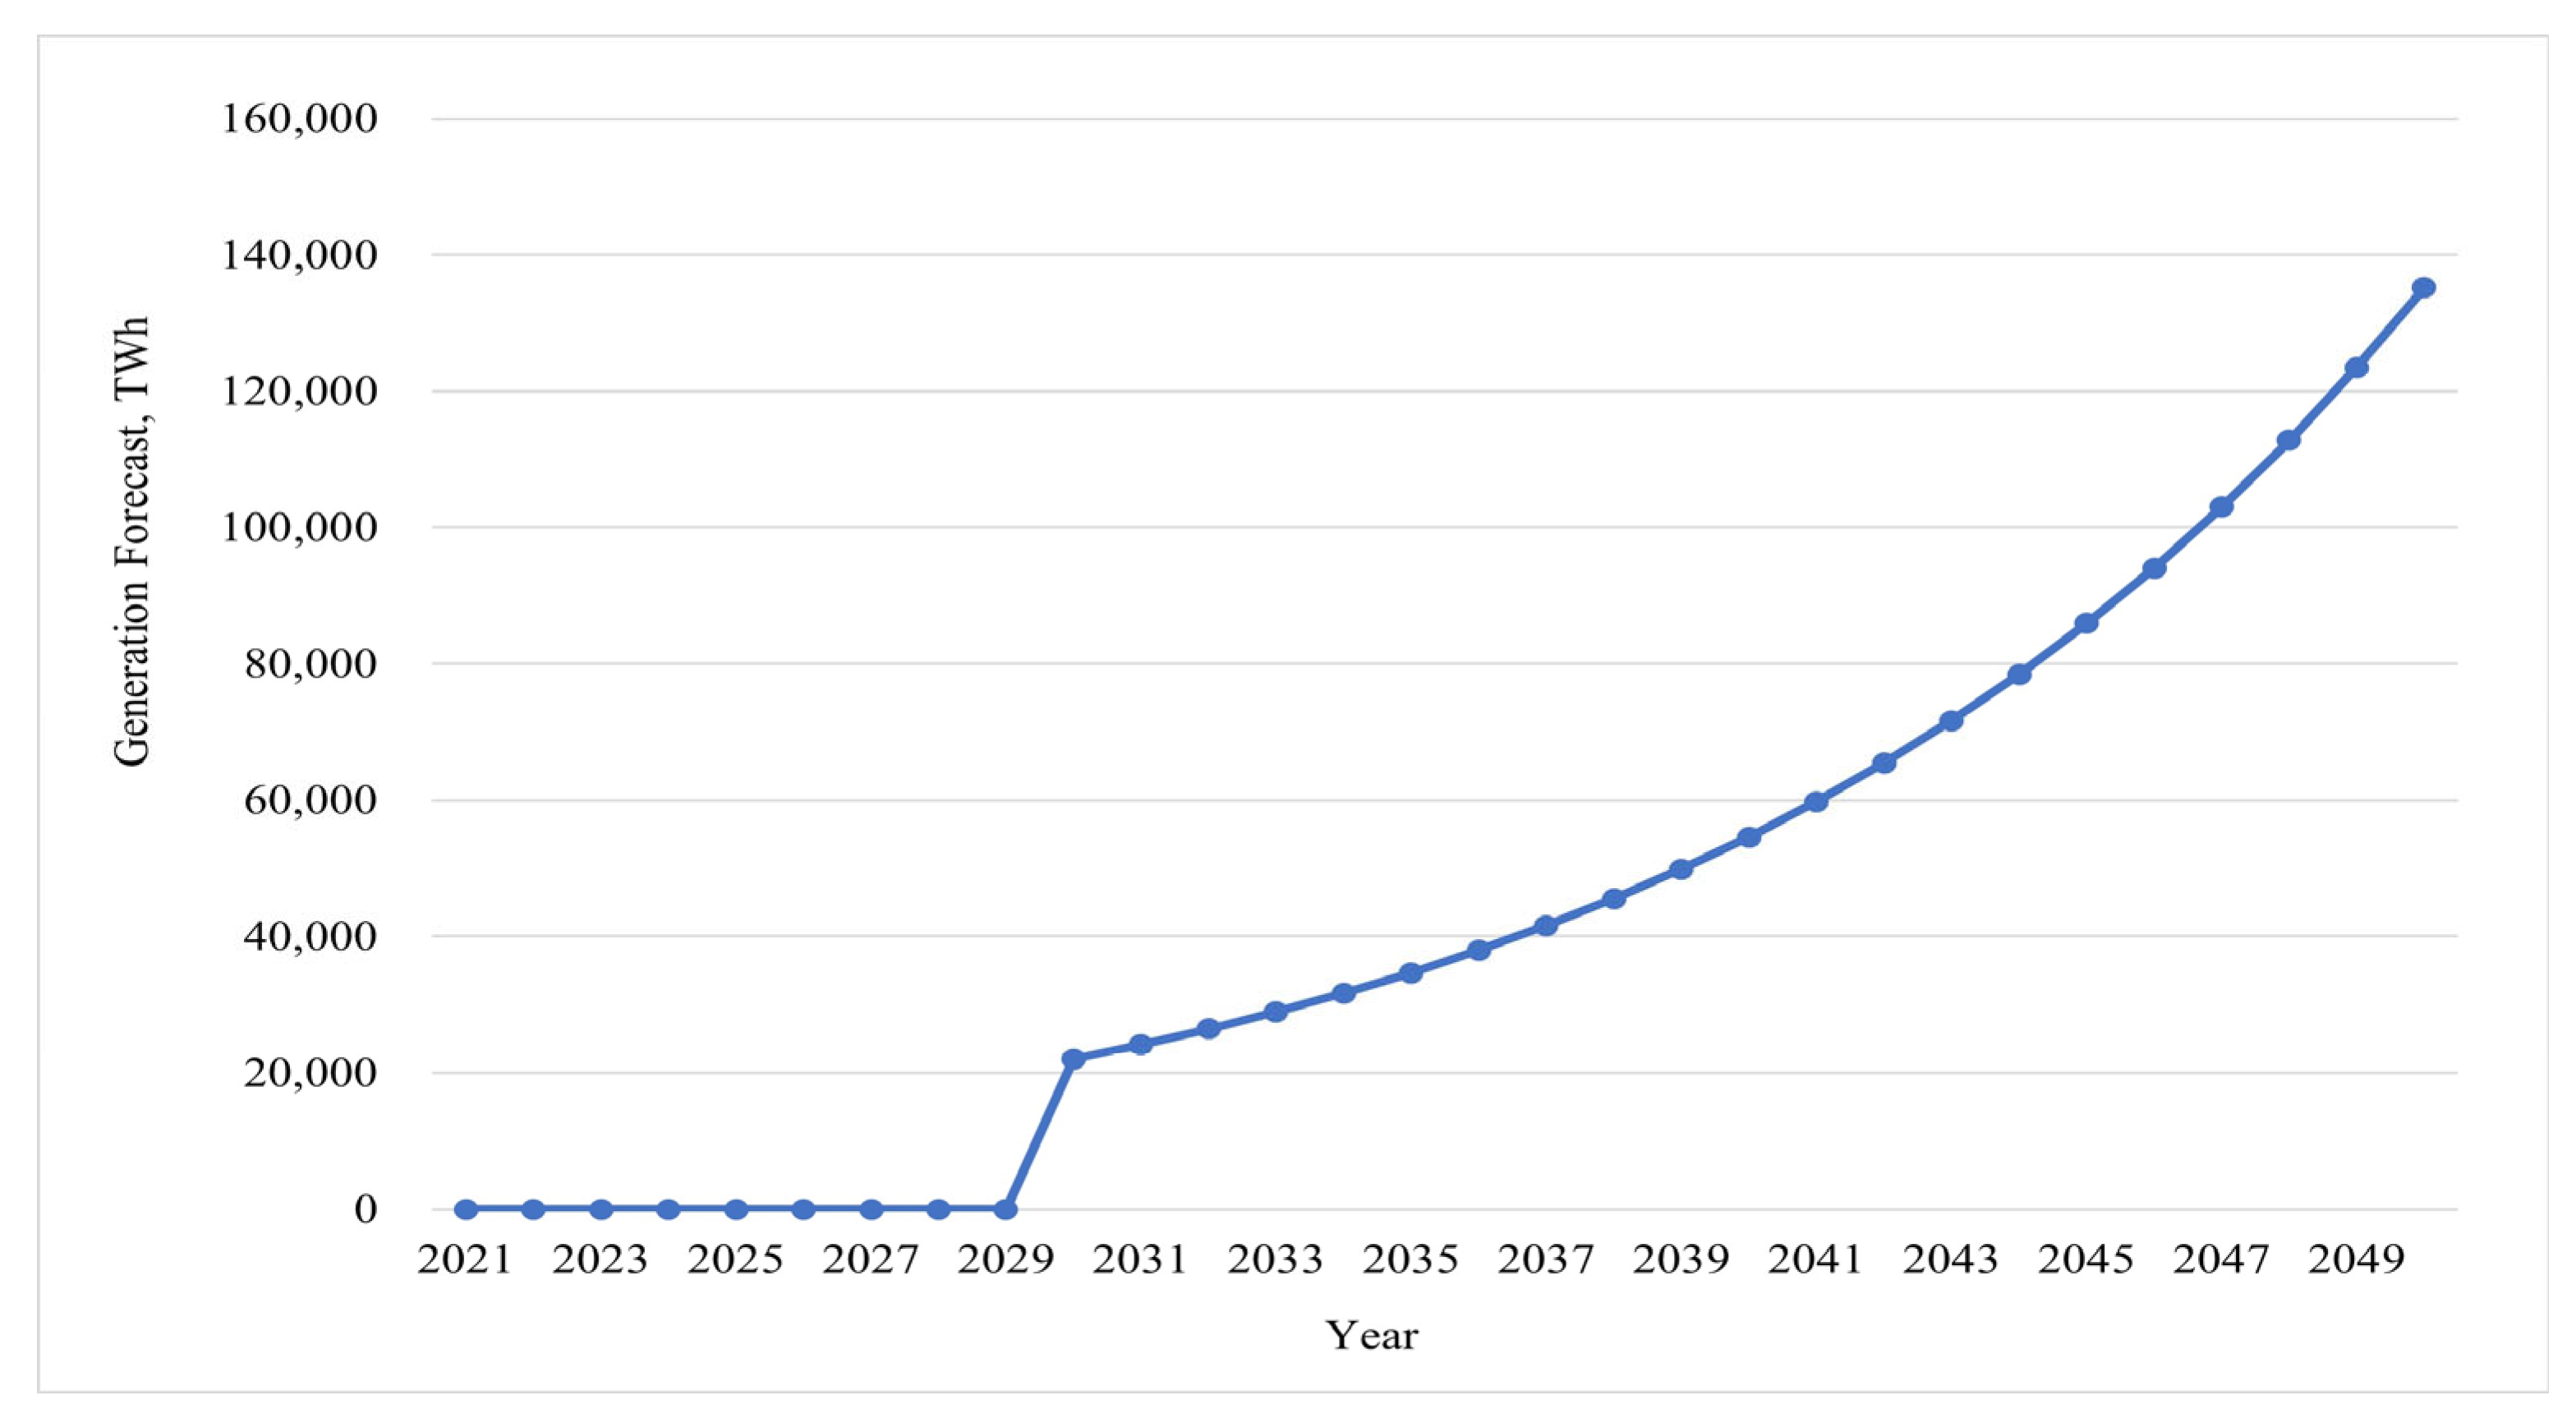
3.1. Forecast of the Total Electricity Consumption for South Korea
Figure 3 shows the procedure used for estimating the total electricity consumption forecast. Note that Equation (1) can be used to convert the total electricity consumption forecast from the end user-based value to the transmission end-based value.
where Ct, Ce, and TL denote the total electricity consumption at the transmission end, total electricity consumption of the end user, and total loss rate, respectively. The Ct forecast for 2021 was estimated to be 517,756,000 MWh [1]. By applying the combined TL (transmission, distribution, and transformation) of 3.54%, The Ct forecast for 2021 was estimated to be 536,757,205 MWh [17]. The Ct forecasts for 2030 and 2050 are 612,400,000 MWh and 1,303,856,521 MWh, respectively [2,3]. Based on the Ct forecasts for 2021, 2030 and 2050, the base years, we obtained the CAGR for the intervening years and used this CAGR value to determine the Ct for each year from 2021 to 2050. Notably, CAGR was used because in general, electricity consumption is closely related to the gross domestic product (GDP), and GDP growth is typically expressed as the CAGR. In this study, the estimated CAGR from 2021 to 2030 and from 2030 to 2050 was 1.476% and 3.851%, respectively. These values were used to estimate the Ct forecast for each year, as shown in Figure 4.
Figure 3.
Flowchart explaining the procedure for estimating the total electricity consumption forecast.
Figure 4.
Total electricity consumption forecast for 2021–2050.
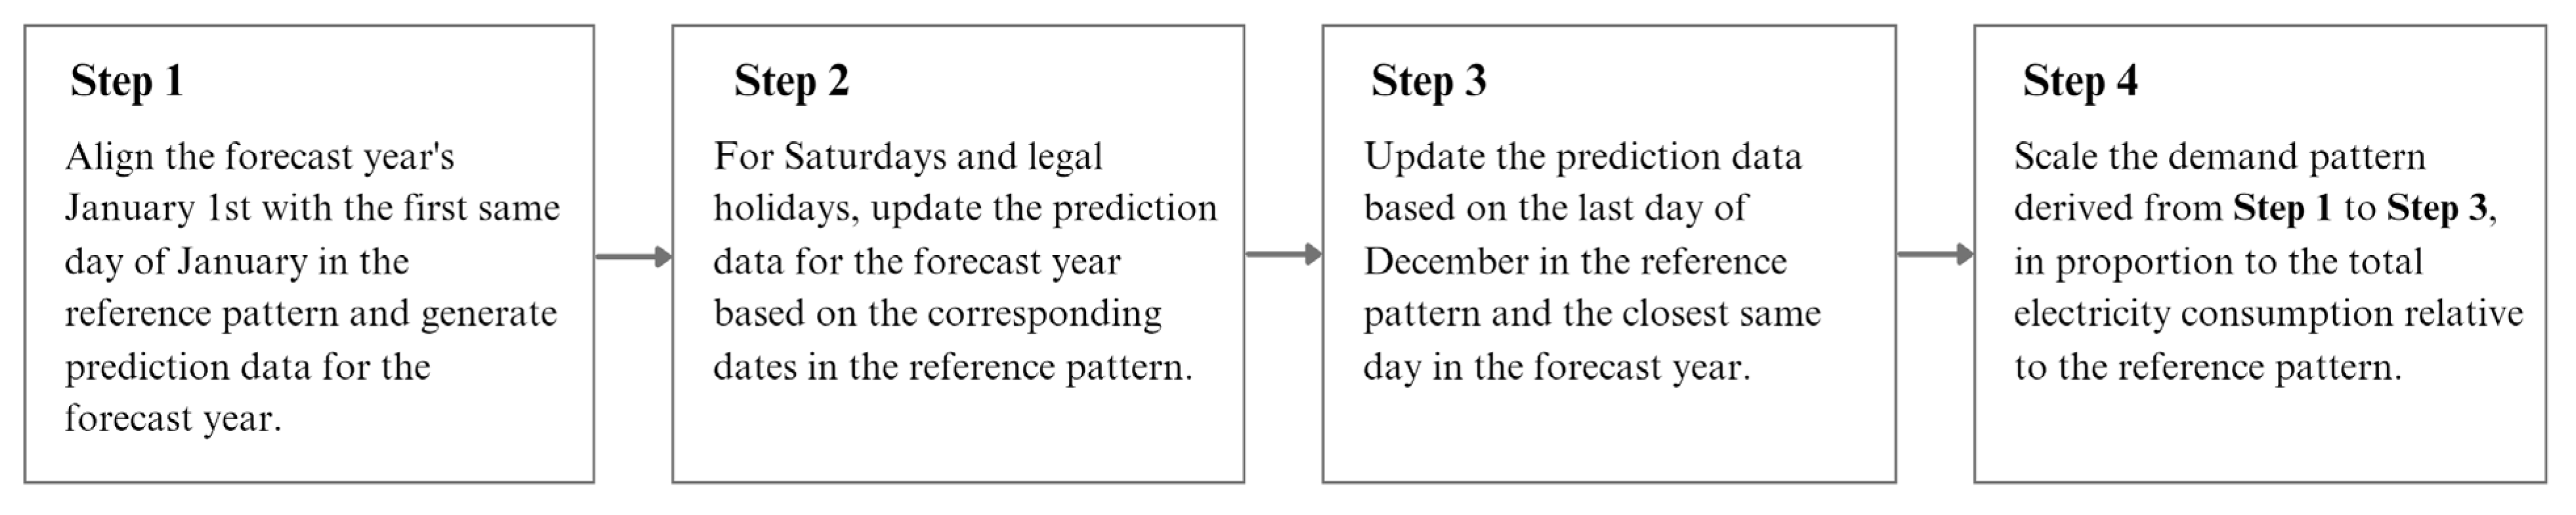
3.2. Demand Pattern Forecast Algorithm (DPFA)
In this study, the DPFA was used to forecast the annual demand patterns, using the total electricity consumption forecast and the most recent annual demand pattern (baseline pattern) [18]. The details are shown in Figure 5.
Figure 5.
Yearly demand pattern forecasts based on demand pattern forecast algorithm (DPFA).
Steps 1–3 were applied because domestic demand exhibited similar patterns for the days of the week, including Saturdays, and the national holidays. The following is an example of this approach. We applied the pattern observed on 3 January 2021 (Sunday) to 2 January 2022 (Sunday); and the pattern observed on 11 February 2021 (Thursday) through 13 February 2021 (Saturday) was applied for the Lunar New Year holiday period of 31 January 2022 (Monday) through 2 February 2022 (Wednesday). Applying the above principles, we derived nationwide demand pattern forecasts from 2021 to 2050, as shown in Figure 6.
Figure 6.
Nationwide demand pattern forecasts.
In this study, South Korea was divided into the Seoul capital area (SCA; Seoul, Gyeonggi, Incheon), non-SCA regions, and Jeju, and the demand patterns were obtained for each region. Assuming that the electricity consumption growth rate by region was the same as the CAGR of the national electricity consumption, we estimated the demand pattern for each region (Figure 7, Figure 8 and Figure 9).
Figure 7.
Demand pattern forecast for the Seoul capital area (SCA).
Figure 8.
Demand pattern forecast for the non-Seoul capital area (non-SCA) regions.
Figure 9.
Demand pattern forecast for Jeju.
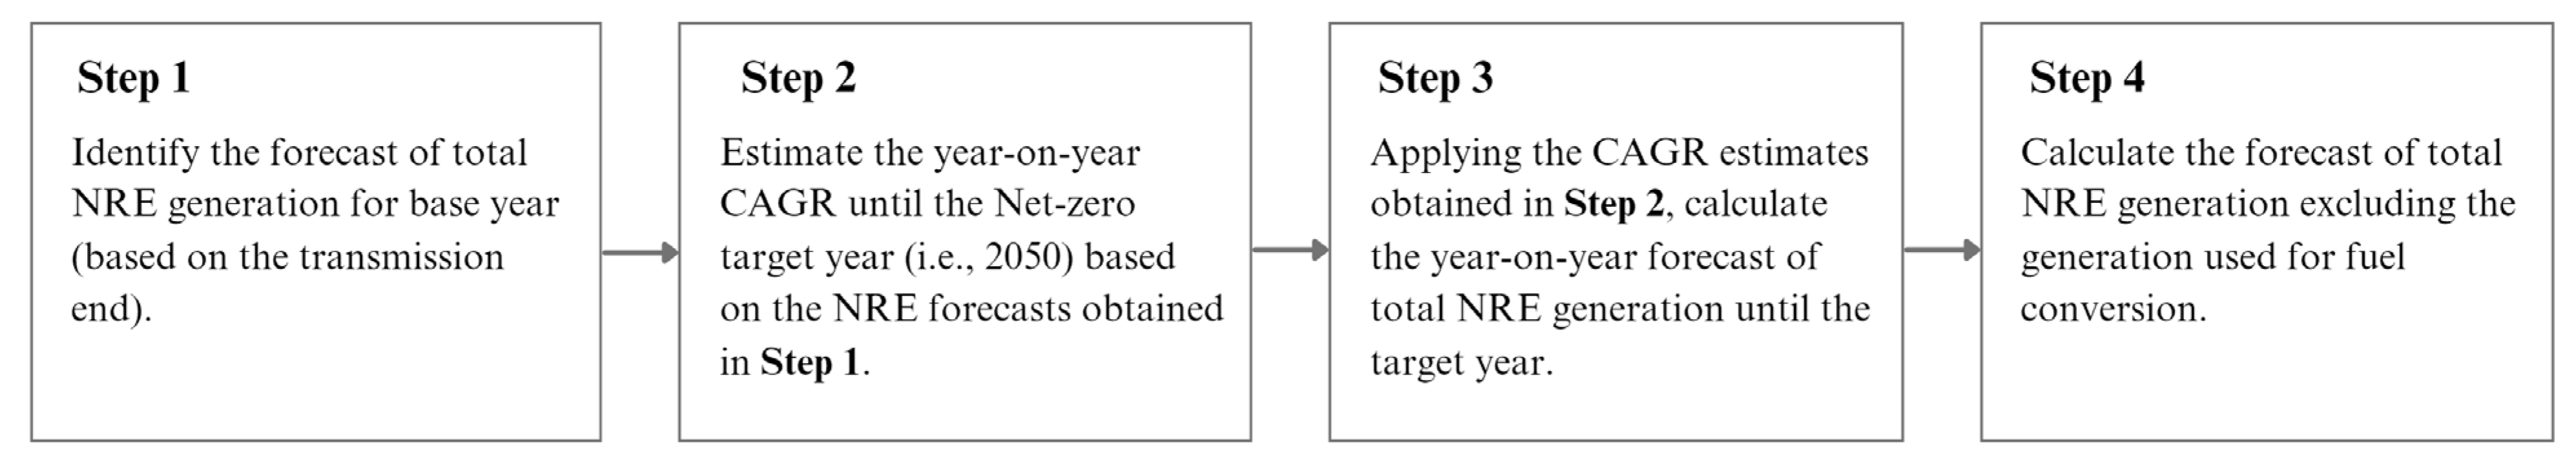
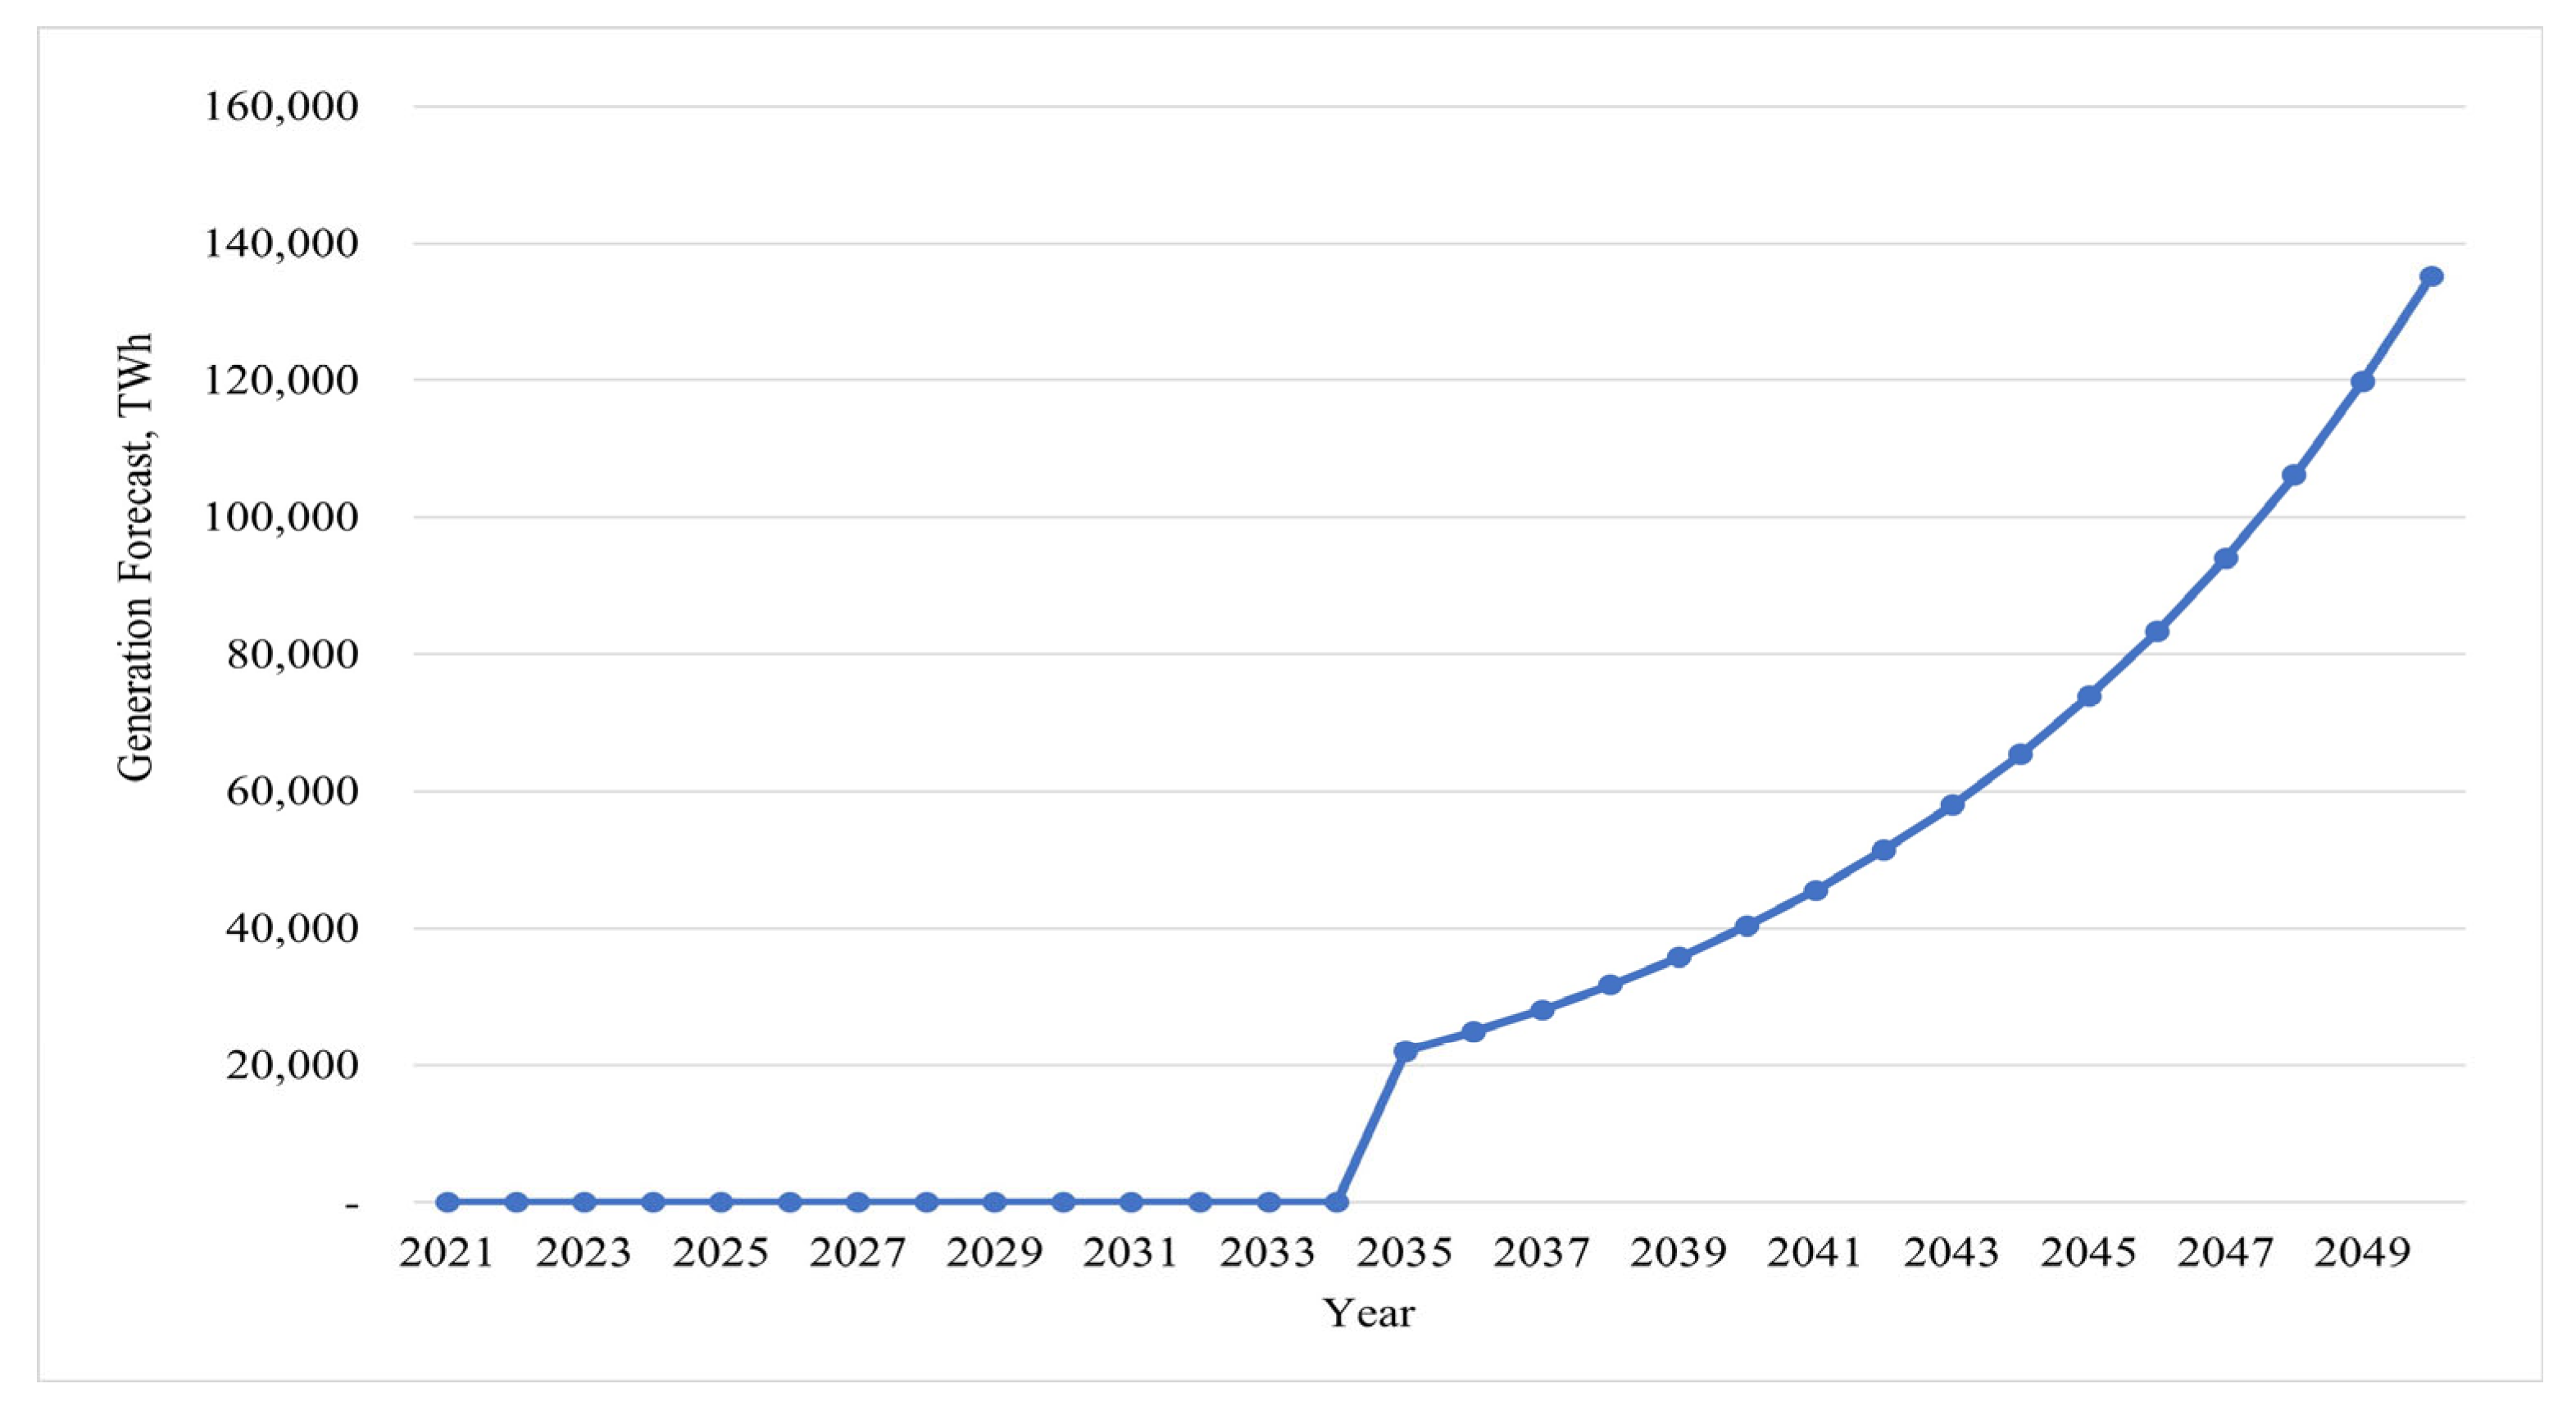
4. Step 2: Forecasting the Generation and Capacity of New and Renewable Energies (NRE)
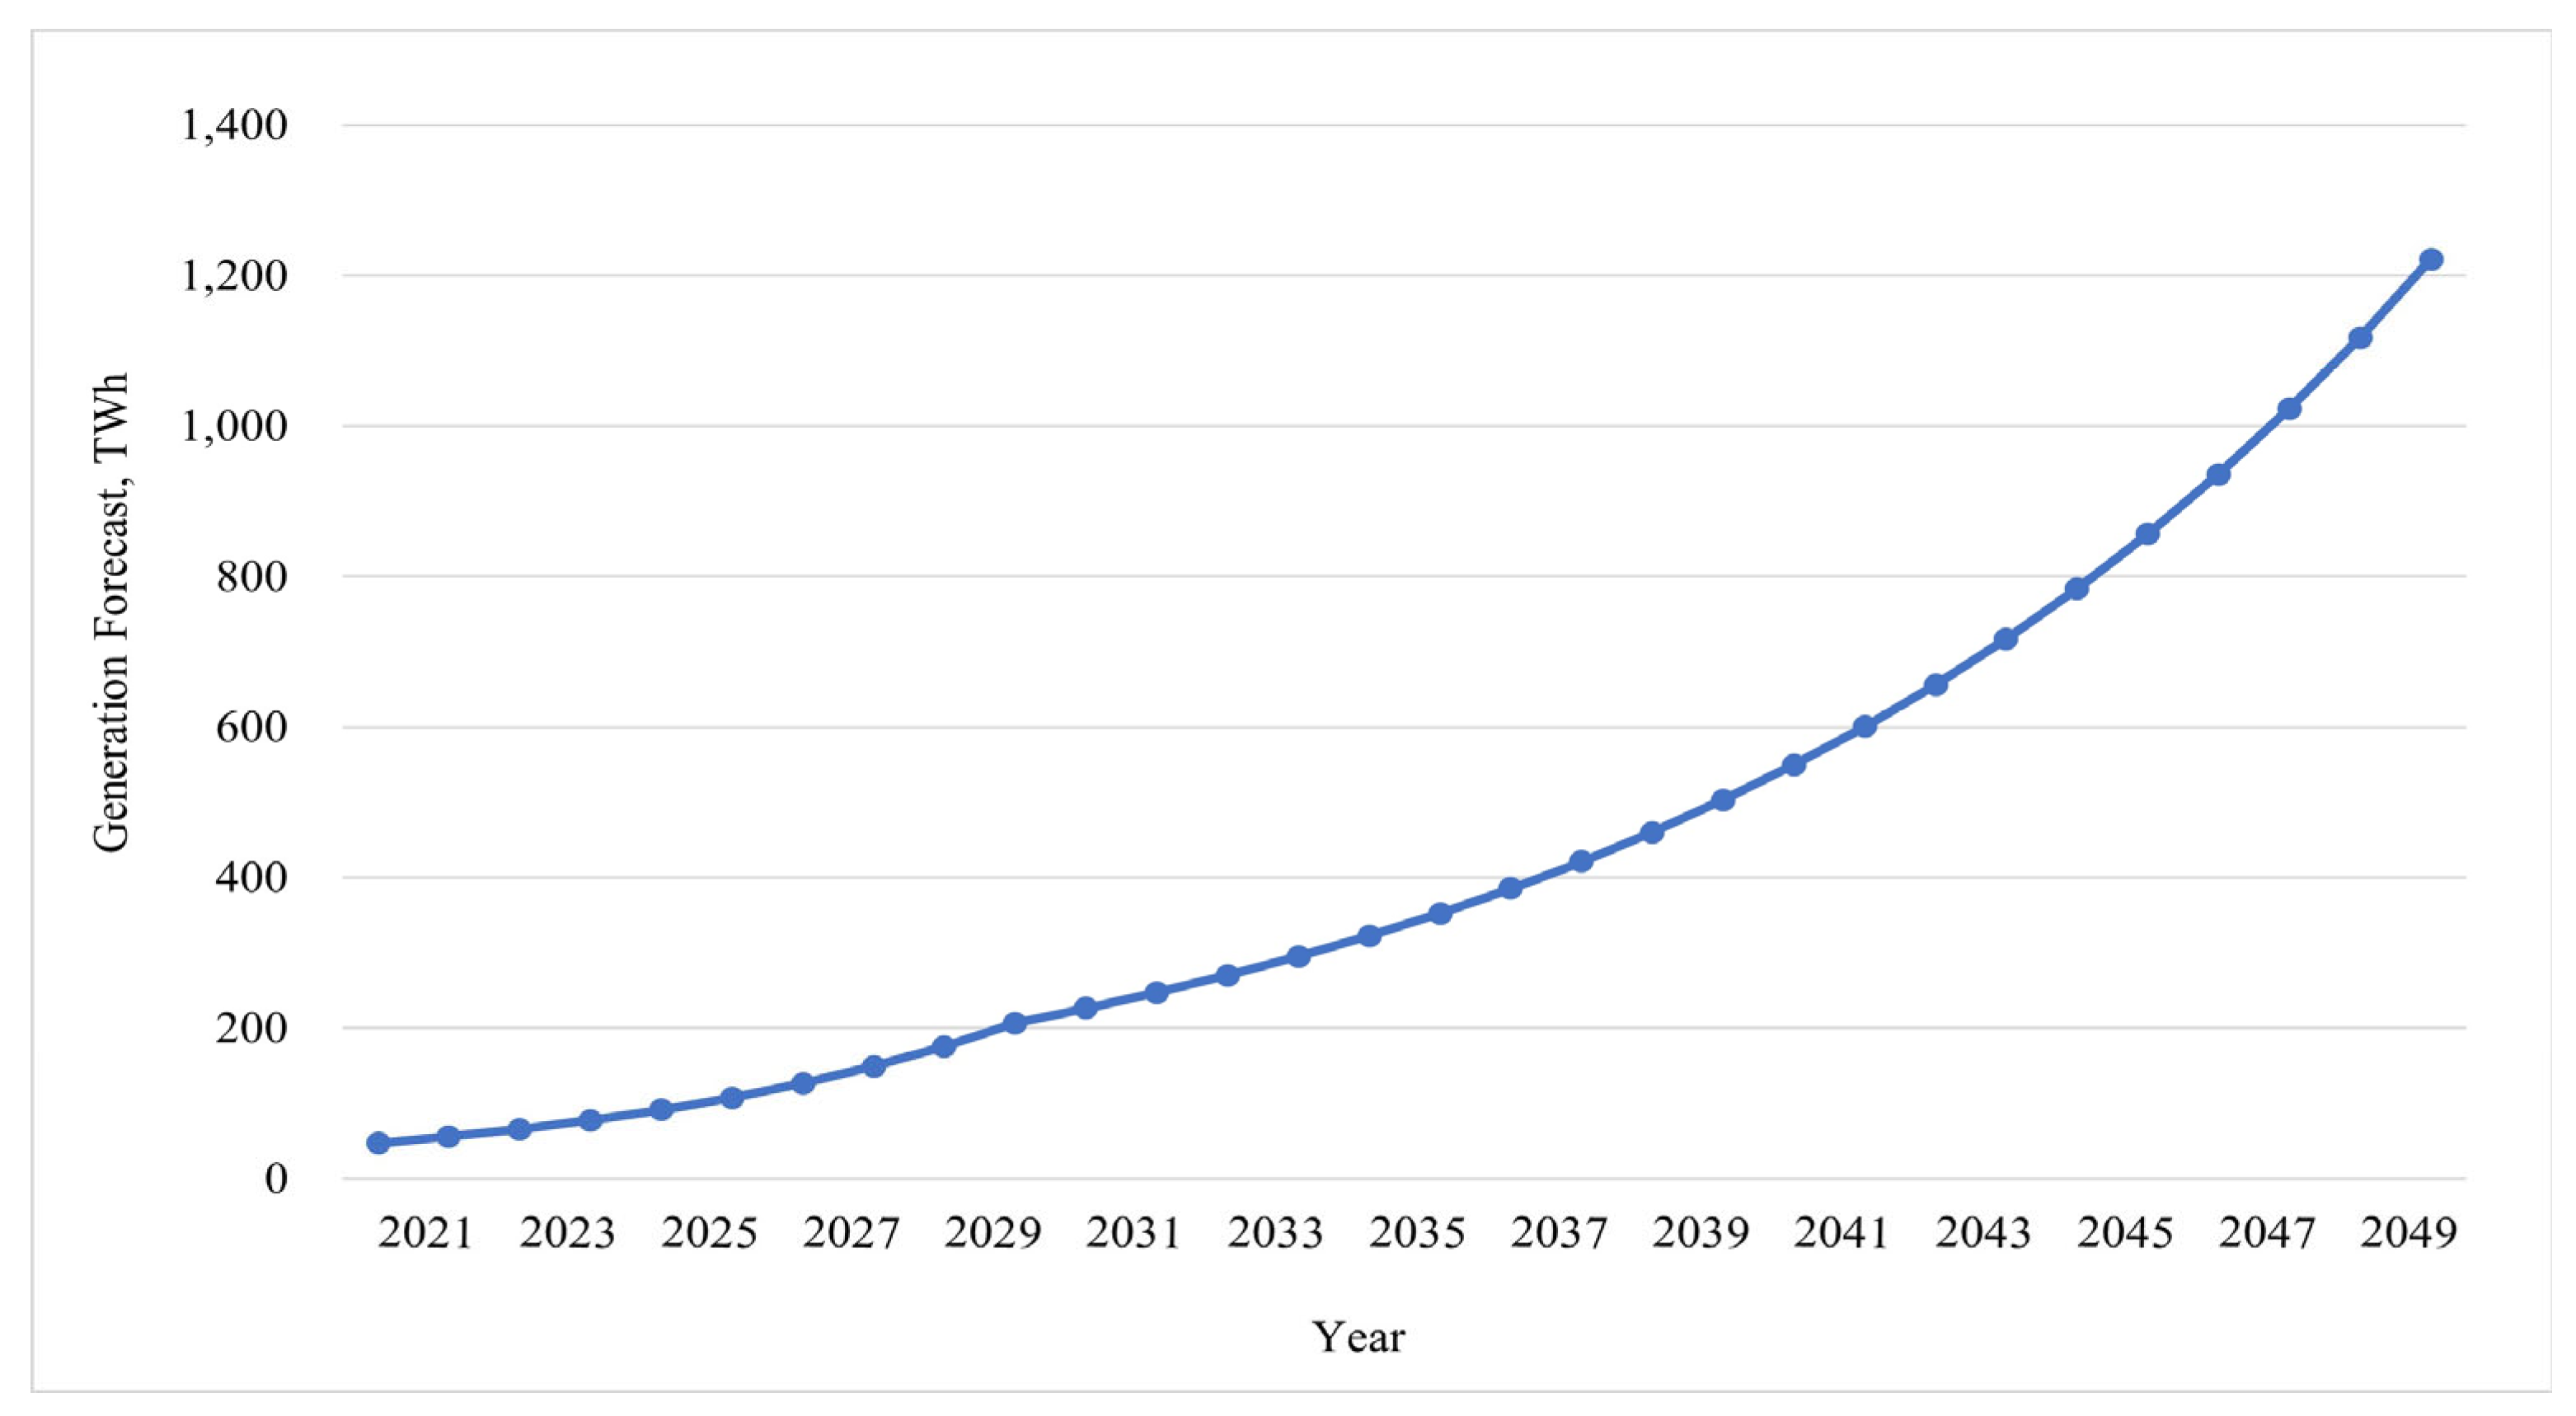
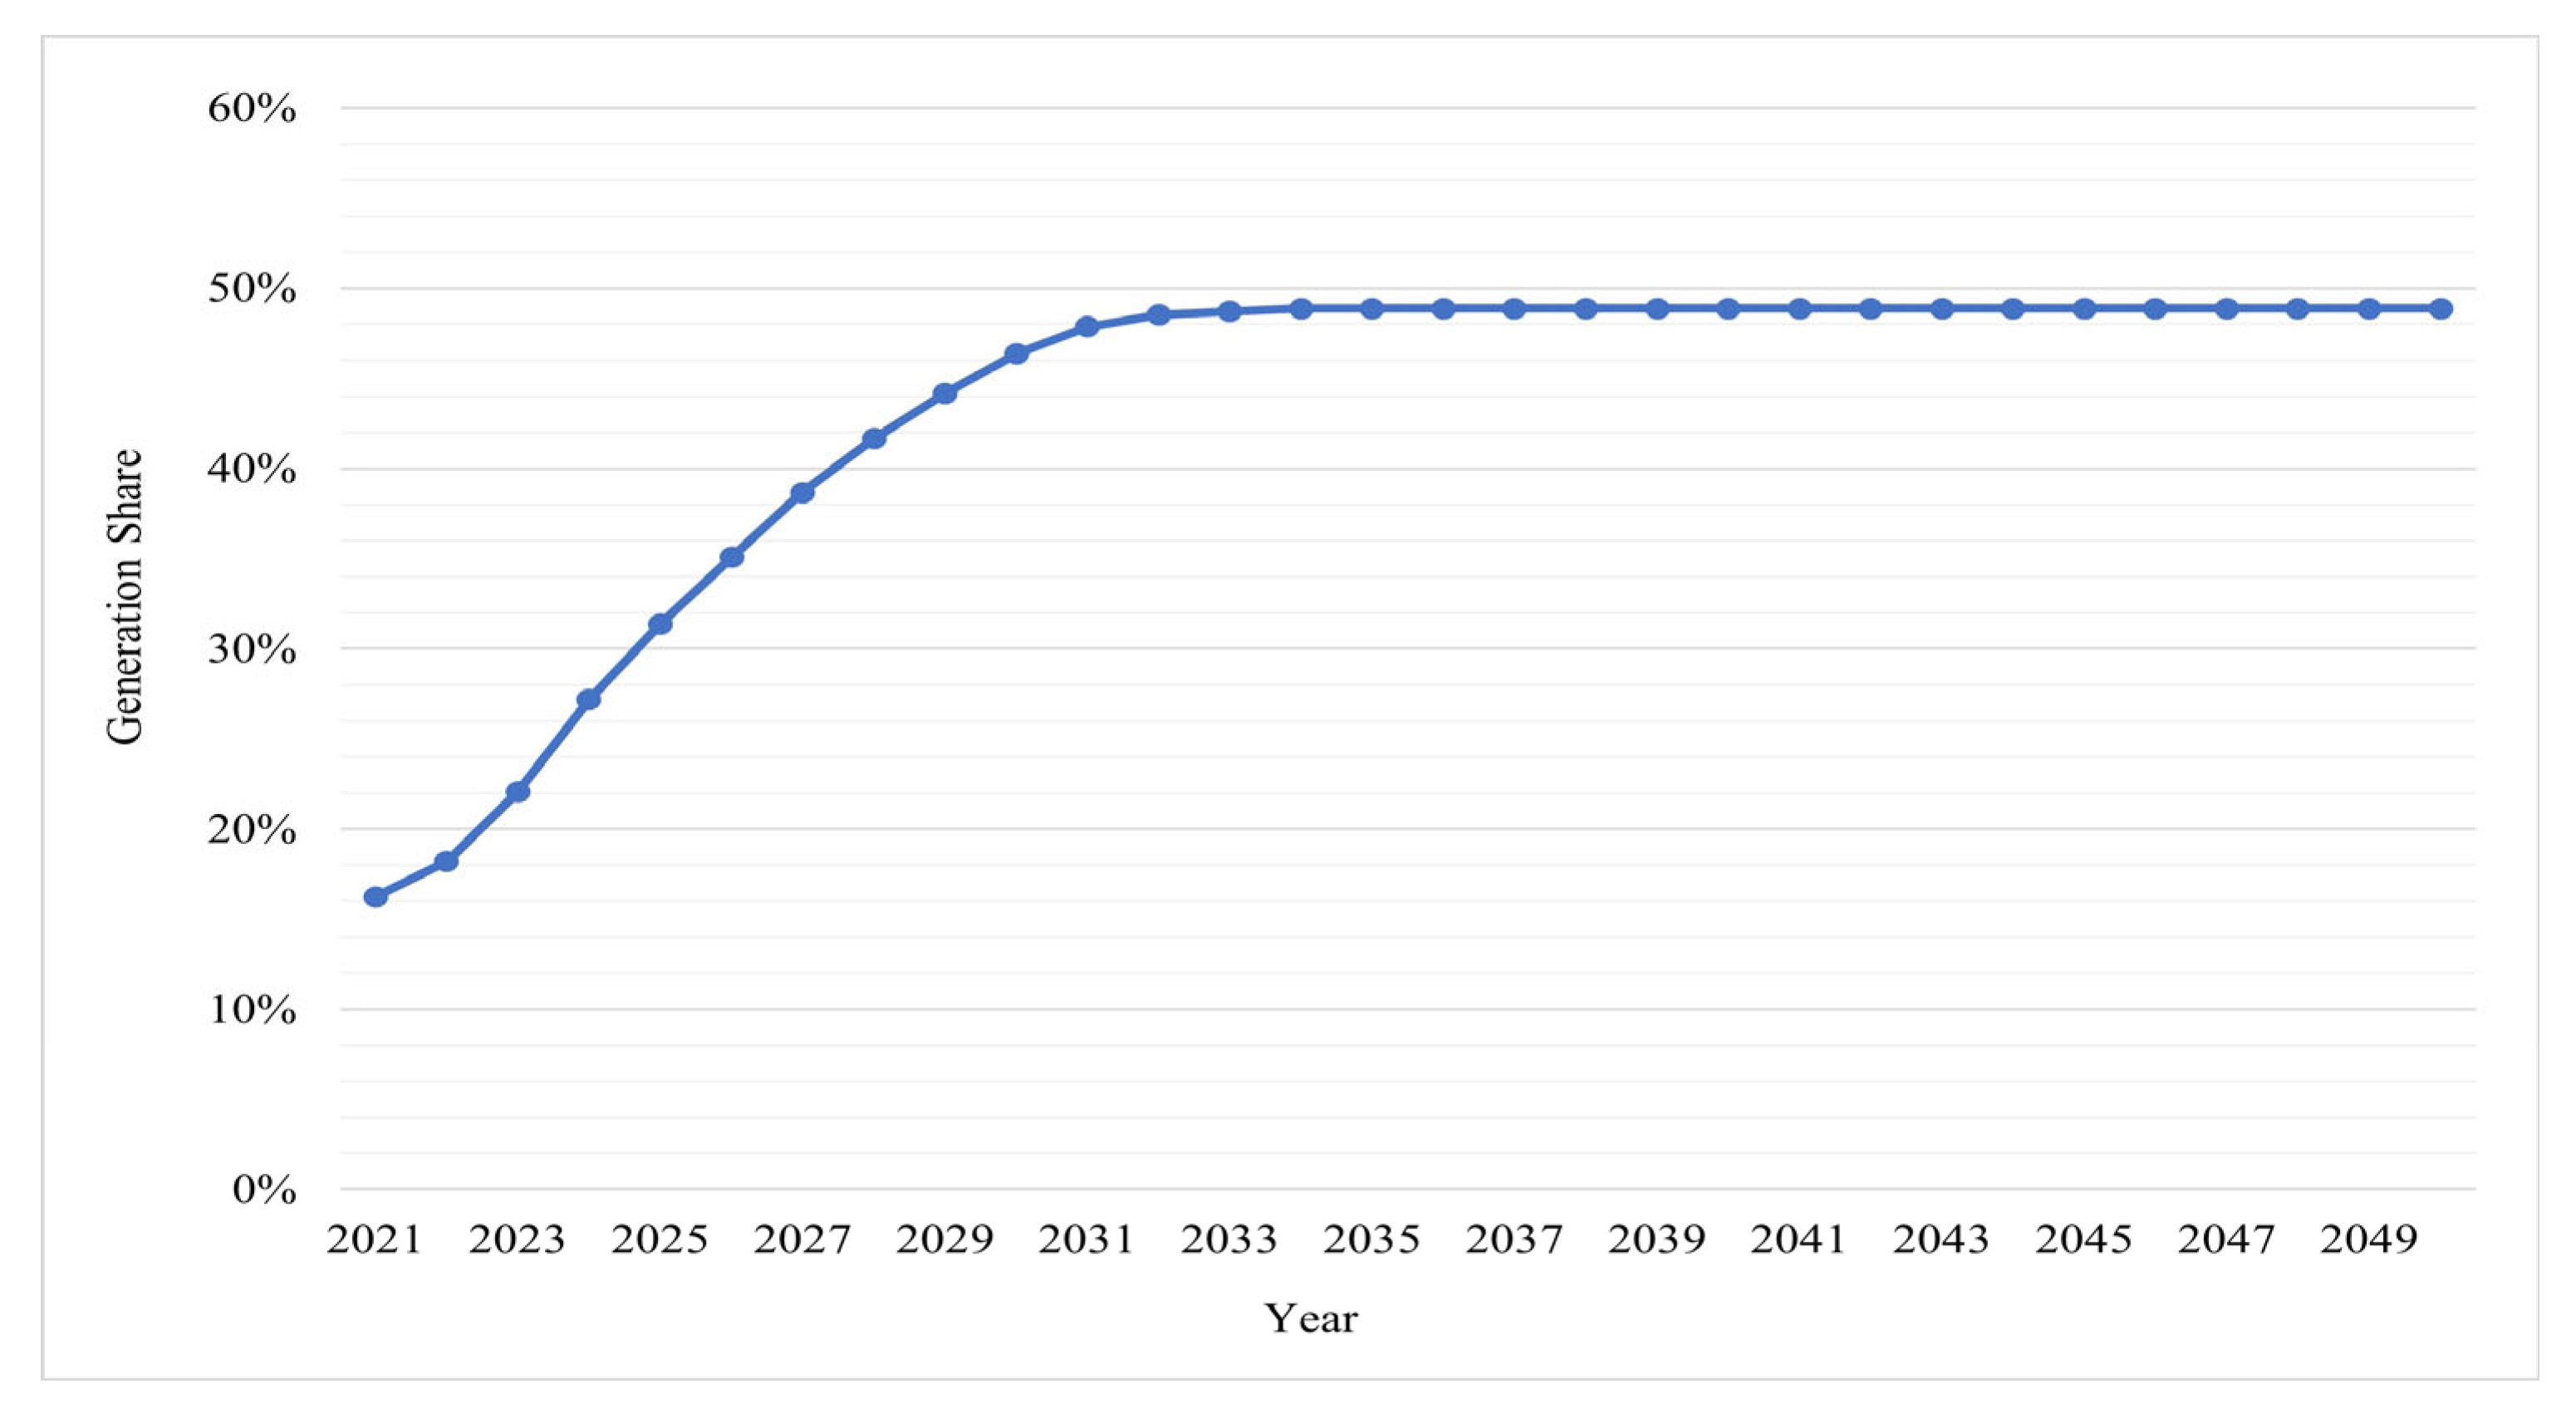
4.1. Total New and Renewable Energies (NRE) Generation Forecast
Figure 10 shows the procedure used for forecasting the total NRE generation. In this study, the base years were 2021, 2030, and 2050. The total NRE generation forecasts (transmission end) for 2030 and 2050 were based on official reports (206.9 TWh and 1221.7 TWh, respectively) [2,3]. Based on these values, we calculated the CAGRs: 17.8% (2021–2030) and 9.3% (2030–2050). Figure 11 shows the annual forecasts of the total NRE generation based on these CAGR values. However, to calculate the capacity, the generation of energy used for fuel conversion must be subtracted from the total NRE generation because the annual generation of resources subject to fuel conversion was determined the annual operational generation schedule. The results are shown in Figure 12.
Figure 10.
Procedure used for forecasting the total new and renewable energies (NRE) generation.
Figure 11.
Forecast of the total new and renewable energies (NRE) generation on an annual basis, for 2021–2050.
Figure 12.
Total new and renewable energies (NRE) generation, excluding ammonia, hydrogen, and bio generations, on an annual basis, for 2021–2050.
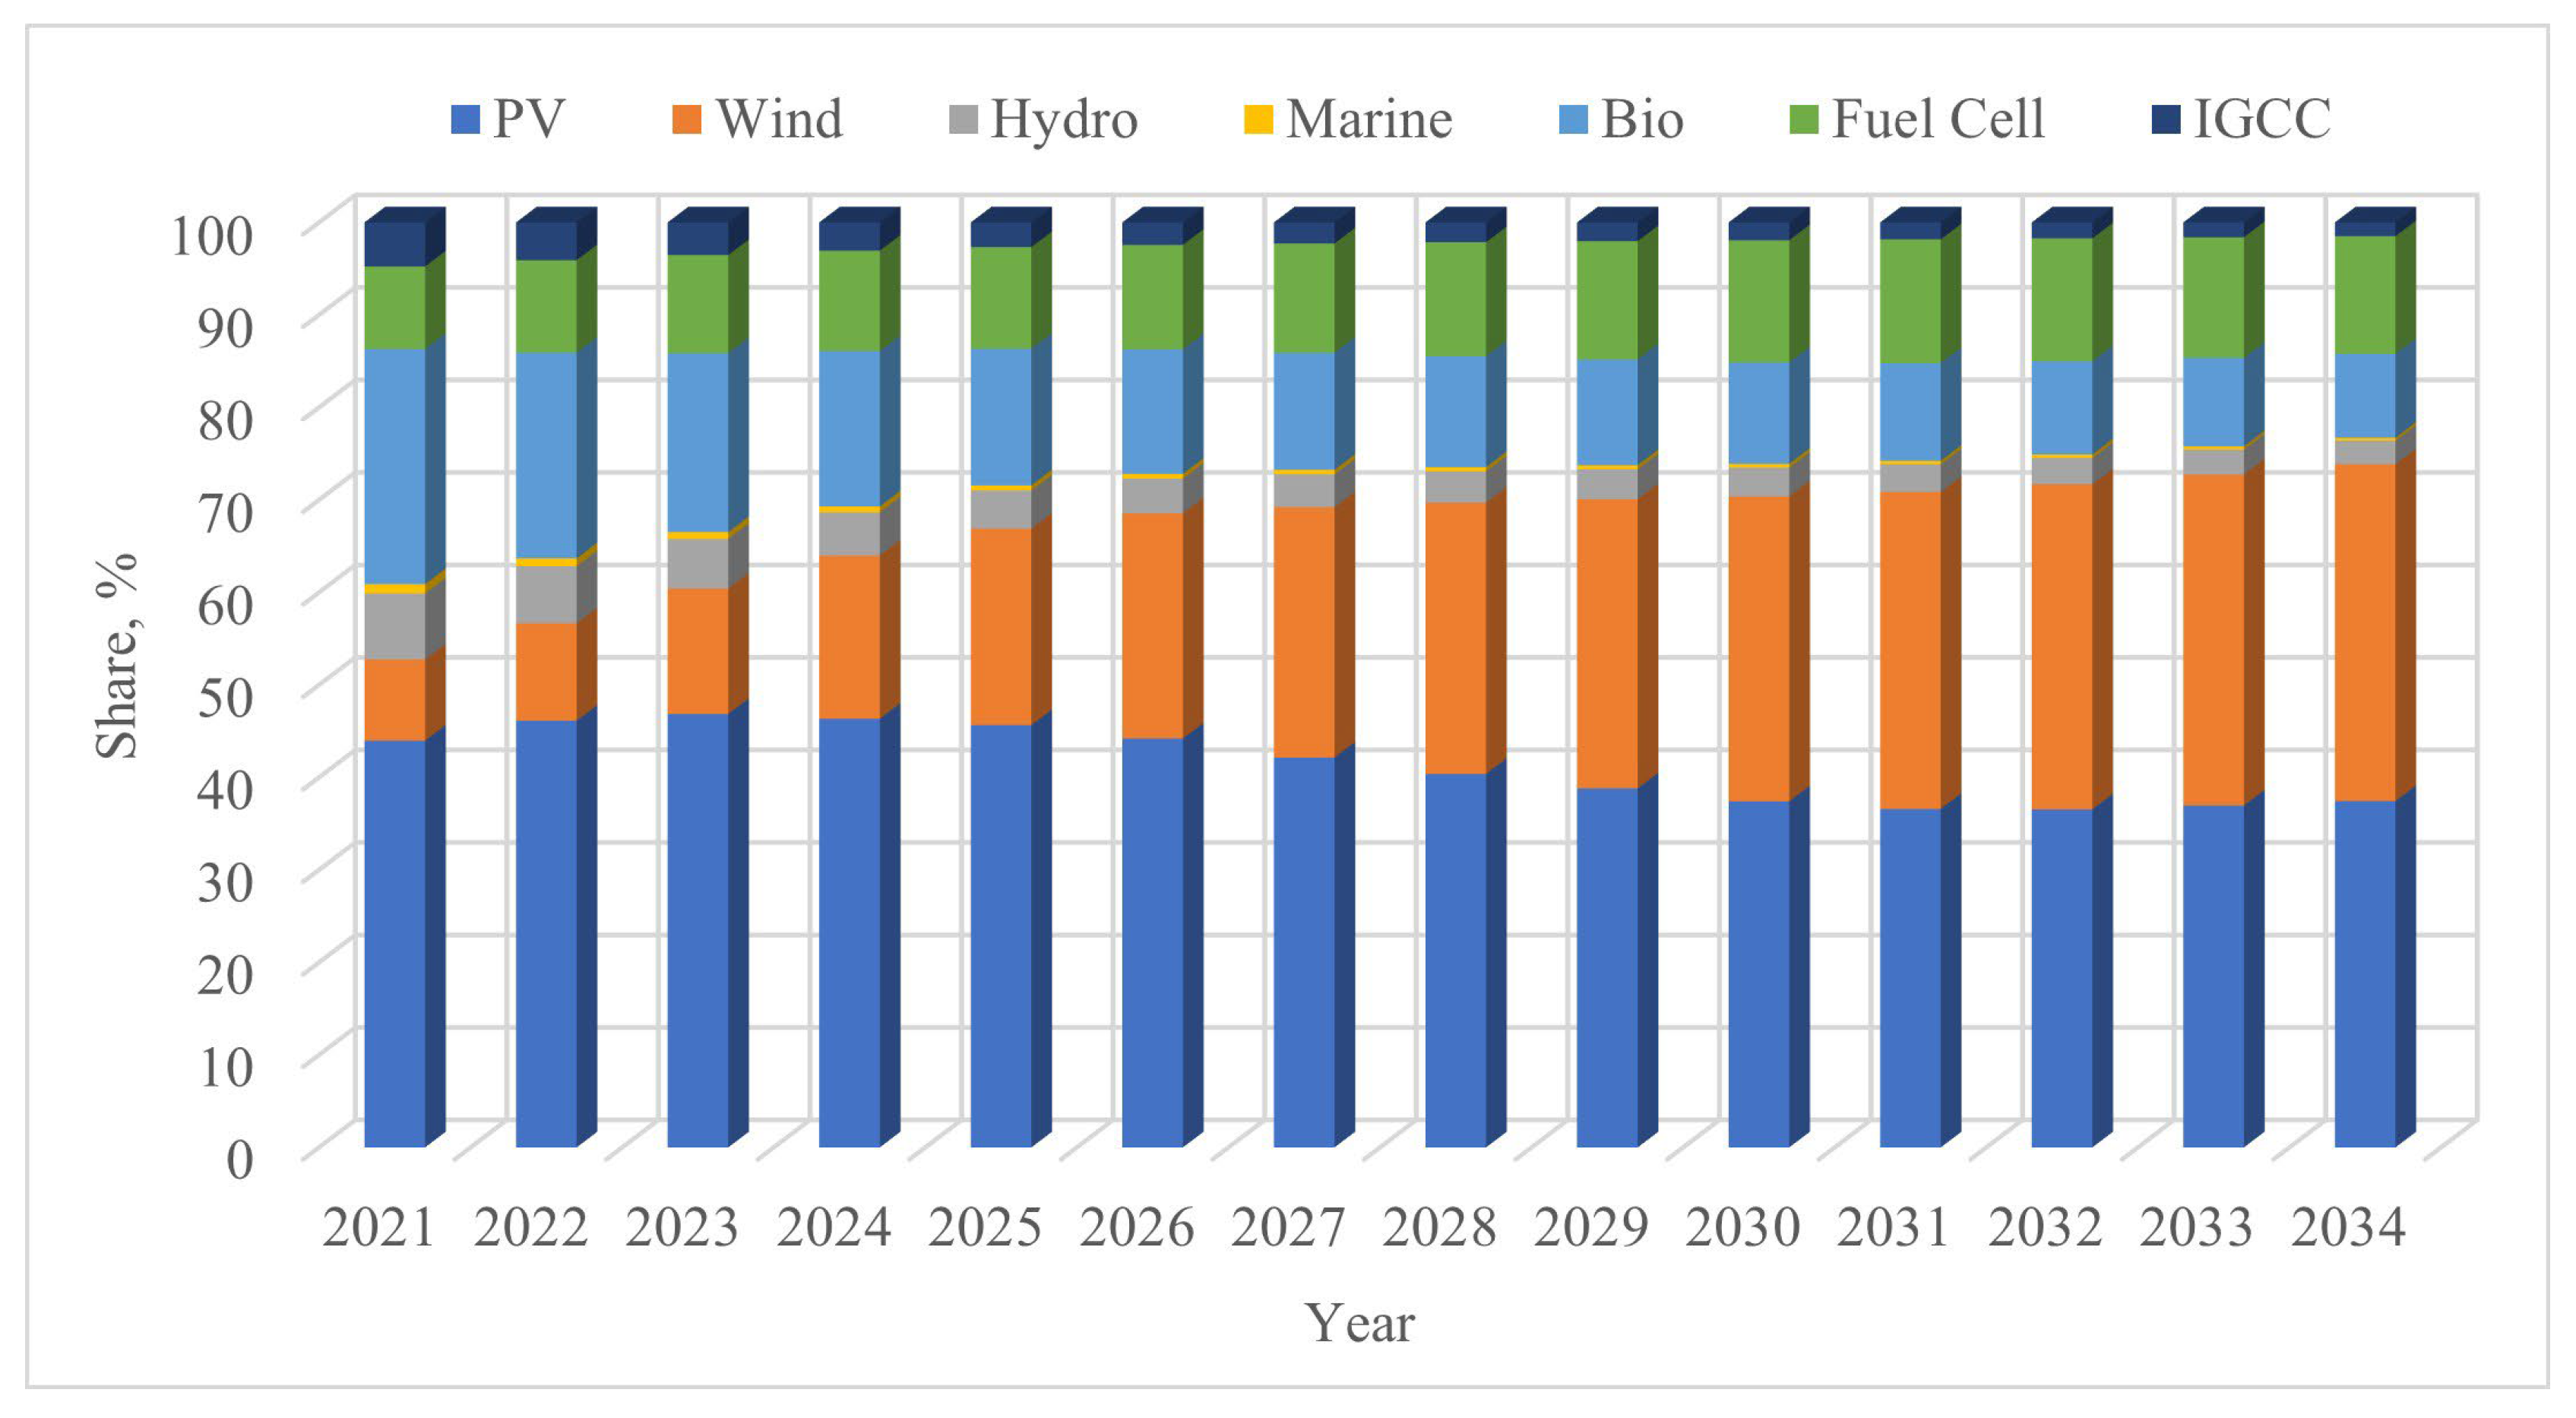
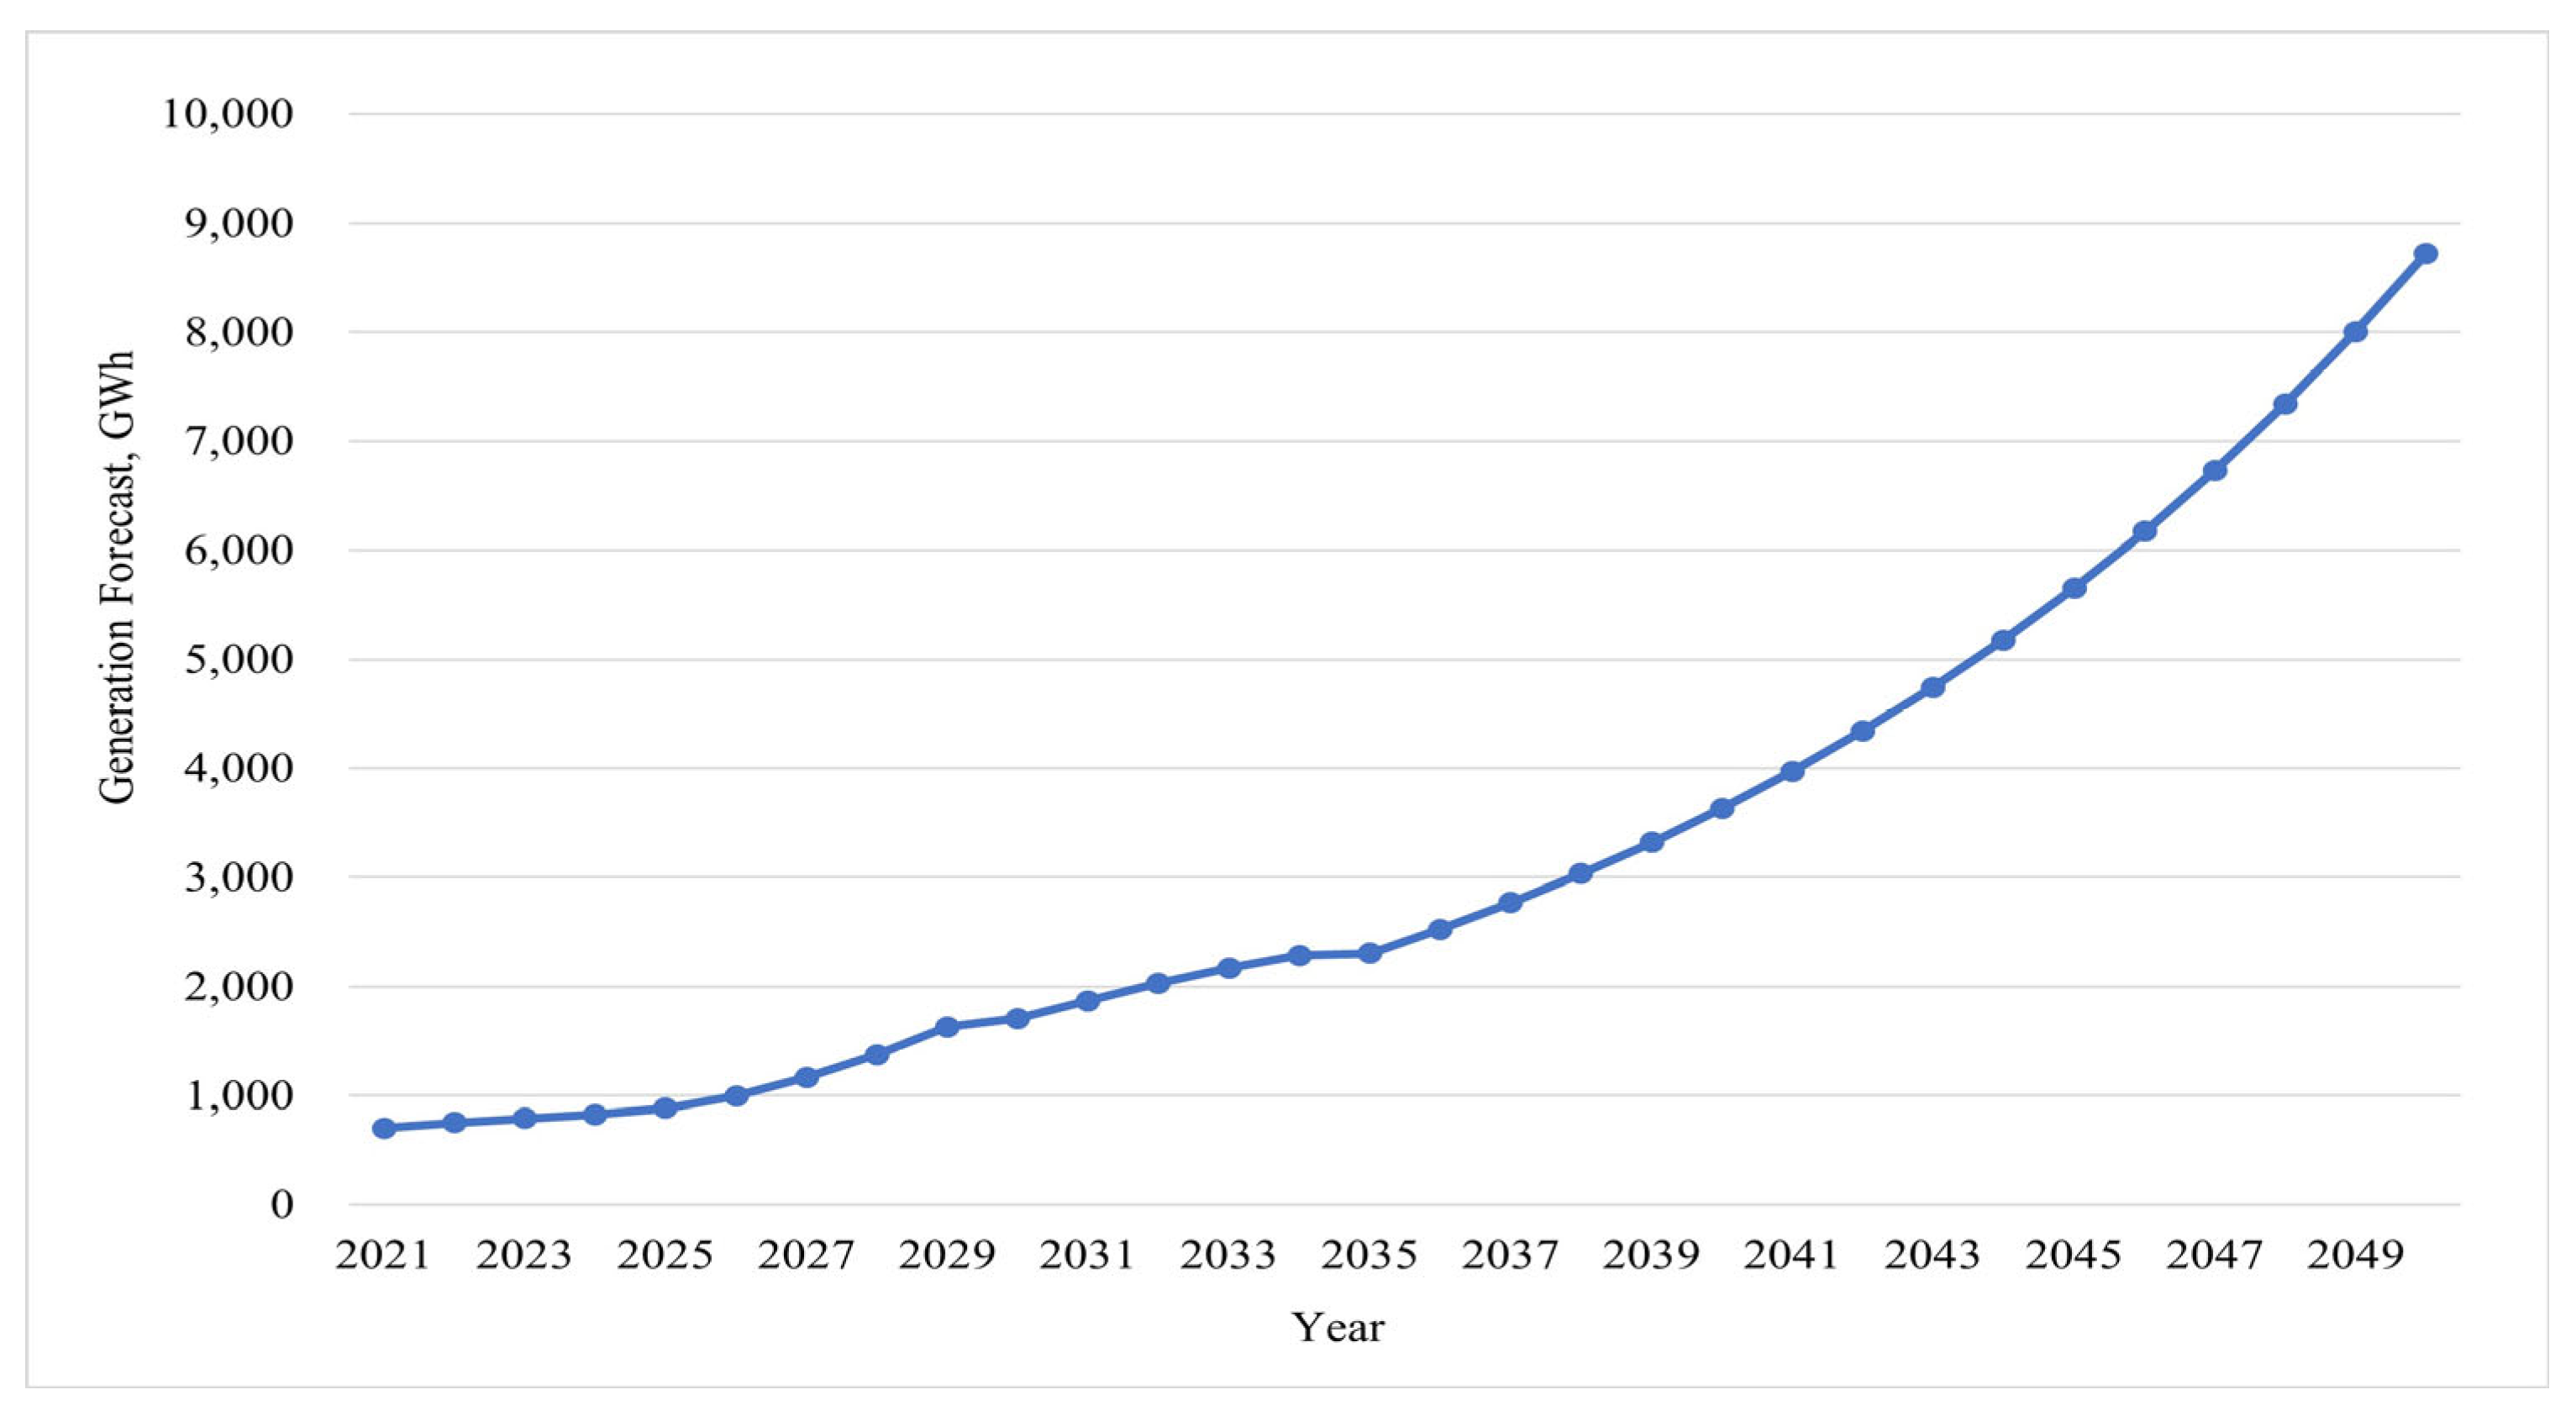
4.2. Generation Forecasts by New and Renewable Energy (NRE) Type
The forecast of the generation of NRE, by the type of NRE, was carried out by allocating the NRE generation values according to the NRE type while excluding the energy for fuel conversion. In this study, renewable energy included hydropower, PV, wind, marine energy, and bioenergy, whereas new energy included fuel cells, IGCC, and ammonia and hydrogen turbines. Note that waste energy was included as renewable energy in the Statistics of Electric Power in Korea (SEPK) until 2019, but after the NRE Act was revised in 2020, it was classified under “other power generation resources” [17]. In our study, the hydro, PV, and wind generation forecasts were obtained by applying the WMA-based forecasting technique, as shown in Figure 13.
Figure 13.
Weighted moving average (WMA)-based forecasting technique of generation of resources for share-based estimation.
In this study, “resources for share-based estimation” are the resources considered for estimating the share of generation until the net-zero target year, based on the shares of generation forecasts for those resources in the BPE. The “share” of generation was used to meet the forecasts of the 2030 NDC and 2050 Carbon Neutrality Scenario plans while ensuring consistency with the most recent BPE. The generation forecasts of NREs other than the “resources for share-based estimation” can be estimated according to the characteristics of each resource while considering the external factors. Note that WMA is used to reflect the inherent trend and recency of the generation of resources.
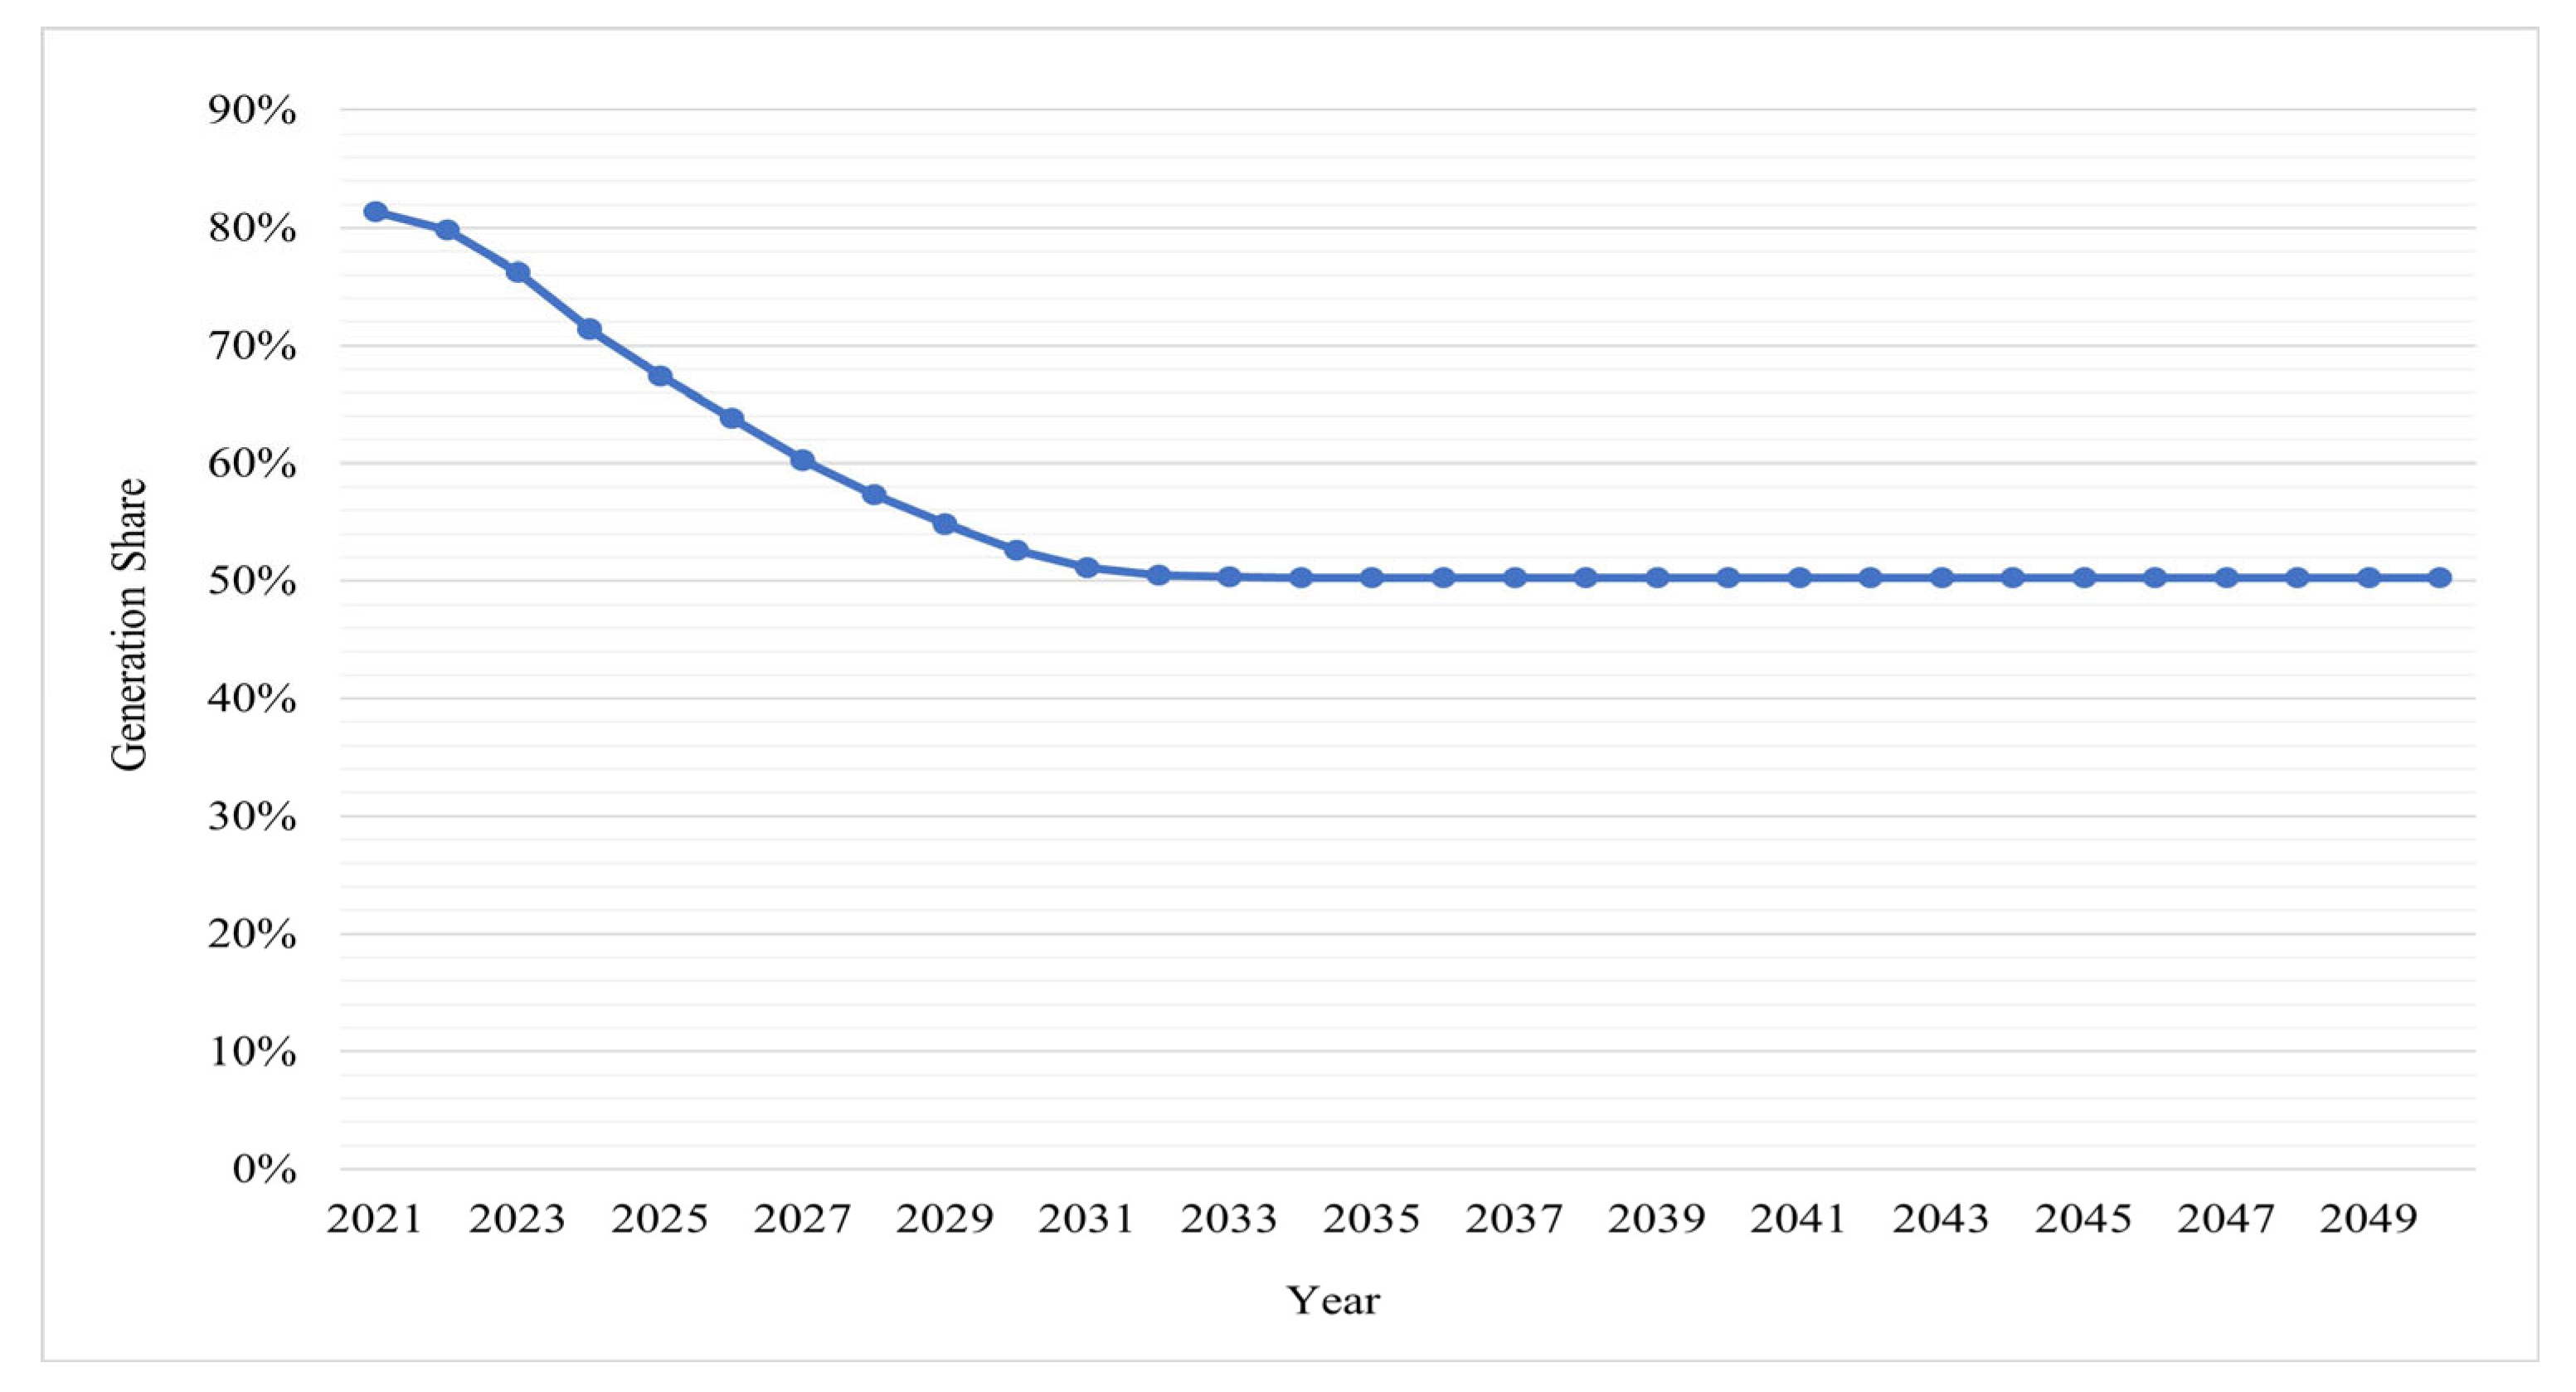
4.2.1. Renewable Energy: Hydro, PV, and Wind
Unlike conventional hydropower, small hydro is easy to install not only in rivers, but also other places such as aquaculture farms and sewage treatment plants. The increase in the 9th BPE’s yearly generation forecasts for hydropower, despite the absence of conventional hydropower to be newly installed, is due to the increase in the small hydro forecasts. The small hydro generation can be calculated by subtracting the conventional hydropower generation from the total hydropower generation. Figure 14, Figure 15, Figure 16, Figure 17, Figure 18 and Figure 19 present the shares of generation from small hydro, PV, and wind in the 9th BPE, along with the corresponding generation forecasts, using the WMA-based forecasting technique. Note that as per our forecast, the shares of PV and wind generation nearly converge after 2034.
Figure 14.
Forecast of small hydro generation share for 2021–2050.
Figure 15.
Forecast of small hydro generation for 2021–2050.
Figure 16.
Forecast of PV generation share for 2021–2050.
Figure 17.
Forecast of PV generation for 2021–2050.
Figure 18.
Forecast of wind generation share for 2021–2050.
Figure 19.
Forecast of wind generation for 2021–2050.
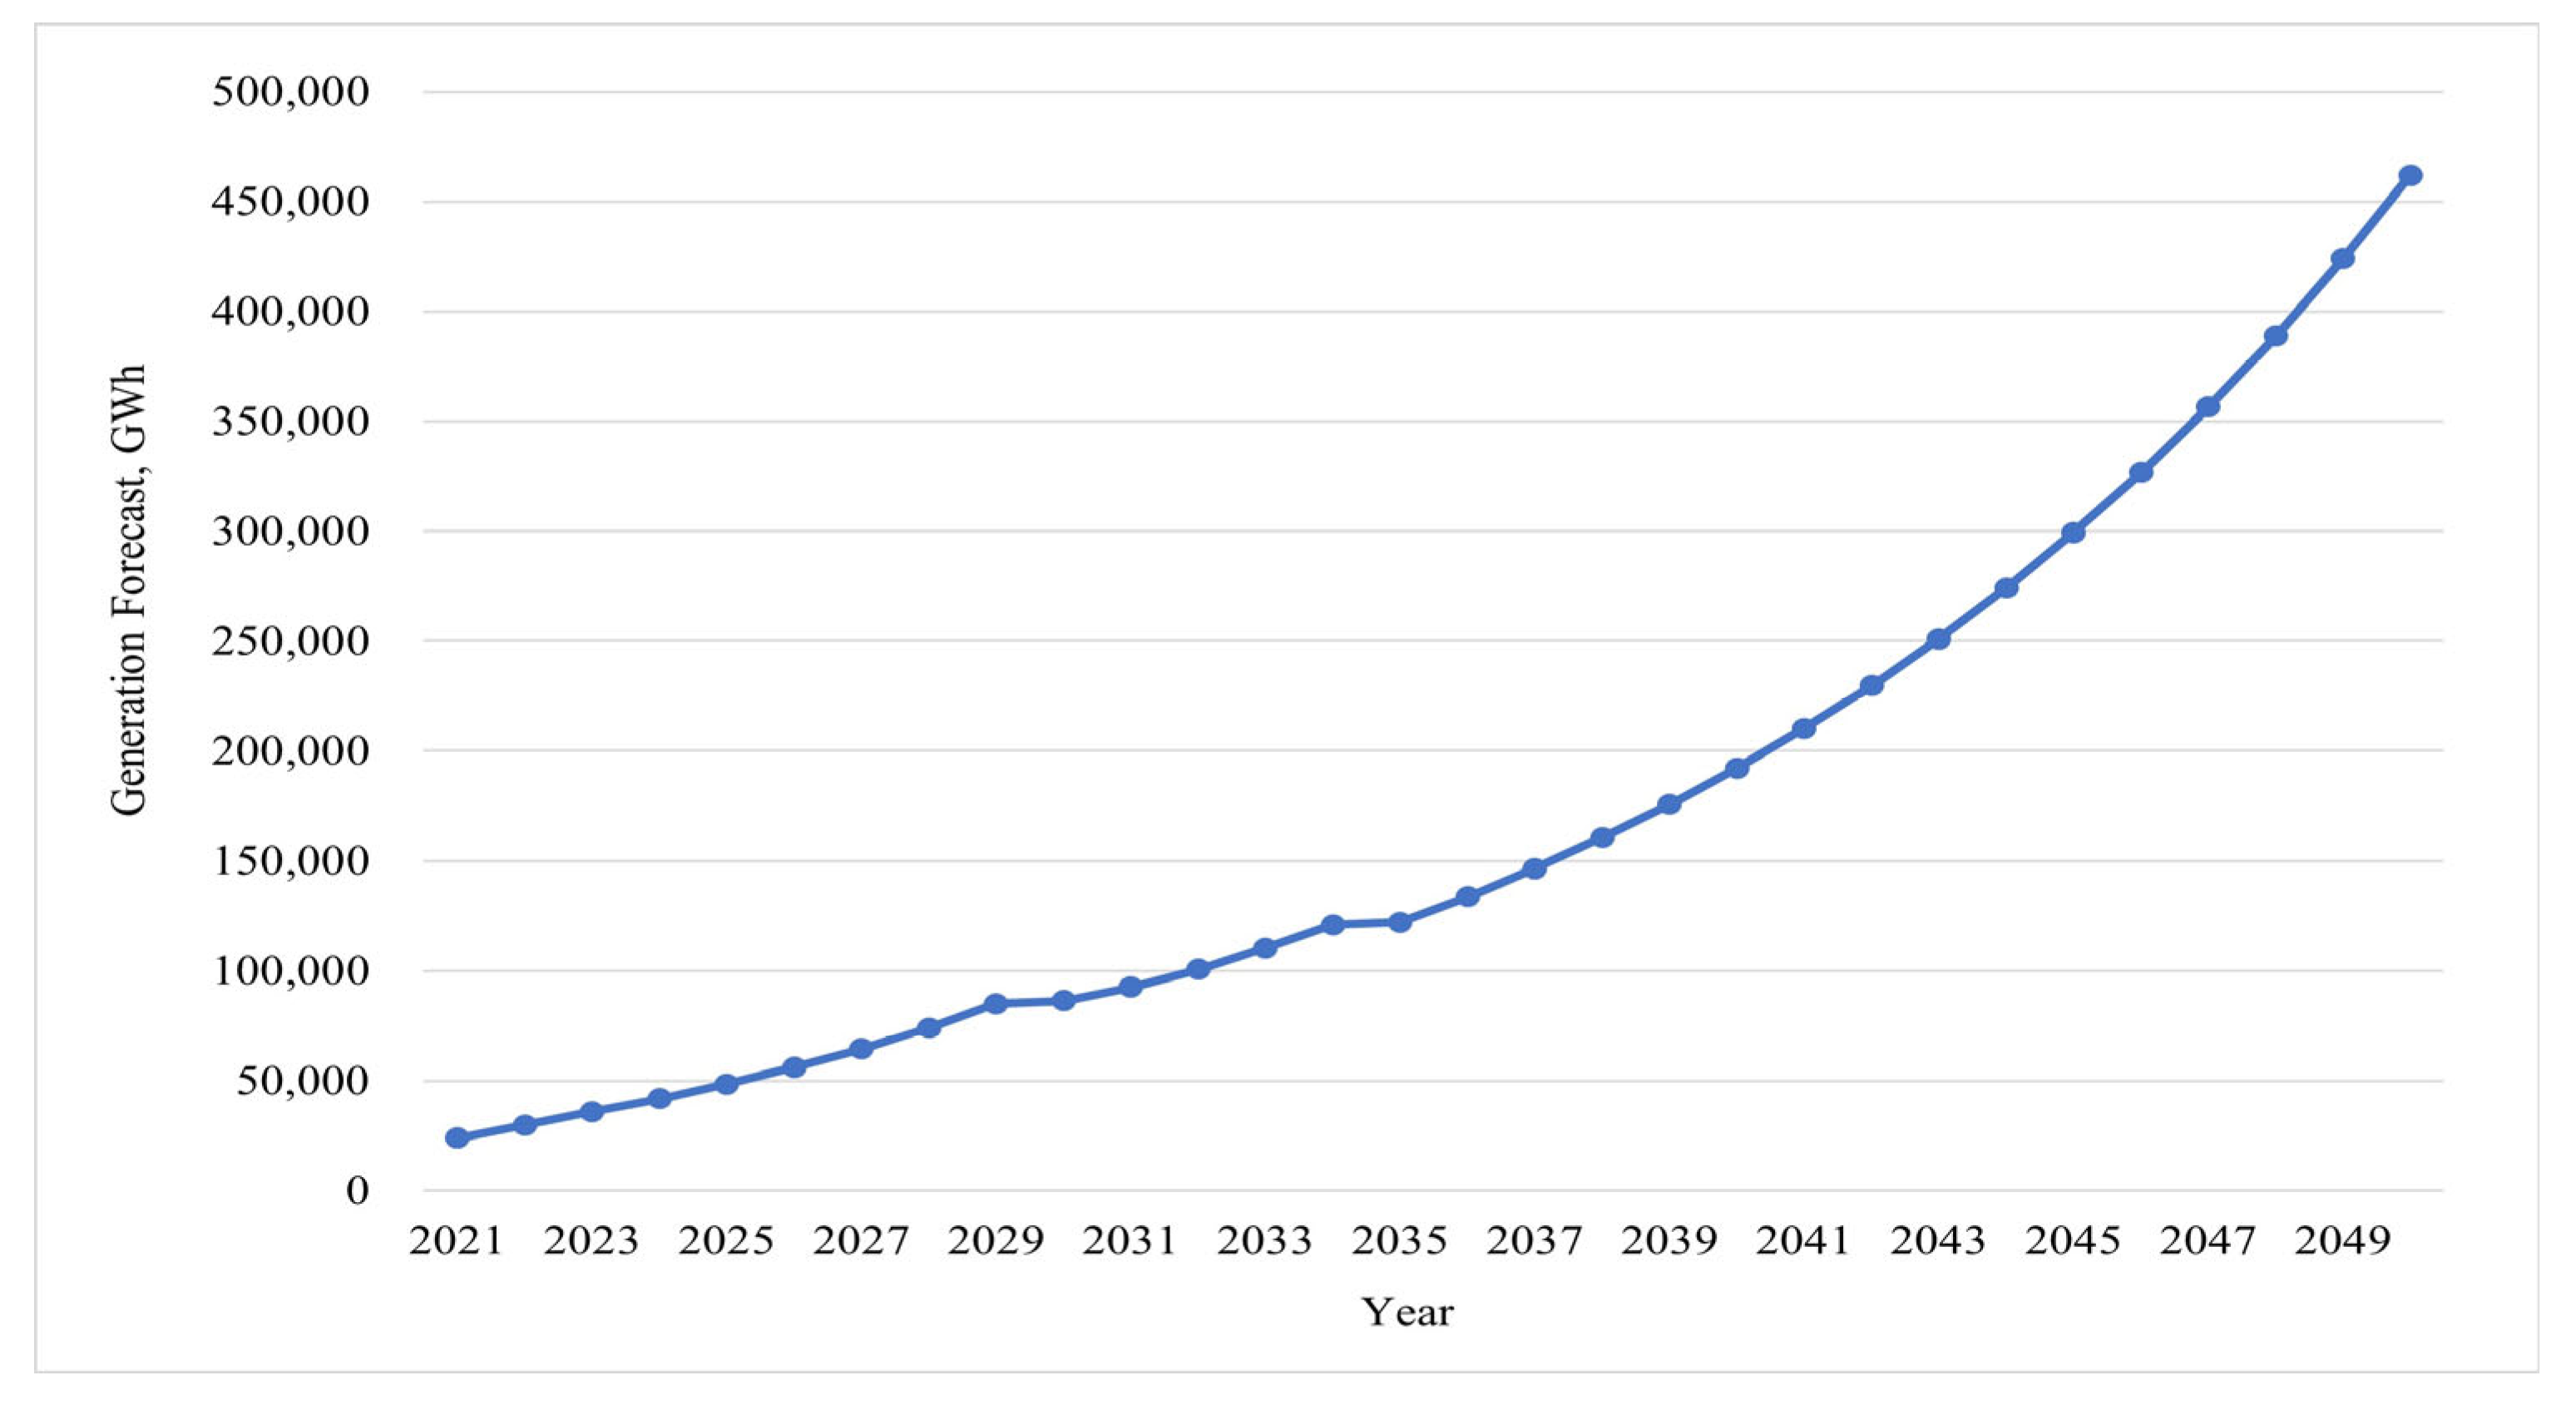
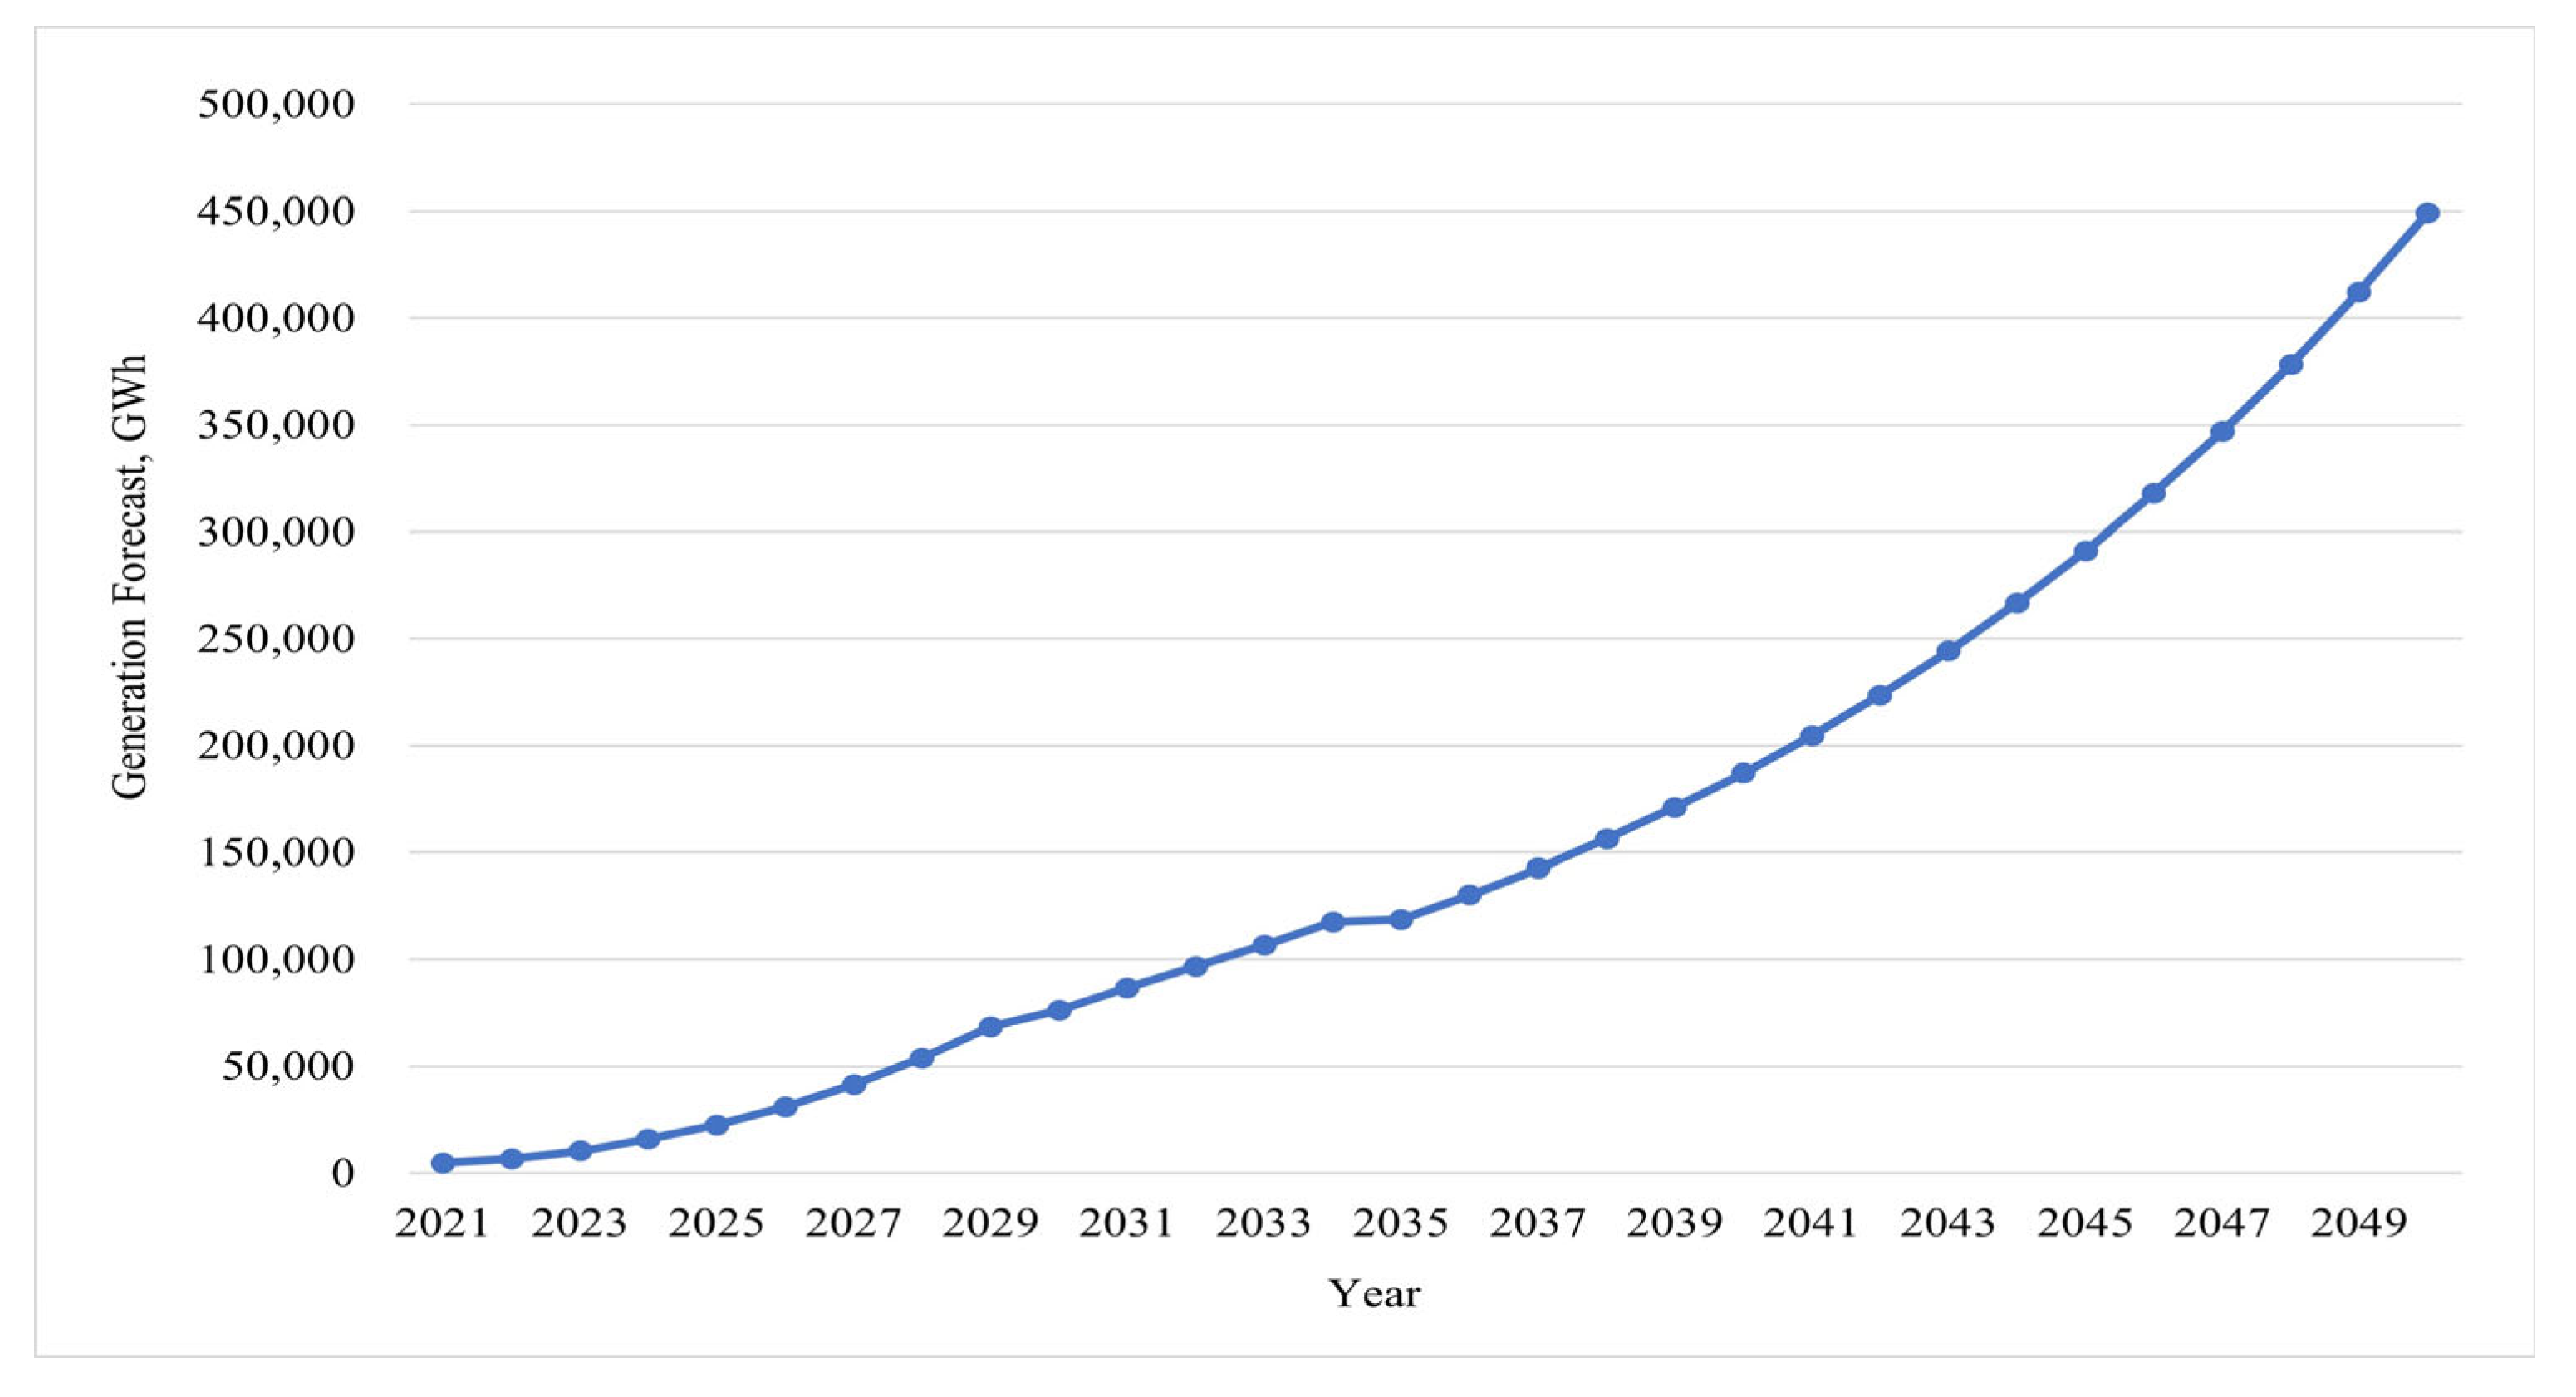
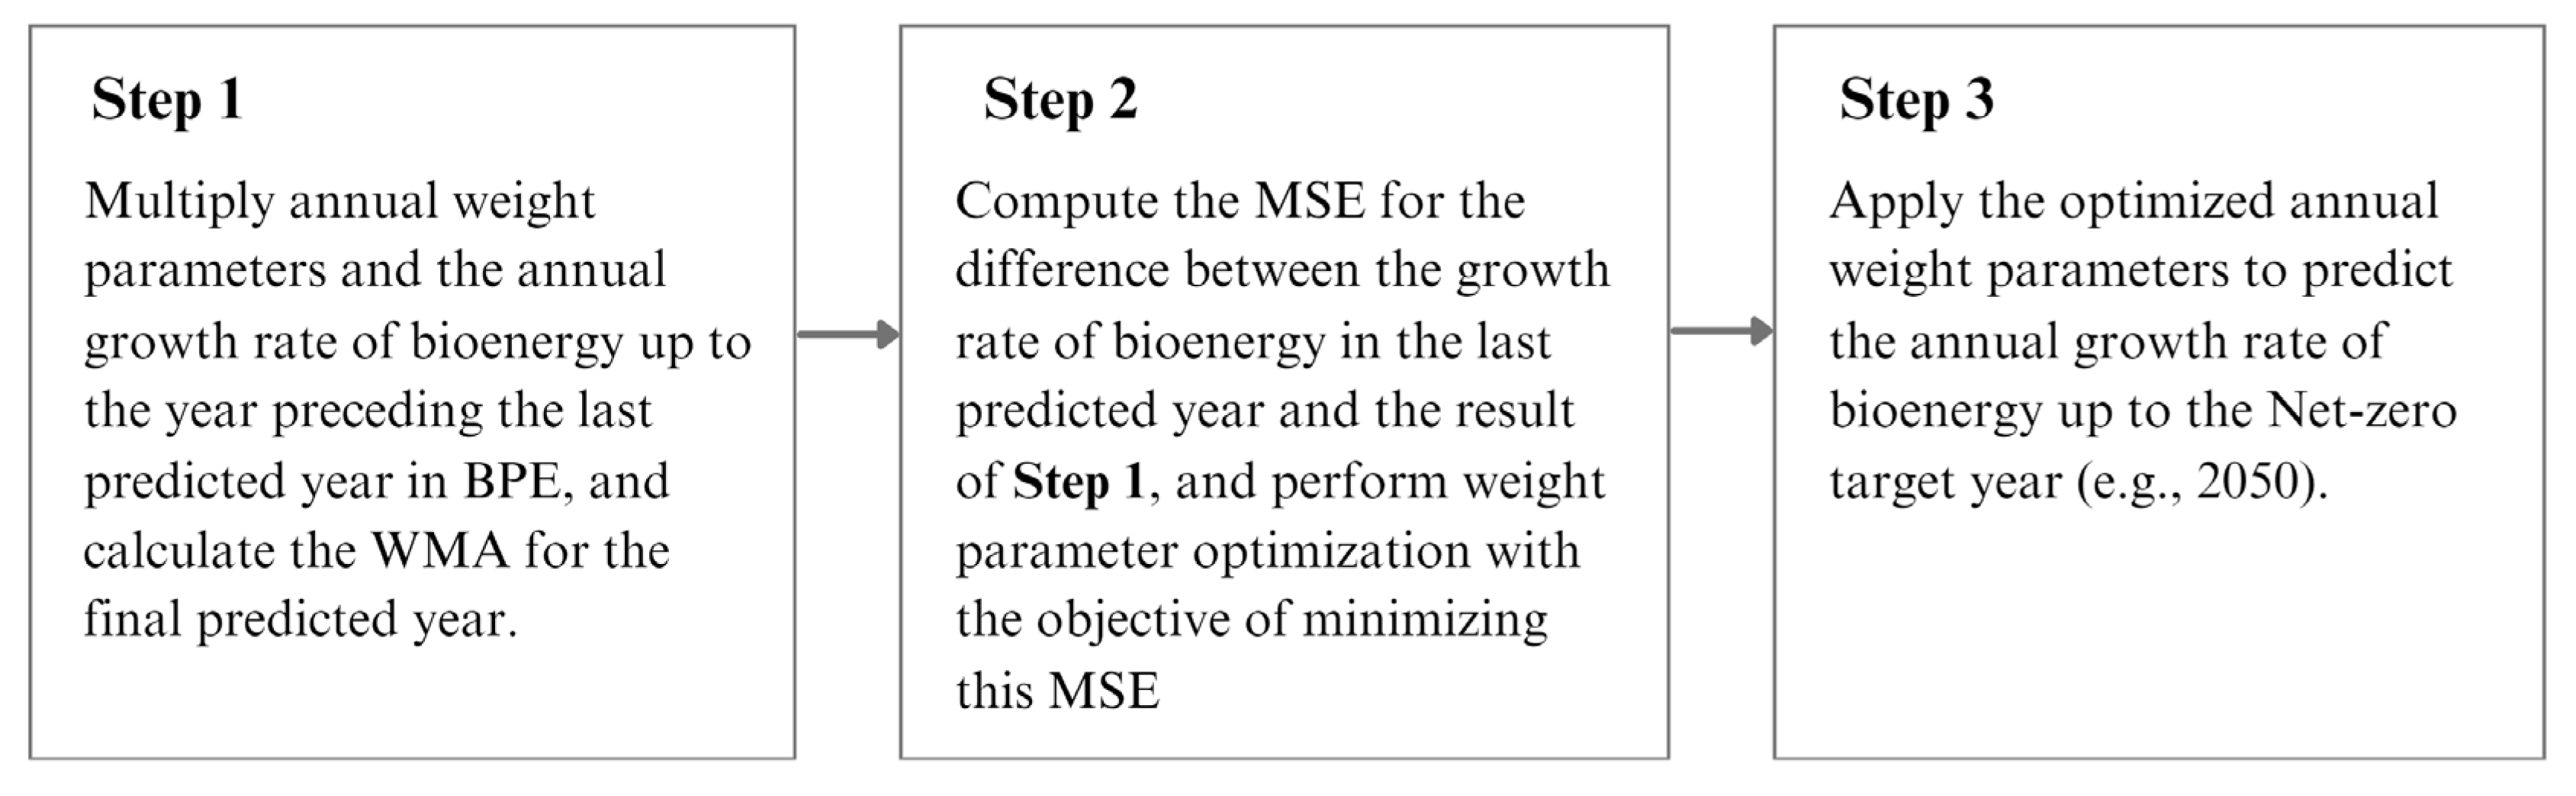
4.2.2. Renewable Energy: Conventional Hydropower, Marine Energy, and Bioenergy
In terms of site selection and environmental impact assessment, the construction of additional conventional hydropower facilities is challenging. According to the generation facility construction plans in the 9th BPE, there is no new capacity for conventional hydropower. Therefore, we assumed that in the future, conventional hydropower generation would remain at the current level. The generation forecast for conventional hydropower from 2021 to 2050 is based on the 2020 value in the SEPK (3,205,979 MWh).
Marine energy includes ocean thermal difference, tidal, wave, and tidal current generation. The marine energy generation facilities in South Korea include the Sihwa Lake Tidal Power Station (254 MW), Uldolmok Tidal Current Power Station [19] (scaled down to 80 kW, as of January 2023), and Jeju Yongsoo Wave Power Plant (0.5 MW). Their total installed capacity is 255.5 MW. The 9th BPE contains no plans to increase the generation capacity of the pants until 2034. As with conventional hydropower, due to environmental impact assessments, there are practical limitations in constructing marine energy facilities. According to the 2020 New and Renewable Energy White Paper in South Korea, the market potential of each marine energy type is estimated to be zero (for the current conditions) [20]. From an economic perspective, this is not yet a suitable resource in the domestic environment. As both 8th and 9th BPEs indicate that the energy from these resources will be the same as the current production, in our forecast, we also considered that these plants will generate 496,000 MWh till 2050.
According to the 9th BPE forecast, the capacity factor of bioenergy is estimated to be approximately 138%. This percentage is calculated by dividing the forecasted total generation capacity for the year 2020 by the product of the forecasted generation capacity and 8760 h. In this case, the predicted generation capacity is 1 GW, and the forecasted total generation is 12,095 GWh. However, this value has been identified as an error. Consequently, using the forecasts from the 9th BPE, we extracted only the annual generation growth rates and applied them to the 2020 values, to obtain the forecasts for 2021–2050. The annual generation growth rates from 2021 to 2034 can be calculated as “(generation of current year—generation of previous year) ÷ generation of previous year,” based on the 9th BPE. The annual generation growth rates for 2035–2050 were estimated using the WMA-based forecasting technique, as shown in Figure 20.
Figure 20.
Weighted moving average (WMA)-based forecasting technique for bioenergy generation growth rate.
Figure 21 shows the generation growth forecasts developed using the abovementioned optimal weights. By applying this growth rate to the 2020 value, we estimated the annual bioenergy generation forecasts, as shown in Figure 22.
Figure 21.
Forecast of bioenergy generation growth rate for 2021–2050.
Figure 22.
Forecast of bioenergy generation for 2021–2050.
Bioenergy is an energy source for fuel conversion. According to the 2020 values, full- and mixed-combustion generation totaled 4,991,180 MWh and 1,593,050 MWh, respectively. Assuming that the capacity factor of bioenergy full-combustion facilities will remain constant in the future, in this study, the annual forecasts of the total electricity generation until 2050 were identical to those for 2020. Furthermore, in general, fuel conversion occurs when the mixed-combustion generation of bioenergy exceeds the generation of the resources subject to fuel conversion. Accordingly, to obtain the annual mixed-combustion generation forecasts, we subtracted the annual full-combustion generation forecasts from the total annual generation forecasts. The results are shown in Figure 23.
Figure 23.
Forecast of bioenergy mixed-combustion generation for 2021–2050.
4.2.3. New Energy: Fuel Cells, Integrated Gasification Combined Cycle (IGCC), and Ammonia and Hydrogen Turbines
We suggest that based on the fuel cell generation forecasts for 2050 in the 2050 Carbon Neutrality Scenario Plan, the existing forecasts must be updated. Based on the 9th BPE, we estimated the share of fuel cell generation from the shares of PV, wind, small hydro, and fuel cells in 2021, and multiplied this by the combined generation from PV, wind, small hydro, and fuel cells in 2021, to obtain the generation from fuel cells in 2021. This method was used to exclude the NREs, whose forecasts were predetermined by other factors, and maintain the forecast share for each NRE type, according to the 9th BPE (as much as possible). Based on the generation in 2021 and the fuel cell forecast in 2050, the annual CAGR was approximately 4.42%. Figure 24 shows the fuel cell generation forecasts estimated by applying this method.
Figure 24.
Forecast of fuel cells generation for 2021–2050.
The Taean IGCC Power Plant is the only IGCC generation facility in South Korea. Note that that carbon emissions of IGCC’s are 78% that of coal power, which is considerably high. Therefore, this resource is unsuitable to achieve the goal of carbon neutrality. In the 9th BPE, the annual generation forecasts for IGCC are the same until 2034. From 2034 to 2050, the generation decreases linearly, as shown in Figure 25.
Figure 25.
Integrated gasification combined cycle (IGCC) generation forecast for 2021–2050.
Along with hydropower generation, a recent International Energy Agency (IEA) report cites ammonia power generation as a key alternative, to minimize the formation of stranded assets from the existing power facilities and provide flexibility against the volatility of renewable energy sources. Ammonia turbines can be constructed by retrofitting or replacing parts of coal/LNG generation facilities. Japan has completed basic demonstrations of ammonia combustion technology in various power generation fields (coal, LNG, and fuel cells) and is also, planning the demonstration of 1-GW mixed-combustion coal generation by 2024 [21]. Domestically, The Korea Southern Power Company has taken the lead (among all the Korean power generation companies) and announced plans to commercialize 20-% ammonia mixed-combustion in 2024. In a policy briefing in November 2021, the government also mentioned a plan to commercialize 20-% ammonia mixed-combustion generation by 2030. For commercialization, it is important to establish a demonstration of mixed combustion, along with an effective distribution and supply system for ammonia, to promote inter-industry collaboration and policy support.
According to the 2030 plan of the government to commercialize 20% ammonia mixed-combustion generation, the operation of power production from ammonia mixed-combustion is set for 2030. The generation in 2030 is estimated to be 22 TWh, the same as that estimated in the NDC forecast. The carbon-free turbine generation forecast in 2050 is estimated to be 270 TWh, which includes hydrogen turbine generation in 2050. We divided this into half and considered a generation forecast of 135 TWh in 2050. Assuming that the growth rate from 2030 to 2050 would remain consistent, the CAGR would be approximately 9.45%. Figure 26 shows the generation forecast developed by applying this method.
Figure 26.
Ammonia turbine generation forecast for 2021–2050.
Most policies suggest that the hydrogen turbine facilities will be built by retrofitting, or replacing, the parts of the existing LNG generation facilities. In a policy briefing in November 2021, the government officially announced a plan to commercialize 30% hydrogen mixed-combustion generation by 2035; however, the generation forecast for 2035 has not been confirmed. Accordingly, in this study, we assume that hydrogen turbine use will begin in 2035, with the generation forecast being 22 TWh (as per the 2030 ammonia generation forecast). As for ammonia turbines, the 2050 generation target is estimated to be 135 TWh, half of the total carbon-free turbine generation in 2050. Assuming that the growth rate from 2030 to 2050 will remain constant, the CAGR would be ~12.85%. Figure 27 shows the generation forecast developed by applying this method.
Figure 27.
Hydrogen turbine generation forecast for 2021–2050.
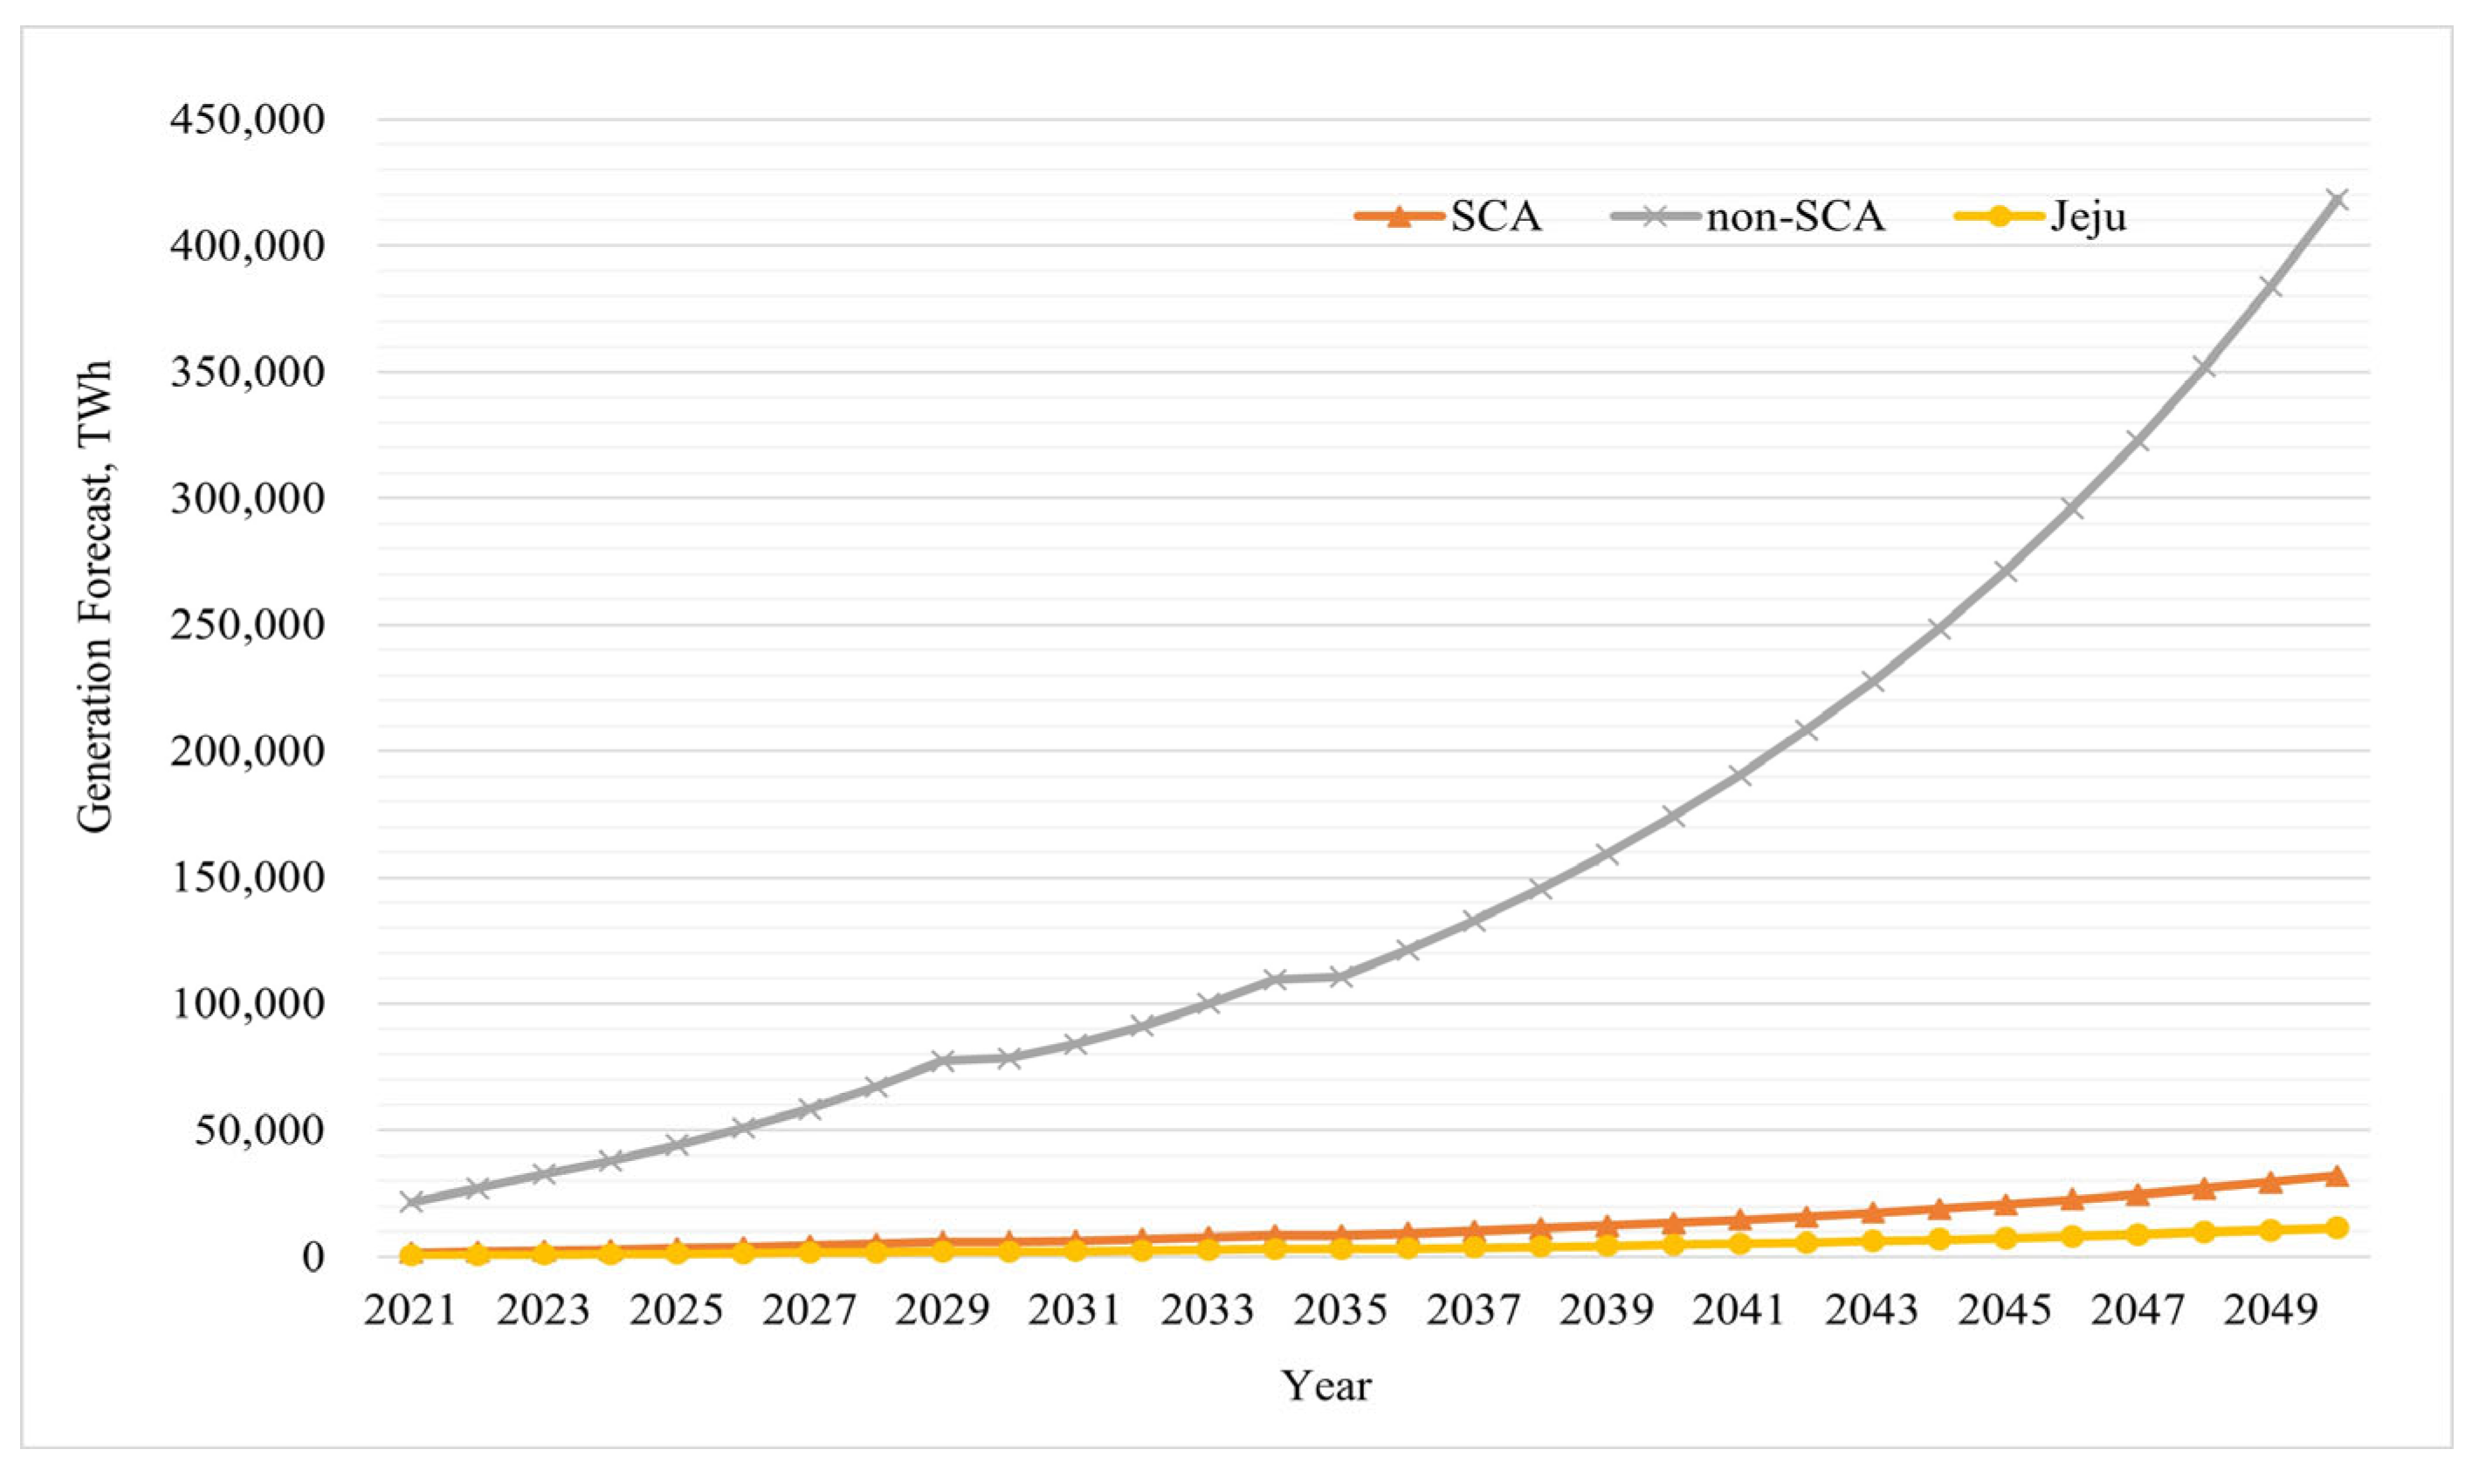
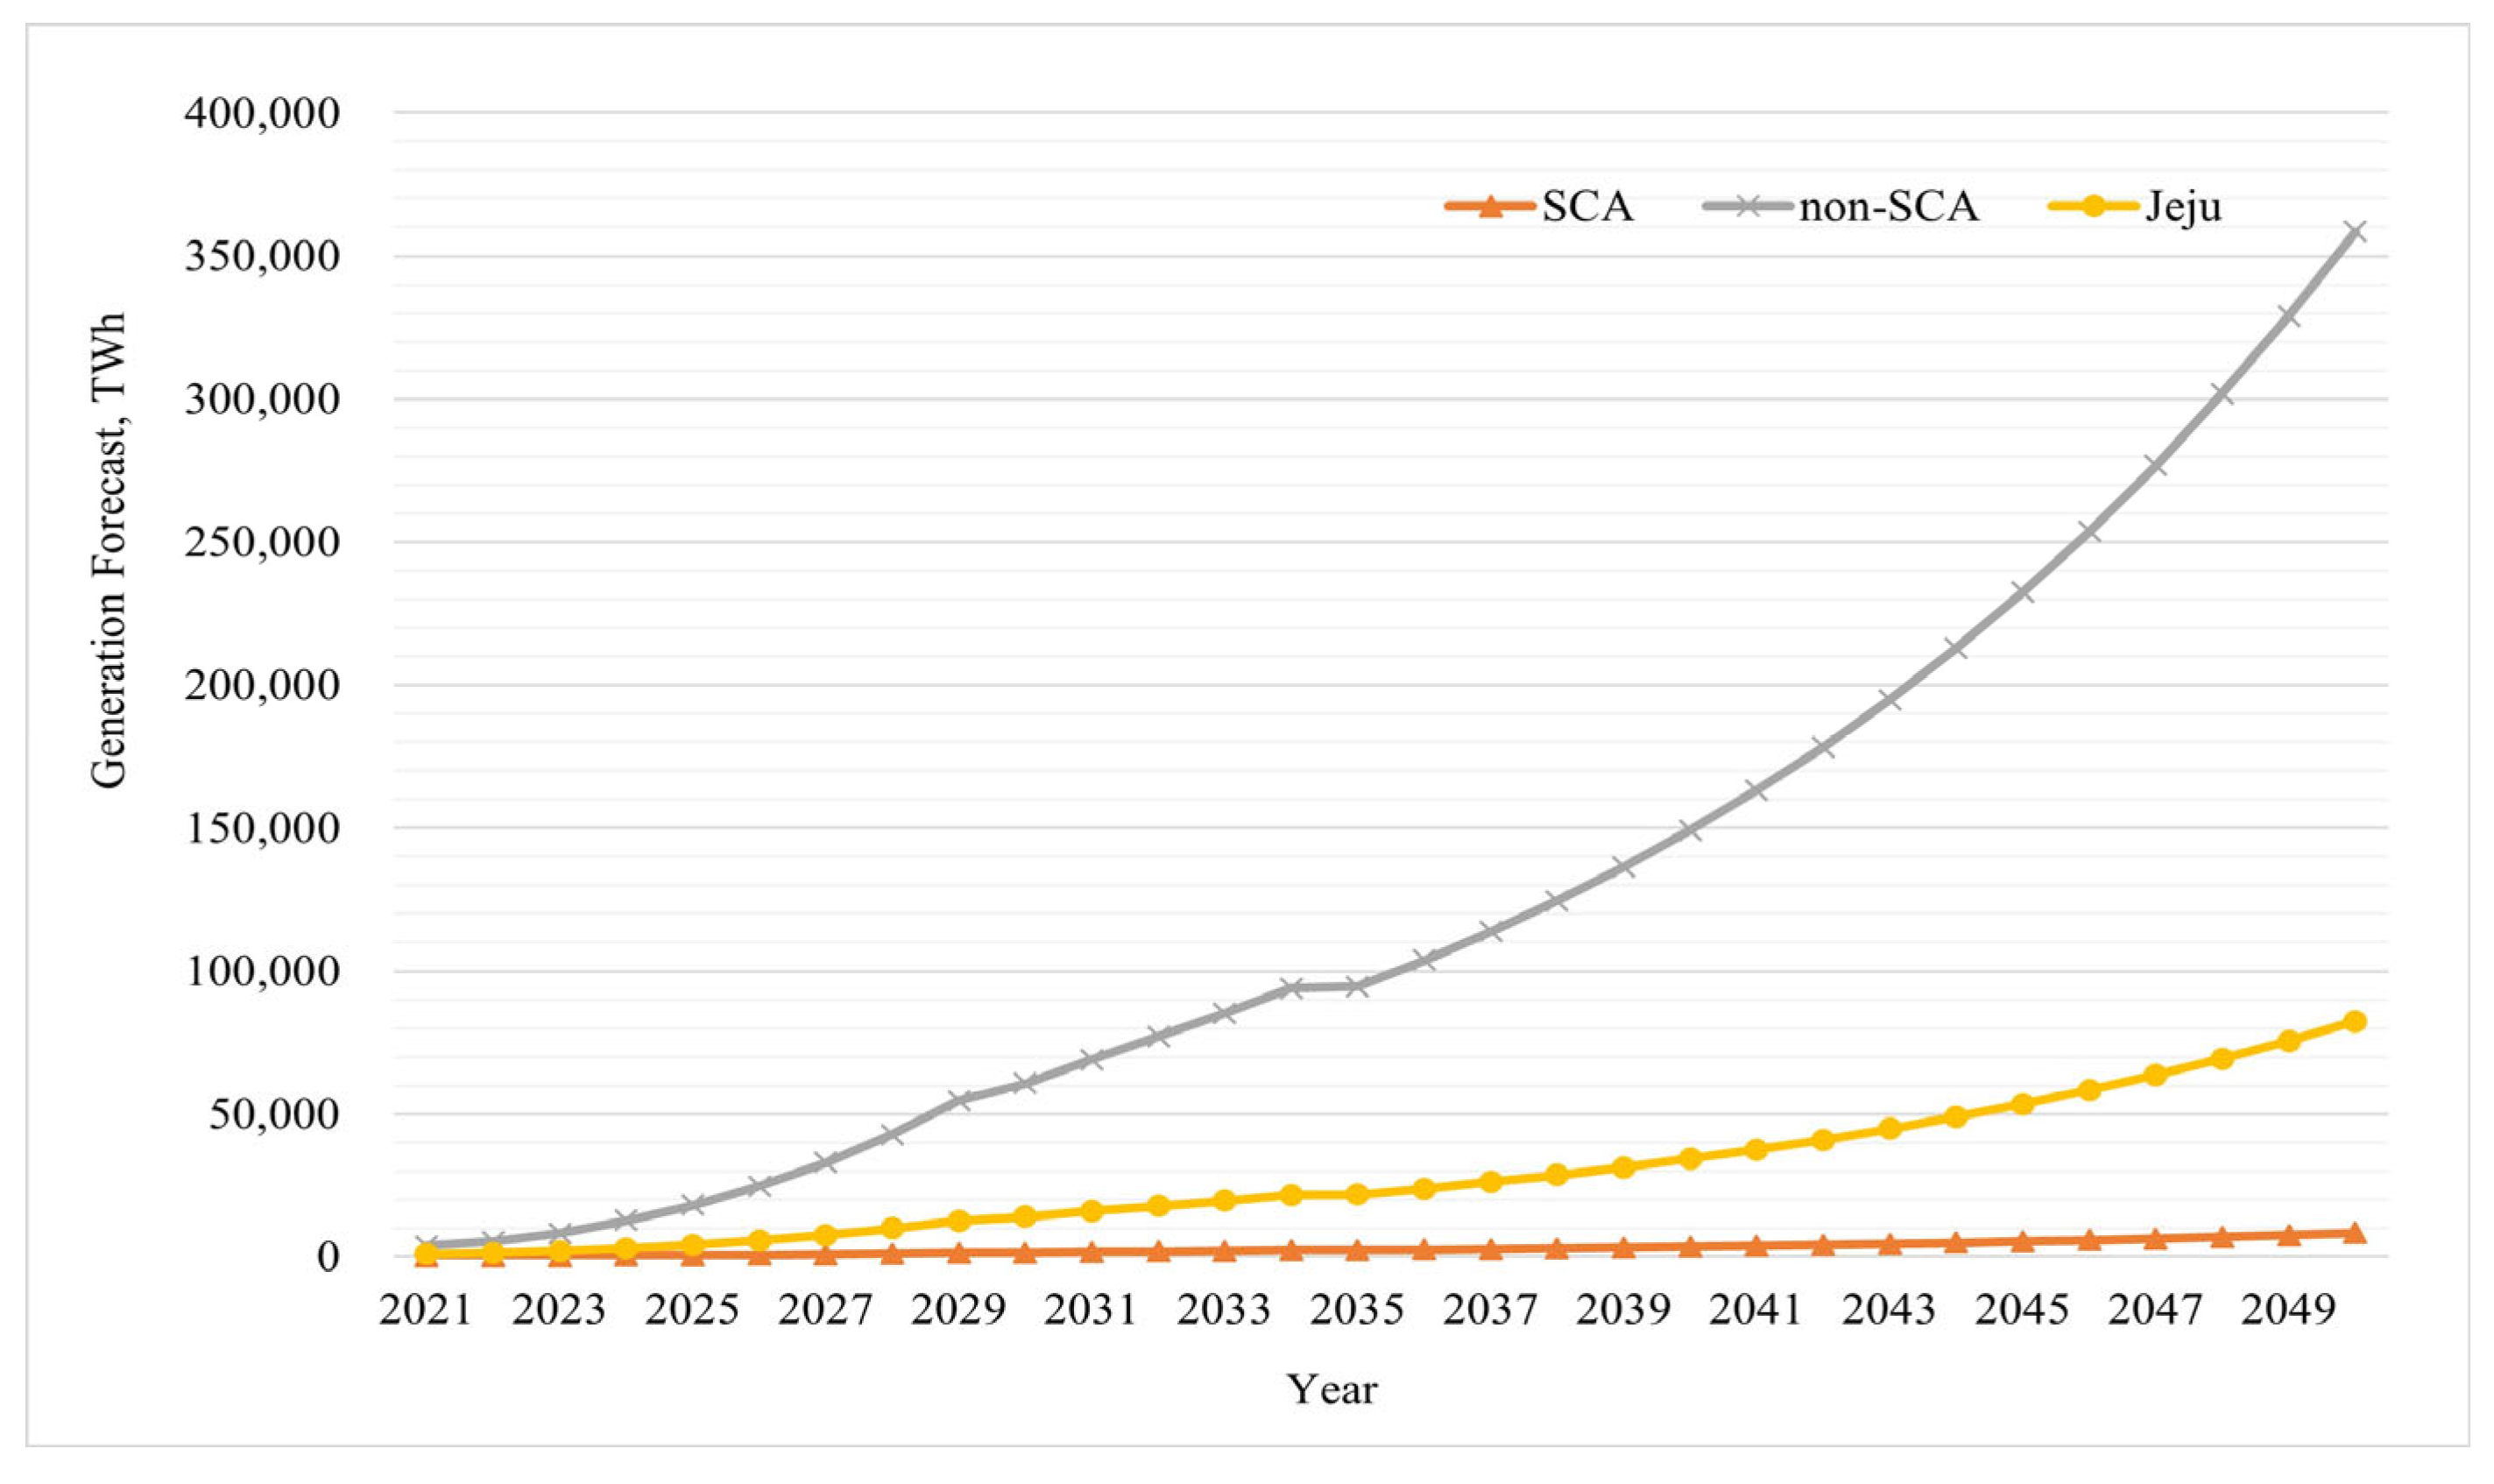
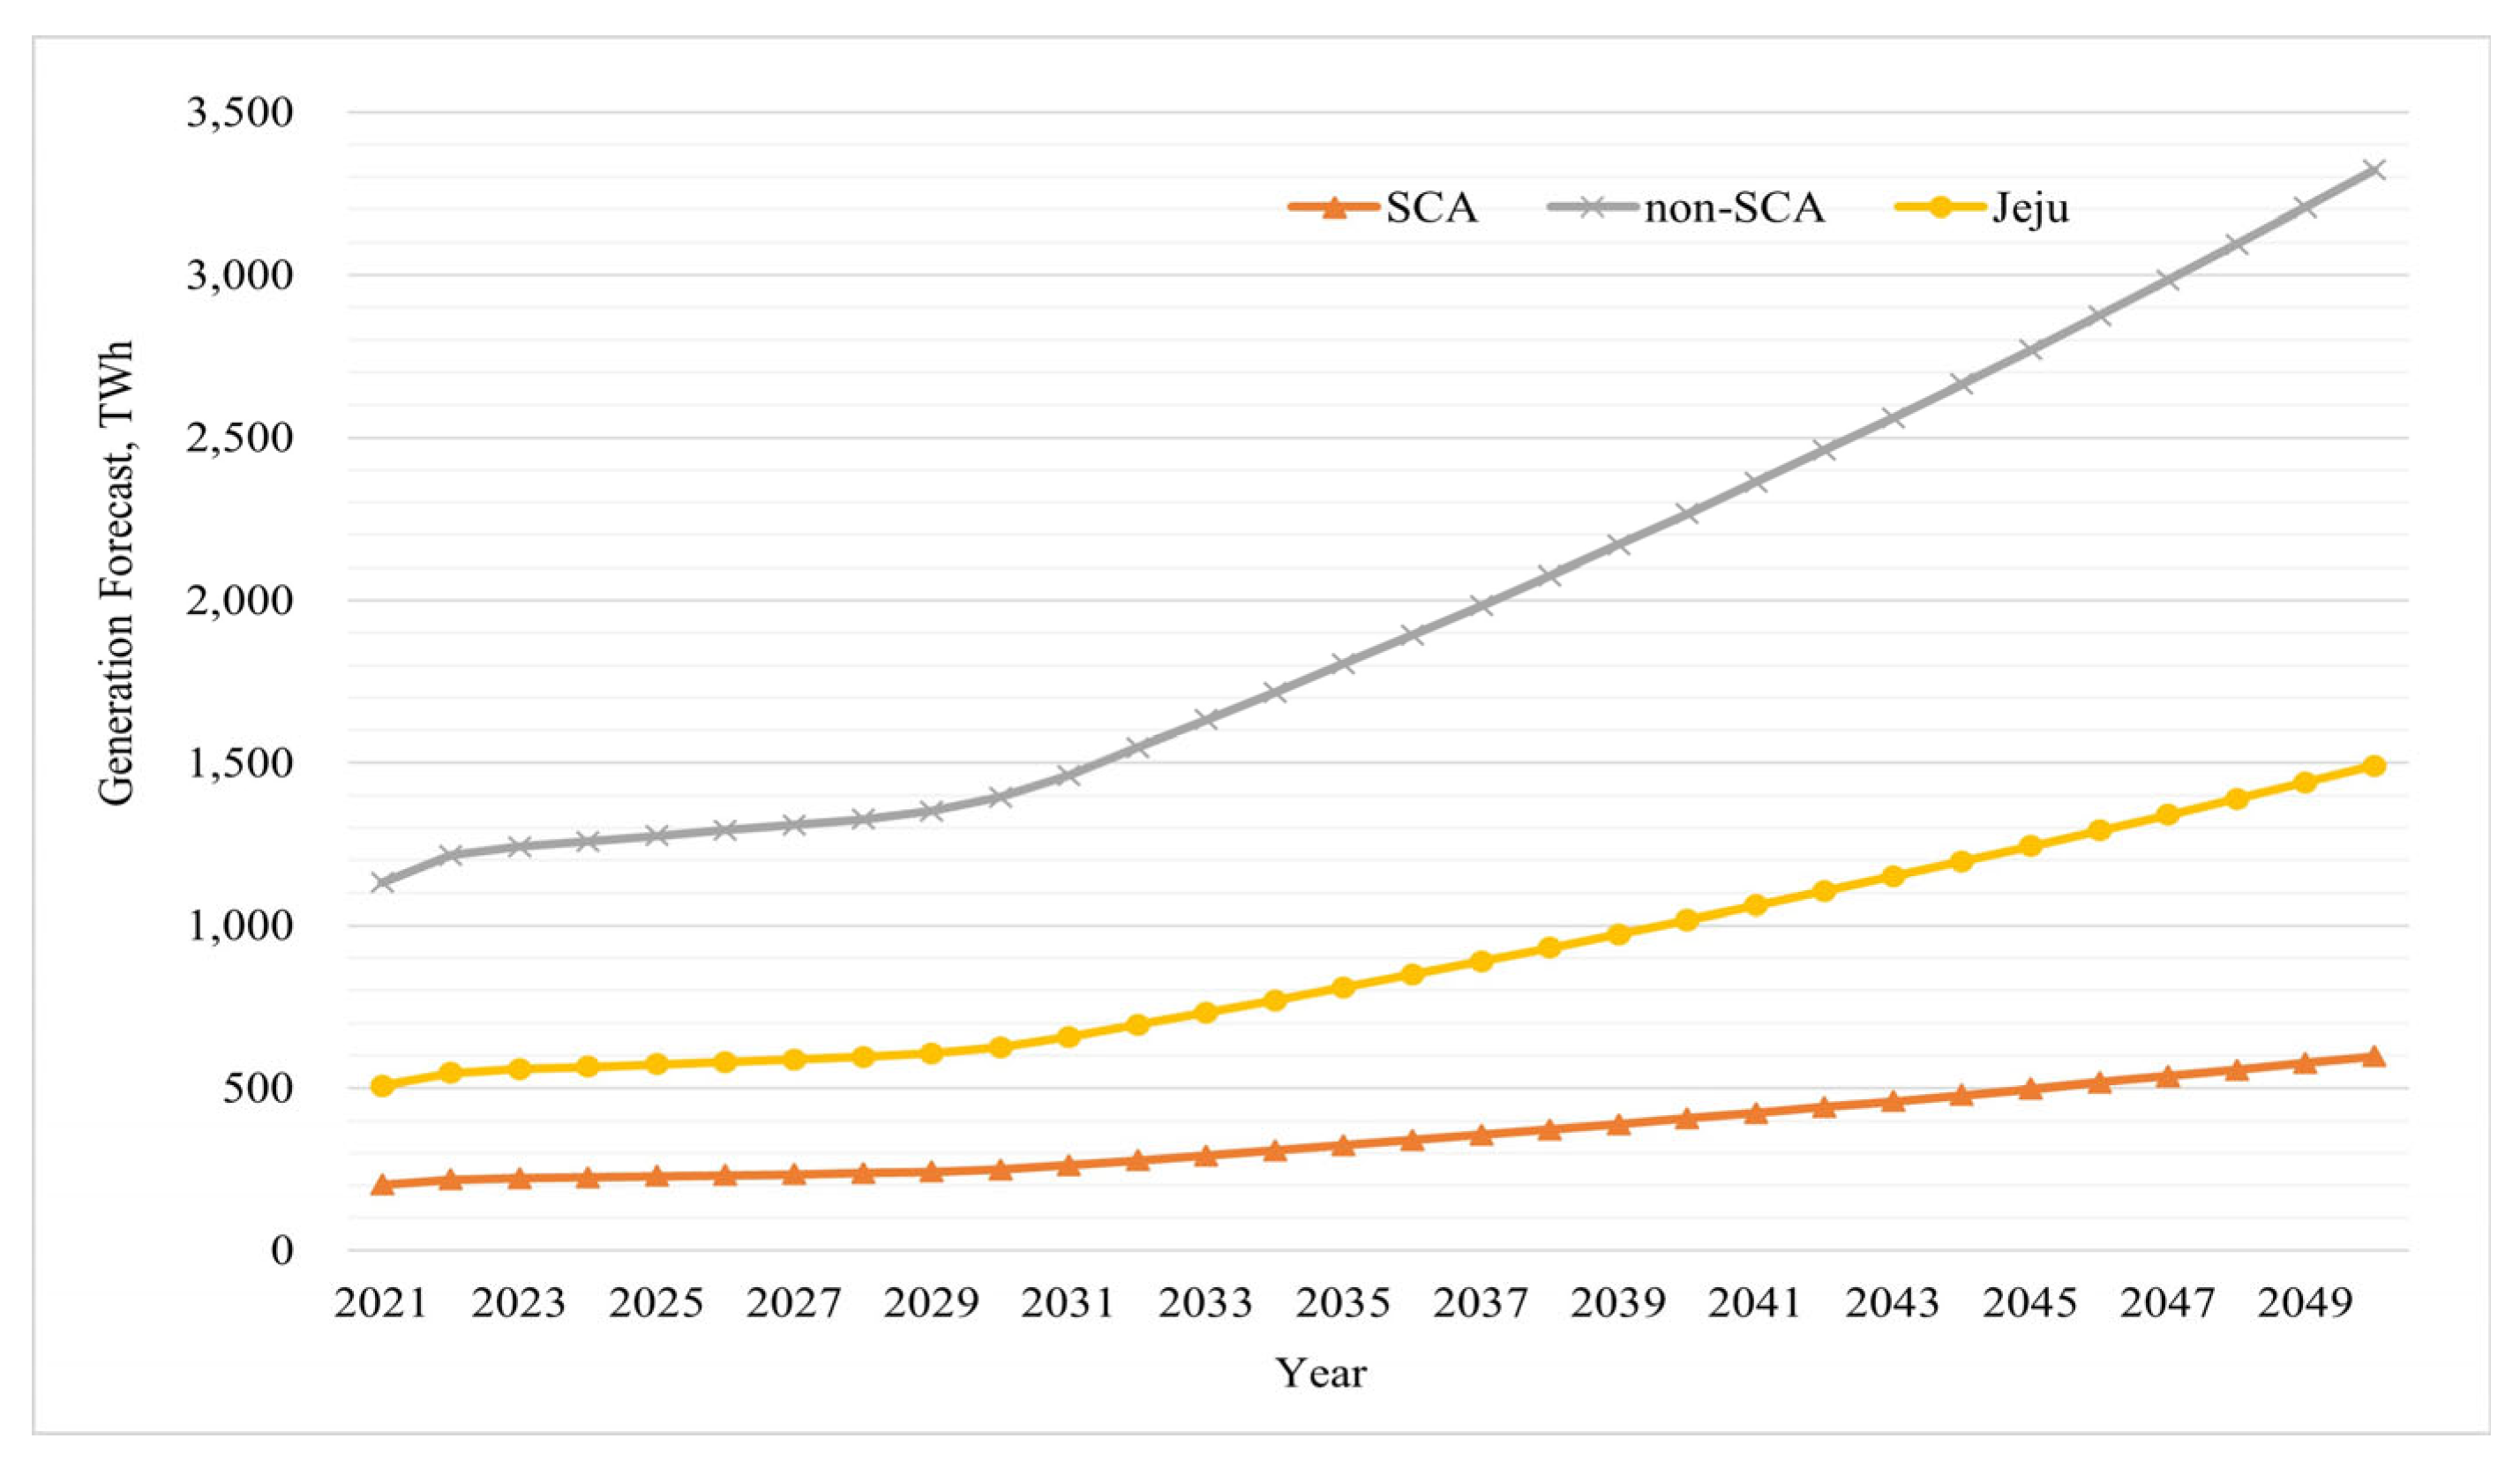
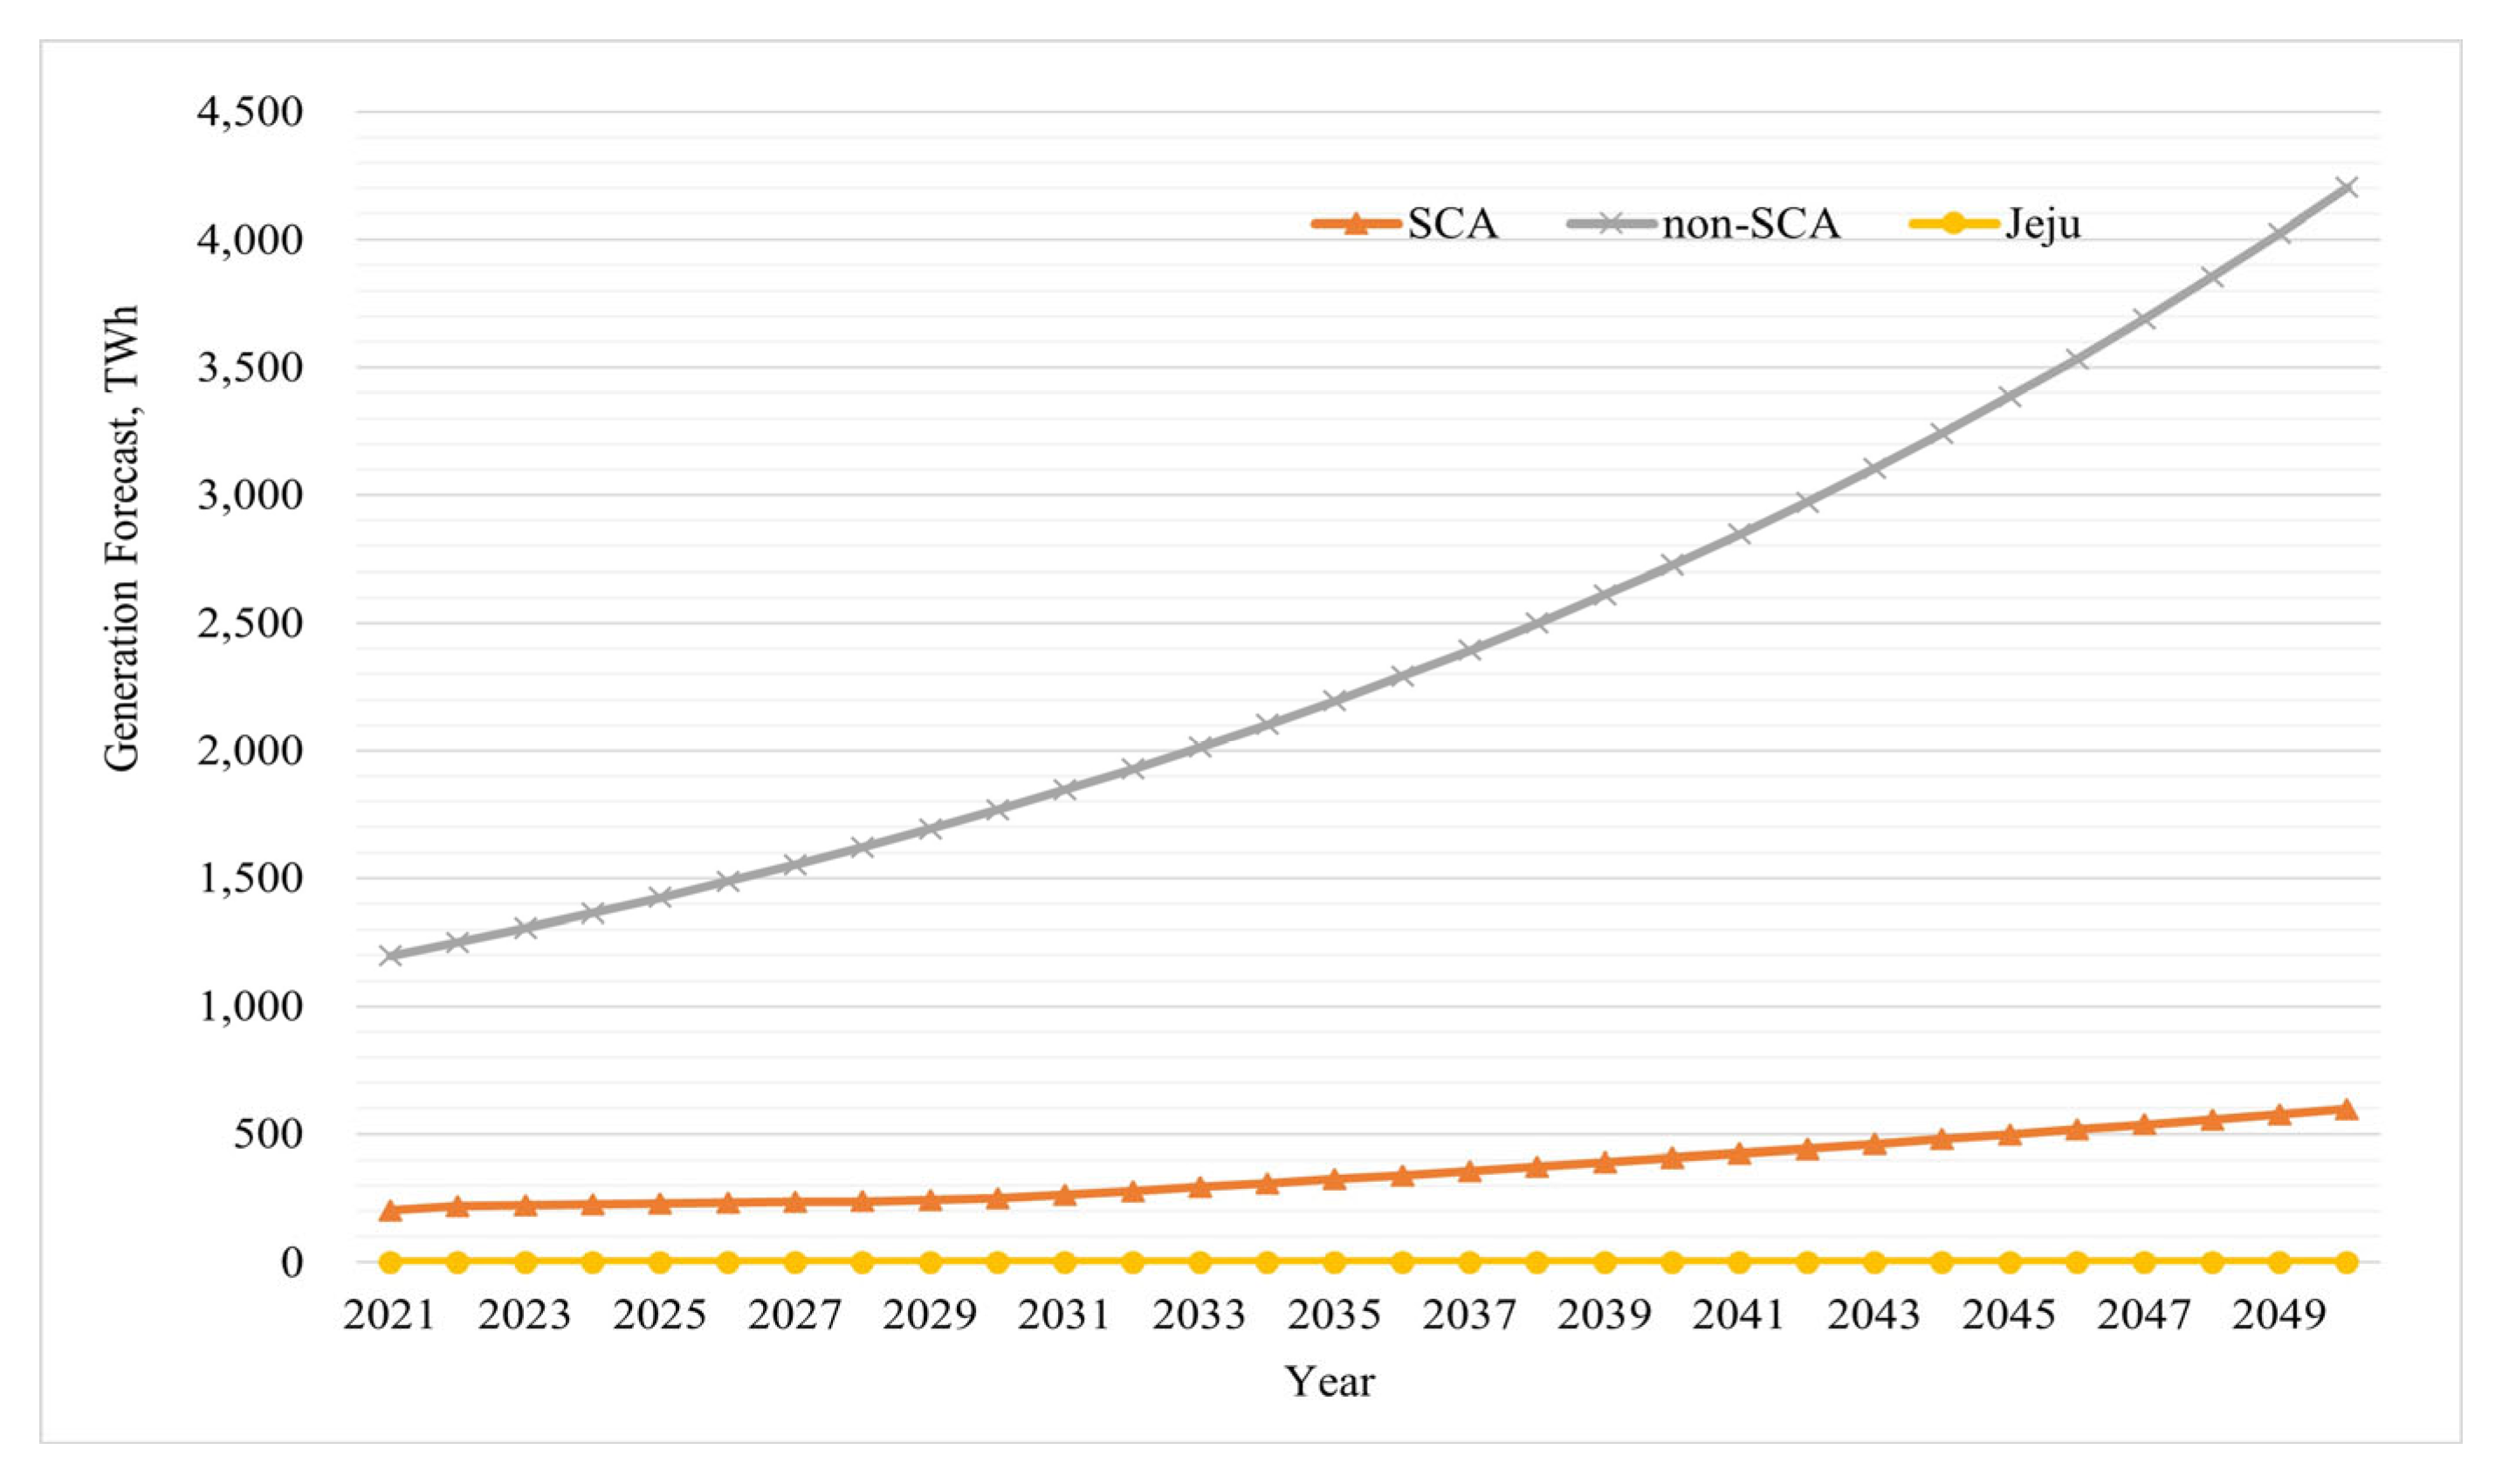
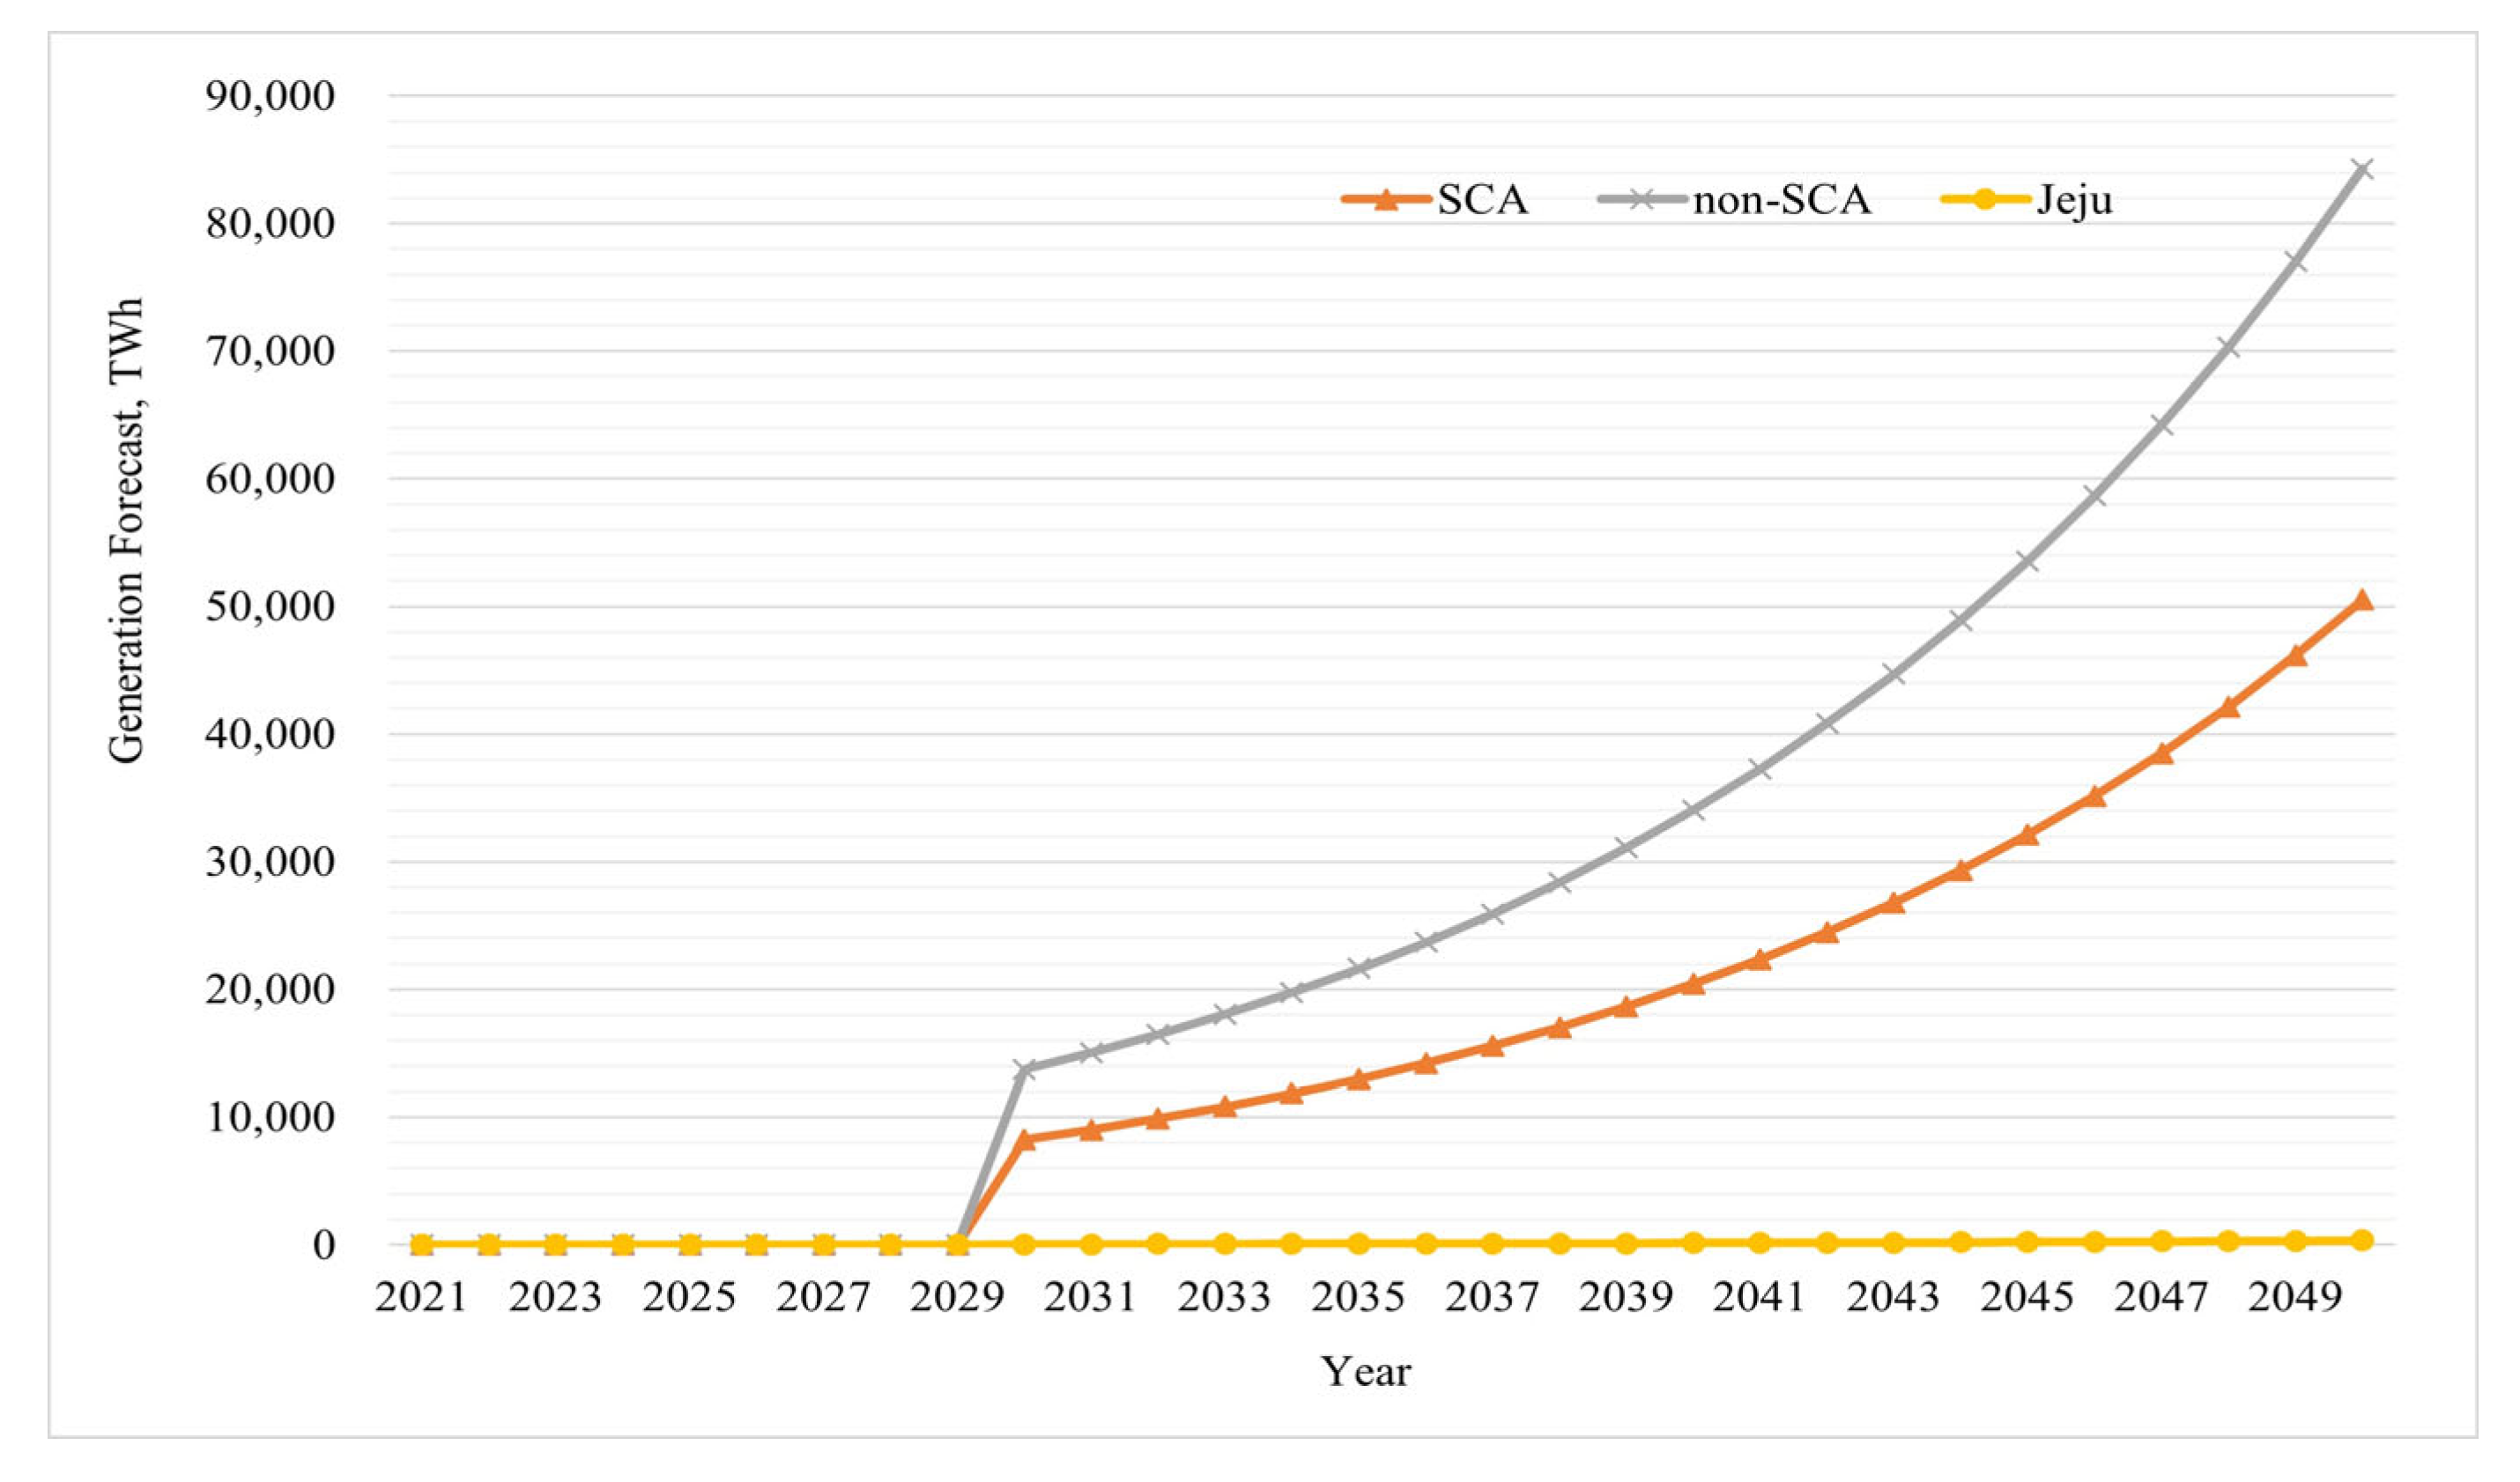
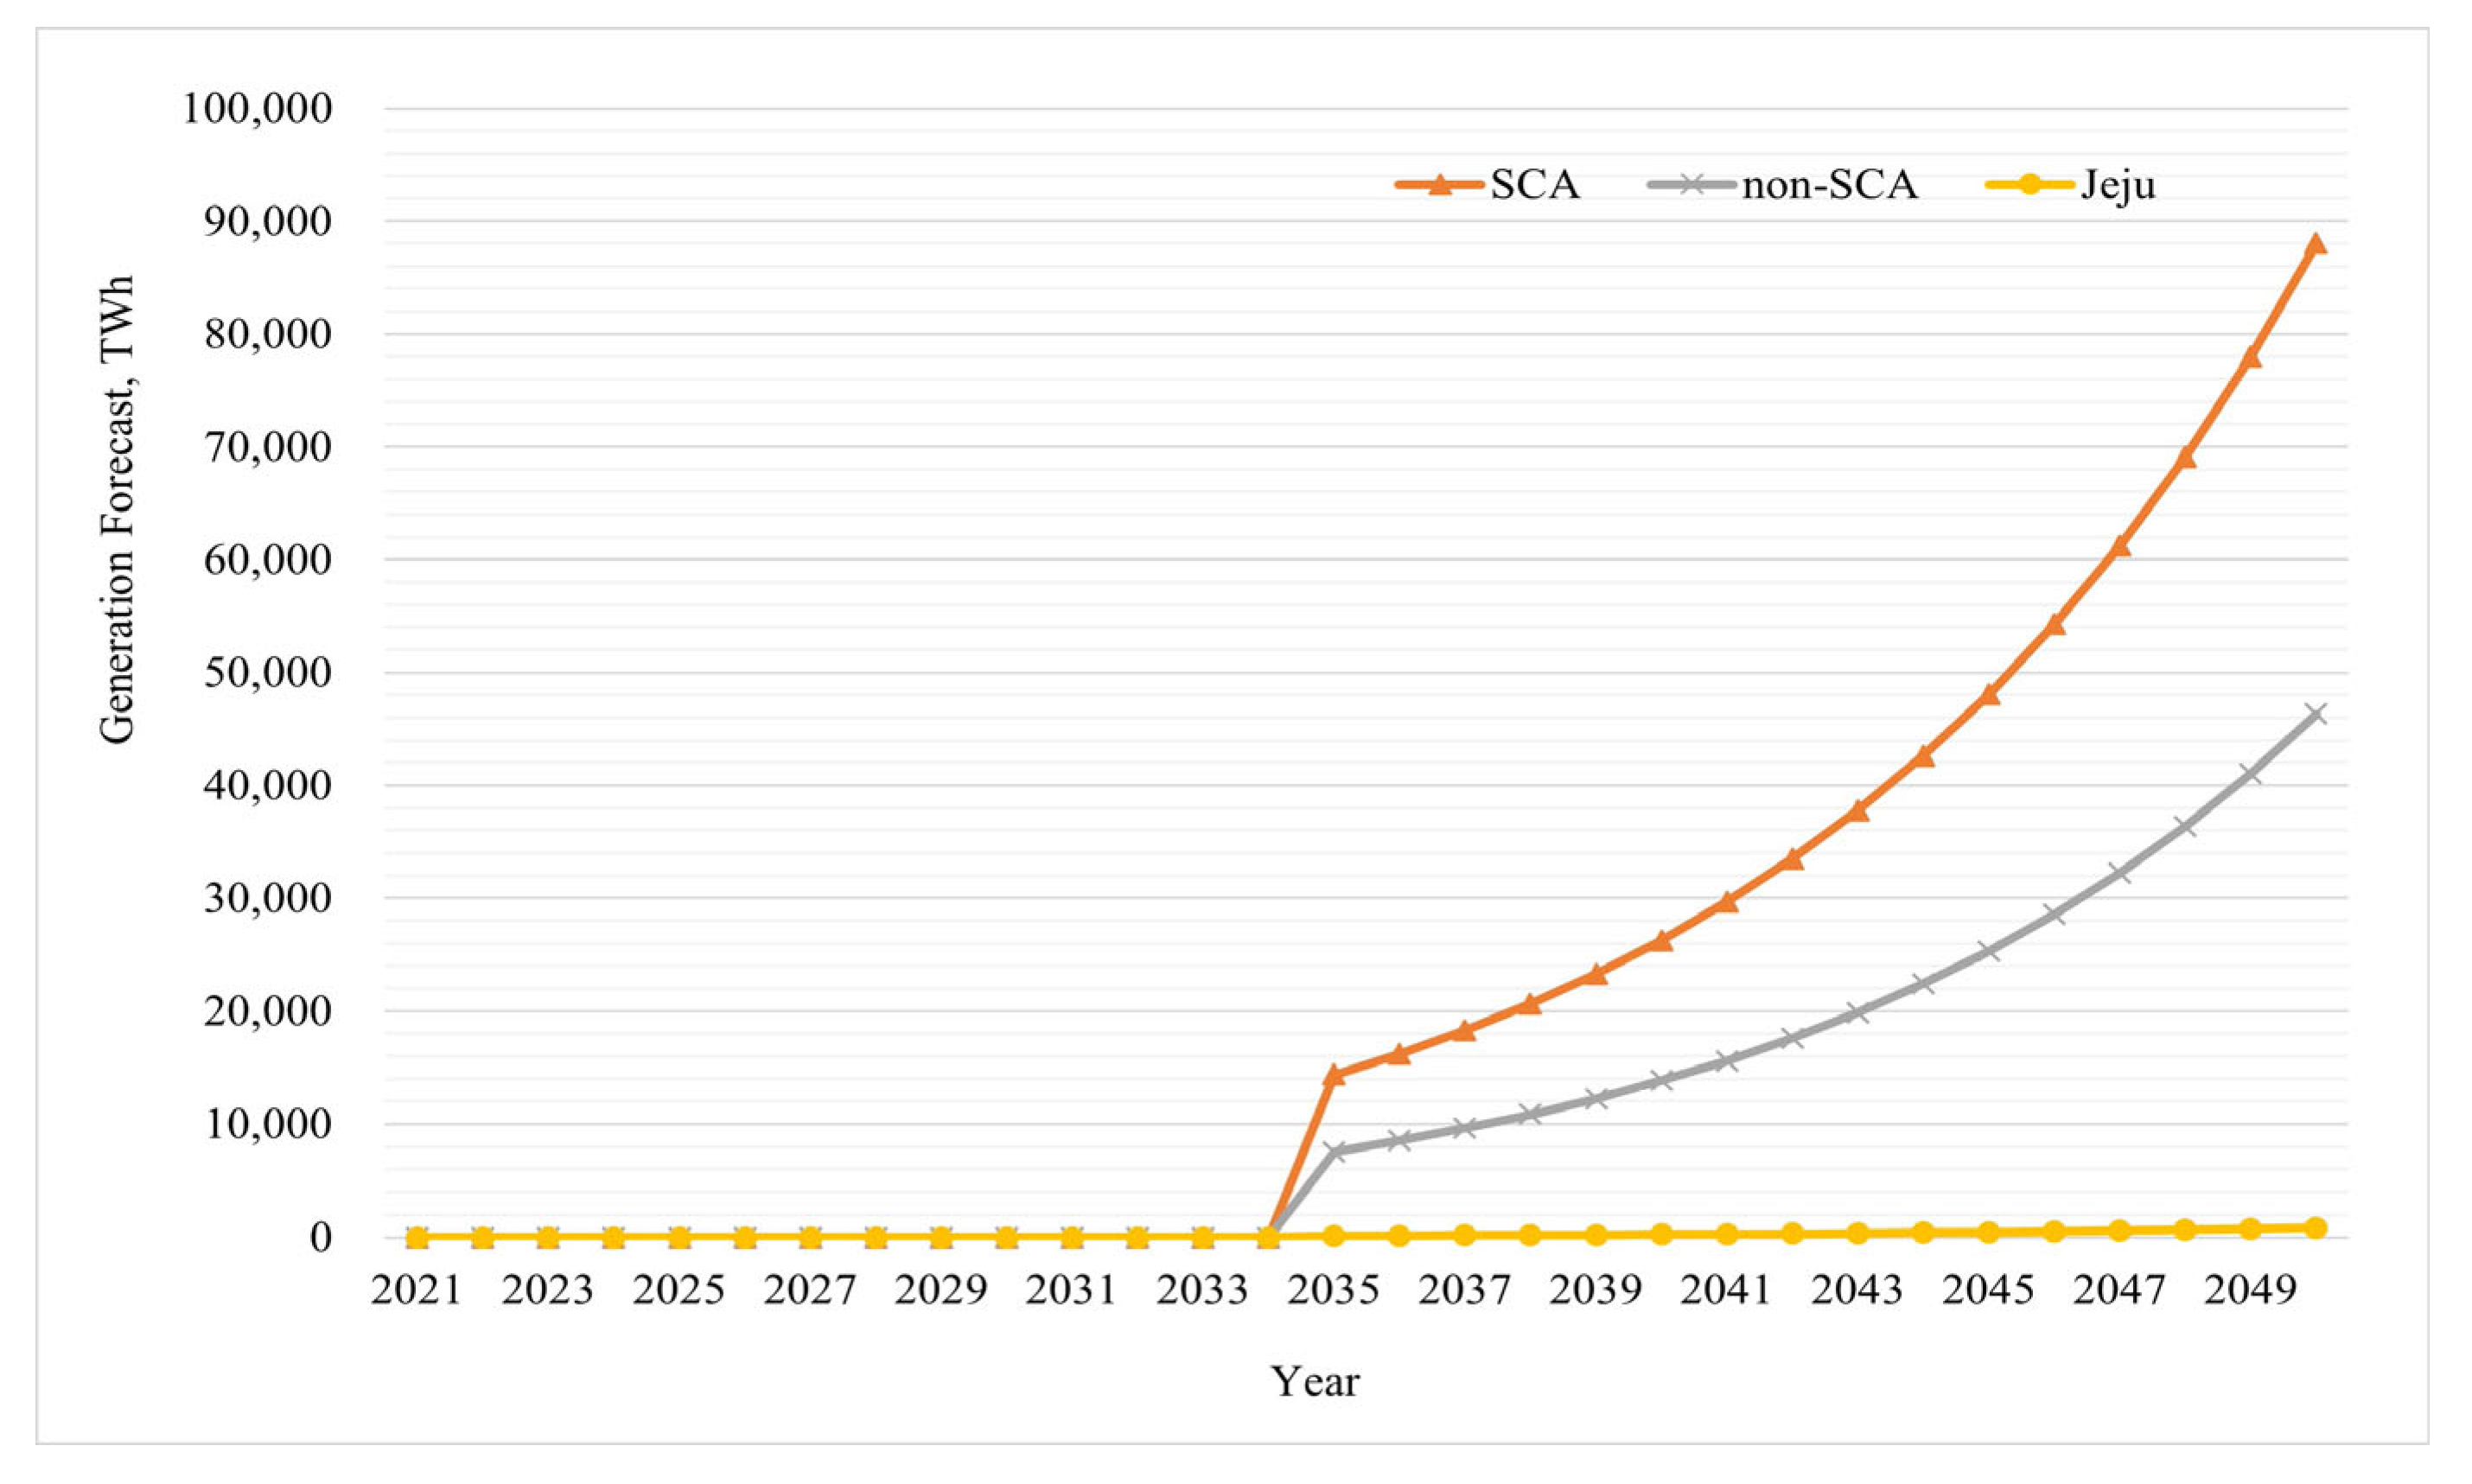
4.3. Generation Forecasts by New and Renewable Energy (NRE) Type and Region
For convenience, we divided South Korea into three regions: SCA, non-SCA, and Jeju. The annual forecast of generation by NRE type and region was calculated by multiplying the percentage of generation by NRE type and region in 2020 by the annual forecast of the generation by each NRE type.
For wind, PV, and bioenergy (mixed combustion), the 2020 generation values by region are provided in the 2020 SEPK. For conventional hydropower and small hydro, we were unable to obtain generation data by region; however, the conventional hydropower and small hydro generation nationwide were 3,205,979 MWh and 671,251 MWh, respectively. Excluding Jeju, the ratio between these two figures was applied to the 2020 hydropower generation by region, to estimate the conventional hydropower and small hydro generation in the SCA and non-SCA regions in 2020. Note that Jeju has no conventional hydropower. To obtain the small hydro generation, we subtract the conventional hydropower generation of the SCA, non-SCA, and Jeju regions from the 2020 hydropower by region (conventional hydropower and small hydro). In the 2020 SEPK, marine energy, fuel cells, and IGCC are combined under the category “other”; therefore, the generation from “other” resources by region in 2020 can be confirmed. In terms of marine energy, the Sihwa Lake Tidal Power Station is currently operating in the SCA region, Uldolmok Tidal Current Power Station is currently operating in the non-SCA region and Jeju Yongsoo Wave Power Plant is currently operating in Jeju. Marine energy is the only “other” source of power generation in Jeju; the 6 MWh of “other” generation in Jeju is entirely from the Jeju Yongsoo Wave Power Plant. As the performance data of the Sihwa Lake Tidal Power Station and Uldolmok Tidal Current Power Station are unavailable, we assumed the same capacity factor for both facilities and allocated the total generation to each capacity level. For fuel cells, we calculated the share of fuel cell generation nationwide among the generation from “other” resources in the 2020 SEPK, multiplied the share by the “other” generation in the SCA, to obtain the fuel cell generation in the SCA region. Finally, we subtracted the SCA fuel cell generation from the nationwide fuel cell generation, to obtain the non-SCA fuel cell generation. Note that Jeju had no fuel cells. As IGCC was applied only in the non-SCA regions, the IGCC generation in both SCA and Jeju regions was considered as 0 MWh. Furthermore, as ammonia and hydrogen turbines have not yet been commercialized, there was no generation data for these types. However, the generation from ammonia and hydrogen turbines can be estimated by calculating the percentages of generation between all the regions for their respective resources subject to fuel conversion in the 2020 SEPK. In South Korea, the resources subject to fuel conversion are coal and LNG. Table 1 summarizes the 2020 generation by the NRE type and region, along with their percentages.
Table 1.
Percentages of generation by new and renewable energy (NRE type) and region in 2020.
Notably, we assumed that in the future, conventional hydropower and marine energy would remain at the same generation levels as those in 2020. Hence, the generation by region (SCA, non-SCA and Jeju regions) for conventional hydropower in 2021–2050 was estimated to be 569,739, 2,636,240, and 0 MWh, respectively, whereas that for marine energy was estimated to be 457,125, 131 and 0 MWh, respectively. For IGCC, the Taean IGCC is the only facility nationwide, located in the non-SCA region. Figure 28 shows the results based on the 2020 generation of 2,377,374 MWh, according to the 9th BPE; as per the forecast, the IGCC generation remains the same until 2034 and then, declines linearly thereafter.
Figure 28.
Integrated gasification combined cycle (IGCC) generation forecast by region for 2021–2050.
The yearly generation forecasts of small hydro, PV, wind, bioenergy (mixed combustion), fuel cells, ammonia turbines, and hydrogen turbines by region and type can be estimated by multiplying the 2020 generation percentages by region and type by the respective generation forecasts. The results are shown in Figure 29, Figure 30, Figure 31, Figure 32, Figure 33, Figure 34 and Figure 35.
Figure 29.
Forecast of small hydro generation by region for 2021–2050.
Figure 30.
Forecast of PV generation by region for 2021–2050.
Figure 31.
Forecast of wind generation by region for 2021–2050.
Figure 32.
Forecast of bioenergy mixed-combustion generation by region for 2021–2050.
Figure 33.
Forecast of fuel cell generation by region for 2021–2050.
Figure 34.
Forecast of ammonia turbine generation by region for 2021–2050.
Figure 35.
Forecast of hydrogen turbine generation by region for 2021–2050.
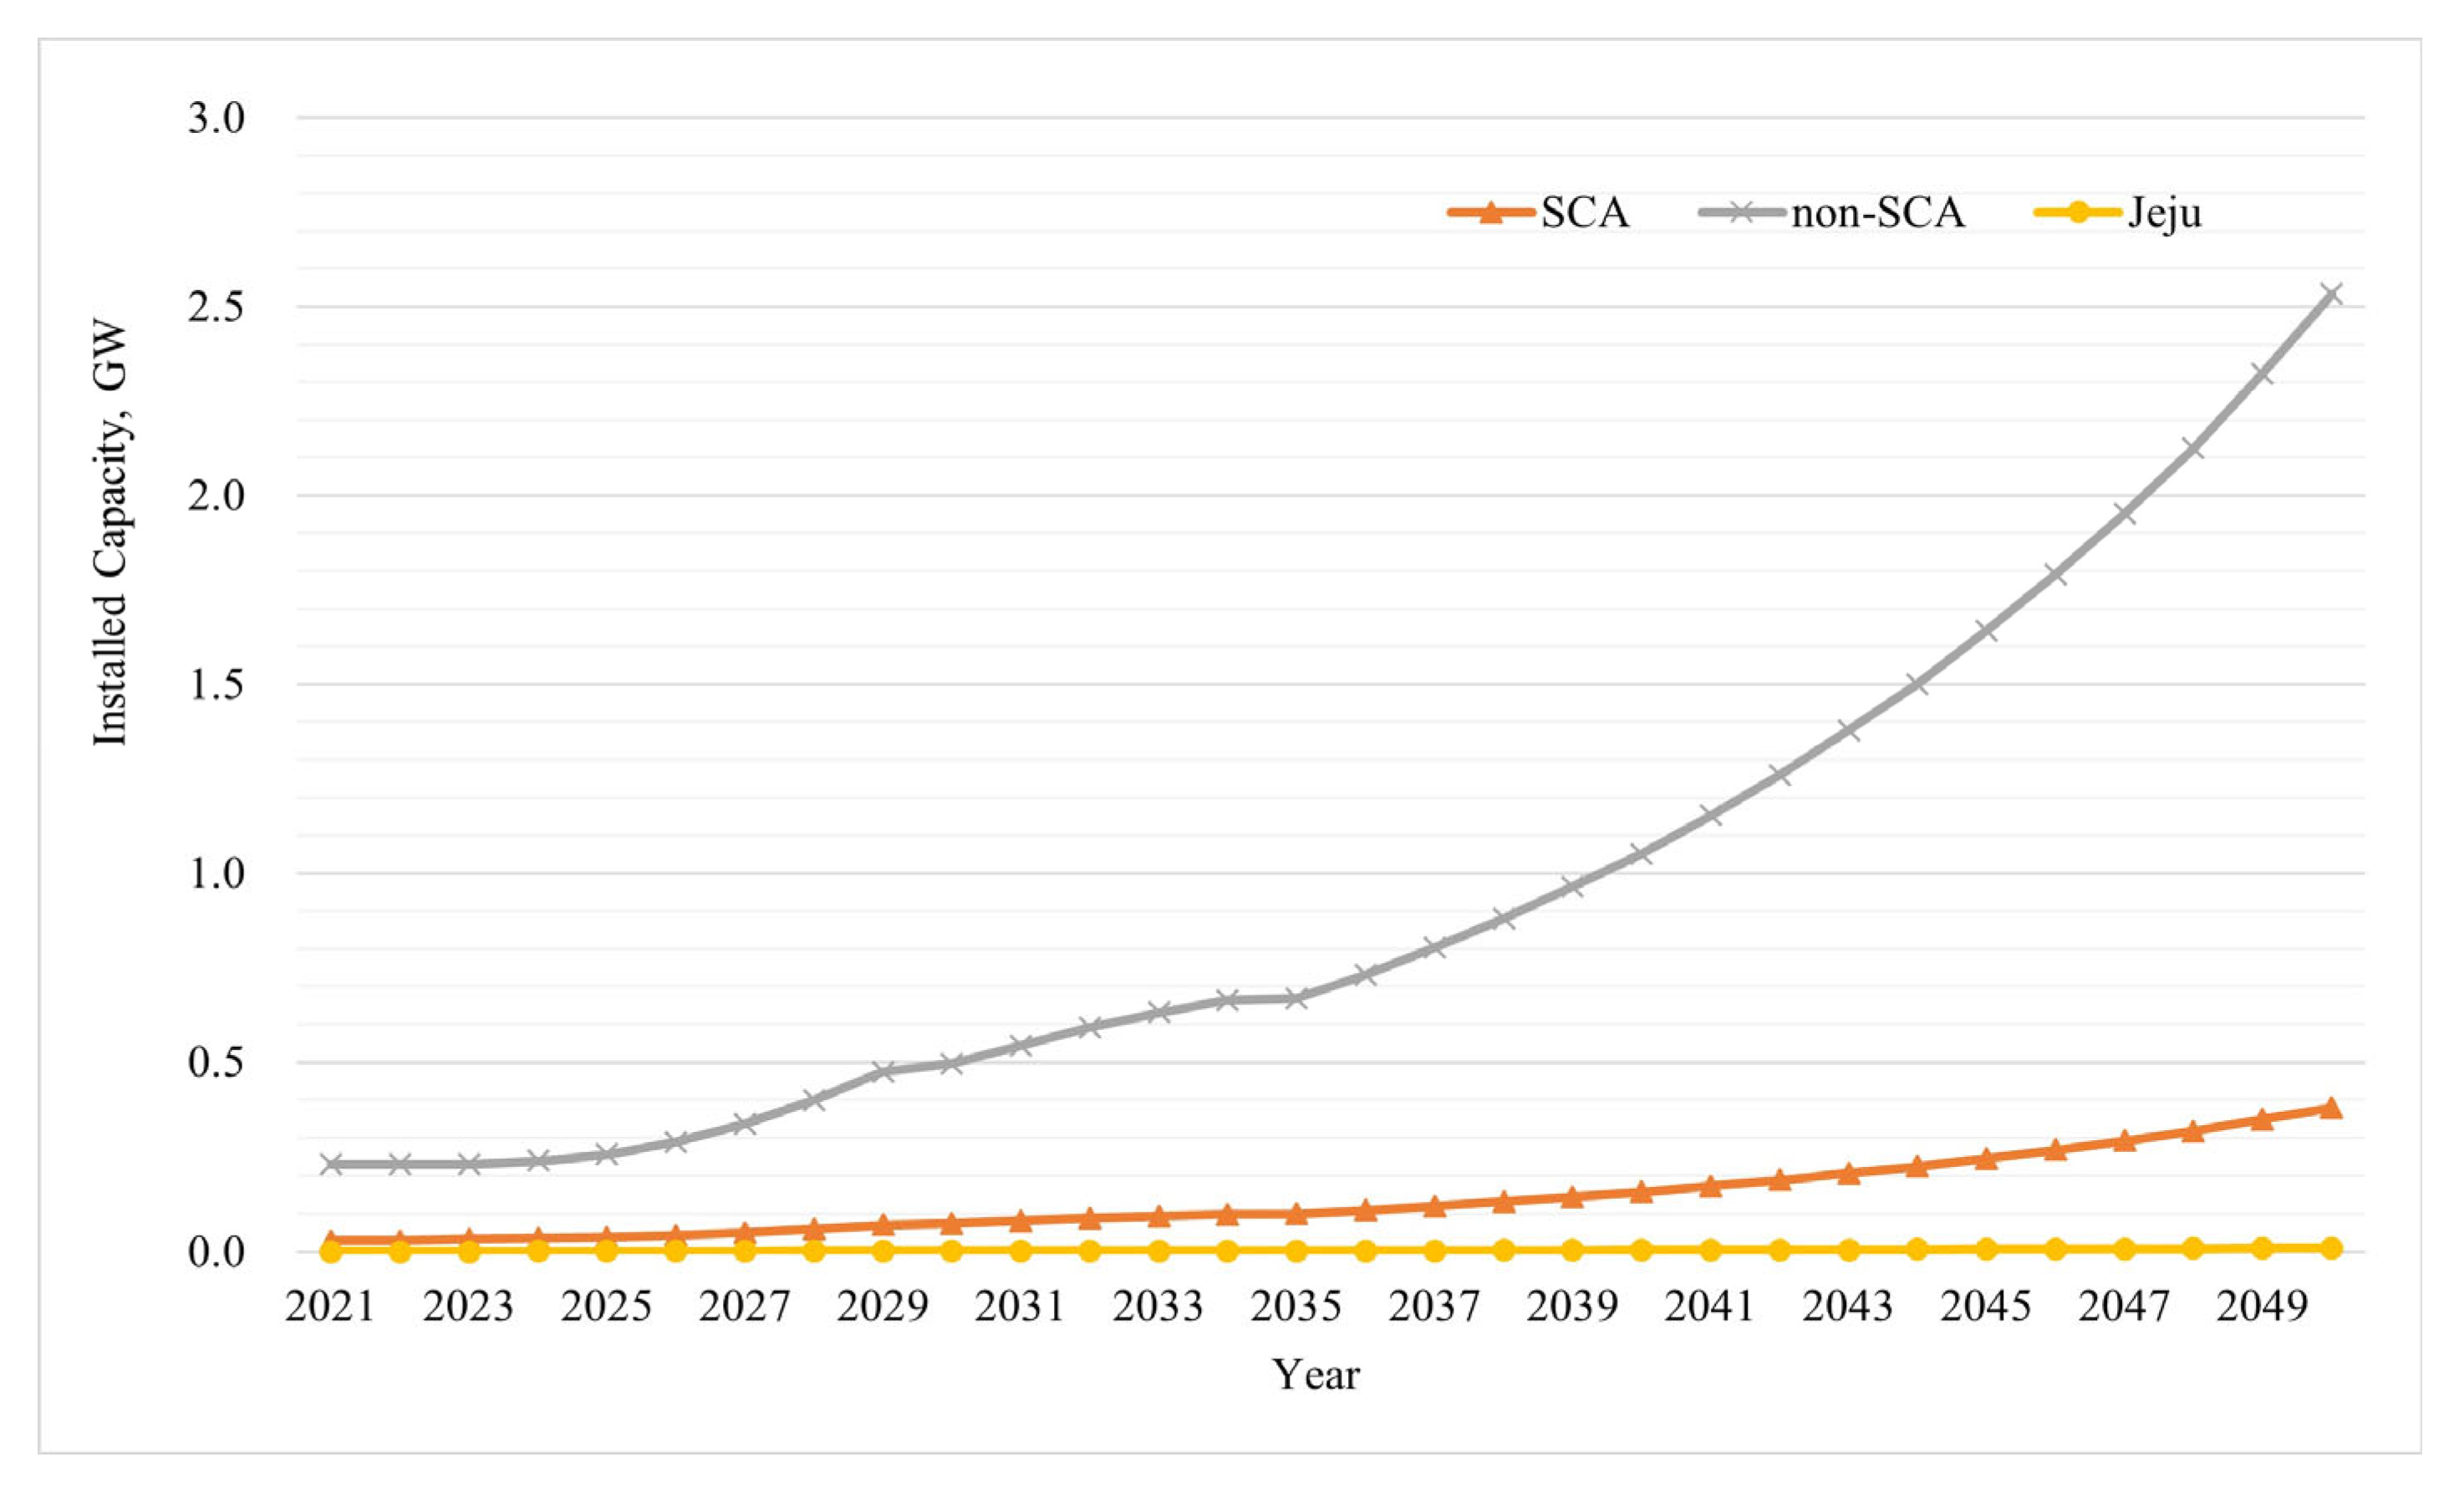
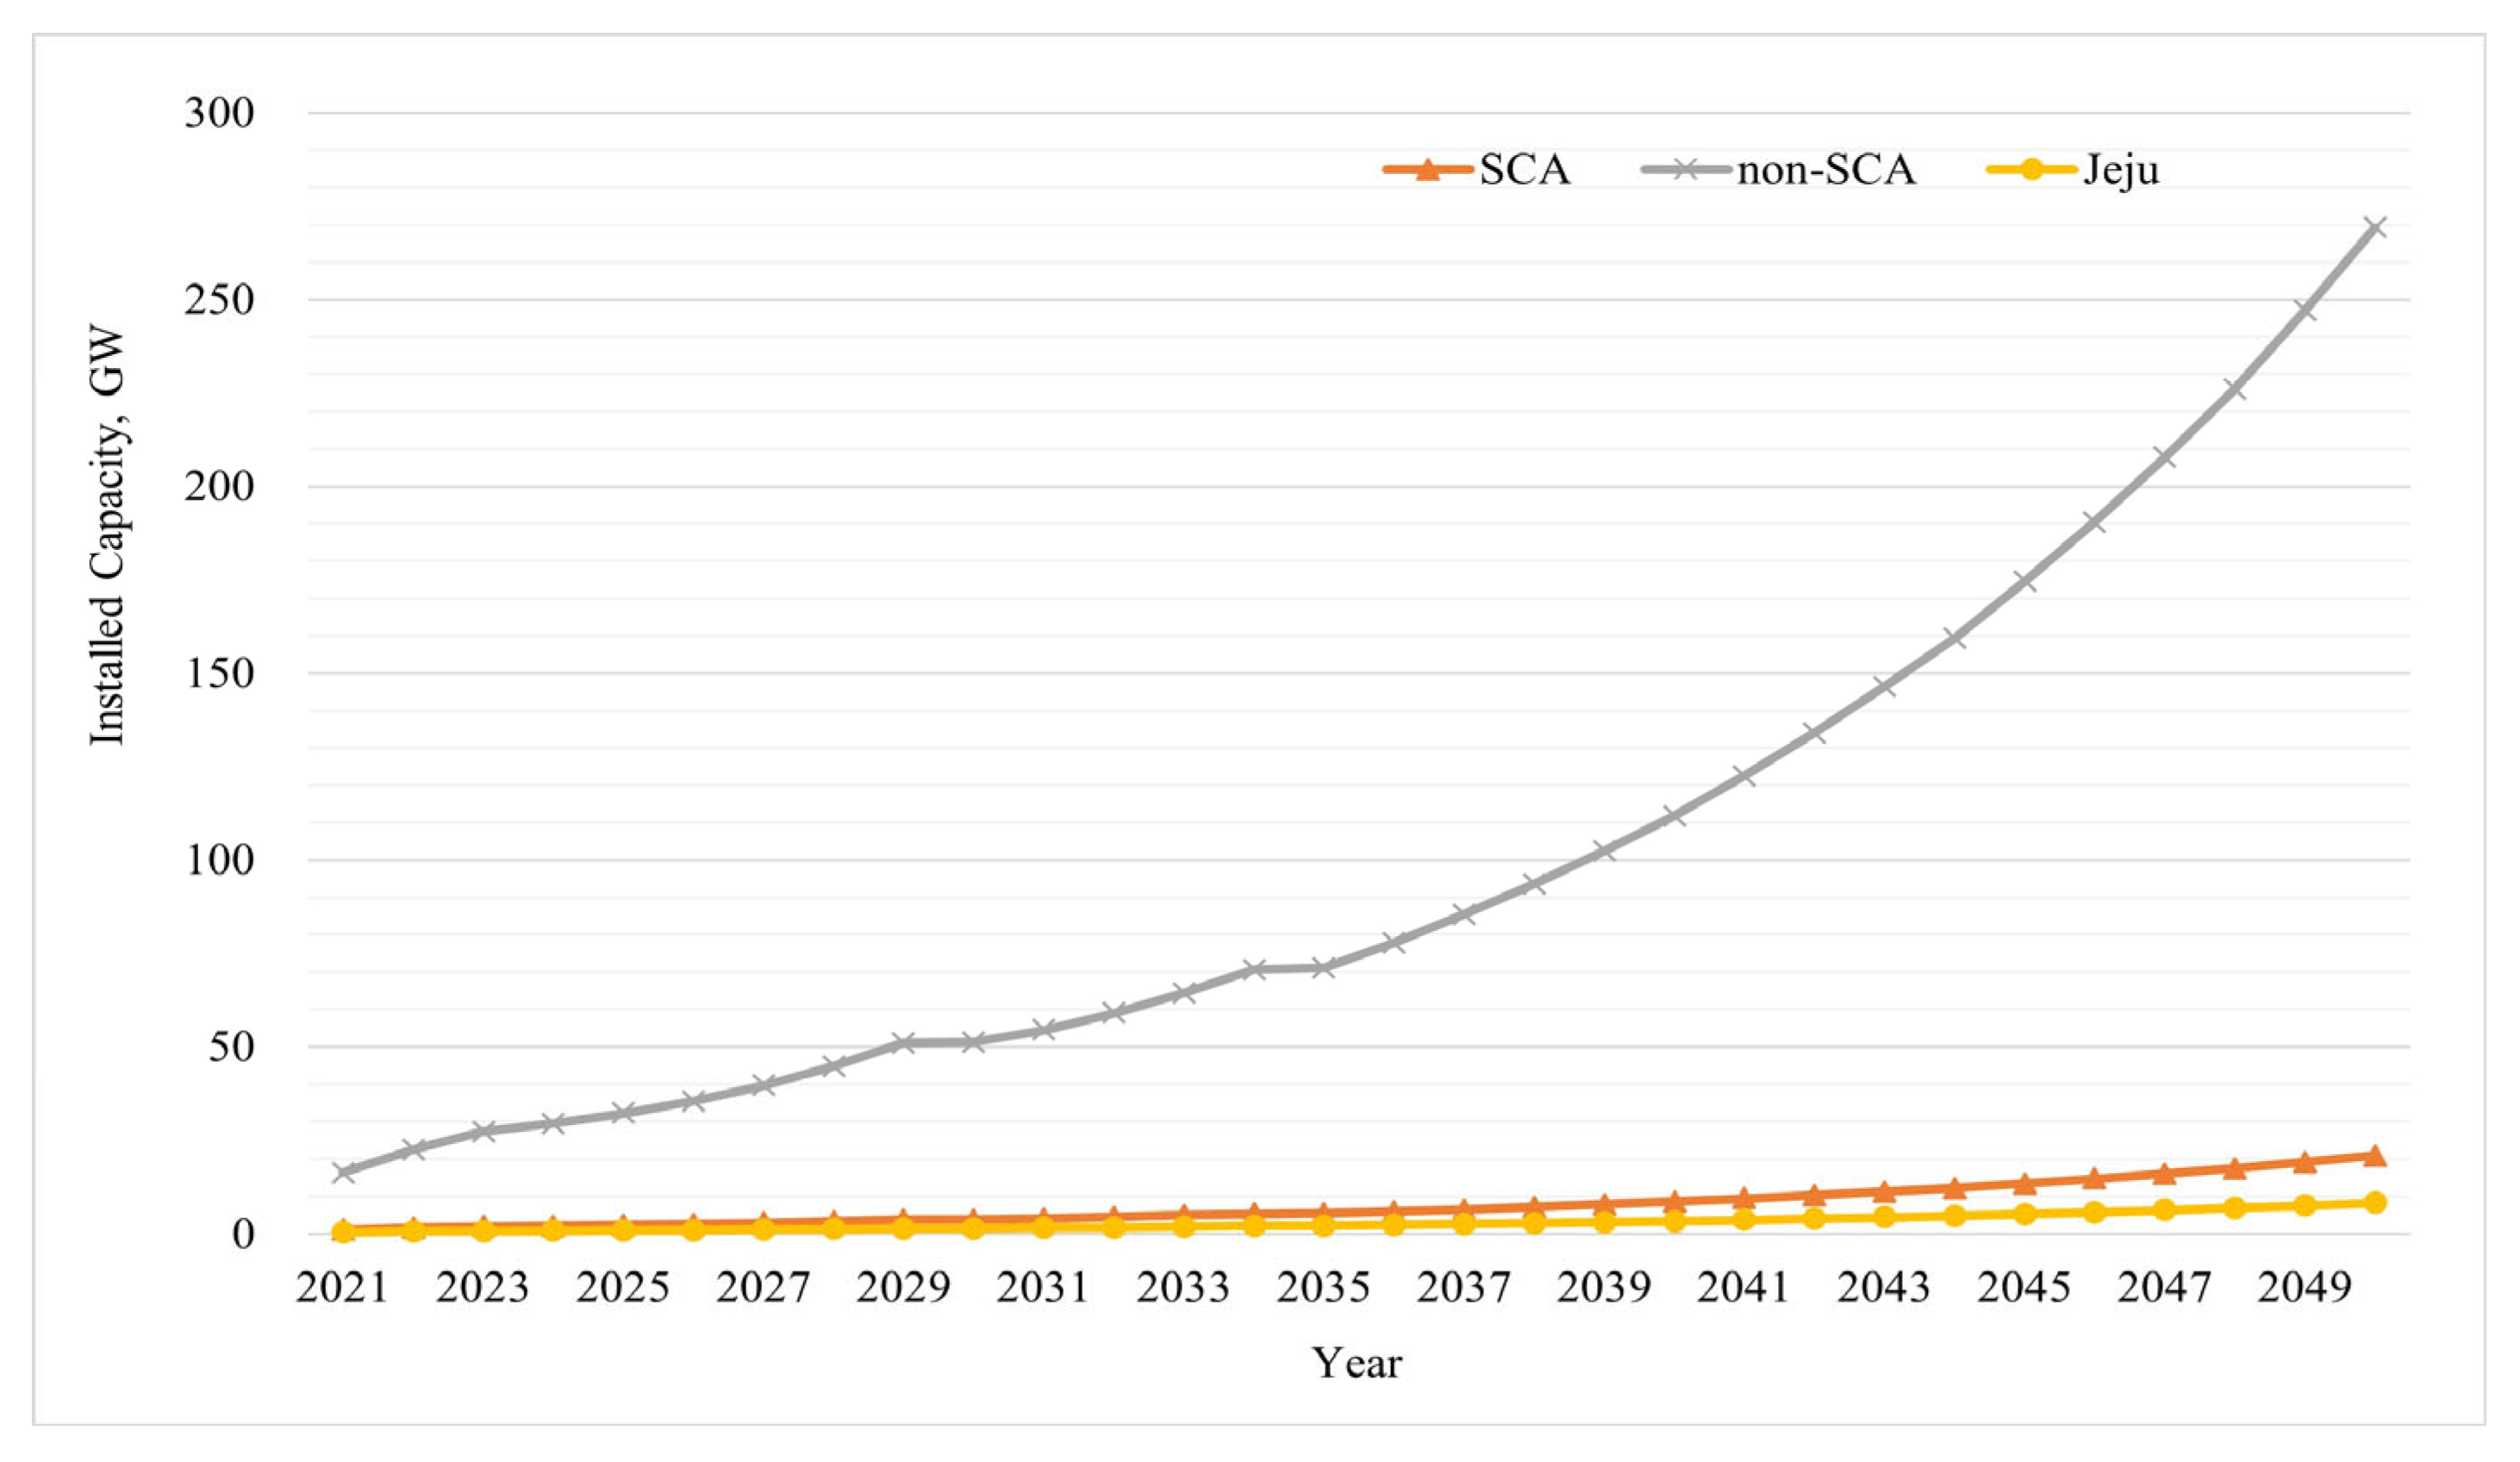
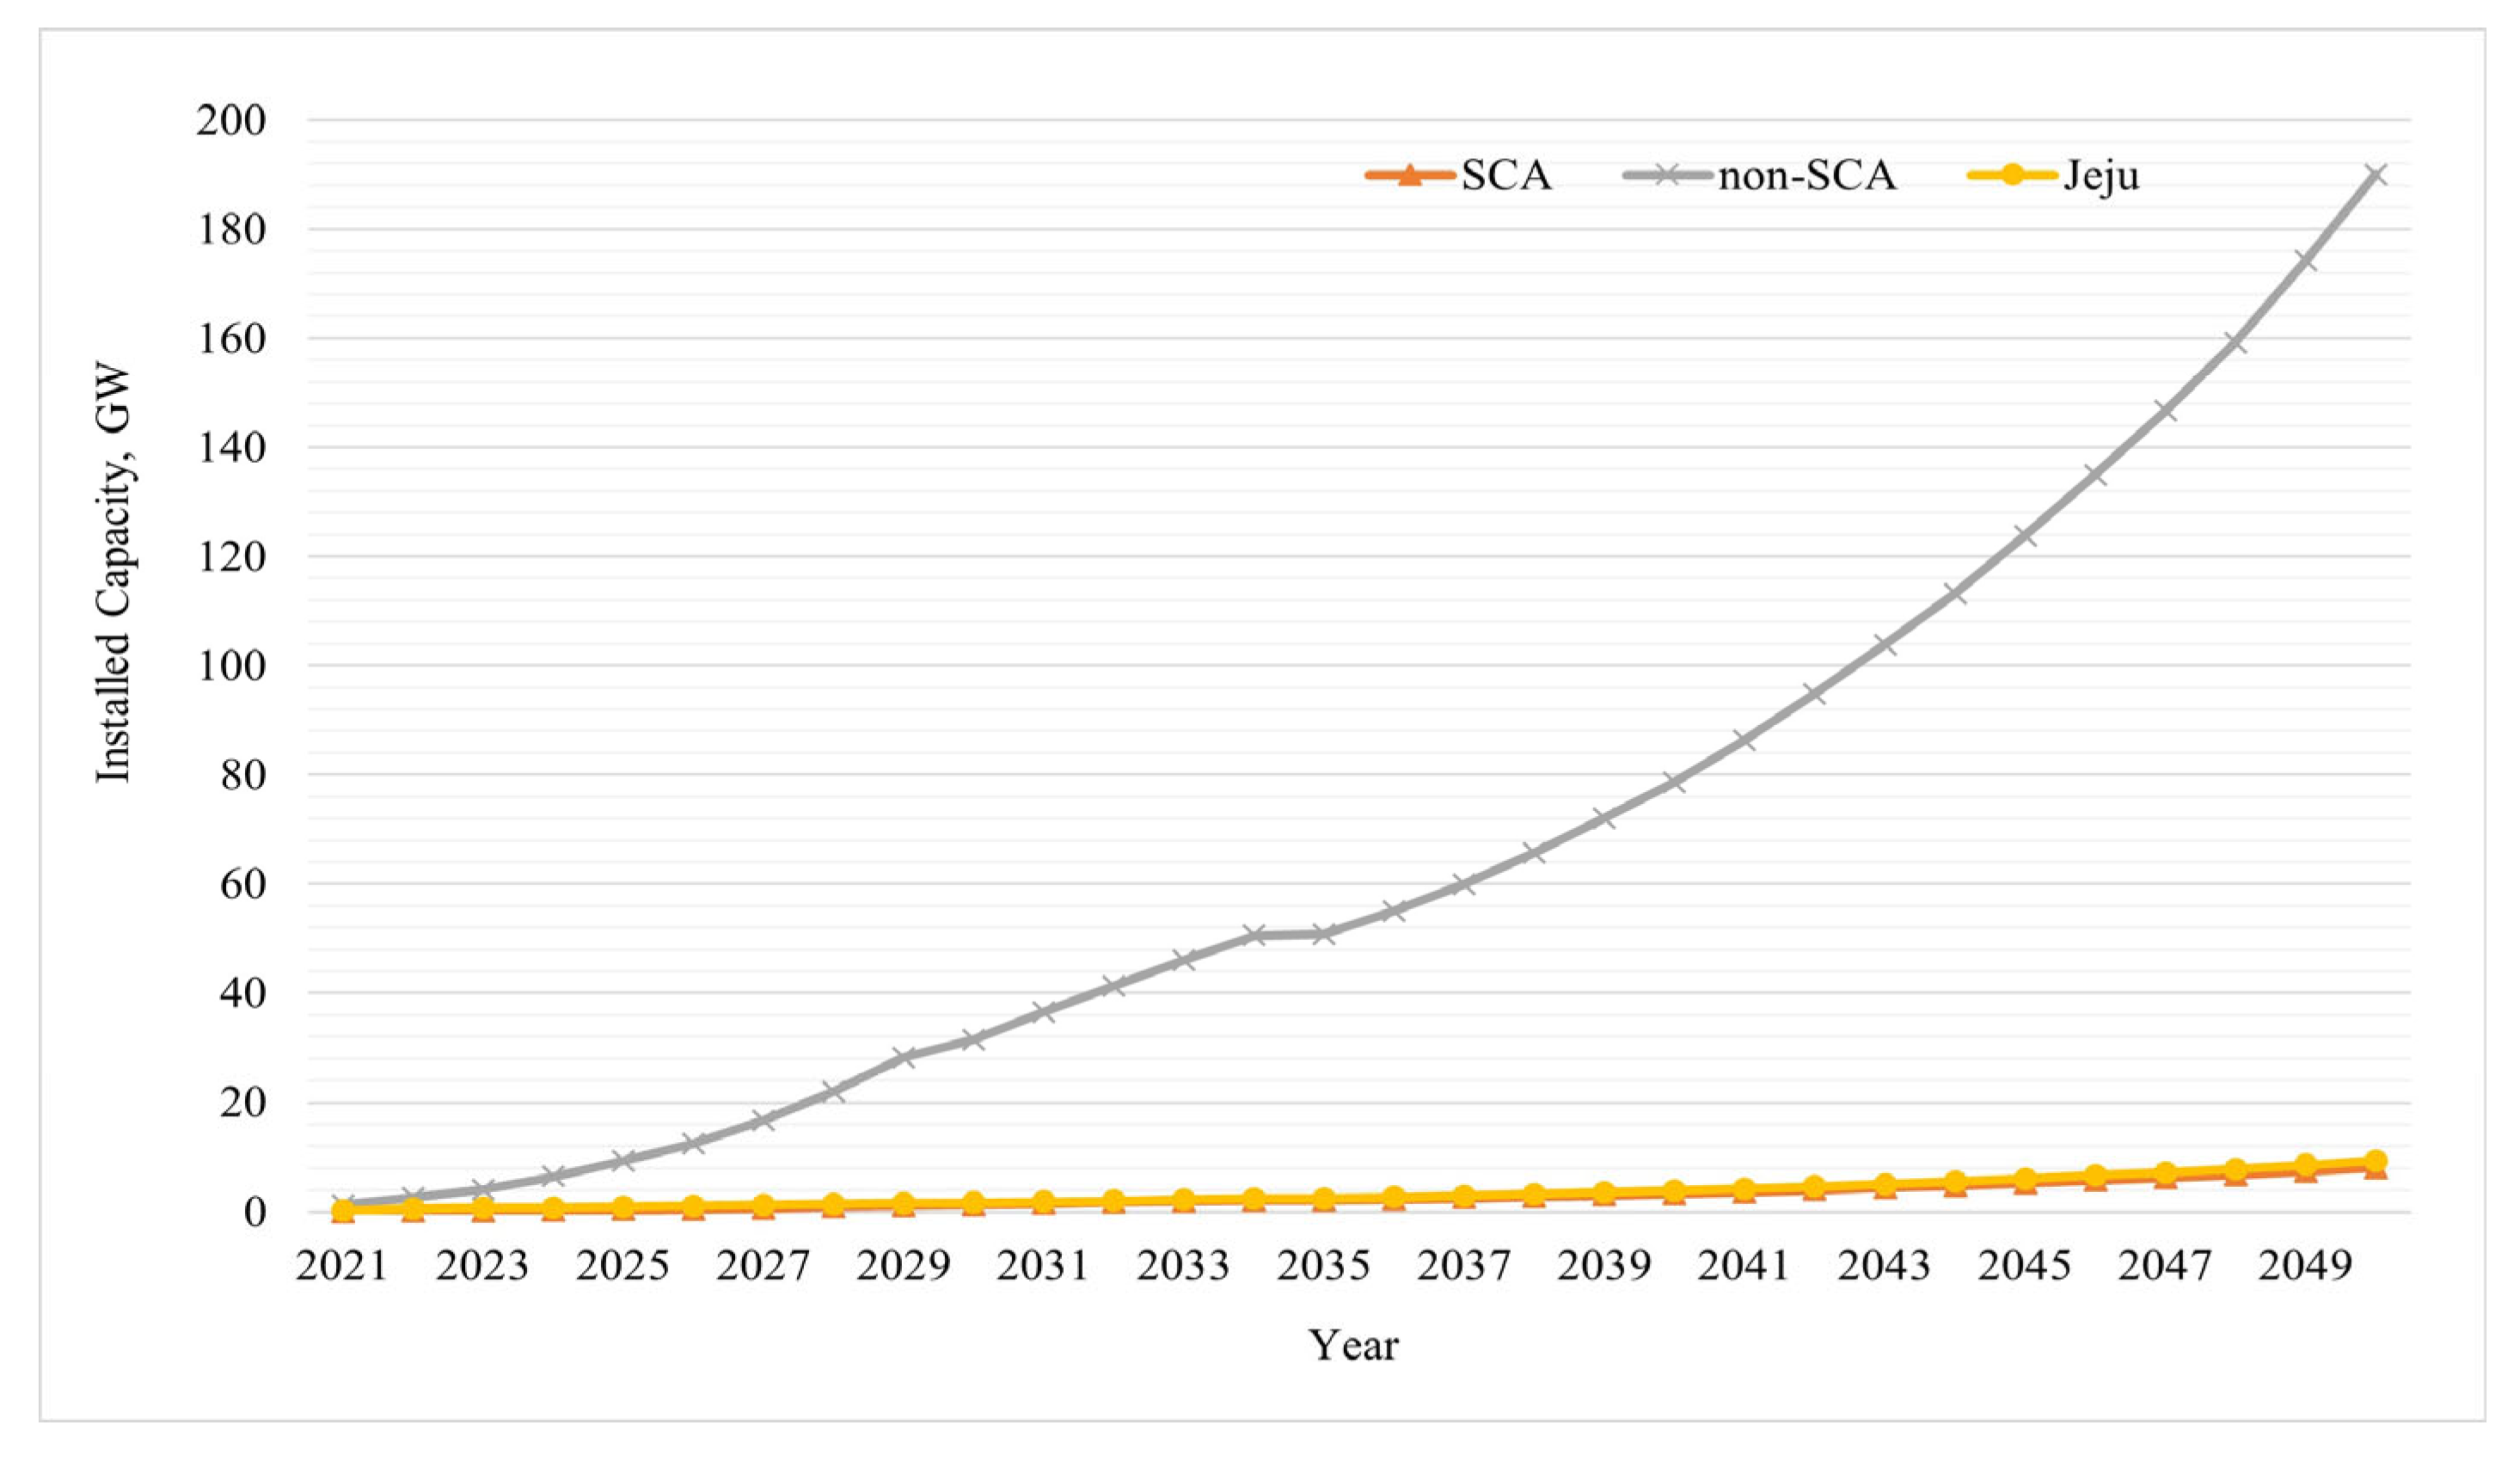
4.4. Capacity Forecasts by New and Renewable Energy (NRE) Type and Region
The installed capacity by NRE type and region was calculated using Equation (2), as follows:
where ICi,r, TGi,r, and CFi,r represent the installed capacity, total generation, and capacity factor of the NRE type i in region r, respectively. Excluding the NREs whose forecasts were determined by other factors beforehand, the installed capacities of small hydro, fuel cells, PV, and wind were estimated using the WMA-based forecasting technique. Figure 36 shows the process in detail. We used the “growth rate” of the capacity factor to forecast the region-specific capacity factors, based on the given nationwide capacity factor forecast, as there were no region-specific capacity factor forecasts.
Figure 36.
Procedure used in this study for calculating the capacities of NREs by region, based on weighted moving average (WMA).
Figure 37, Figure 38, Figure 39 and Figure 40 show the results of applying the WMA-based region-specific installed-capacity-estimation process for small hydro, PV, wind, and fuel cells.
Figure 37.
Forecast of small hydro installed capacity by region for 2021–2050.
Figure 38.
Forecast of PV installed capacity by region for 2021–2050.
Figure 39.
Forecast of wind installed capacity by region for 2021–2050.
Figure 40.
Forecast of fuel cell installed capacity by region for 2021–2050.
According to the Korean Statistics Information Service (KOSIS) [22], the 2020 capacity of conventional hydropower generation in the SCA, non-SCA, and Jeju regions was 260, 1322 and 0 MW, respectively. As there are no known plans to construct additional conventional hydropower facilities, in this study, we applied the same figures for each region until 2050. For the same reason, the capacities of marine energy in the SCA and non-SCA regions and Jeju were maintained at 254, 1 and 0.5 MW, respectively. Additionally, there are also no plans to construct additional IGCC facilities; therefore, we assumed that the capacity of the Taean IGCC in the non-SCA region would remain the same, at 346 MW, until 2049, and then, reduce to 0 MW in 2050, when it will be decommissioned. For bioenergy, ammonia, and hydrogen turbines, the capacities of the resources subject to fuel conversion were included as the installed capacities of the resources at the respective time of fuel conversion. Note that the time of fuel conversion for each resource subject to fuel conversion was determined according to the long-term operational generation plan.
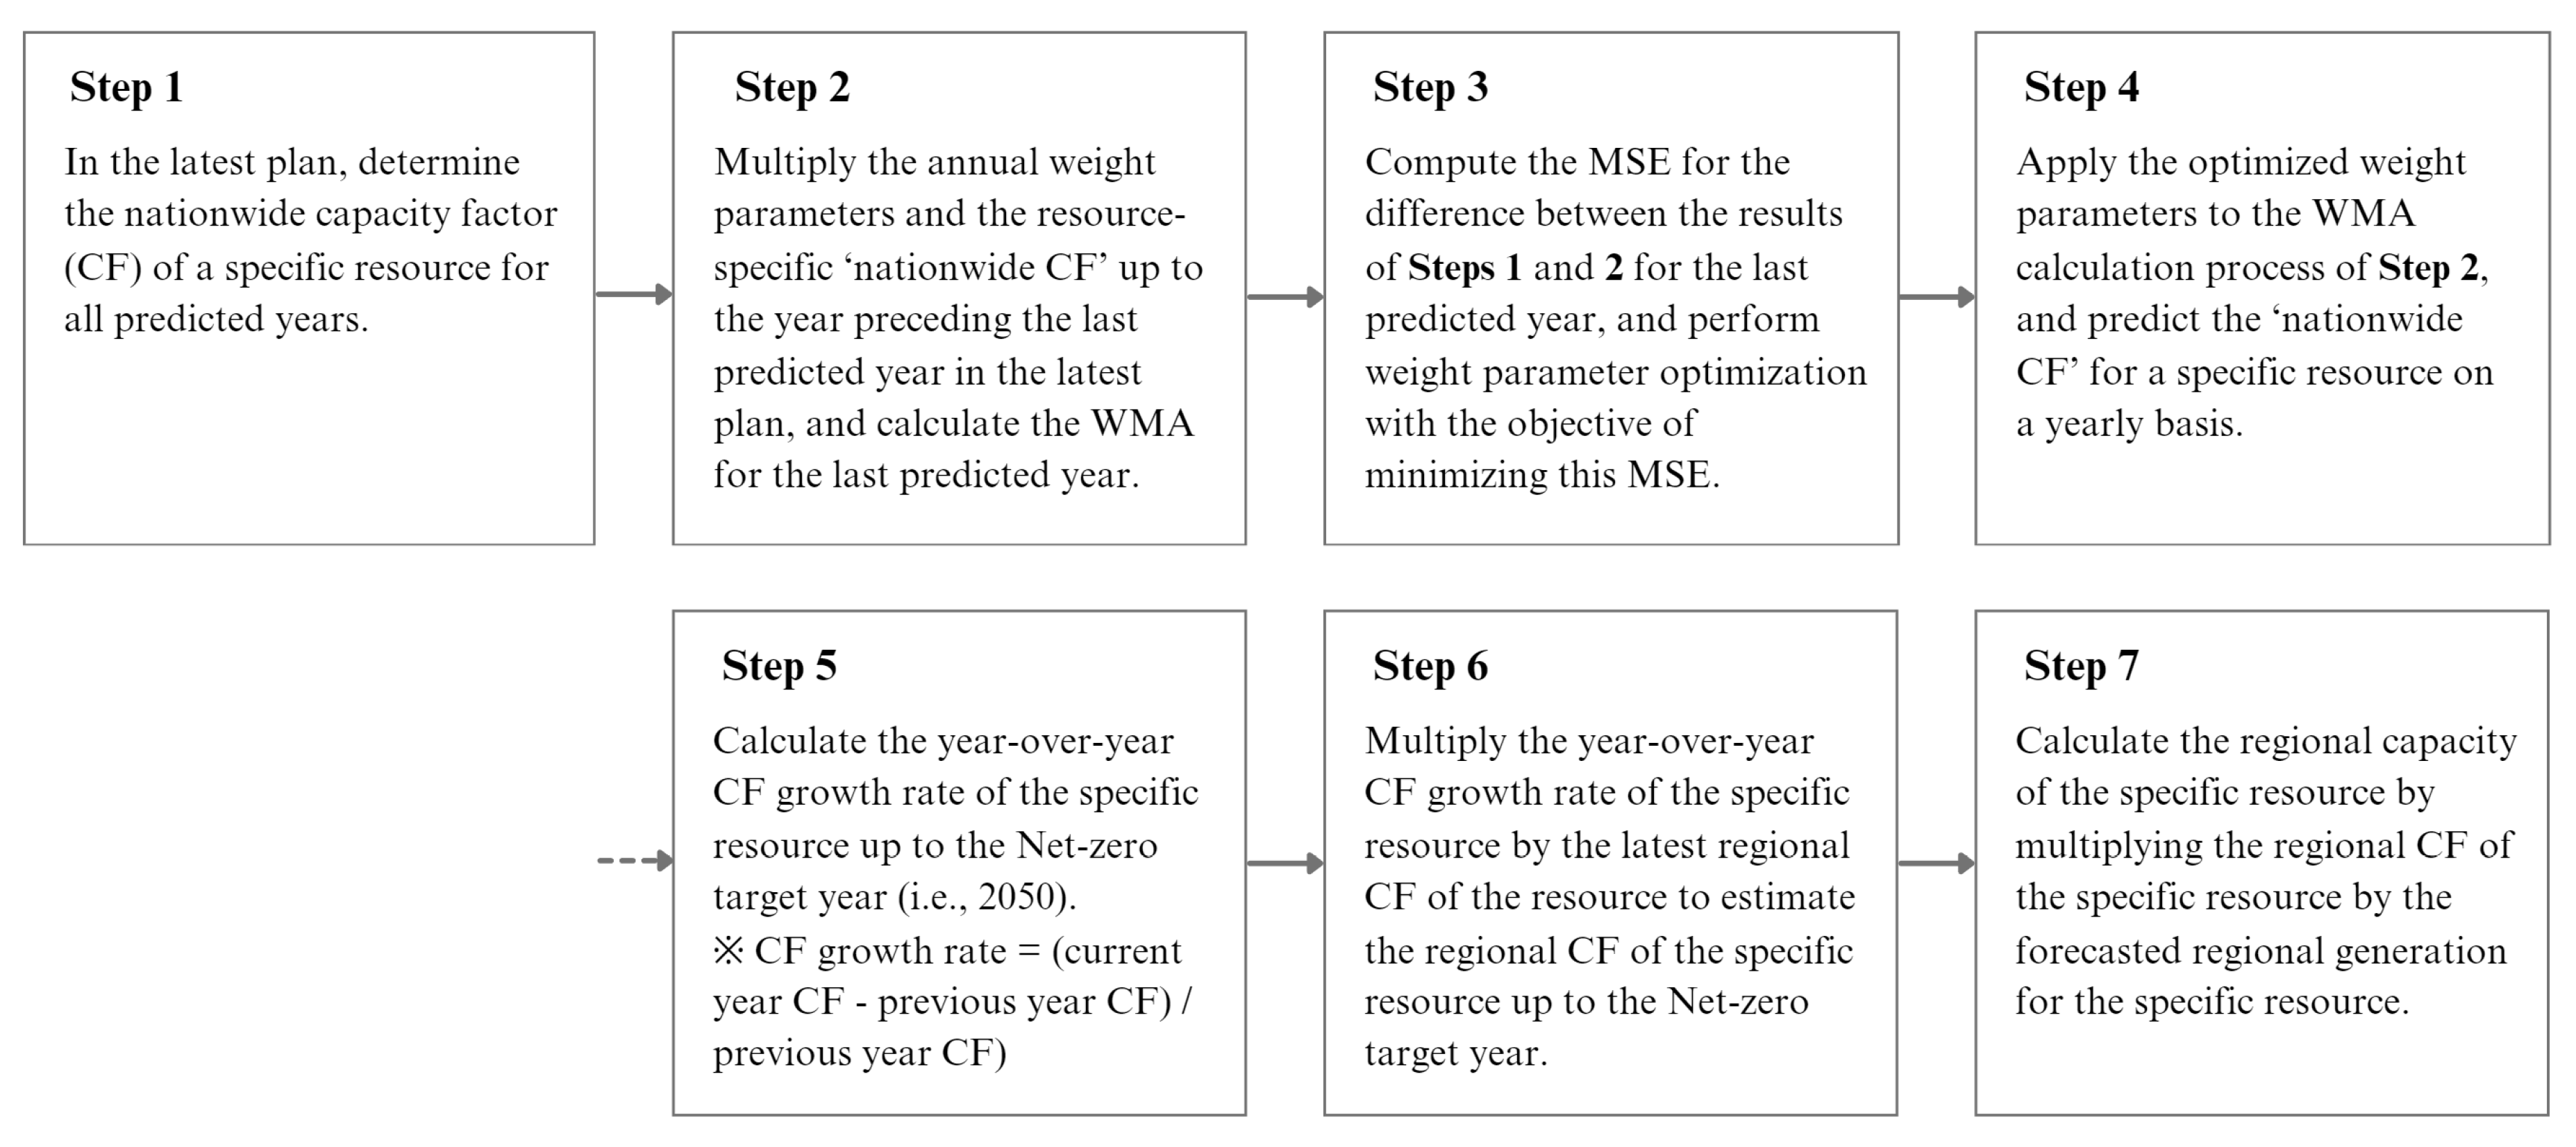
5. Step 3: Generation Forecasts of Resources Subject to Fuel Conversion and Nuclear Power
For the resources subject to fuel conversion and nuclear power, the commissioning and decommissioning periods for each generator were determined, according to the generation facility construction plans in the most recent BPE. We applied the timelines specified in the most recent BPE, though they may change depending on future government policies. We assume that there was only NRE construction after the last forecasted year of the latest BPE. If the resource was not confirmed for decommissioning, we assumed that it could be repowered at the end of its design life (to continue use). Of course, any remaining resources subject to fuel conversion that were not converted were assumed to be decommissioned.
We established an optimal operational generation plan, using M-CORE (Korean electricity market simulator), to estimate the generation of resources subject to fuel conversion and nuclear power [23]. This method was applied to derive the most feasible generation values. We input the generator data (maximum/minimum capacity, maximum/minimum downtime, generation cost function, etc.) for each source into the program. For the new generation facilities according to each resource, we used the most recent generator data (as of December 2020). For example, data from the nuclear power generator Shin Hanul Unit 6 was applied for Shin Hanul Unit 1.
The following concerns were considered when conducting the simulation. First, we install additional batteries, in case of oversupply, resulting from the expansion of renewable energy. Second, the battery operation strategy followed the “economic pumping” approach. This involved pumping when the marginal price was low and generating electricity when the marginal price was high. Operating the batteries through this method could add charging load, which could change the electricity consumption and demand pattern. Third, we only performed simulations for 2030 and 2050. This was because a long period, i.e., 29 years, requires a considerable computation time as well, which was not feasible for this study. These considerations help to clarify the focus of this study.
Figure 41 and Figure 42 show the optimal operational generation plan for 2030 and 2050, respectively, based on these assumptions. The results shown in the figures are derived by applying the following constraints: minimum operational/downtime, maximum/minimum output, and Jeju high-voltage direct current (HVDC) constraints. The results indicate that the generation and capacity of renewable energy will increase overwhelmingly by 2050, compared to that in 2030. In most cases, oversupply occurs due to the volatility of PV output. To solve this problem, a large quantity of energy storage systems is essential.
Figure 41.
Results of operational generation schedule for 2030; combined cycle (CC), steam turbine cycle (STC), pumped hydro energy storage (PHES).
Figure 42.
Results of operational generation schedule for 2050; combined cycle (CC), energy storage system (ESS), steam turbine cycle (STC).
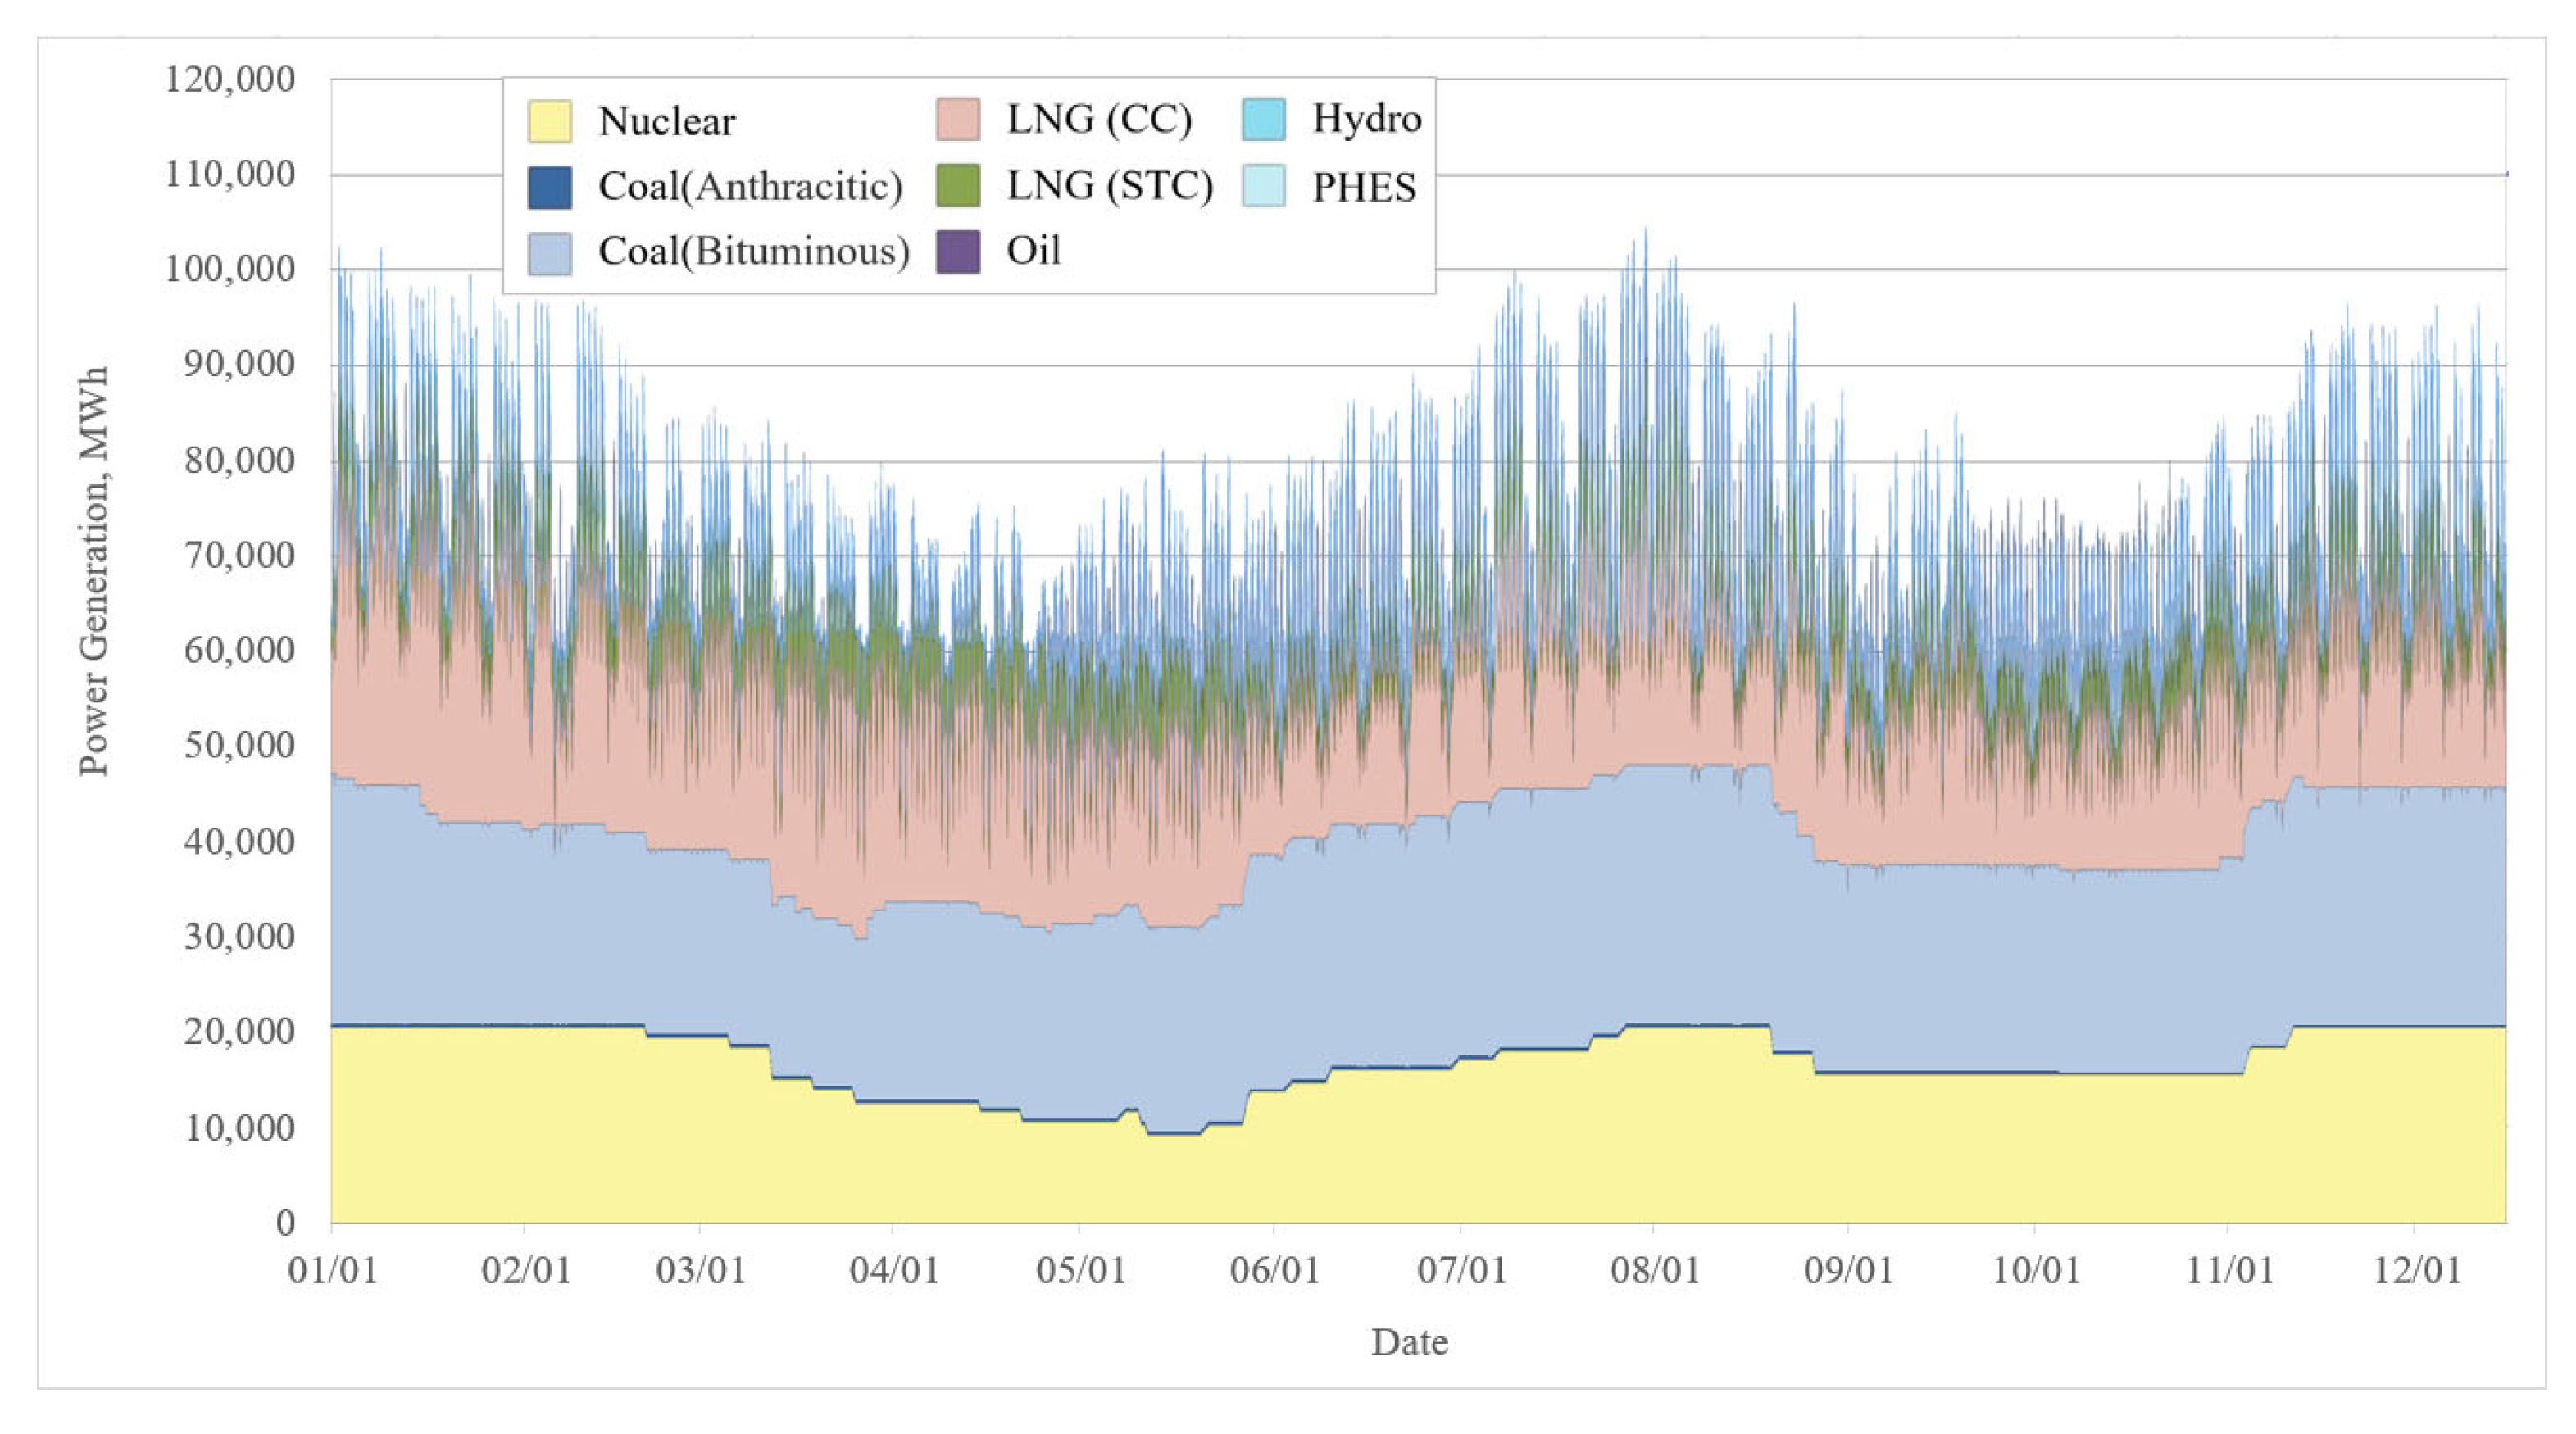
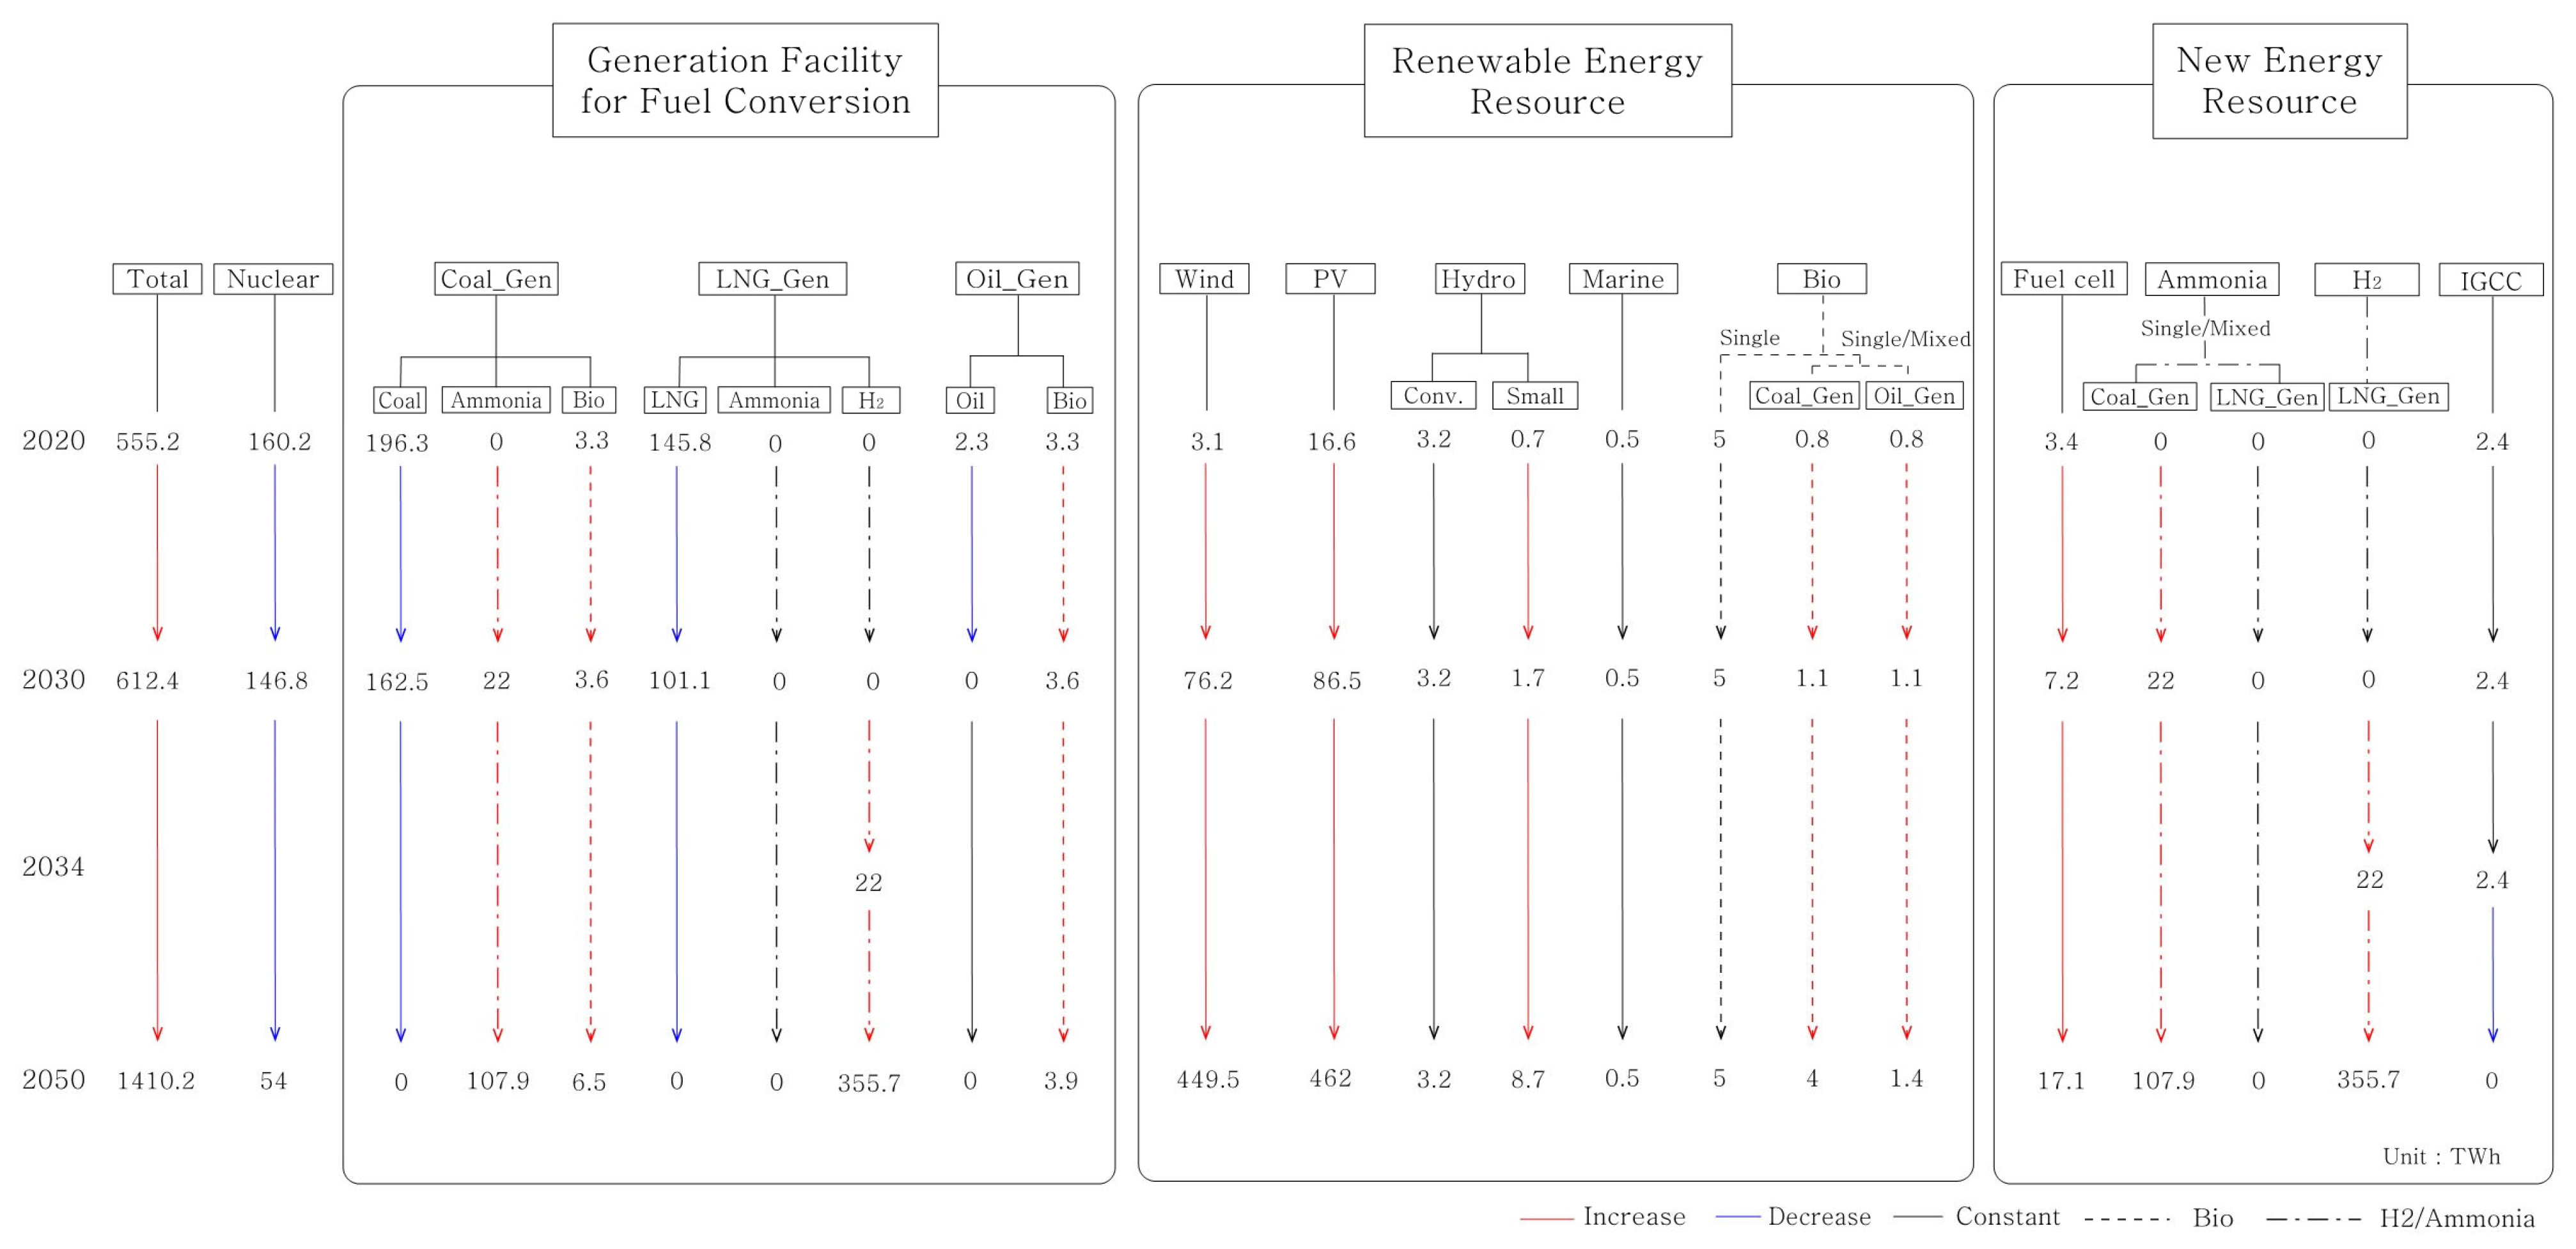
5.1. Forecasts of Generation and Capacity of Resources Subject to Fuel Conversion and Nuclear Power for 2030 and 2050
Oil-fired power generation in South Korea includes steam turbine cycles, combined cycles, and internal combustion power generation. In oil-fired power generation, mixed combustion (with bioenergy) can be applied; bio-heavy oil can be applied to steam turbine cycle generation, bio-diesel can be applied to internal combustion power, and bio-kerosene or bio-diesel can be applied to combined cycle generation. According to the 2020 SEPK, 601,195 MWh of electricity was produced by blending bio-heavy oil with heavy-oil power generation (steam turbine cycle), with no other cases of mixed combustion. However, considering the bioenergy forecasts, in the future, the total capacity of heavy oil power generation (steam turbine cycle) would be insufficient, if considering only mixed combustion between bio-heavy oil and heavy oil power generation (steam turbine cycle). Accordingly, for bioenergy, we considered all oil-fired power generation facilities as resources that were subject to fuel conversion. Note that Ulsan #4, #5 and #6 generation units are planned to convert to LNG/hydrogen mixed-combustion power generation facilities, and Daejeon/Cheongju/Daegu/Suwon combined heat and power (CHP) #1 are scheduled to convert to LNG power generation facilities. Excluding these power generation facilities, we were left with only the Daesan Combined Cycle 1CC (for the non-SCA regions), Jeju Internal Combustion #1 and #2 (for Jeju), and Moorim Powertech CHP (for the non-SCA regions), with a combined capacity of 572 MW. As there are no plans to build additional oil-fired power plants, we assumed that 572 MW will be the maximum capacity applicable for bioenergy fuel conversion. Table 2 presents the data on the commissioning and decommissioning dates and the capacity of each oil-fired generator applied to the simulation. The total capacity, as of December 2020, was 2008 MW. Assuming that their lifetimes were extended if the decommissioning date was after 2034, we arbitrarily set the decommissioning year to 2100.
Table 2.
Commissioning and decommissioning dates and capacities of oil-fired power generation for each generator and resource type.
We determined the capacities specified in Table 2, based on the NEMS simulation results for 2030 and 2050. In 2030, the combined annual generation of the Daesan Combined Cycle 1CC, Jeju Internal Combustion #1 and #2 and Murim Powertech CHP generators was 1,117,740 MWh, significantly less than the 2030 bioenergy mixed-combustion forecast of 2,270,249 MWh. Therefore, we considered both oil-fired generation and installed capacity to be zero from 2030 to 2050. For reference, the Daesan Combined Cycle 1CC, Jeju Internal Combustion #1 and #2 and Murim Powertech CHP generators, which were converted to full-combustion bioenergy, generated 1,410,901 MWh in 2050.
South Korea uses two types of LNG power generation: steam-turbined and combined cycles. As of 2020, the capacity of LNG power generation through combined and steam-turbined cycles were 32,401 MW and 1400 MW, respectively, excluding the district energy use. Thus, the capacity of the combined cycle exceeded that of the steam turbine cycle. The data on the commissioning and decommissioning dates and the capacity of the LNG generators used in the simulation were extensive and have been provided in Appendix A, Table A1. The LNG generation forecasts for 2030 and 2050 were 119,418 and 0 GWh, respectively. According to the 2030 and 2050 simulation results, the generation capacities were 101.1 TWh (37,348.7 MW) and 355.7 TWh (41,448.7 MW), respectively. All these figures for 2030 and 2050 corresponded to the LNG and hydrogen power generation, respectively, i.e., all LNG generation was converted to hydrogen generation. The estimated hydrogen power generation for 2050 was more than three times the LNG power generation for 2030. We could attribute this to two causes. First, increased electrification may cause a surge in electricity demand. Second, as volatility due to renewable energies, such as PV and wind, becomes more severe, more LNG or hydrogen generation resources, which have relatively large ramping capability, will be input to meet the generation demand.
The only type of coal power generation in South Korea is steam-turbined generation. The capacity of coal power generation in South Korea in 2020 was 186,344 MW. Coal power generation (steam turbine cycle) is a resource subject to fuel conversion (for ammonia and bioenergy). The data on the commissioning and decommissioning dates and the capacity of the coal generators used in the simulation are provided in Appendix A, Table A2. The generation forecasts of coal power in 2030 and 2050 are 133,503 and 0 GWh, respectively. The capacity forecast is 30,420.6 MW, and the 2030 simulation results indicate that the total coal generation will be 185,692,198 MWh. By subtracting 1,152,509 MWh of bioenergy and 22,046,400 MWh of ammonia, for oil-fired mixed-combustion, we could deduce that in 2030, the capacity of coal generation would be 162,493,289 MWh. Assuming that mixed combustion would be equally distributed among all the generators, there would be no converted coal generation facilities in 2030. According to the 2050 simulation results, the generation would be 114.7 TWh, comprising 6.5 TWh of bioenergy and 107.9 TWh of ammonia generation.
The capacity of nuclear power in South Korea in 2020 was 160,184 MW. The data on the commissioning and decommissioning dates and the capacity of nuclear power can be found in Appendix A, Table A3. In this study, the generation forecasts of nuclear power for 2030 and 2050 are 146,364 GWh and 79,535 GWh, respectively. According to the simulation results, the generation (capacity) of nuclear power in 2030 and 2050 would be 146,842,450 MWh (20,506 MW) and 53,975,783 MWh (19,506 MW), respectively. Notably, the generation in 2050 would be less than that estimated in the 2050 Carbon Neutrality Scenario A (79,535 MWh). This could be attributed to challenges arising from the operational characteristics of nuclear power plants, which make it difficult to respond to the increasing volatility and frequent oversupply expected in the future.
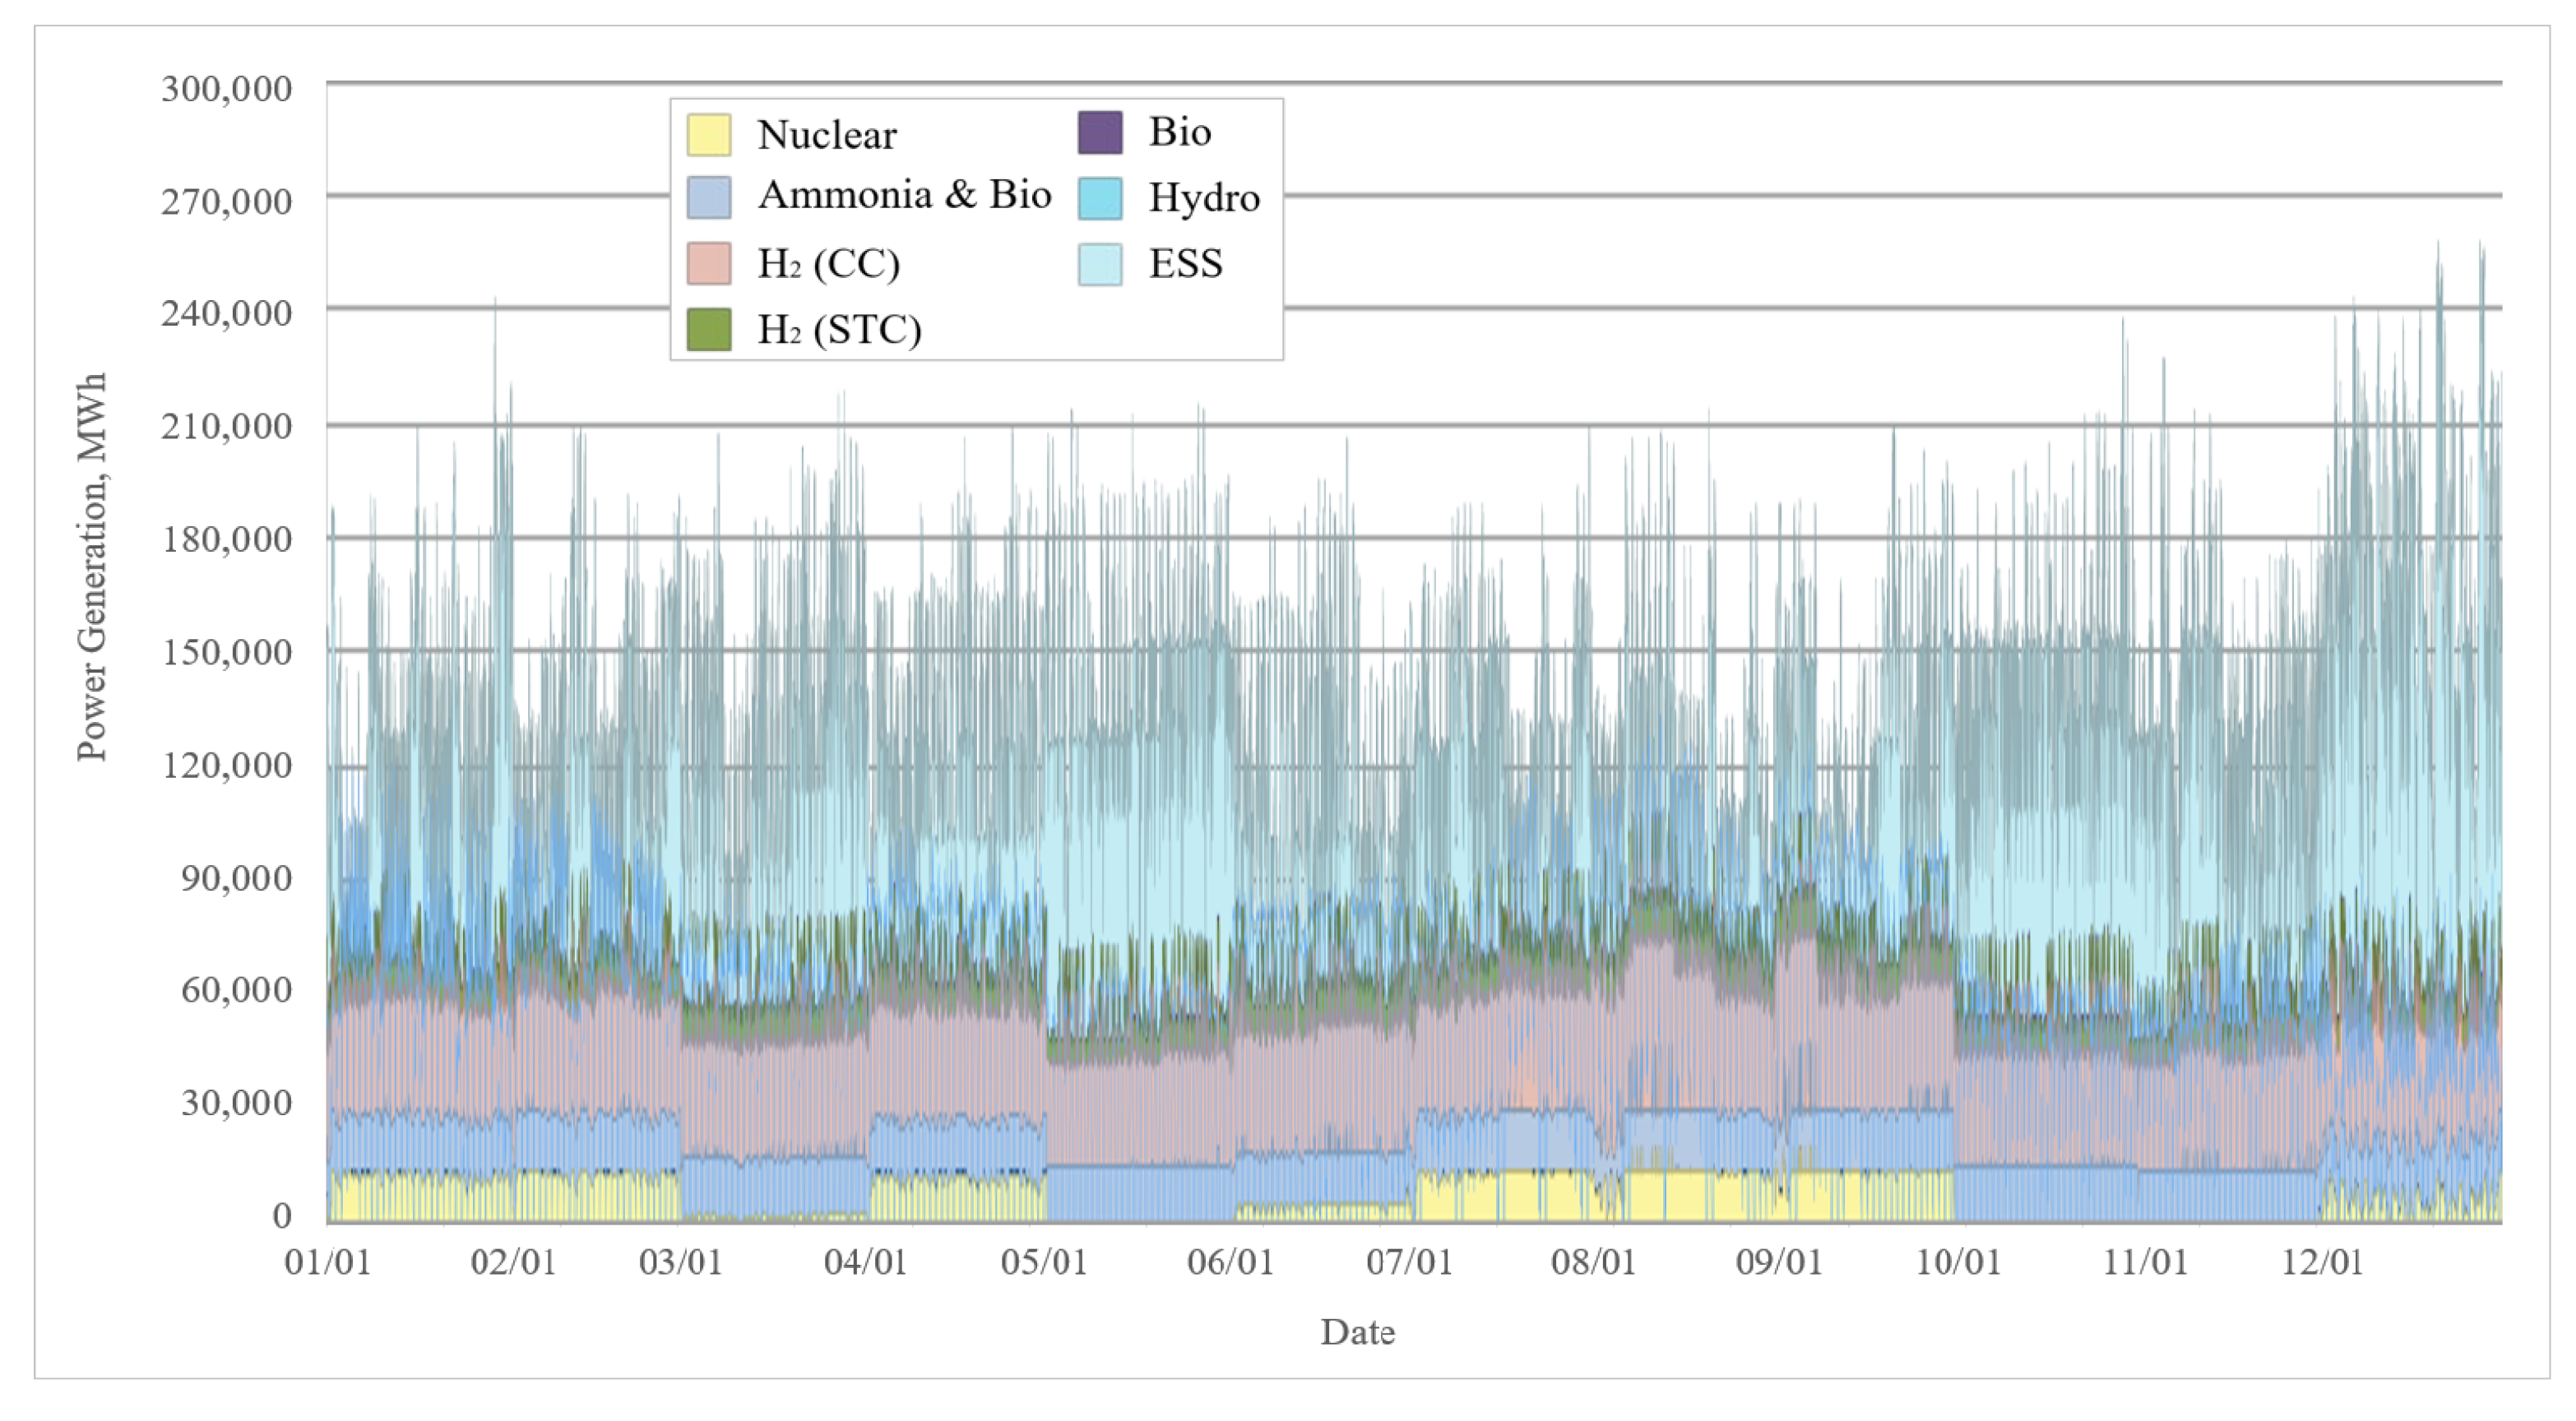
5.2. Net-Zero Electricity Mix Scenario (NEMS) Results
Figure 43 presents the combined generation forecasts for all sources to represent the NEMS. The energy (generation) forecast trends up to 2050 for all power generation sources are shown. For the resources subject to fuel conversion, the power generation from “conventional fuels” naturally decreased; however, it has been confirmed that, with the introduction of NRE fuels for fuel conversion, there are cases where the power generation more than doubles compared to the 2020 levels, as seen in LNG power generation facilities. Renewable energy facilities, excluding certain facilities such as IGCC, emit no carbon dioxide during the power generation process. Most renewable energy facilities, except for specific facilities such as marine energy, show an increasing trend until 2050. The generation forecast in the net-zero target year for nuclear power and resources subject to fuel conversion differed from the base year forecast. According to a simulation of the operational generation plan, the difference in generation was due to operational scheduling constraints and energy storage systems. This was derived based on the assumption of the current operational generation scheduling method. The results may vary if new operation methods are introduced in the future. However, given that merit order criteria and technical constraints specific to each resource are likely to persist in the future, these findings are deemed significant.
Figure 43.
Net-zero electricity mix scenario (NEMS) of South Korea.
In accordance with the proposed framework for developing NEMS, the comprehensive outlook for the year-wise installed capacity of the resources subject to fuel conversion and nuclear power plants is depicted in Figure 44. The timeline for fuel conversion for each resource was identified. Facilities were considered to have completed fuel conversion when the projected generation from alternative fuels surpassed the forecasted generation from the respective fuel conversion target resources. The fuel conversion timelines for oil-based power generation, LNG power generation, and coal power generation were projected to be in 2026, 2040, and 2043, respectively.
Figure 44.
Installed capacity forecast for resources subject to fuel conversion and nuclear power.
5.3. Evaluation of Net-Zero Electricity Mix Scenario (NEMS) Characteristics
Based on the NEMS developed in this study, we propose the use of SIRR and FCR indicators to evaluate and manage the scale of system inertia and fuel conversion level, respectively.
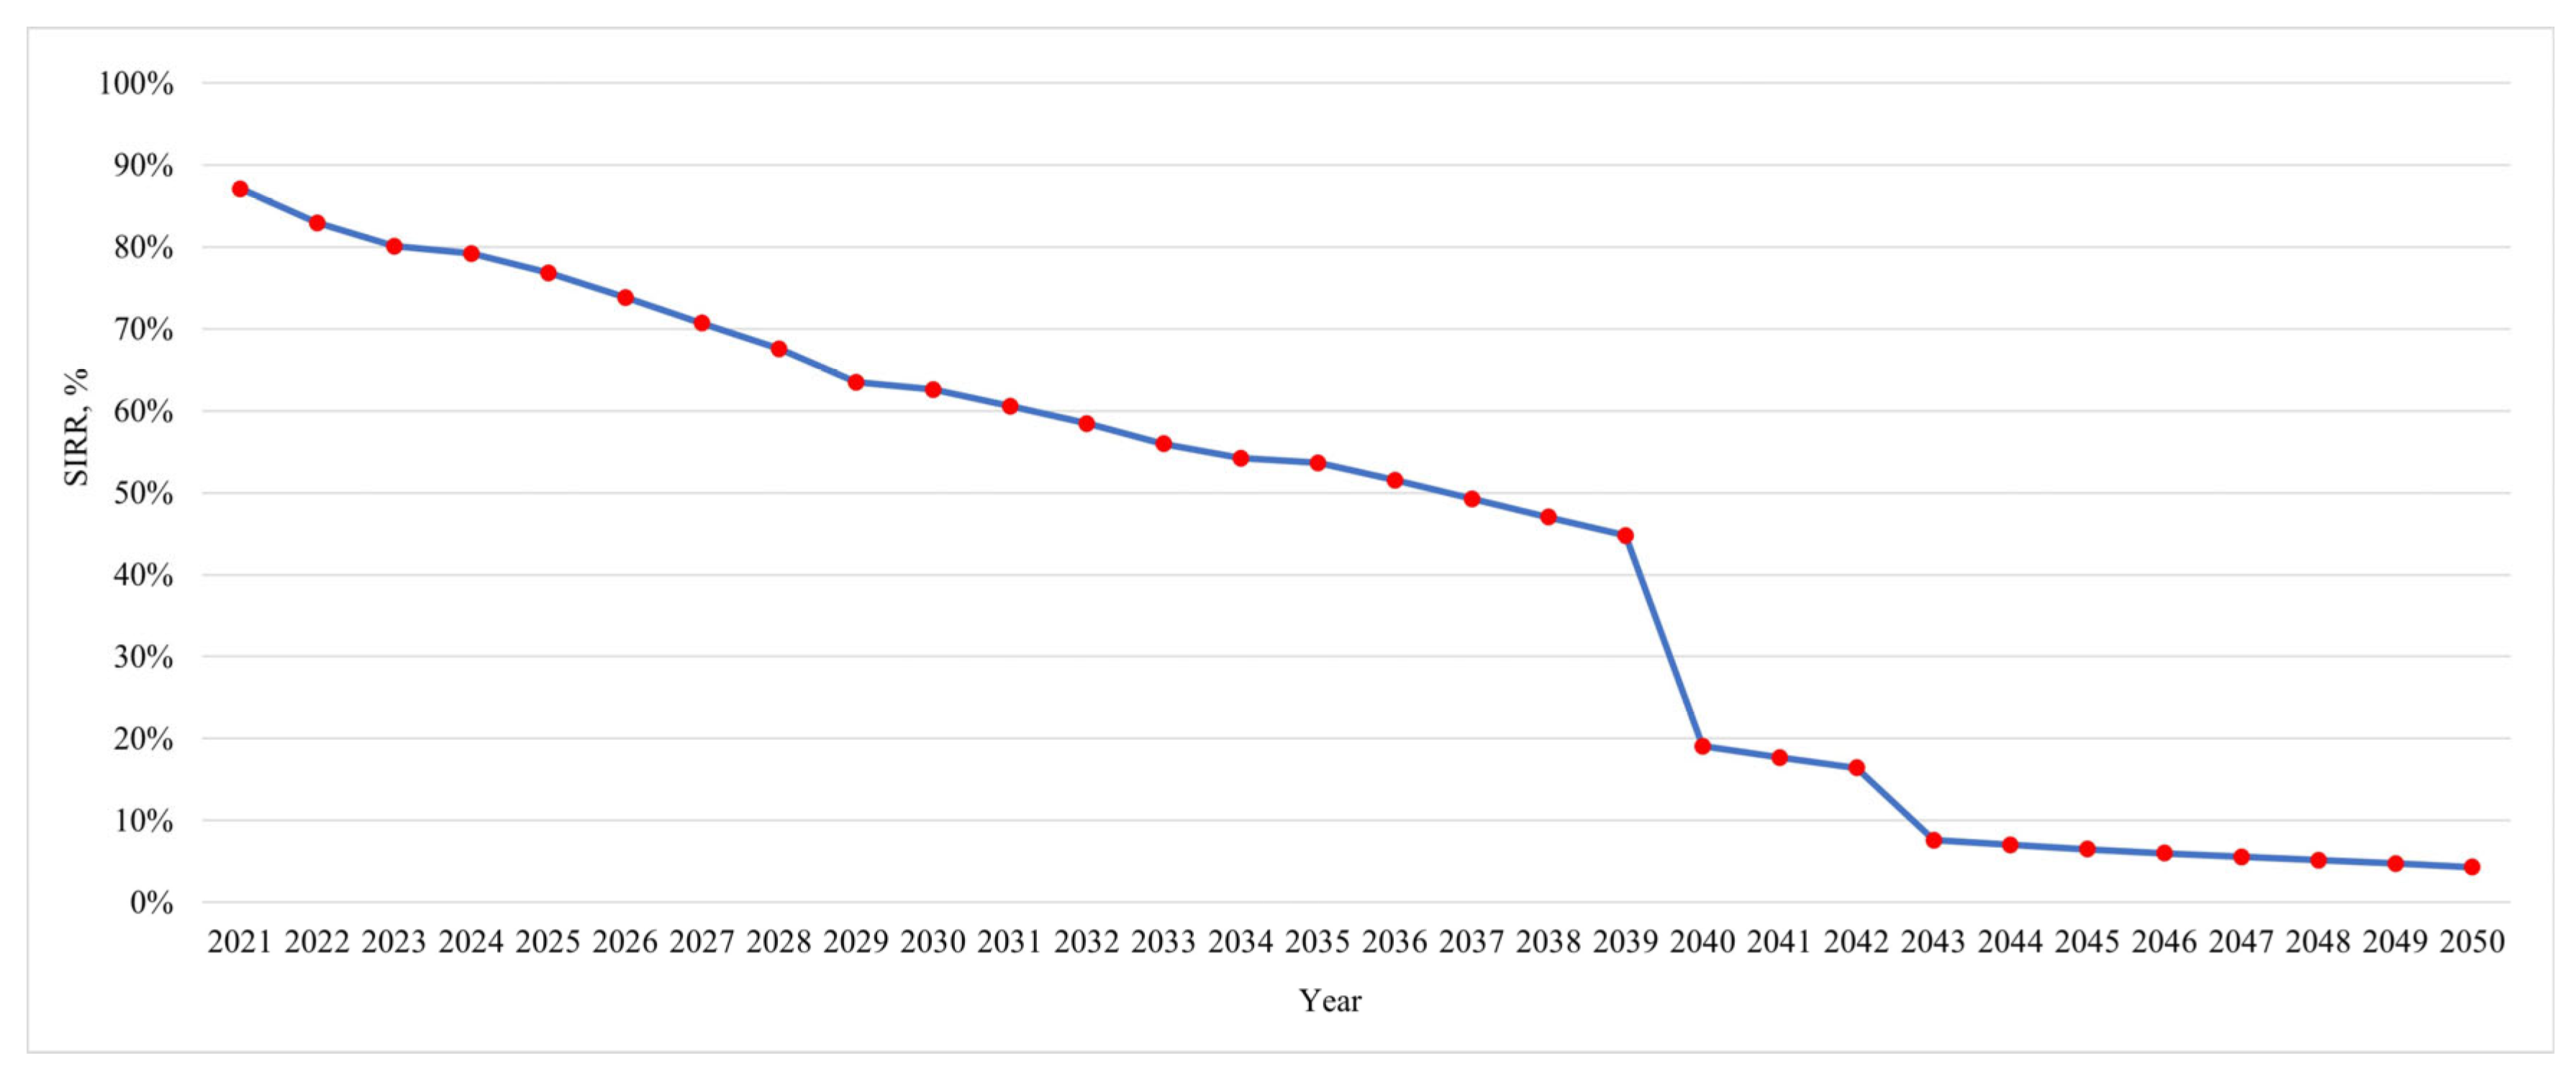
5.3.1. System Inertia Resource Ratio (SIRR)
The system inertia resource ratio (SIRR) is the ratio of inertial resources to the total resources, which can be expressed as follows:
where IRCt and TRCt indicate the inertial resource and total resource capacities at year t, respectively. The existing synchronous machine-based power sources were classified as inertial resources, whereas converter-based NREs without control strategies, such as the use of grid-forming controls, were classified as non-inertial resources. In this study, we considered wind, PV, small hydro, and fuel cells as non-inertial resources. Figure 45 shows the year-wise SIRR of the NEMS result. The SIRRs in 2030 and 2050 were 49% and 15%, respectively. As the NEMS developed in this study will be updated in the future, this indicator can be used to secure and manage the adequacy of inertial resources in the system.
Figure 45.
System inertia resource ratio (SIRR) for NEMS result.
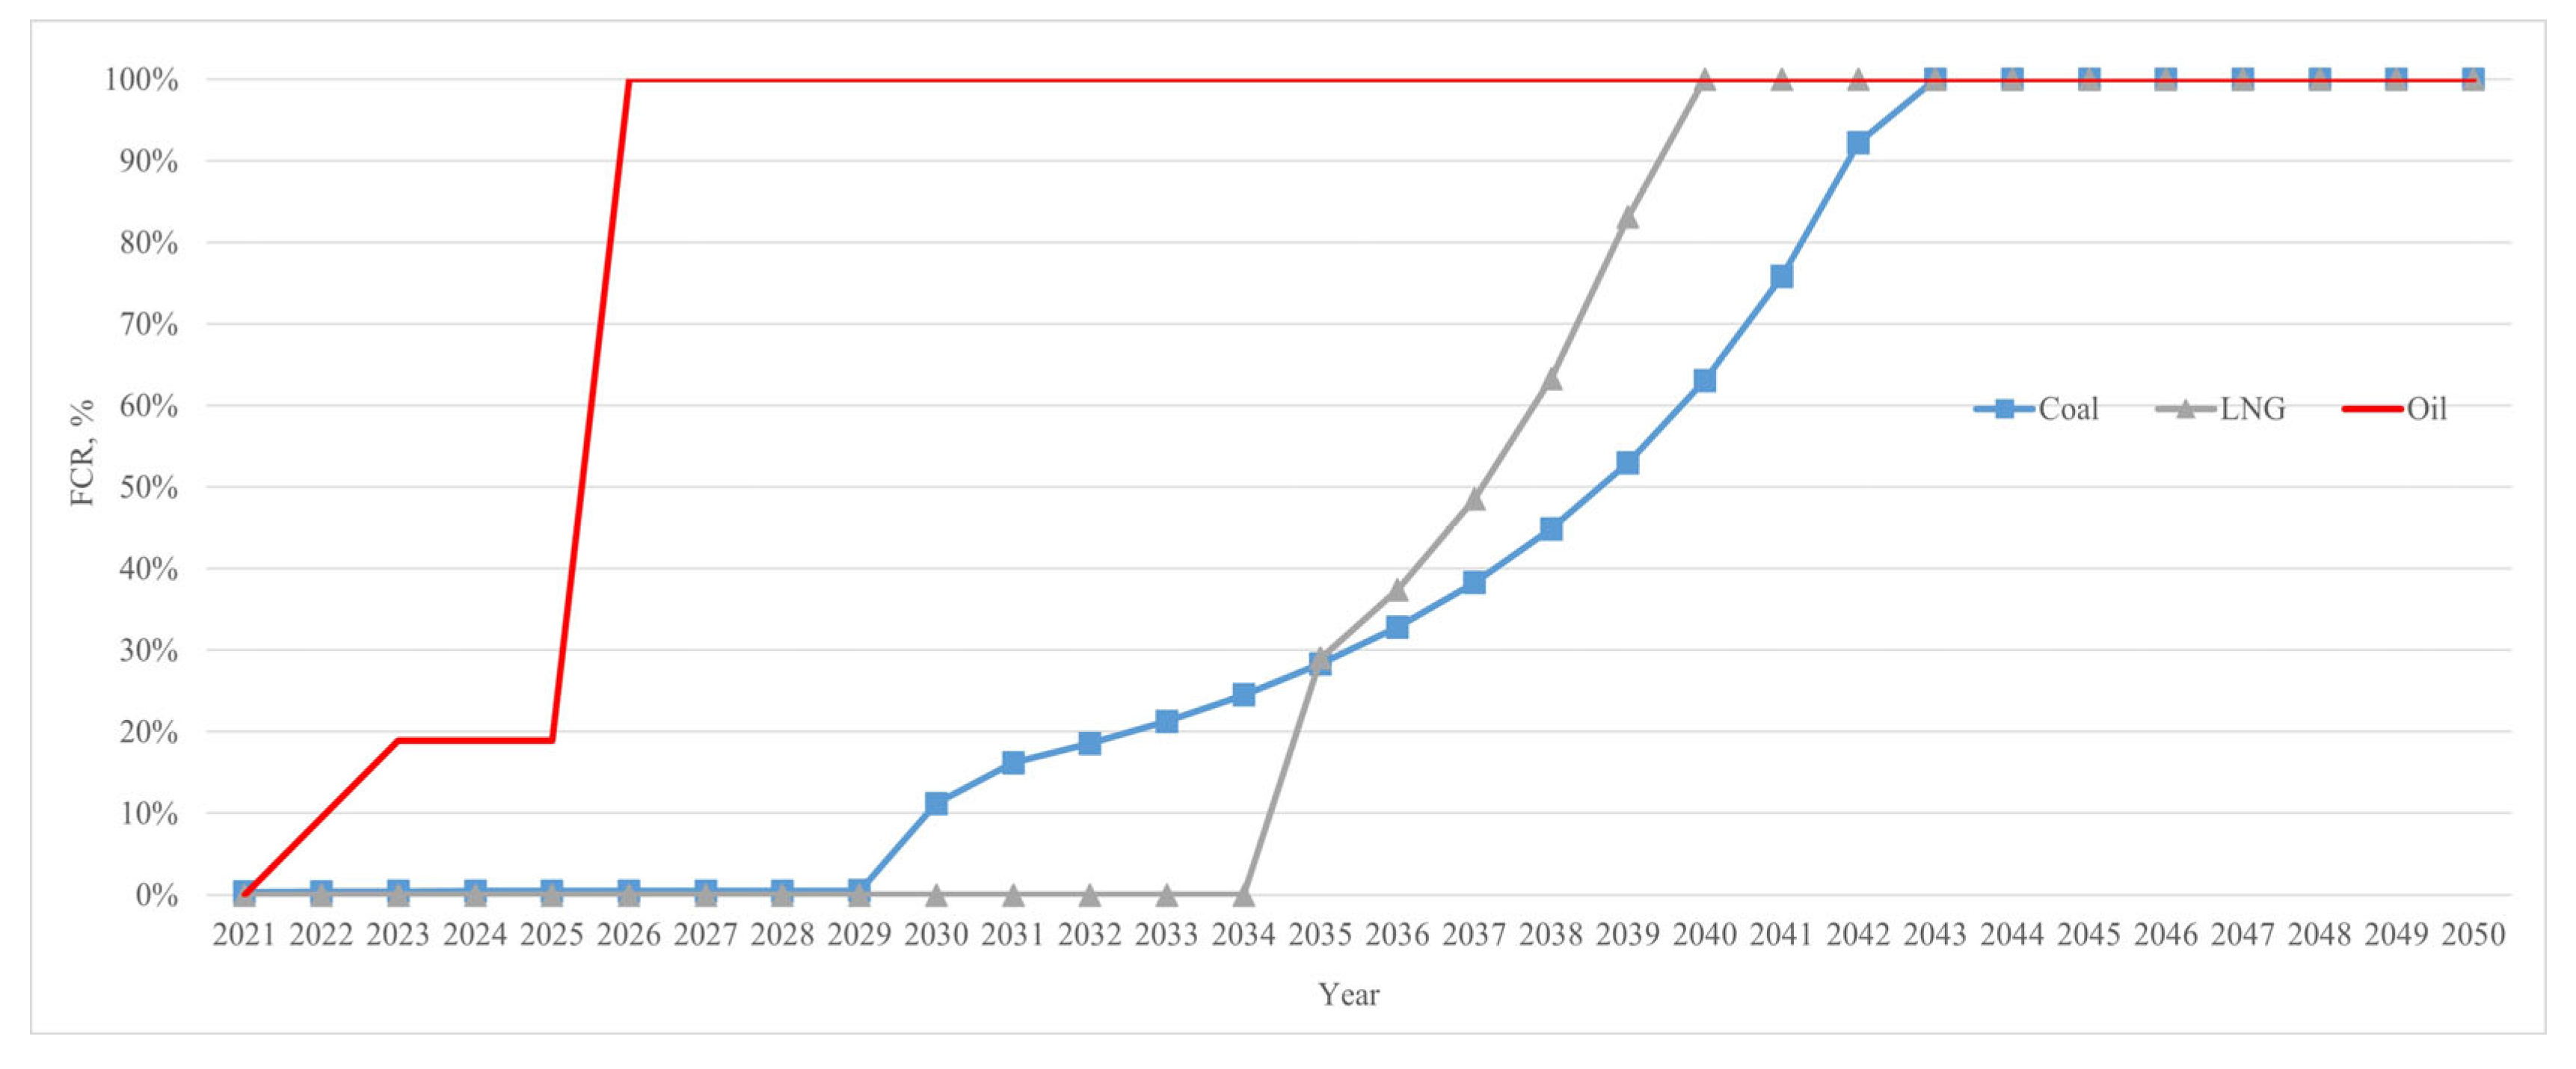
5.3.2. Fuel Conversion Rate (FCR)
Fuel conversion rate (FCR) is the extent of fuel conversion among the resources subject to fuel conversion and can be expressed as follows:
where MCGi,t and TGi,t indicate the mixed-combustion generation of resources i at year t and total generation of the resources subject to fuel conversion of resources i at year t, respectively. This indicator can be used as a management indicator, to mitigate the formation of stranded assets from the existing power facilities. In this study, coal, LNG, and oil were considered as the resources subject to fuel conversion. In general, as per our forecasts, hydrogen and ammonia will be applied to LNG power generation, bioenergy and ammonia will be applied to coal power generation, and bioenergy will be applied to oil power generation. The year-wise FCR for each resource subject to fuel conversion from 2021 to 2050 was illustrated in Figure 46. It was confirmed that the fuel conversion for coal, LNG, and oil will all be completed by the year 2043.
Figure 46.
Fuel conversion rate (FCR) for NEMS result.
6. Conclusions
In this study, we proposed a practical framework for developing a practical NEMS framework for South Korea, in line with the country’s objective to achieve carbon neutrality by 2050. The framework can be applied to effectively reflect the energy-specific policy changes and continuously update the scenarios, as per future policies and plans. We also proposed the use of SIRR and FCR as indicators of the characteristics of the NEMS forecast. The steps used for establishing the NEMS framework proposed in this study is as follows: first, we forecasted the total electricity consumption and demand patterns by year; then, we forecasted the generation and capacity by NRE type and region; and finally, we forecasted the generation and capacities of the resources that were subject to fuel conversion and nuclear power. This framework was applied to develop a NEMS for South Korea. Notably, the 2050 generation forecasts for nuclear power and the resources subject to fuel conversion differed from the forecasts projected in the 2050 Carbon Neutrality Scenario. This difference could be attributed to the influence of energy storage systems and operational scheduling constraints. As the results were based on the currently applied operational generation planning method, new operational methods would yield different results. Finally, our study findings are significant for two reasons. First, the framework can identify the impacts of government-led, top-down policymaking on NEMS. Second, it can provide a practical approach to achieve carbon neutrality by 2050. In the future, we plan to perform an updated and expanded study, based on the reviews of this study’s findings. It would be interesting to explore the key intrinsic and extrinsic factors influencing the NEMS using sensitivity analysis. For instance, analyzing the long-term impact of climate crises on renewable energy output or examining specific changes resulting from sector coupling, such as H2P (heat-to-power), will be part of our planned analysis. Additionally, we intend to explore various innovative grid operation methods that can be integrated into the framework.
Author Contributions
C.M. carried out the main body of research and H.K. reviewed the work continuously. All authors have read and agreed to the published version of the manuscript.
Funding
This research was supported by Korea Electric Power Corporation (No. R21XO01-8), and the National Research Foundation of Korea (NRF) grant funded by the Korea government (MSIT) (No. 2020R1F1A1077460).
Data Availability Statement
Data are contained within the article.
Conflicts of Interest
The authors declare no conflicts of interest. Although the author, Heejin Kim, is affiliated with Pion Electric Co., there are no financial conflicts of interest associated with the creation of this paper. The authors have made every effort to describe this paper from a transparent and objective perspective.
Appendix A. Commissioning and Decommissioning Dates and Capacities of Coal, LNG, and Nuclear Power Generators
Table A1.
Commissioning and decommissioning dates and capacities of LNG generation for each generator.
Table A1.
Commissioning and decommissioning dates and capacities of LNG generation for each generator.
| Resource Name | Commissioning Date | Decommissioning Date | Capacity (MW) |
|---|---|---|---|
| Pyeongtaek #1 | 1 April 1980 | 1 December 2024 | 350 |
| Pyeongtaek #2 | 30 June 1980 | 1 December 2024 | 350 |
| Pyeongtaek #3 | 4 May 1983 | 1 December 2024 | 350 |
| Pyeongtaek #4 | 1 August 1983 | 1 December 2024 | 350 |
| Mokdong CHP #1 | 31 December 1987 | 16 December 2047 | 21 |
| Seoincheon 1CC#1 | 17 November 1992 | 1 December 2028 | 225 |
| Seoincheon 1CC#2 | 17 November 1992 | 1 December 2028 | 225 |
| Seoincheon 1CC#3 | 17 November 1992 | 1 December 2028 | 225 |
| Seoincheon 1CC#4 | 17 November 1992 | 1 December 2028 | 225 |
| Seoincheon 1CC#5 | 17 November 1992 | 1 December 2028 | 225 |
| Seoincheon 1CC#6 | 17 November 1992 | 1 December 2028 | 225 |
| Seoincheon 1CC#7 | 17 November 1992 | 1 December 2028 | 225 |
| Seoincheon 1CC#8 | 17 November 1992 | 1 December 2028 | 225 |
| Bucheon CC#1 | 1 February 1993 | 1 May 2028 | 450 |
| Bundang CC #1 | 16 September 1993 | 1 September 2053 | 560 |
| Ilsan CC#1 | 1 December 1993 | 16 November 2053 | 600 |
| Ulsan CC#1 | 1 June 1995 | 17 May 2055 | 300 |
| Ilsan CC#2 | 31 March 1996 | 16 March 2056 | 300 |
| Bundang CC #2 | 31 March 1997 | 16 March 2057 | 340 |
| Incheon CC#1 | 1 July 1997 | 16 June 2057 | 450 |
| Incheon CC#2 | 1 July 1997 | 16 June 2057 | 450 |
| Incheon CC#3 | 1 July 1997 | 16 June 2057 | 450 |
| Incheon CC#4 | 1 July 1997 | 16 June 2057 | 450 |
| Ulsan CC#2 | 1 August 1997 | 17 July 2057 | 450 |
| Ulsan CC#3 | 1 August 1997 | 17 July 2057 | 450 |
| Anyang CC#1 | 1 December 2000 | 1 December 2021 | 450 |
| POSCO Energy CC#3 | 16 March 2001 | 1 March 2061 | 450 |
| POSCO Energy CC#4 | 16 March 2001 | 1 March 2061 | 450 |
| GS Dangjin CC#1 | 1 April 2001 | 17 March 2061 | 501 |
| Ansan Urban Development CHP | 1 June 2001 | 17 May 2061 | 61 |
| Boryeong CC#1 | 1 August 2002 | 17 July 2062 | 450 |
| Boryeong CC#2 | 1 August 2002 | 17 July 2062 | 450 |
| Boryeong CC#3 | 1 August 2002 | 17 July 2062 | 450 |
| Busan CC#1 | 1 March 2004 | 15 February 2064 | 450 |
| Busan CC#2 | 1 March 2004 | 15 February 2064 | 450 |
| Busan CC#3 | 1 March 2004 | 15 February 2064 | 450 |
| Busan CC#4 | 1 March 2004 | 15 February 2064 | 450 |
| Incheon 1CC | 1 June 2005 | 17 May 2065 | 504 |
| Yulchon CC#1 | 5 September 2005 | 21 August 2065 | 526 |
| GS Dangjin 2CC | 1 November 2005 | 17 October 2065 | 500.25 |
| Gwangyang 1CC | 13 February 2006 | 29 January 2066 | 495 |
| Gwangyang 2CC | 15 May 2006 | 30 April 2066 | 495 |
| Hwaseong CHP 1CC | 30 November 2007 | 15 November 2067 | 588.3 |
| Incheon 2CC | 1 June 2009 | 17 May 2069 | 508.9 |
| Songdo CHP 1CC | 30 April 2010 | 15 April 2070 | 219.55 |
| Incheon Airport 1CC | 19 May 2010 | 4 May 2070 | 127 |
| Gunsan 1CC | 31 May 2010 | 16 May 2070 | 718.4 |
| Paju CHP 1CC | 23 August 2010 | 8 August 2070 | 515.5 |
| Yeongwol 1CC | 31 October 2010 | 16 October 2070 | 848 |
| Pangyo CHP 1CC | 30 November 2010 | 15 November 2070 | 146.314 |
| Daejeon Southwest CHP | 31 January 2011 | 16 January 2071 | 48.3 |
| POSCO Energy CC#5 | 28 February 2011 | 13 February 2071 | 574.5 |
| POSCO Energy CC#6 | 30 June 2011 | 15 June 2071 | 574.58 |
| Gwanggyo Heat & Power CC | 1 November 2012 | 17 October 2072 | 144.8 |
| Incheon 3CC | 1 December 2012 | 16 November 2072 | 450 |
| Oseong CC#1 | 1 March 2013 | 14 February 2073 | 800 |
| Suwan CHP CC | 1 April 2013 | 17 March 2073 | 115.24 |
| Byeolnae Heat CC | 1 July 2013 | 16 June 2073 | 130.4 |
| GS Dangjin CC#3 | 1 July 2013 | 16 June 2073 | 382 |
| Sejong CHP | 1 November 2013 | 17 October 2073 | 530 |
| Andong CC | 2 April 2014 | 18 March 2074 | 400 |
| Yangju CHP CC | 9 April 2014 | 25 March 2074 | 555.1 |
| Yulchon CC#2 | 29 April 2014 | 14 April 2074 | 885 |
| Pocheon CC#1 | 1 July 2014 | 16 June 2074 | 725 |
| Daegu Green Power CC | 1 July 2014 | 16 June 2074 | 415.15 |
| Ulsan CC#4 | 29 July 2014 | 14 July 2074 | 871.9 |
| POSCO Energy CC#7 | 30 July 2014 | 15 July 2074 | 382.4 |
| Pocheon CC#2 | 9 August 2014 | 25 July 2074 | 725 |
| Pyeongtaek CC#2 | 29 September 2014 | 14 September 2074 | 868.5 |
| POSCO Energy CC#8 | 21 October 2014 | 6 October 2074 | 382 |
| Asan Bae CHP CC | 21 October 2014 | 6 October 2074 | 101.7 |
| Ansan CC | 7 November 2014 | 23 October 2074 | 751.2 |
| POSCO Energy CC#9 | 1 January 2015 | 17 December 2074 | 383 |
| Dongducheon 2CC | 1 January 2015 | 17 December 2074 | 858 |
| Dongducheon 1CC | 1 March 2015 | 14 February 2075 | 858 |
| Hanam CHP CC | 1 October 2015 | 16 September 2075 | 399 |
| Luxury Osan CHP 1CC | 1 March 2016 | 15 February 2076 | 436.1 |
| Paju 1CC | 1 February 2017 | 17 January 2077 | 848 |
| Pocheon Natural CC | 17 March 2017 | 2 March 2077 | 874.2 |
| Paju 2CC | 28 March 2017 | 13 March 2077 | 848 |
| GS Dangjin CC#4 | 15 April 2017 | 31 March 2077 | 846 |
| Wirye New Town | 15 April 2017 | 31 March 2077 | 413 |
| Chuncheon CHP CC | 1 May 2017 | 16 April 2077 | 470 |
| Yeongnam Power 1CC | 1 November 2017 | 17 October 2077 | 476.1 |
| Dongtan CHP 1CC | 23 November 2017 | 8 November 2077 | 378.4 |
| Dongtan CHP 2CC | 4 December 2017 | 19 November 2077 | 378.4 |
| Busan Jeonggwan Energy CC | 1 January 2018 | 17 December 2077 | 50.2 |
| Anyang CHP 2-1CC | 1 August 2018 | 17 July 2078 | 481 |
| Seoul CC#2 | 1 July 2019 | 16 June 2079 | 400 |
| Shinpyeongtaek CC#1 | 1 November 2019 | 17 October 2079 | 863.3 |
| Seoul CC#1 | 11 November 2019 | 27 October 2079 | 400 |
| Jeju CC#1 | 18 December 2019 | 3 December 2079 | 125 |
| Jeju CC#2 | 14 January 2020 | 30 December 2079 | 125 |
| Anyang CHP 2-2CC | 1 December 2021 | 16 November 2081 | 467.5 |
| Yeoju CC#1 | 1 December 2022 | 16 November 2082 | 1000 |
| Yangsan collective energy | 1 April 2023 | 17 March 2083 | 118.9 |
| Daejeon CHP (9th) | 1 October 2023 | 16 September 2083 | 25 |
| Sejong Happiness CHP | 1 November 2023 | 17 October 2083 | 585 |
| Magok CHP | 1 November 2023 | 17 October 2083 | 285 |
| Yeosu Green Energy | 1 February 2024 | 17 January 2084 | 250 |
| Samcheonpo #3 LNG CC | 1 December 2024 | 16 November 2084 | 560 |
| Samcheonpo #4 LNG CC | 1 December 2024 | 16 November 2084 | 560 |
| Tongyeong CC#1 | 1 December 2024 | 16 November 2084 | 920 |
| Ulsan GPS CC | 1 December 2024 | 16 November 2084 | 1122 |
| Eumseong Green Energy CC | 1 December 2024 | 16 November 2084 | 1122 |
| Daegu CHP #1 | 1 December 2024 | 16 November 2084 | 261 |
| Cheongju CHP #1 | 1 December 2024 | 16 November 2084 | 261 |
| Bucheon CHP #2-1 | 1 May 2025 | 16 April 2085 | 498 |
| Taean #1 LNG CC | 1 December 2025 | 16 November 2085 | 500 |
| Taean #2 LNG CC | 1 December 2025 | 16 November 2085 | 500 |
| Boryeong #5 1CC | 1 December 2025 | 16 November 2085 | 500 |
| Boryeong #6 1CC | 1 December 2025 | 16 November 2085 | 500 |
| Hadong #1 CC | 1 June 2026 | 17 May 2086 | 500 |
| Hadong #2 CC | 1 June 2027 | 17 May 2087 | 500 |
| Samcheonpo #5 CC | 1 July 2027 | 16 June 2087 | 500 |
| Samcheonpo #6 CC | 1 January 2028 | 17 December 2087 | 500 |
| Bucheon CHP #2-2 | 1 May 2028 | 16 April 2088 | 498 |
| Hadong #3 CC | 1 June 2028 | 17 May 2088 | 500 |
| Hadong #4 CC | 1 December 2028 | 16 November 2088 | 500 |
| Taean #3 CC | 1 December 2028 | 16 November 2088 | 500 |
| Dangjin #1_2 CC | 1 December 2029 | 16 November 2089 | 1000 |
| New LNG #1CC (9th) | 1 December 2029 | 16 November 2089 | 500 |
| New LNG #2CC (9th) | 1 December 2029 | 16 November 2089 | 500 |
| Taean #4 CC | 1 December 2029 | 16 November 2089 | 500 |
| Dangjin #3_4 CC | 1 September 2030 | 17 August 2090 | 1000 |
| Hadong #5 CC | 1 June 2031 | 17 May 2091 | 500 |
| Hadong #6 CC | 1 December 2031 | 16 November 2091 | 500 |
| Taean #5 CC | 1 December 2032 | 16 November 2092 | 500 |
| Taean #6 CC | 1 December 2032 | 16 November 2092 | 500 |
| Yeongheung #1 CC | 1 June 2034 | 17 May 2094 | 800 |
| Yeongheung #2 CC | 1 December 2034 | 16 November 2094 | 800 |
| Total capacity (MW) | 41,448.7 | ||
Note: Combined cycle (CC). Combined heat and power (CHP).
Table A2.
Commissioning and decommissioning dates and capacities of coal power generation for each generator.
Table A2.
Commissioning and decommissioning dates and capacities of coal power generation for each generator.
| Resource Name | Commissioning Date | Decommissioning Date | Capacity (MW) |
|---|---|---|---|
| Honam #1 | 1 October 1972 | 16 September 2032 | 250 |
| Honam #2 | 1 October 1972 | 16 September 2032 | 250 |
| Samcheonpo #1 | 1 August 1983 | 17 July 2043 | 560 |
| Boryeong #1 | 1 December 1983 | 16 November 2043 | 500 |
| Samcheonpo #2 | 1 February 1984 | 17 January 2044 | 560 |
| Boryeong #2 | 1 September 1984 | 17 August 2044 | 500 |
| Samcheonpo #3 | 1 April 1993 | 17 March 2053 | 560 |
| Boryeong #3 | 1 June 1993 | 17 May 2053 | 500 |
| Boryeong #4 | 1 June 1993 | 17 May 2053 | 500 |
| Samcheonpo #4 | 1 March 1994 | 14 February 2054 | 560 |
| Boryeong #5 | 1 September 1994 | 17 August 2054 | 500 |
| Boryeong #6 | 1 September 1994 | 17 August 2054 | 500 |
| Taean #1 | 1 June 1995 | 17 May 2055 | 500 |
| Taean #2 | 1 December 1995 | 16 November 2055 | 500 |
| Taean #3 | 1 March 1997 | 14 February 2057 | 500 |
| Samcheonpo #5 | 1 June 1997 | 17 May 2057 | 500 |
| Taean #4 | 1 September 1997 | 17 August 2057 | 500 |
| Samcheonpo #6 | 1 January 1998 | 17 December 2057 | 500 |
| Dangjin #1 | 30 June 1999 | 15 June 2059 | 500 |
| Yeosu #2 | 1 November 1999 | 17 October 2059 | 328.6 |
| Hadong #1 | 1 November 1999 | 17 October 2059 | 500 |
| Hadong #2 | 1 November 1999 | 17 October 2059 | 500 |
| Hadong #3 | 1 November 1999 | 17 October 2059 | 500 |
| Hadong #4 | 1 November 1999 | 17 October 2059 | 500 |
| Dangjin #2 | 31 December 1999 | 16 December 2059 | 500 |
| Hadong #5 | 30 September 2000 | 15 September 2060 | 500 |
| Hadong #6 | 30 September 2000 | 15 September 2060 | 500 |
| Dangjin #3 | 31 December 2000 | 16 December 2060 | 500 |
| Dangjin #4 | 31 December 2000 | 16 December 2060 | 500 |
| Taean #5 | 28 May 2002 | 13 May 2062 | 500 |
| Taean #6 | 28 May 2002 | 13 May 2062 | 500 |
| Yeongheung #1 | 12 July 2004 | 27 June 2064 | 800 |
| Yeongheung #2 | 30 November 2004 | 15 November 2064 | 800 |
| Dangjin #5 | 30 September 2005 | 15 September 2065 | 500 |
| Dangjin #6 | 1 April 2006 | 17 March 2066 | 500 |
| Taean#7 | 28 February 2007 | 13 February 2067 | 500 |
| Dangjin #7 | 30 April 2007 | 15 April 2067 | 500 |
| Taean#8 | 31 July 2007 | 16 July 2067 | 500 |
| Dangjin #8 | 30 September 2007 | 15 September 2067 | 500 |
| Yeongheung #3 | 1 June 2008 | 17 May 2068 | 870 |
| Boryeong #7 | 19 June 2008 | 4 June 2068 | 500 |
| Boryeong #8 | 11 December 2008 | 26 November 2068 | 500 |
| Yeongheung #4 | 15 December 2008 | 30 November 2068 | 870 |
| Hadong #7 | 31 December 2008 | 16 December 2068 | 500 |
| Hadong #8 | 28 May 2009 | 13 May 2069 | 500 |
| Yeongheung #5 | 11 June 2014 | 27 May 2074 | 870 |
| Yeongheung #6 | 5 November 2014 | 21 October 2074 | 870 |
| Dangjin #9 | 1 December 2015 | 16 November 2075 | 1020 |
| Samcheok Green #1 | 1 June 2016 | 17 May 2076 | 1022 |
| Bukpyeong #1 | 1 June 2016 | 17 May 2076 | 595 |
| Dangjin #10 | 1 June 2016 | 17 May 2076 | 1020 |
| Taean #9 | 1 June 2016 | 17 May 2076 | 1050 |
| Yeosu #1 | 1 August 2016 | 17 July 2076 | 340 |
| Taean#10 | 1 May 2017 | 16 April 2077 | 1050 |
| Samcheok Green #2 | 1 June 2017 | 17 May 2077 | 1022 |
| Shinboryeong #1 | 30 June 2017 | 15 June 2077 | 1019 |
| Bukpyeong #2 | 1 August 2017 | 17 July 2077 | 595 |
| Shinboryeong #2 | 30 September 2017 | 15 September 2077 | 1019 |
| Shin Seocheon #1 | 1 March 2021 | 14 February 2081 | 1000 |
| Goseong High #1 | 1 April 2021 | 17 March 2081 | 1040 |
| Goseong High #2 | 1 October 2021 | 16 September 2081 | 1040 |
| Gangneung Anin #1 | 1 September 2022 | 17 August 2082 | 1040 |
| Gangneung Anin #2 | 1 March 2023 | 14 February 2083 | 1040 |
| Samcheok #1 | 1 October 2023 | 16 September 2083 | 1050 |
| Samcheok #2 | 1 April 2024 | 17 March 2084 | 1050 |
| Total capacity (MW) | 42,160.6 | ||
Table A3.
Commissioning and decommissioning dates and capacities of nuclear power generation for each generator.
Table A3.
Commissioning and decommissioning dates and capacities of nuclear power generation for each generator.
| Resource Name | Commissioning Date | Decommissioning Date | Capacity (MW) |
|---|---|---|---|
| Gori #2 | 25 July 1983 | 11 October 1901 | 650 |
| Gori #3 | 30 September 1985 | 7 August 1902 | 950 |
| Gori #4 | 29 April 1986 | 7 August 1902 | 950 |
| Hanbit #1 | 25 August 1986 | 7 August 1902 | 950 |
| Hanbit #2 | 10 June 1987 | 7 August 1902 | 950 |
| Hanul #1 | 1 September 1988 | 7 August 1902 | 950 |
| Hanul #2 | 1 September 1989 | 7 August 1902 | 950 |
| Hanbit #3 | 31 March 1995 | 26 September 1902 | 1000 |
| Hanbit #4 | 1 January 1996 | 26 September 1902 | 1000 |
| Wolseong #2 | 1 July 1997 | 30 November 1901 | 700 |
| Wolseong #3 | 1 July 1998 | 30 November 1901 | 700 |
| Hanul #3 | 1 August 1998 | 26 September 1902 | 1000 |
| Wolseong #4 | 1 October 1999 | 30 November 1901 | 700 |
| Hanul #4 | 31 December 1999 | 26 September 1902 | 1000 |
| Hanbit #5 | 21 May 2002 | 26 September 1902 | 1000 |
| Hanbit #6 | 23 December 2002 | 26 September 1902 | 1000 |
| Hanul #5 | 1 July 2004 | 26 September 1902 | 1000 |
| Hanul #6 | 1 April 2005 | 26 September 1902 | 1000 |
| Shin-Gori #1 | 1 February 2011 | 18 November 1902 | 1053 |
| Shinwolseong #1 | 1 July 2012 | 26 September 1902 | 1000 |
| Shin-Gori #2 | 20 July 2012 | 18 November 1902 | 1053 |
| Shinwolseong #2 | 24 July 2015 | 26 September 1902 | 1000 |
| Shin-Gori #3 | 1 April 2016 | 31 October 1903 | 1400 |
| Shin-Gori #4 | 1 September 2018 | 31 October 1903 | 1400 |
| Shin Hanul #1 | 1 July 2021 | 31 October 1903 | 1400 |
| Shin Hanul #2 | 1 May 2022 | 31 October 1903 | 1400 |
| Shin-Gori #5 | 1 March 2023 | 31 October 1903 | 1400 |
| Shin-Gori #6 | 1 June 2024 | 31 October 1903 | 1400 |
| Total capacity (MW) | 28,956 | ||
References
- The Ministry of Trade, Industry and Energy. The 9th Basic Plan on Electricity Demand and Supply; MOTIE: Sejong, Republic of Korea, 2020. Available online: http://a.to/23WWwz1 (accessed on 20 December 2023).
- Ministry Concerned. 2030 National Greenhouse Gas Reduction Target (NDC) Upgrade Plan: Sejong, Korea, 2021. Available online: http://a.to/23R7xGD (accessed on 20 December 2023).
- Ministry Concerned. 2050 Carbon Neutral Scenario Roadmap: Sejong, Korea, 2021. Available online: http://a.to/23e2AkC (accessed on 20 December 2023).
- Bouckaert, S.; Pales, A.F.; McGlade, C.; Remme, U.; Wanner, B.; Varro, L.; D’Ambrosio, D.; Spencer, T. Net Zero by 2050: A Roadmap for the Global Energy Sector. 2021. Available online: https://iea.blob.core.windows.net/assets/4719e321-6d3d-41a2-bd6b-461ad2f850a8/NetZeroby2050-ARoadmapfortheGlobalEnergySector.pdf (accessed on 20 December 2023).
- The Ministry of Trade, Industry and Energy. Commercialization of Ammonia Power Generation by 2030 and Hydrogen Power Generation by 2035. Available online: https://www.korea.kr/news/policyBriefingView.do?newsId=148895640 (accessed on 20 December 2023).
- Denis, G.; Prevost, T.; Debry, M.S.; Xavier, F.; Guillaud, X.; Menze, A. The Migrate project: The challenges of operating a transmission grid with only inverter-based generation. A grid-forming control improvement with transient current-limiting control. IET Renew. Power Gen. 2018, 12, 523–529. [Google Scholar] [CrossRef]
- Logan, K.G.; Nelson, J.D.; Hastings, A. Low emission vehicle integration: Will national grid electricity generation mix meet UK net zero? Proc. Inst. Mech. Eng. Part A J. Power Energy 2022, 236, 159–175. [Google Scholar] [CrossRef]
- Pina, A.; Silva, C.A.; Ferrão, P. High-resolution modeling framework for planning electricity systems with high penetration of renewables. Appl. Energy 2013, 112, 215–223. [Google Scholar] [CrossRef]
- Gaete-Morales, C.; Gallego-Schmid, A.; Stamford, L.; Azapagic, A. A novel framework for development and optimisation of future electricity scenarios with high penetration of renewables and storage. Appl. Energy 2019, 250, 1657–1672. [Google Scholar] [CrossRef]
- Aryanpur, V.; Atabaki, M.S.; Marzband, M.; Siano, P.; Ghayoumi, K. An overview of energy planning in Iran and transition pathways towards sustainable electricity supply sector. Renew. Sustain. Energy Rev. 2019, 112, 58–74. [Google Scholar] [CrossRef]
- Brand, B.; Missaoui, R. Multi-criteria analysis of electricity generation mix scenarios in Tunisia. Renew. Sustain. Energy Rev. 2014, 39, 251–261. [Google Scholar] [CrossRef]
- Elliston, B.; MacGill, I.; Diesendorf, M. Comparing least cost scenarios for 100% renewable electricity with low emission fossil fuel scenarios in the Australian National Electricity Market. Renew. Energy 2014, 66, 196–204. [Google Scholar] [CrossRef]
- Lund, P.D.; Skytte, K.; Bolwig, S.; Bolkesjö, T.F.; Bergaentzlé, C.; Gunkel, P.A.; Kirkerud, J.G.; Klitkou, A.; Koduvere, H.; Gravelsins, A.; et al. Pathway analysis of a zero-emission transition in the Nordic-Baltic region. Energies 2019, 12, 3337. [Google Scholar] [CrossRef]
- Choi, D.; Ahn, Y.-H.; Choi, D.G. Multi-criteria decision analysis of electricity sector transition policy in Korea. Energy Strategy Rev. 2020, 29, 100485. [Google Scholar] [CrossRef]
- Jeong, W.-C.; Lee, D.-H.; Roh, J.H.; Park, J.-B. Scenario analysis of the GHG emissions in the electricity sector through 2030 in South Korea considering updated NDC. Energies 2022, 15, 3310. [Google Scholar] [CrossRef]
- Min, D.; Ryu, J.-h.; Choi, D.G. Effects of the move towards renewables on the power system reliability and flexibility in South Korea. Energy Rep. 2020, 6, 406–417. [Google Scholar] [CrossRef]
- Korea Electric Power Corporation, Statistics of Electric Power in Korea 2020 (No.90). 2021. Available online: http://a.to/239AML0 (accessed on 20 December 2023).
- Korea Power Exchange. Available online: http://a.to/24ExlXi (accessed on 31 January 2023).
- Lee, J. Ocean Energy Development Status and Future Tasks. Bull. KSNRE 2021, 1, 2. [Google Scholar]
- The Ministry of Trade, Industry and Energy. New & Renewable Energy White Paper; MOTIE: Sejong, Republic of Korea, 2020. Available online: http://a.to/23s6sEQ (accessed on 20 December 2023).
- Lee, H.; Woo, Y.; Lee, M.-J. The need for R&D of ammonia combustion technology for carbon neutrality—Part II R&D trends and technical feasibility analysis. J. Korean Soc. Combust. 2021, 26, 84–106. [Google Scholar] [CrossRef]
- Korea Power Exchange. Power Generation Facility Status: Increase/Decrease Trend of Pumped Storage and Hydroelectric Power Plants. National Statistics Portal. Available online: http://a.to/23U7bda (accessed on 20 December 2023).
- Master’s Space. M-Core User’s Manual; MS: Anyang, Republic of Korea, 2016. [Google Scholar]
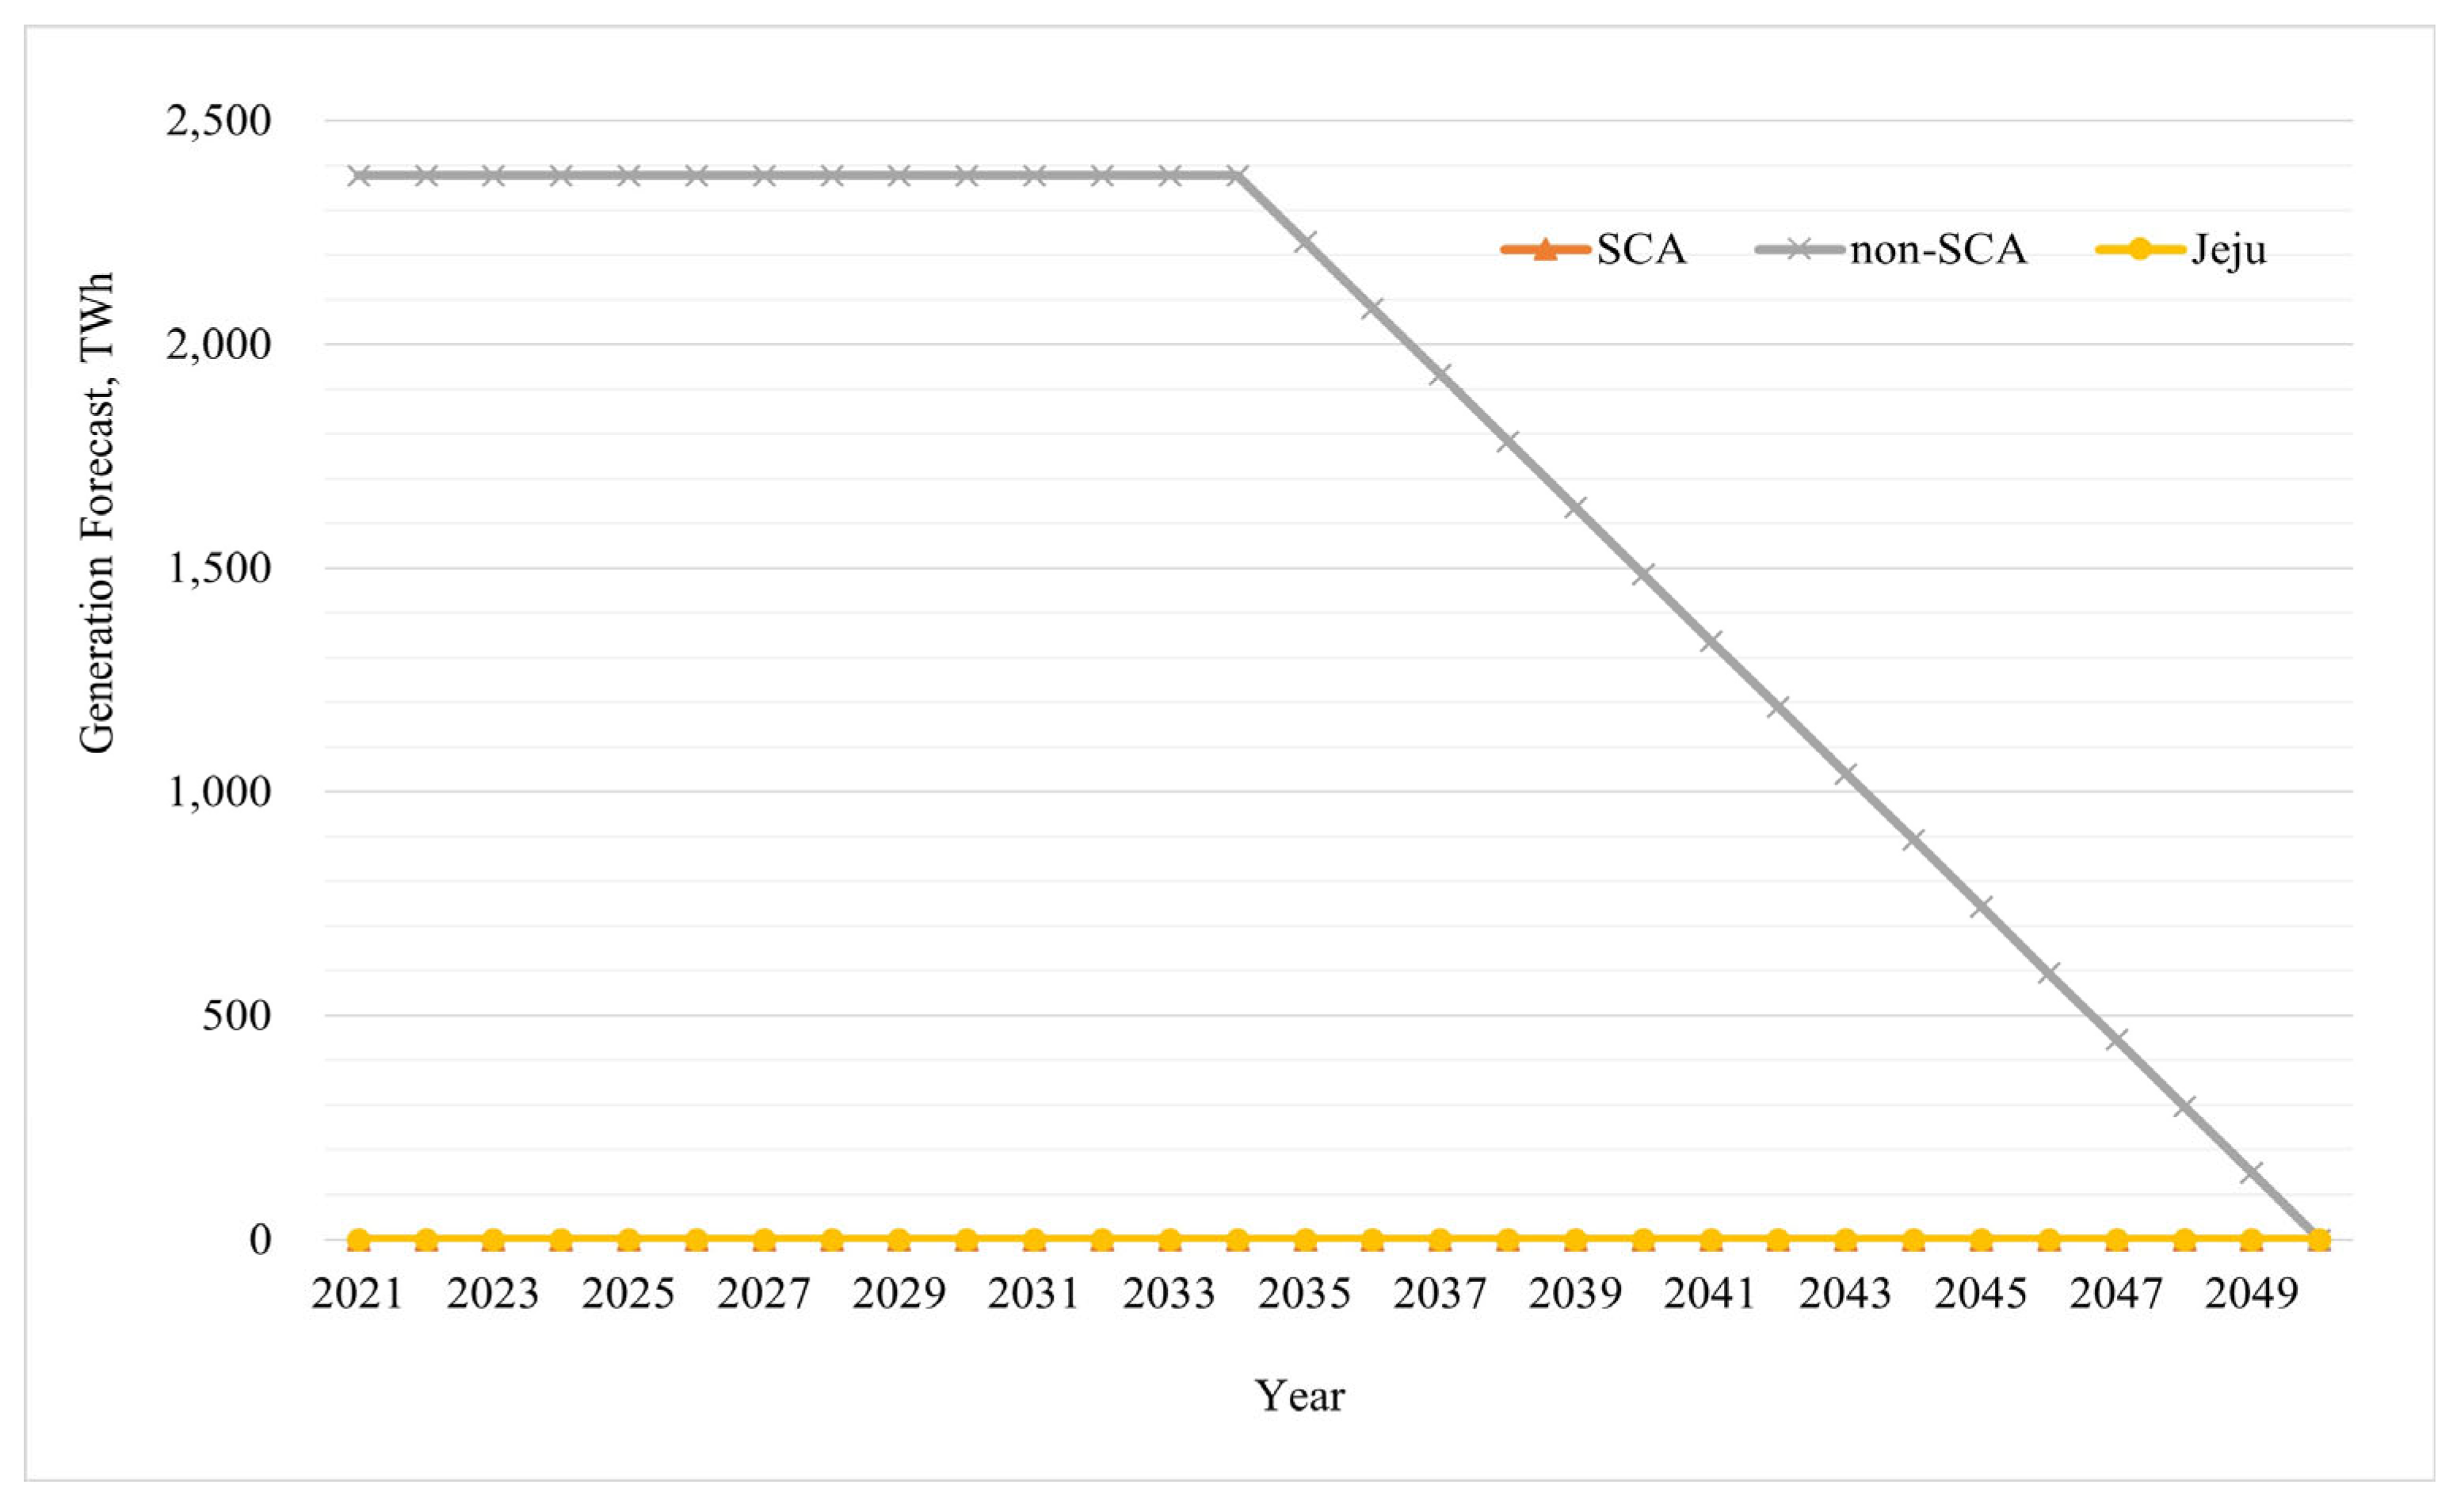
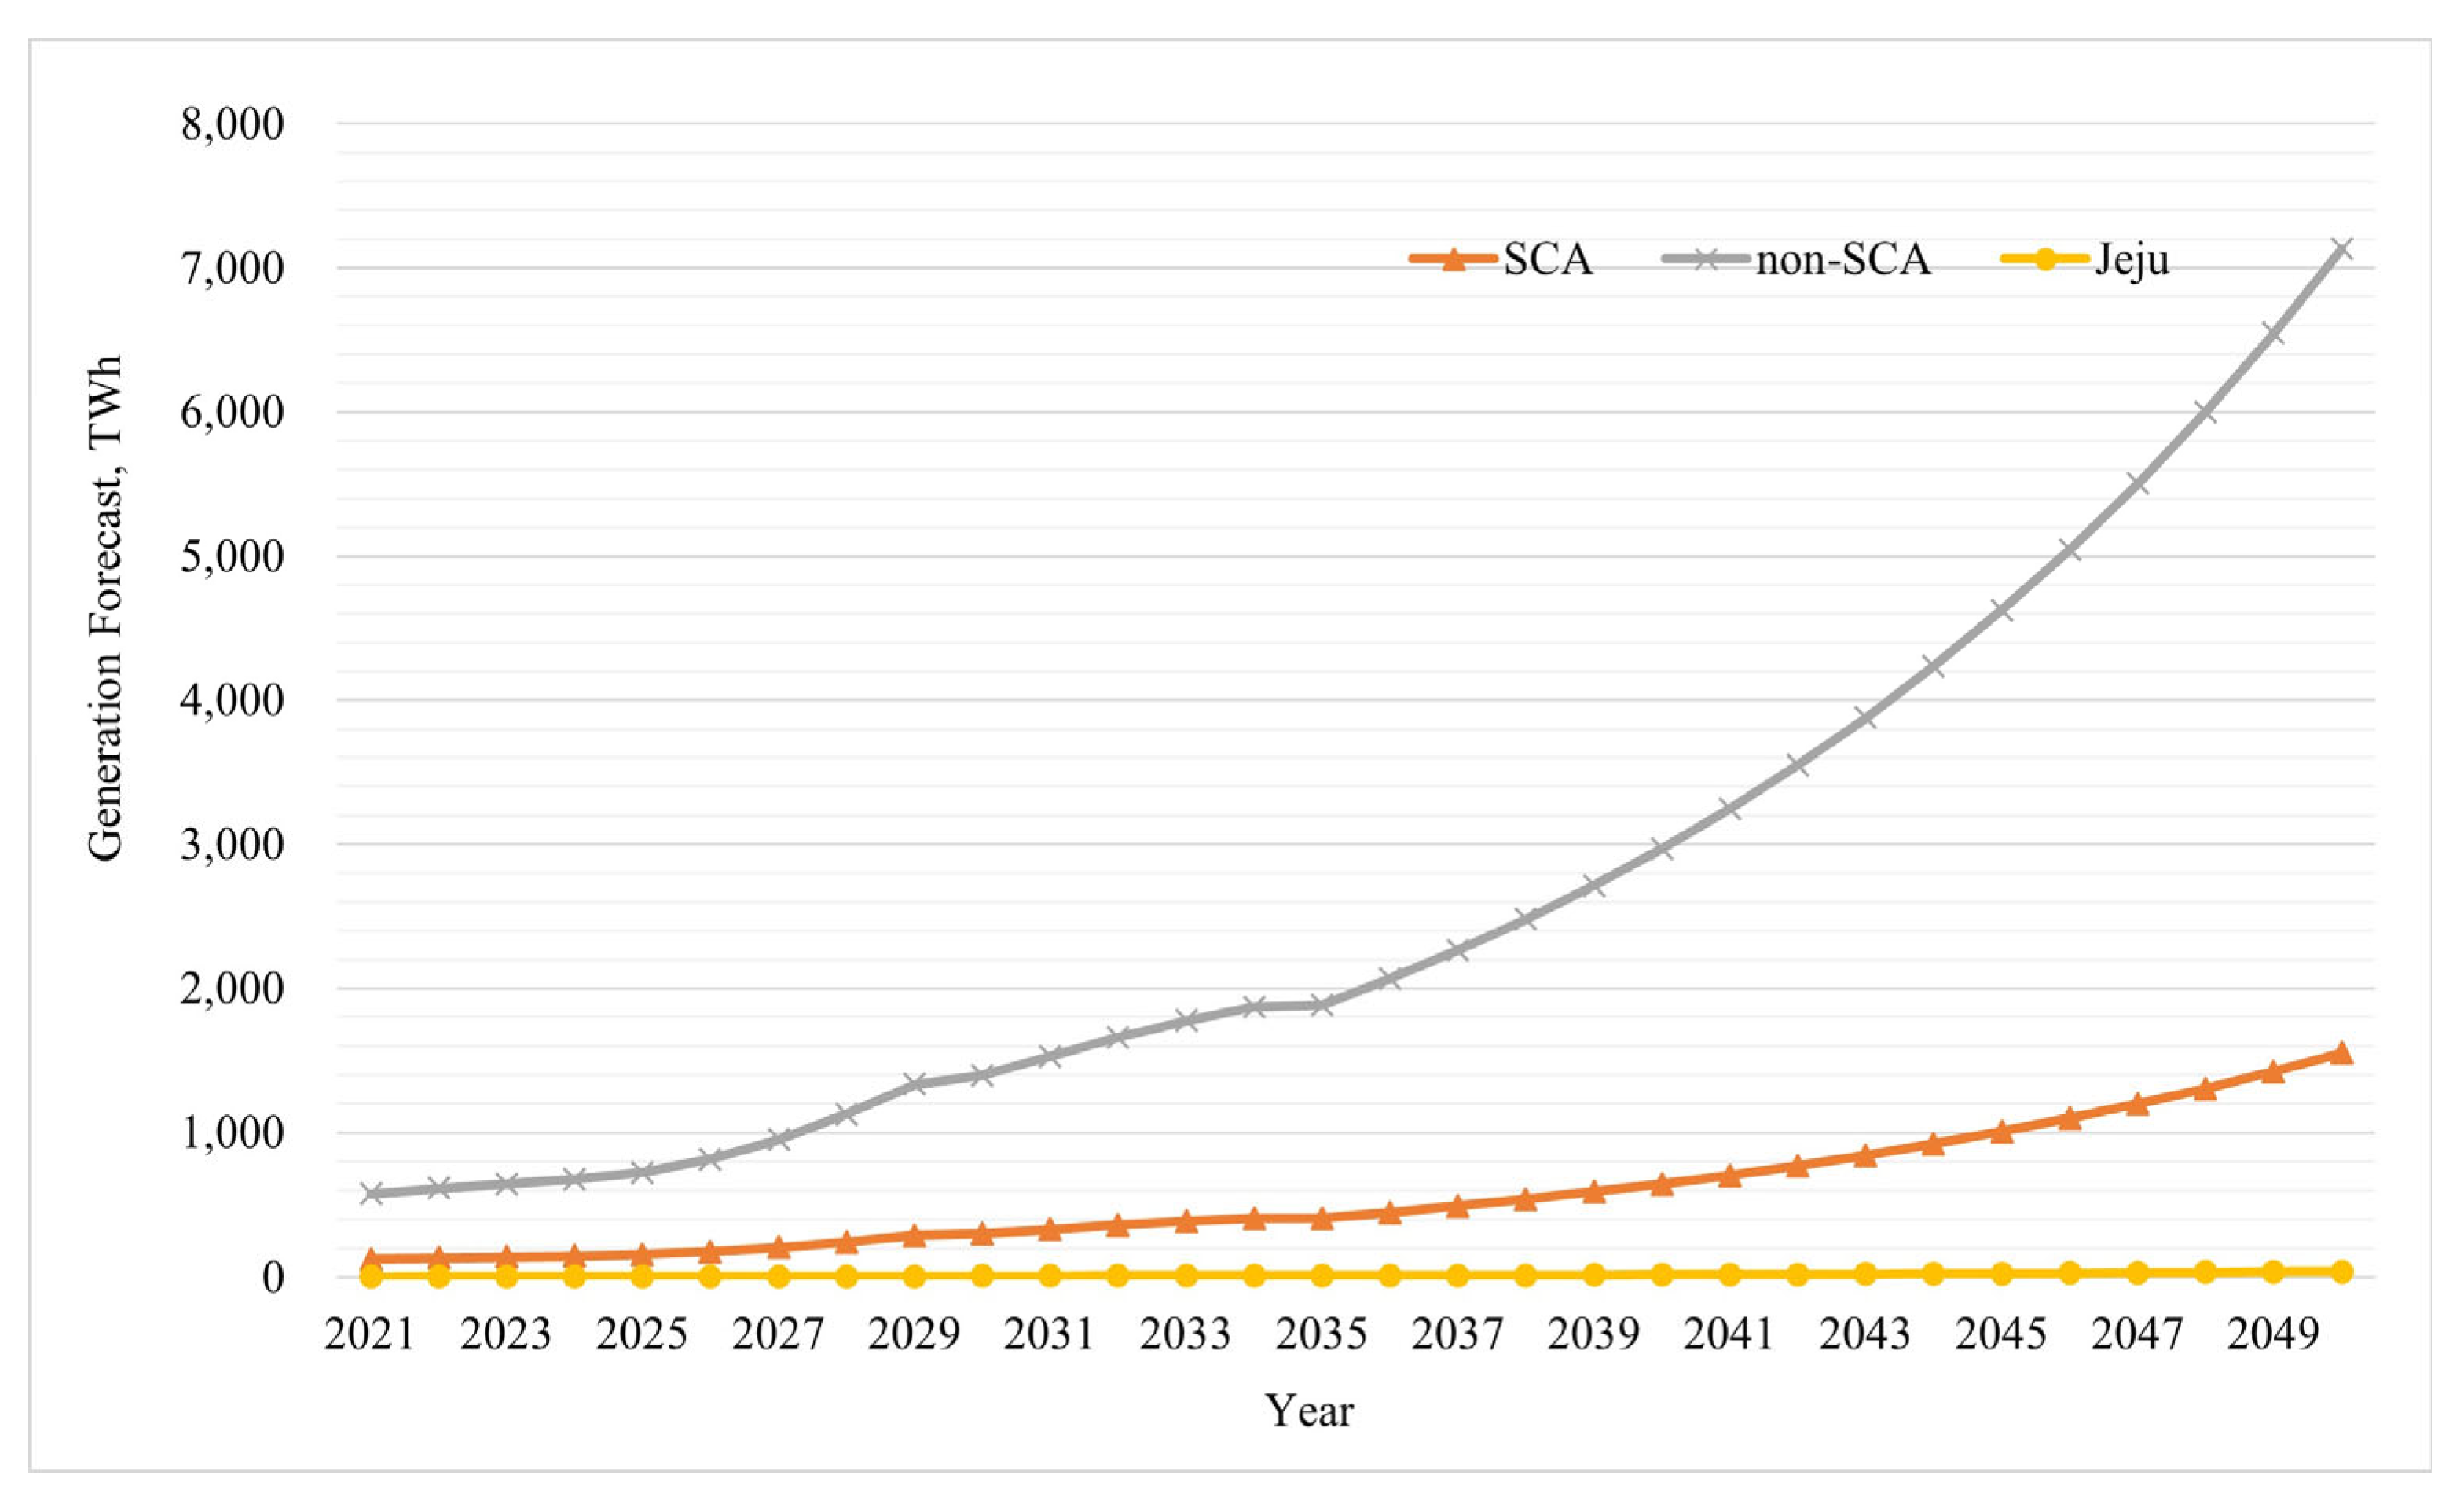
Disclaimer/Publisher’s Note: The statements, opinions and data contained in all publications are solely those of the individual author(s) and contributor(s) and not of MDPI and/or the editor(s). MDPI and/or the editor(s) disclaim responsibility for any injury to people or property resulting from any ideas, methods, instructions or products referred to in the content. |
© 2024 by the authors. Licensee MDPI, Basel, Switzerland. This article is an open access article distributed under the terms and conditions of the Creative Commons Attribution (CC BY) license (https://creativecommons.org/licenses/by/4.0/).