Article

A New Model for Predicting Permeability of Chang 7 Tight Sandstone Based on Fractal Characteristics from High-Pressure Mercury Injection

1
Hubei Key Laboratory of Petroleum Geochemistry and Environment, Yangtze University, Wuhan 430100, China
2
College of Resources and Environment, Yangtze University, Wuhan 430100, China
*
Authors to whom correspondence should be addressed.
Energies 2024, 17(4), 821; https://doi.org/10.3390/en17040821
Submission received: 20 December 2023 / Revised: 2 February 2024 / Accepted: 5 February 2024 / Published: 8 February 2024

Abstract

:
Accurately predicting permeability is important to elucidate the fluid mobility and development potential of tight reservoirs. However, for tight sandstones with the same porosity, permeability can change by nearly three orders of magnitude, which greatly increases the difficulty of permeability prediction. In this paper, we performed casting thin section, scanning electron microscopy and high-pressure mercury injection experiments to analyze the influence of pore structure parameters and fractal dimensions on the permeability of Chang 7 tight sandstones. Furthermore, the key parameters affecting the permeability were optimized, and a new permeability prediction model was established. The results show that the pore throat structure of Chang 7 tight sandstone exhibits three-stage fractal characteristics. Thus, the pore throat structure was divided into large pore throat, medium pore throat and small pore throat. The large pore throat reflects the microfracture system, whose fractal dimension was distributed above 2.99, indicating that the heterogeneity of the large pore throat was the strongest. The medium pore throat is dominated by the conventional pore throat system, and its fractal dimension ranged from 2.378 to 2.997. Small pore throats are mainly composed of the tree-shaped pore throat system, and its fractal dimension varied from 2.652 to 2.870. The medium pore throat volume and its fractal dimension were key factors affecting the permeability of Chang 7 tight sandstones. A new permeability prediction model was established based on the medium pore throat volume and its fractal dimension. Compared to other models, the prediction results of the new model are the best according to the analysis of root mean square value, average absolute percentage error and correlation coefficient. These results indicate that the permeability of tight sandstones can be accurately predicted using mesopore throat volume and fractal dimension.

1. Introduction

With the continuous reduction in conventional oil and gas reserves, unconventional resources have gradually become an important field of exploration and development [1,2,3]. Tight oil development has been successful in the United States. As of 2018, the production of tight oil reservoirs has reached nearly 60% of the total oil production in the United States [4]. In China, the total amount of tight oil resources is also quite rich and mainly distributed in the Ordos, Junggar and Songliao basins. However, due to the late start, the tight oil reservoirs in China face great challenges in terms of commercial development [5,6,7].
Tight reservoirs usually experience extreme compaction and cementation, resulting in lower porosity (mainly <10%) and matrix permeability (mainly <1 mD) [8]. For tight reservoirs, the throats are fine (mainly <1 μm) and mostly in the shape of flakes, bent flakes and tube bundles, resulting in poor pore connectivity [9,10,11]. As a result, fluid flow in tight reservoirs is irregular and nonlinear. Additionally, for tight sandstones with the same porosity and different pore structures, the permeability can span nearly two to three orders of magnitude [12,13], which greatly increases the difficulty of quantitatively evaluating permeability. However, quantitative evaluation of permeability is crucial to understanding fluid mobility and evaluating reservoir quality [14].
Permeability is a macroscopic description of rock pore structure and directly affects oil and gas productivity. Permeability can be measured directly in a laboratory based on steady-state methods and unsteady-state methods [15]. For tight reservoirs, these methods are time consuming or expensive. Therefore, statistical methods are often used to evaluate permeability based on the relationship between permeability and porosity [16,17,18]. Hui et al. (2023) established the relationship between permeability and porosity of shale [17]. However, the relationship between permeability and porosity is usually poor for tight reservoirs with complex pore structures. Pore structure is the key parameter controlling the permeability of tight reservoirs [19]. Thus, the permeability prediction model can be established based on pore structure parameters. At present, a variety of testing methods have been widely used to study reservoir pore structure, including low-temperature nitrogen adsorption, high-pressure mercury injection (HPMI), nuclear magnetic resonance (NMR), scanning electron microscope (SEM) and CT [20,21,22,23].
Early permeability prediction models can be divided into three categories: (1) based on HPMI data, (2) based on NMR data and (3) based on fractal theory (Table 1). Purcell (1949) first established a permeability prediction equation using HPMI data [24]. Subsequently, Swanson (1981) utilized the Swanson parameter (the maximum value of SHg/Pc) to develop a permeability prediction model [25]. Based on Swanson’s work, Pittman (1992) established the relationship between permeability, porosity and rapex (the pore throat radius corresponding to the maximum value of SHg/Pc) [26]. Based on the derivation of the Thomeer model (1983), Guo et al. [27] constructed a parameter (i.e., SHg/Pc2) to describe the pore structure of rock and established a permeability prediction model. Winland introduced a relationship between permeability, porosity and pore throat radius at a mercury injection saturation of 35% [28]. Similarly, Rezaee et al. [8] derived the R10 model for tight gas sandstone.
Compared with HPMI technology, NMR technology can quantitatively characterize free fluid and bound fluid in tight reservoirs. Coates et al. [9] found that the permeability of sandstone is controlled by the volume ratio of movable fluid to bound fluid (FFI/BVI) and proposed the Coates model. The SDR model is a permeability calculation model based on the geometric mean of T2 (T2gm) [29]. Different scholars have established various improvement models for different regions based on the Coates model or SDR model. These NMR permeability models tend to be less effective in tight sandstones than in conventional sandstones.
These models essentially predict permeability based on a certain characteristic pore throat radius combined with porosity but ignore the heterogeneity of the pore structure. Therefore, the application of these methods in tight reservoirs is limited. The fractal theory proposed by Mandelbrot [30] has been widely used to characterize the heterogeneity of porous media [31,32]. Within a certain range of pore sizes, the pore space of tight sandstone is self-similar; that is, there is ‘scale invariance’. Pape et al. [33] first used porosity and fractal dimensions to predict permeability. However, permeability prediction models established by fractal characteristics remain rare.
In this paper, we selected Chang 7 tight sandstones from the Longdong area in the Ordos Basin to analyze the influence of pore structure parameters and fractal dimensions on permeability by integrating casting thin section (CTS), SEM and HPMI experiments. On this basis, a new permeability prediction model was established based on the medium pore throat volume and its fractal dimension. Furthermore, we compared the prediction results of the new model with those of earlier models based on mean absolute percentage error (MAPE), root mean square error (RMSE) and correlation coefficient (R2) analyses. Finally, we further discuss the advantages of the new model in predicting permeability.

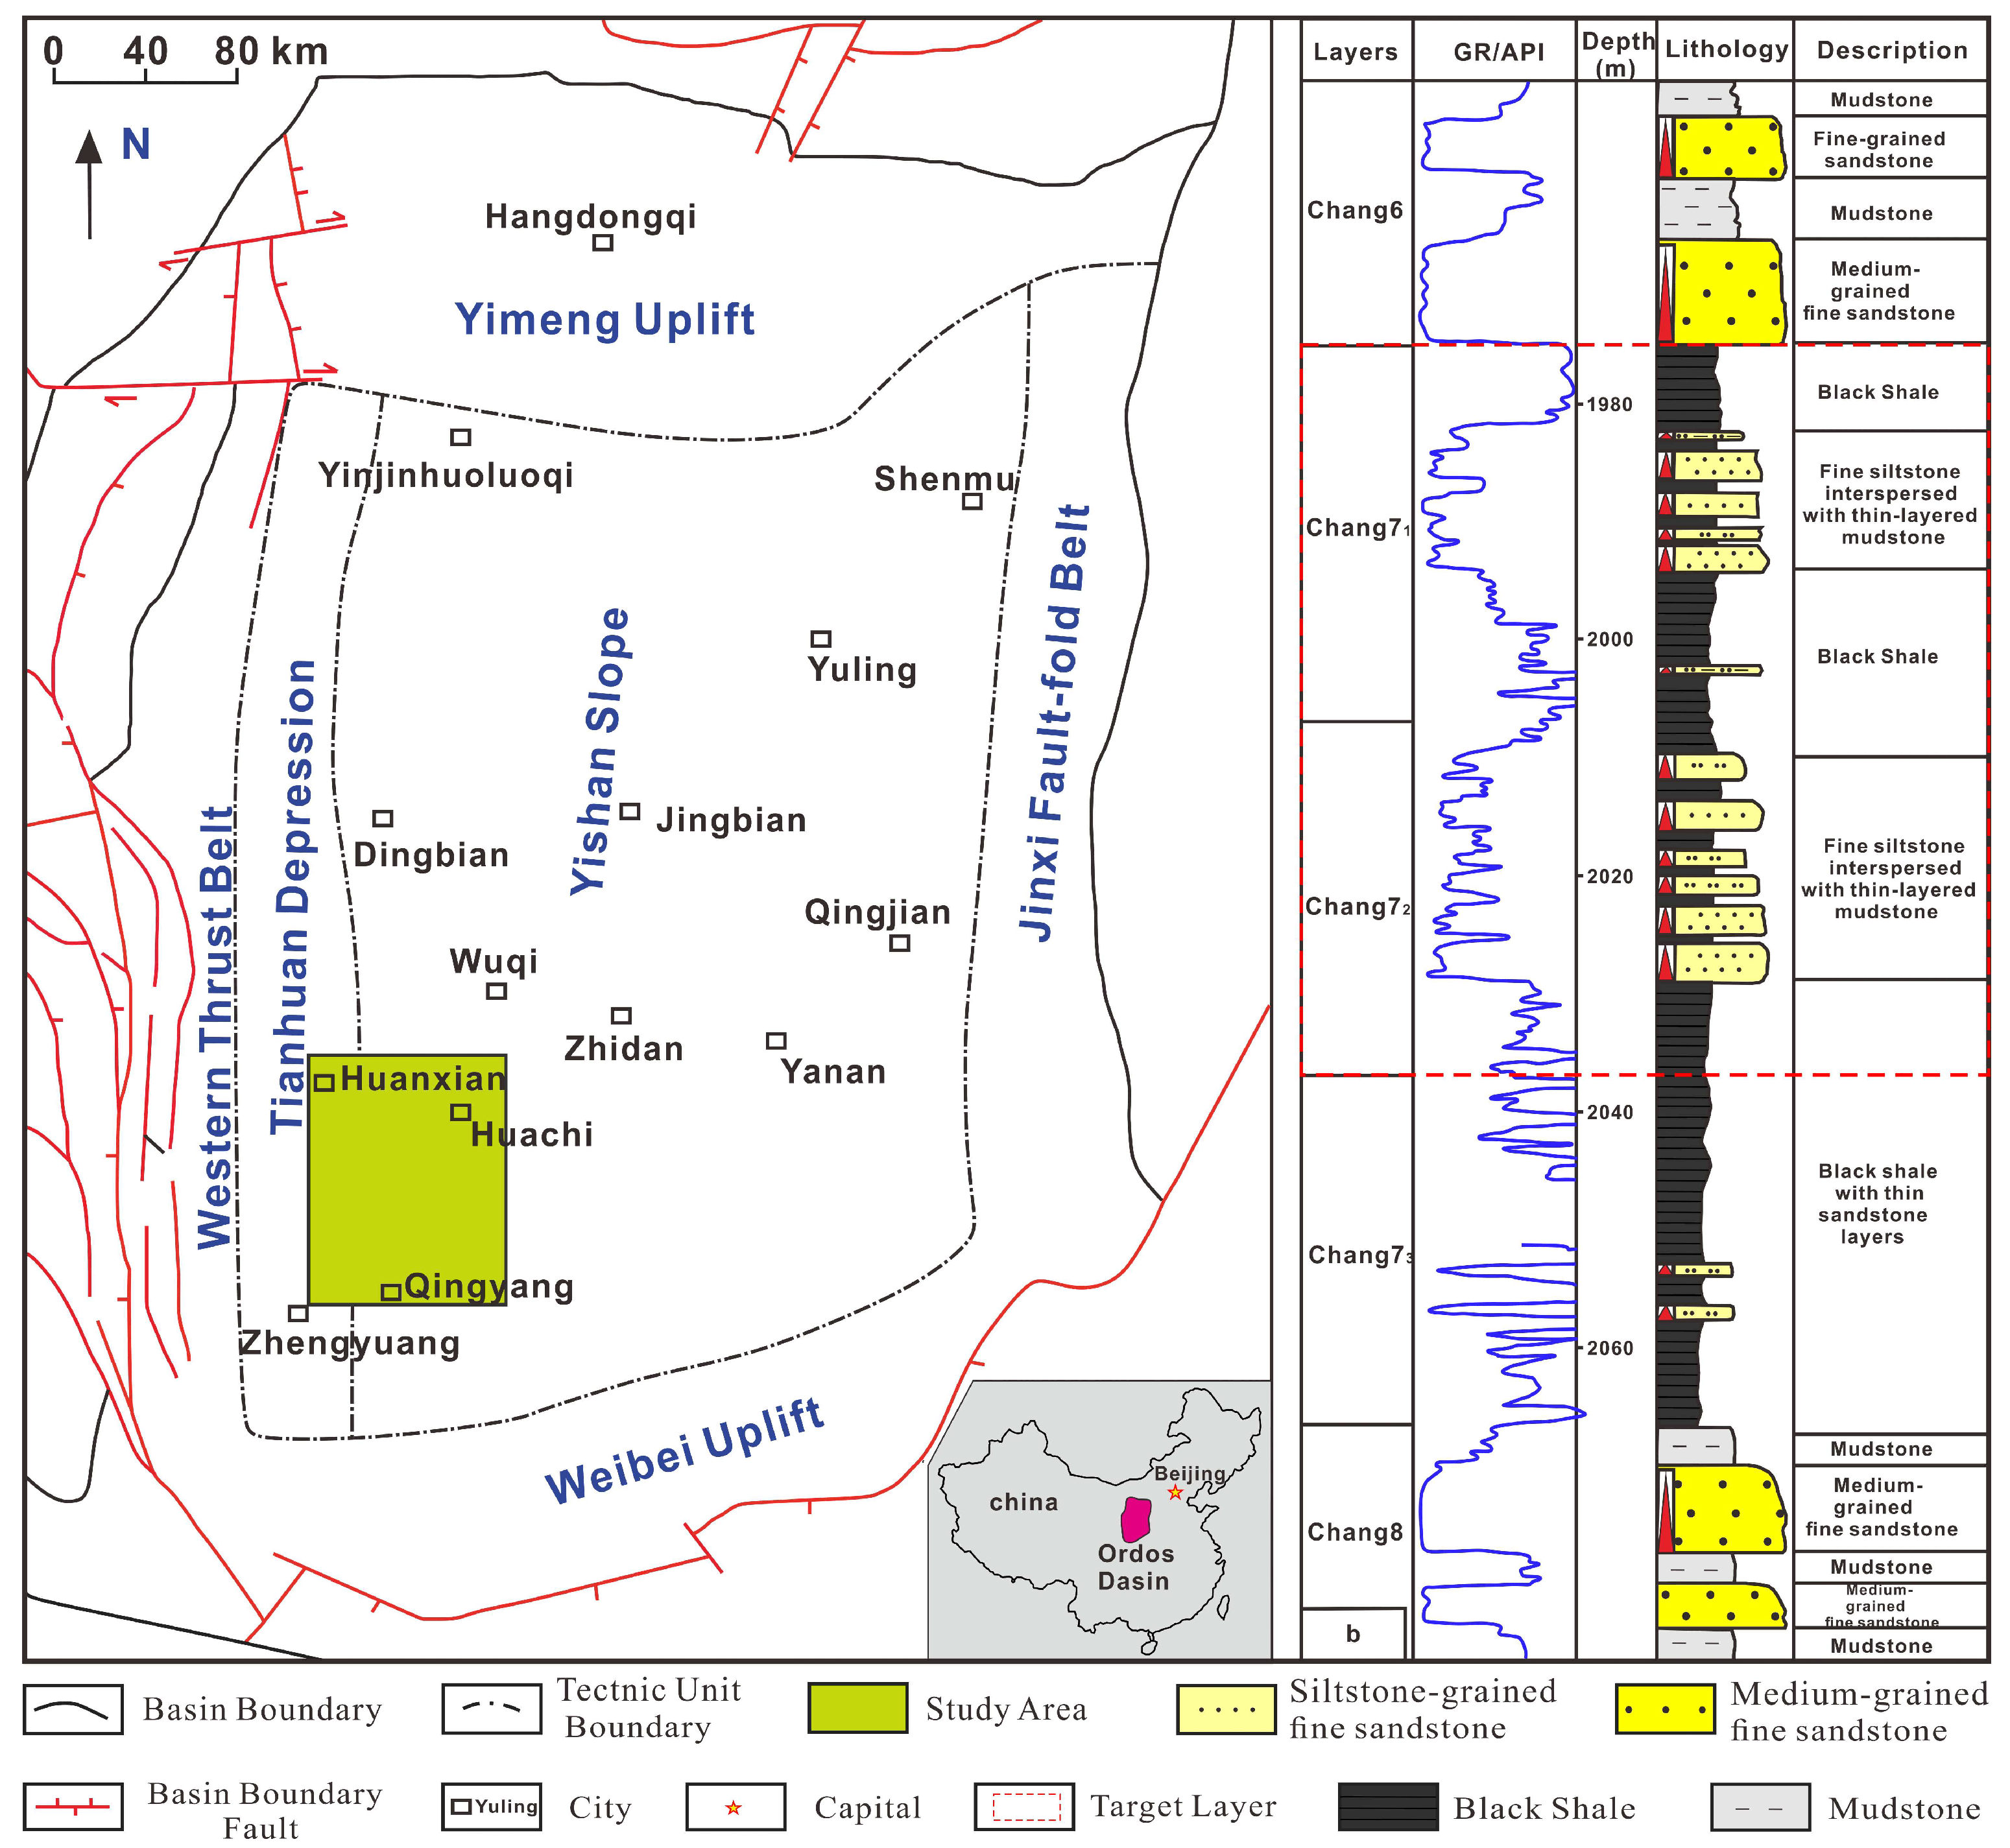
2. Geological Background

The Ordos Basin is located in the western North China block, which is a multicycle superimposed petroliferous basin with stable subsidence and depression migration (Figure 1). The Chang 7 oil layers were formed in the period of the most intense expansion of the lake basin. The lithology is mainly composed of dark mudstone and black shale, with thin layers of fine sandstone and siltstone [34,35]. The Chang 7 oil layers can be subdivided into three subsections: Chang 71 subsection, Chang 72 subsection and Chang 73 subsection. The selected tight sandstone samples are from the Chang 71-2 subsections and are gravity flow deposits of semi-deep lake to deep lake facies. The Chang 73 subsection mainly deposits organic-rich black shale and dark mudstone, which is a high-quality source rock section.
The lithology of Chang 7 tight sandstone is dominated by lithic arkose and feldspathic litharenite. The debris is mainly quartz, followed by feldspar and rock fragments. The rock debris is mainly composed of dolomite and phyllite. The matrix is mainly composed of hydromica (average 11.7 vol%). A large amount of carbonate cement (up to 30 vol%) can be observed in some samples.

3. Results

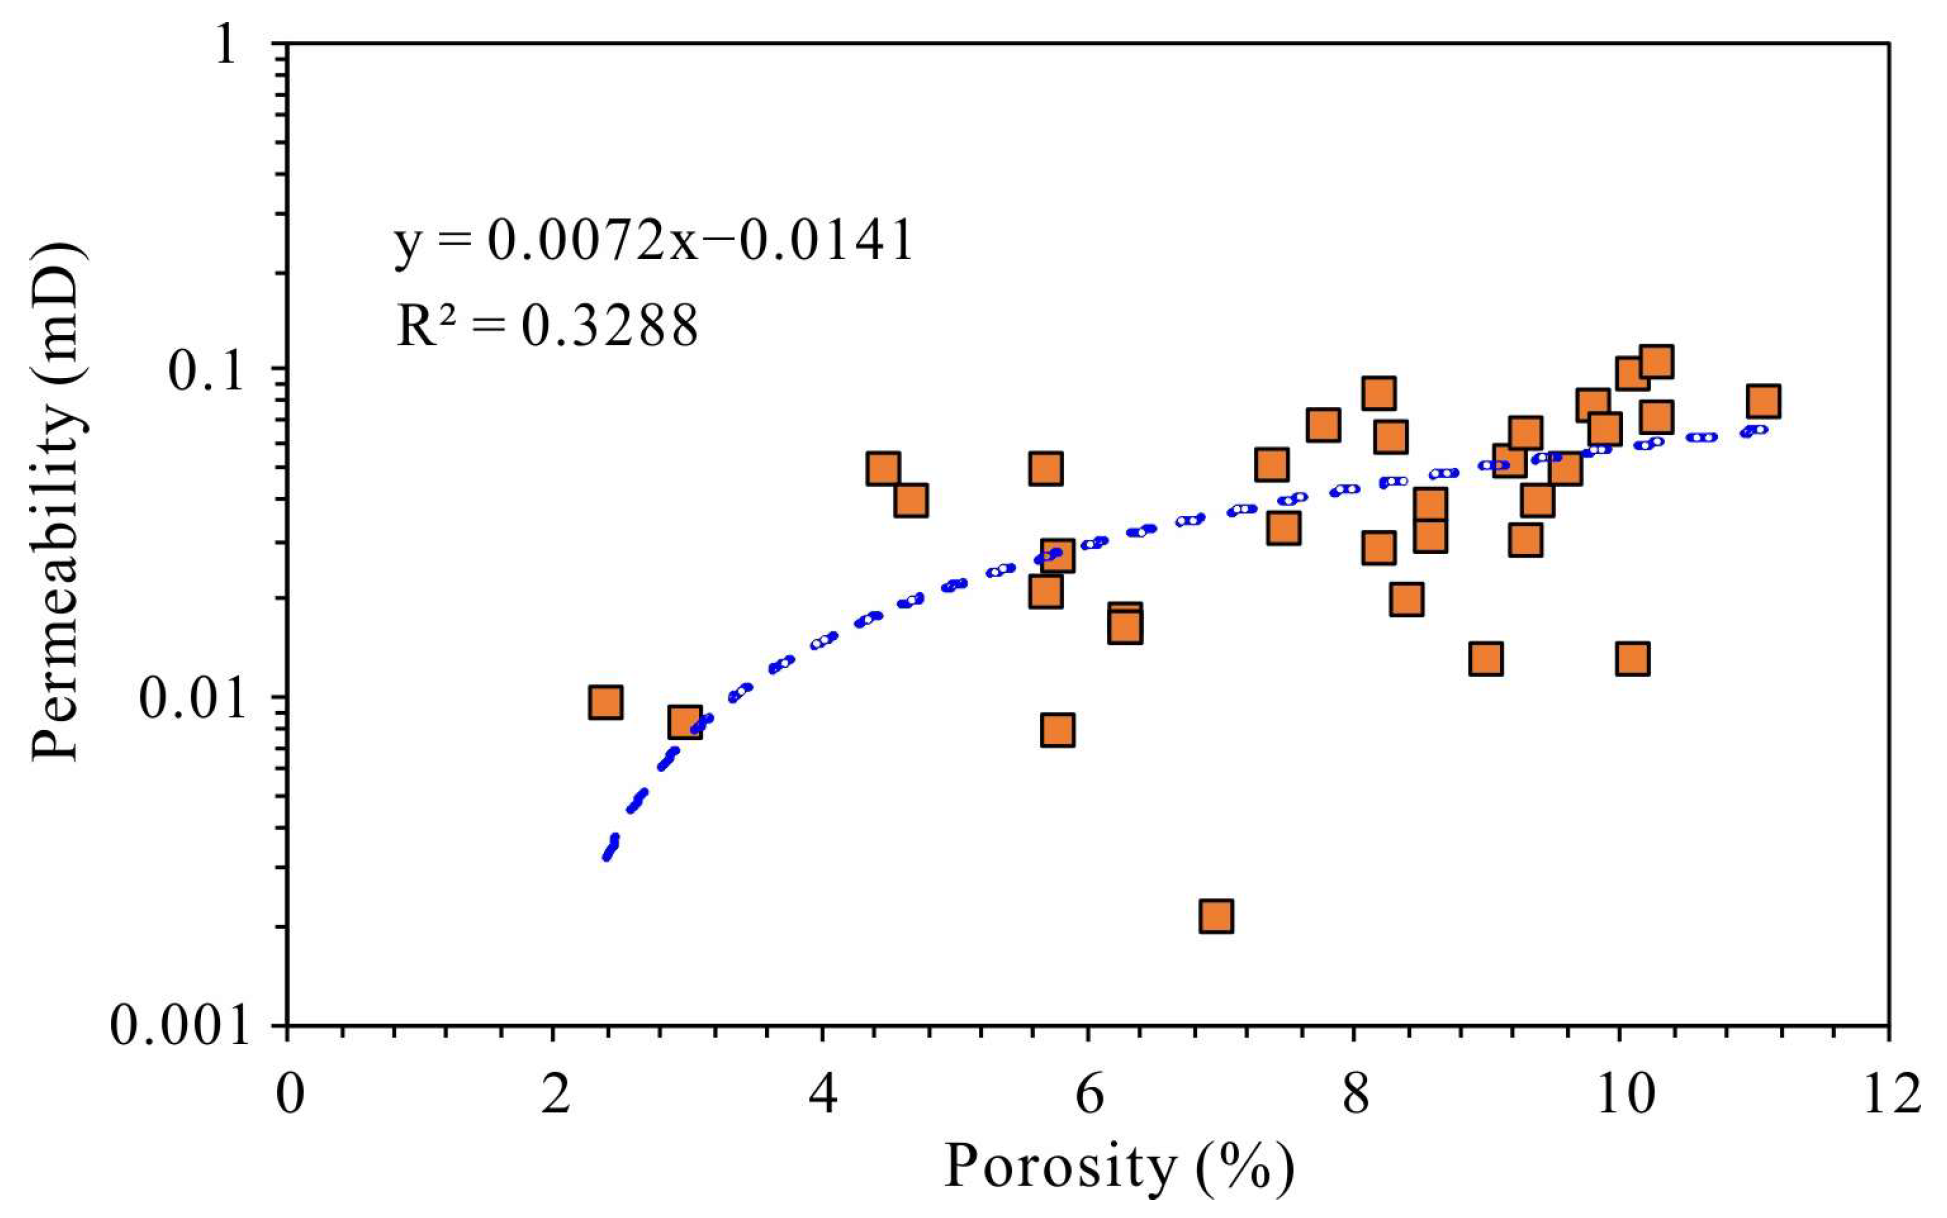
3.1. Physical Properties
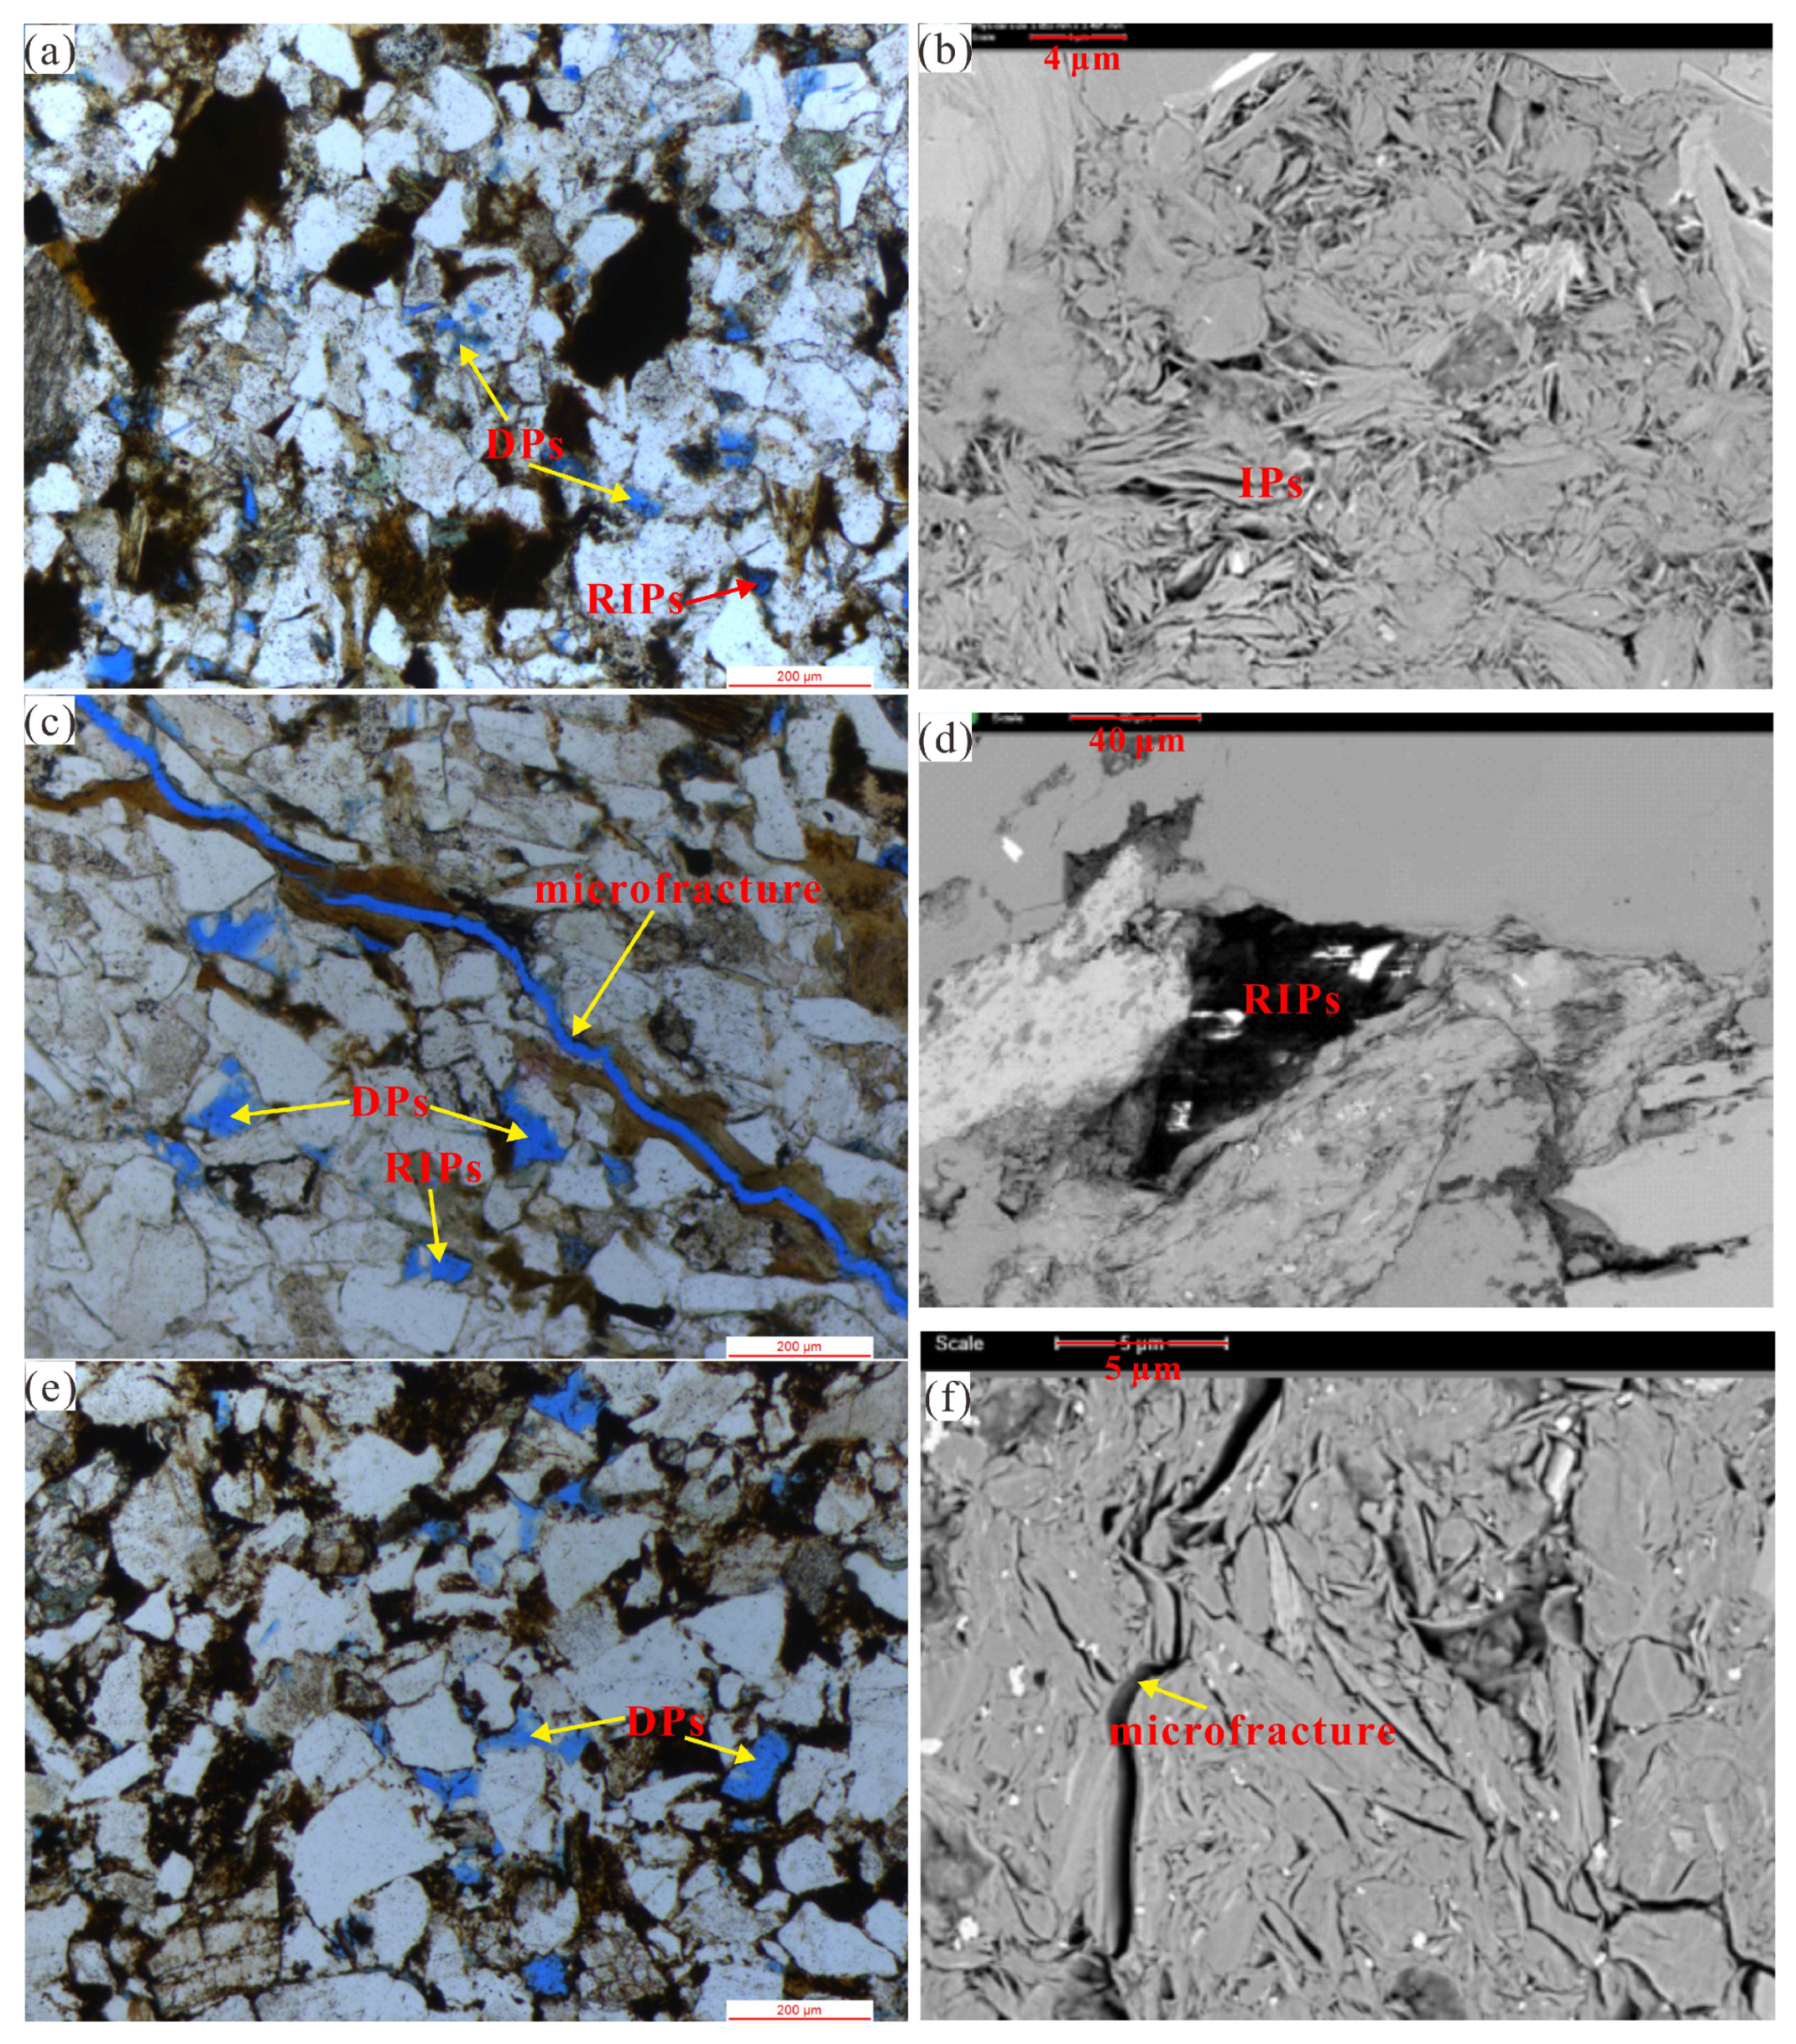
A total of 34 core samples from Chang 7 member were analyzed for porosity and permeability. The porosity of the selected samples in the study area was between 2.4% and 11.1%, with a mean of 7.7%. The permeability ranged between 0.0021 mD and 0.104 mD, with a mean of 0.0418 mD. Thus, Chang 7 tight sandstone belongs to a low-porosity and ultra-low-permeability reservoir. The relationship between permeability and porosity is poor. The permeability with a similar porosity spans two orders of magnitude (Figure 2), indicating that Chang 7 tight sandstone has strong heterogeneity.

3.2. Pore Types

The observations of CTS and SEM of Chang 7 tight sandstones show that the pore types are diverse but not well developed, mainly including dissolution pores (DPs), residual intergranular pores (RIPs), intercrystalline pores (IPs) and a small amount of microfractures. RIPs are usually triangular or polygonal with smooth and straight edges (Figure 3a,c,d). Due to strong compaction and cementation, RIPs only develop in samples with better particle sorting and higher rigid particle content [37]. DPs are the most important pore space in Chang 7 tight sandstones. Dissolution pores in the study area are mainly formed by the partial or complete dissolution of feldspar and rock fragment. DPs have better connectivity and larger pore sizes, mainly distributed between 1 μm and 100 μm (Figure 3a,c,e). IPs are mainly formed between authigenic clay mineral, and their pore diameters are mainly below 300 nm (Figure 3b). There are also a small number of micro-fractures developed in the study area, and the widths are mostly greater than 0.5 μm. (Figure 3c,f).

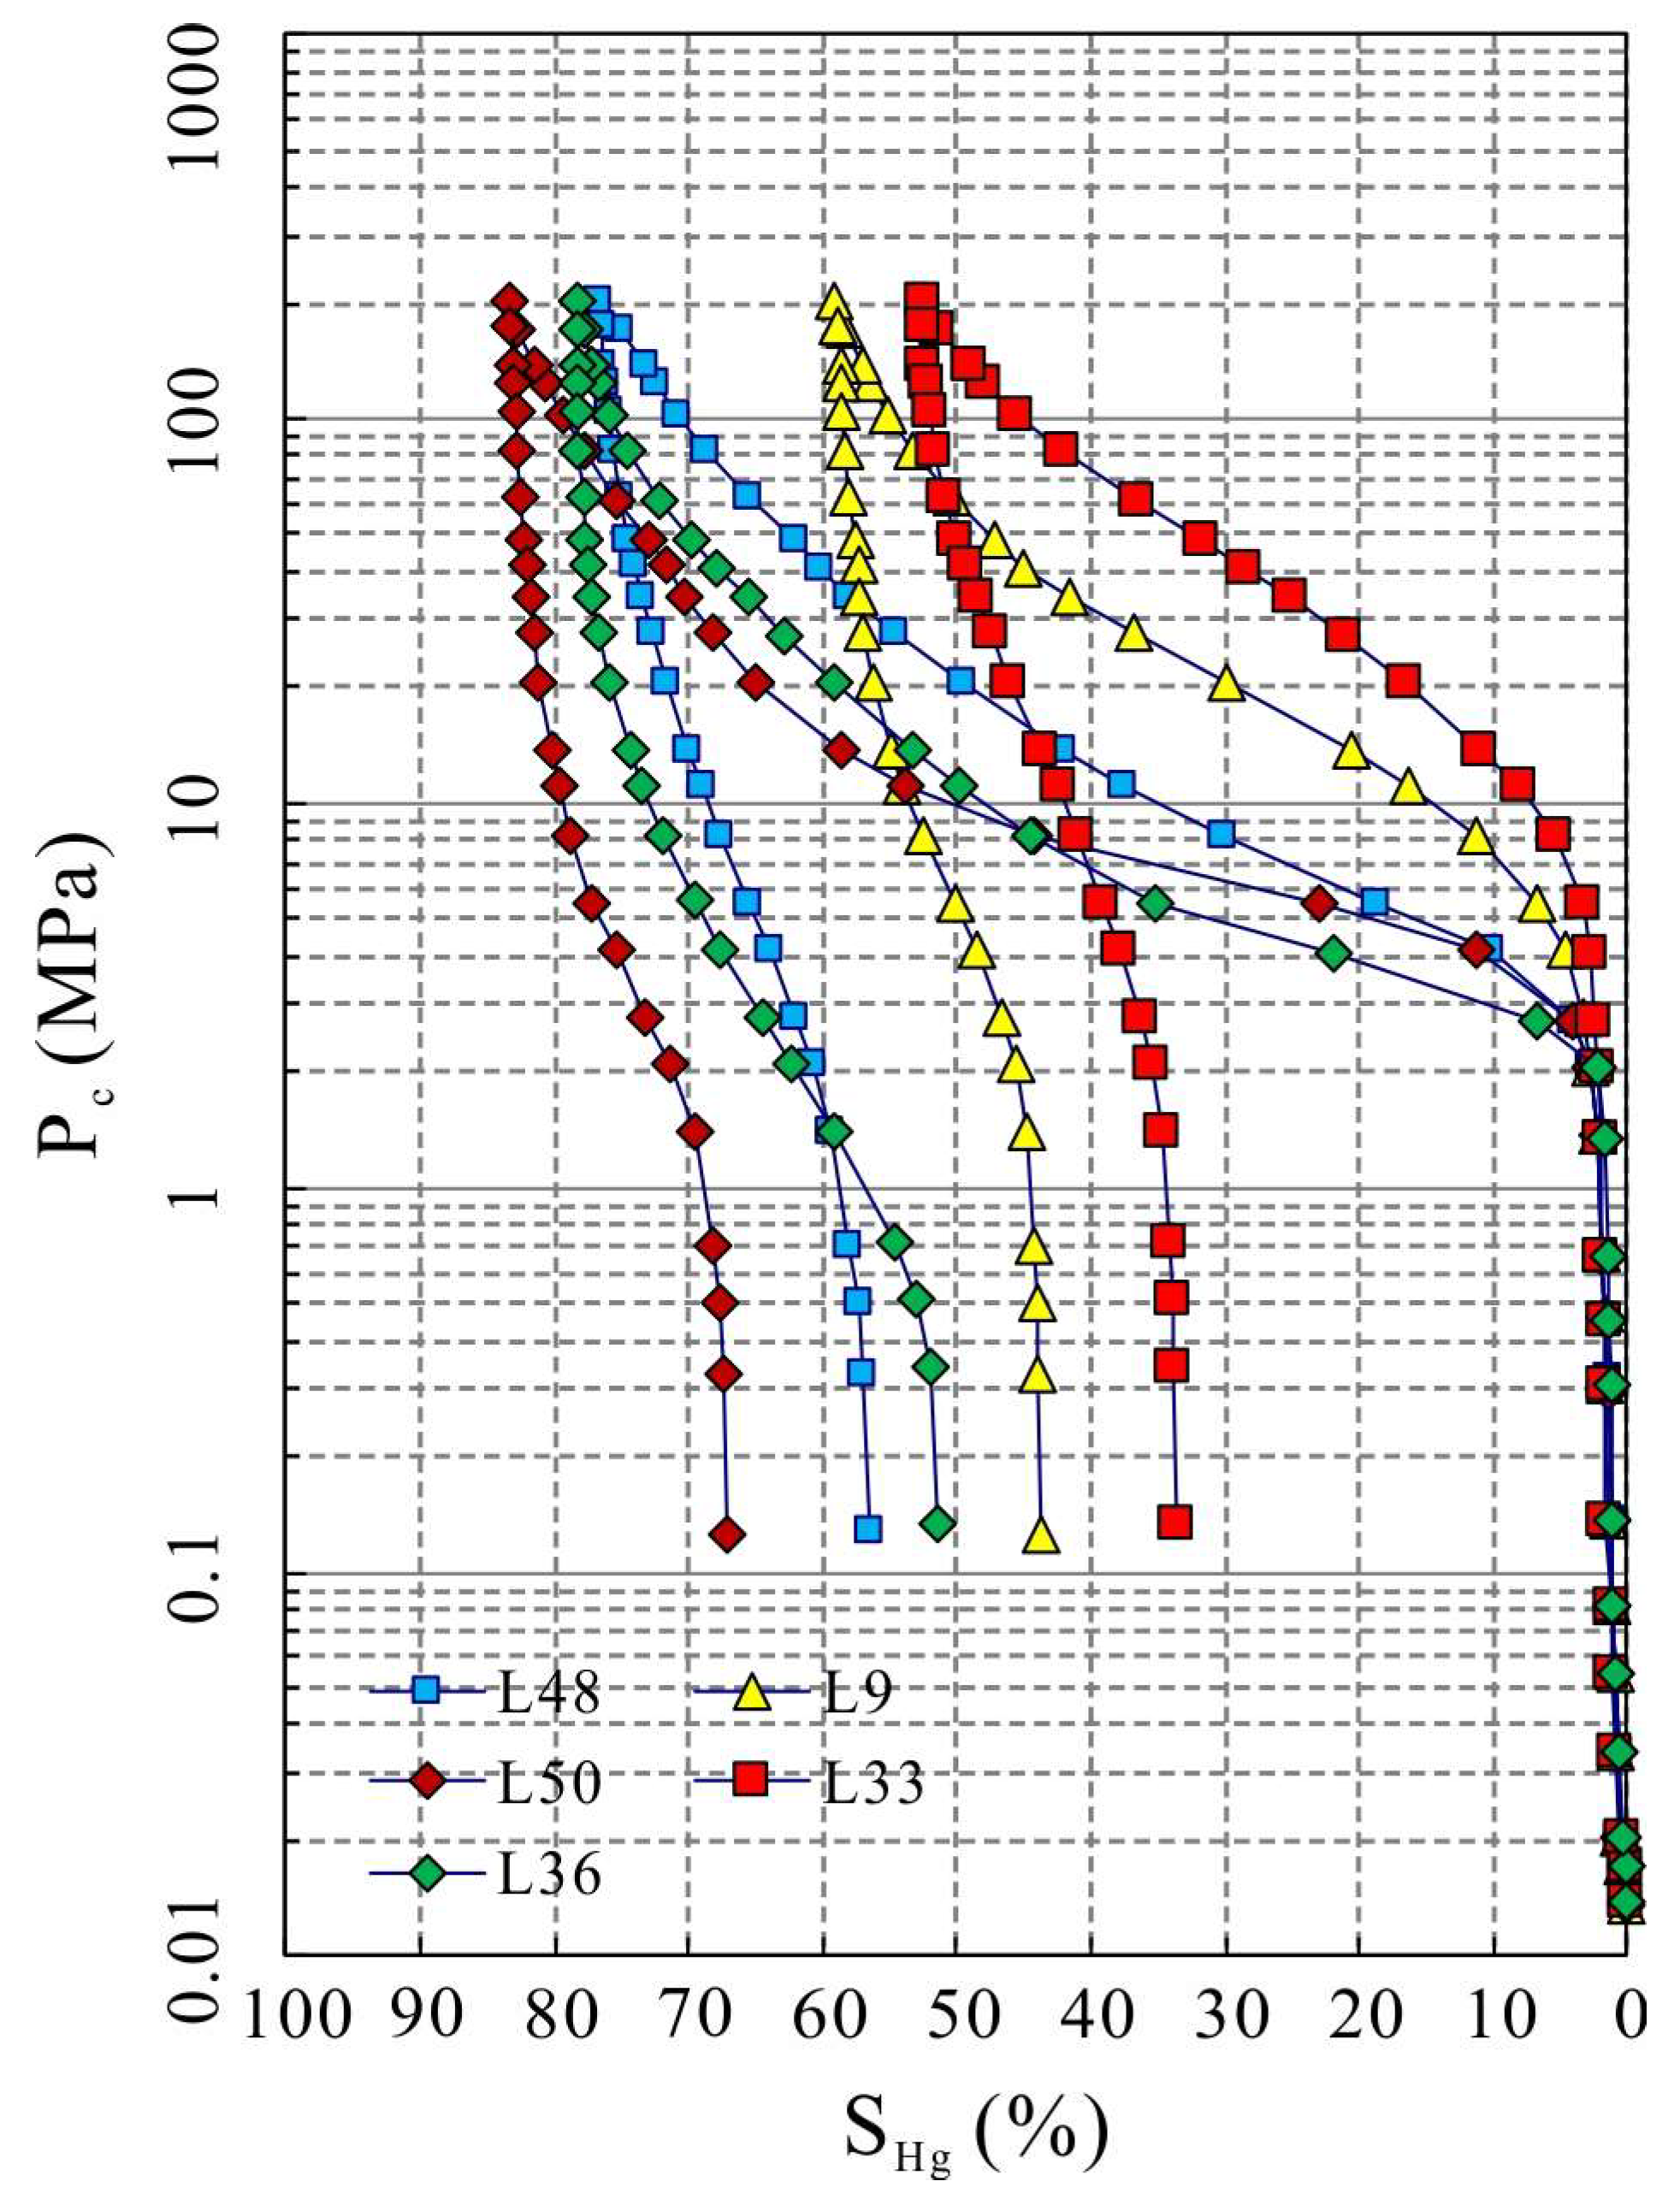
3.3. High-Pressure Mercury Injection Experiment

HPMI experiments were performed on 22 samples using an Auto-pore IV 9500 mercury porosimeter. The interfacial tension was 480 × 10−3 N/m and the contact angle of mercury was 140°. The maximum mercury injection pressure was about 200 MPa, and the corresponding pore throat radius was about 3.7 nm. The mercury intrusion curve can be generally divided into three parts: initial rising section, middle plateau section and end upwarping section. According to the shape of the mercury intrusion curve, the distribution and connectivity characteristics of the sample pore throats can be judged. The maximum mercury saturation of Chang 7 tight sandstones was in the range of 33.22%~84.35%, with a mean of 64.71%. The displacement pressure varied from 0.67 MPa to 27.54 MPa, with a mean of 5.54 MPa. As the physical properties of the sample gradually deteriorated, the maximum mercury saturation decreased but the displacement pressure increased (Figure 4). In addition, the mercury withdrawal efficiency was mostly less than 40%, and the average pore throat radius ranged from 0.008 μm to 0.163 μm, showing that Chang 7 tight sandstone has fine pore throats and poor connectivity.
As shown in Figure 5, the permeability shows a good positive correlation with the maximum pore throat radius, average pore throat radius and median pore throat radius, with R2 of 0.4251, 0.6110 and 0.6021, respectively. In addition, permeability and the sorting coefficient show a weak positive correlation, with an R2 of 0.1663. These results indicate that the pore throat size plays an important role in controlling permeability.

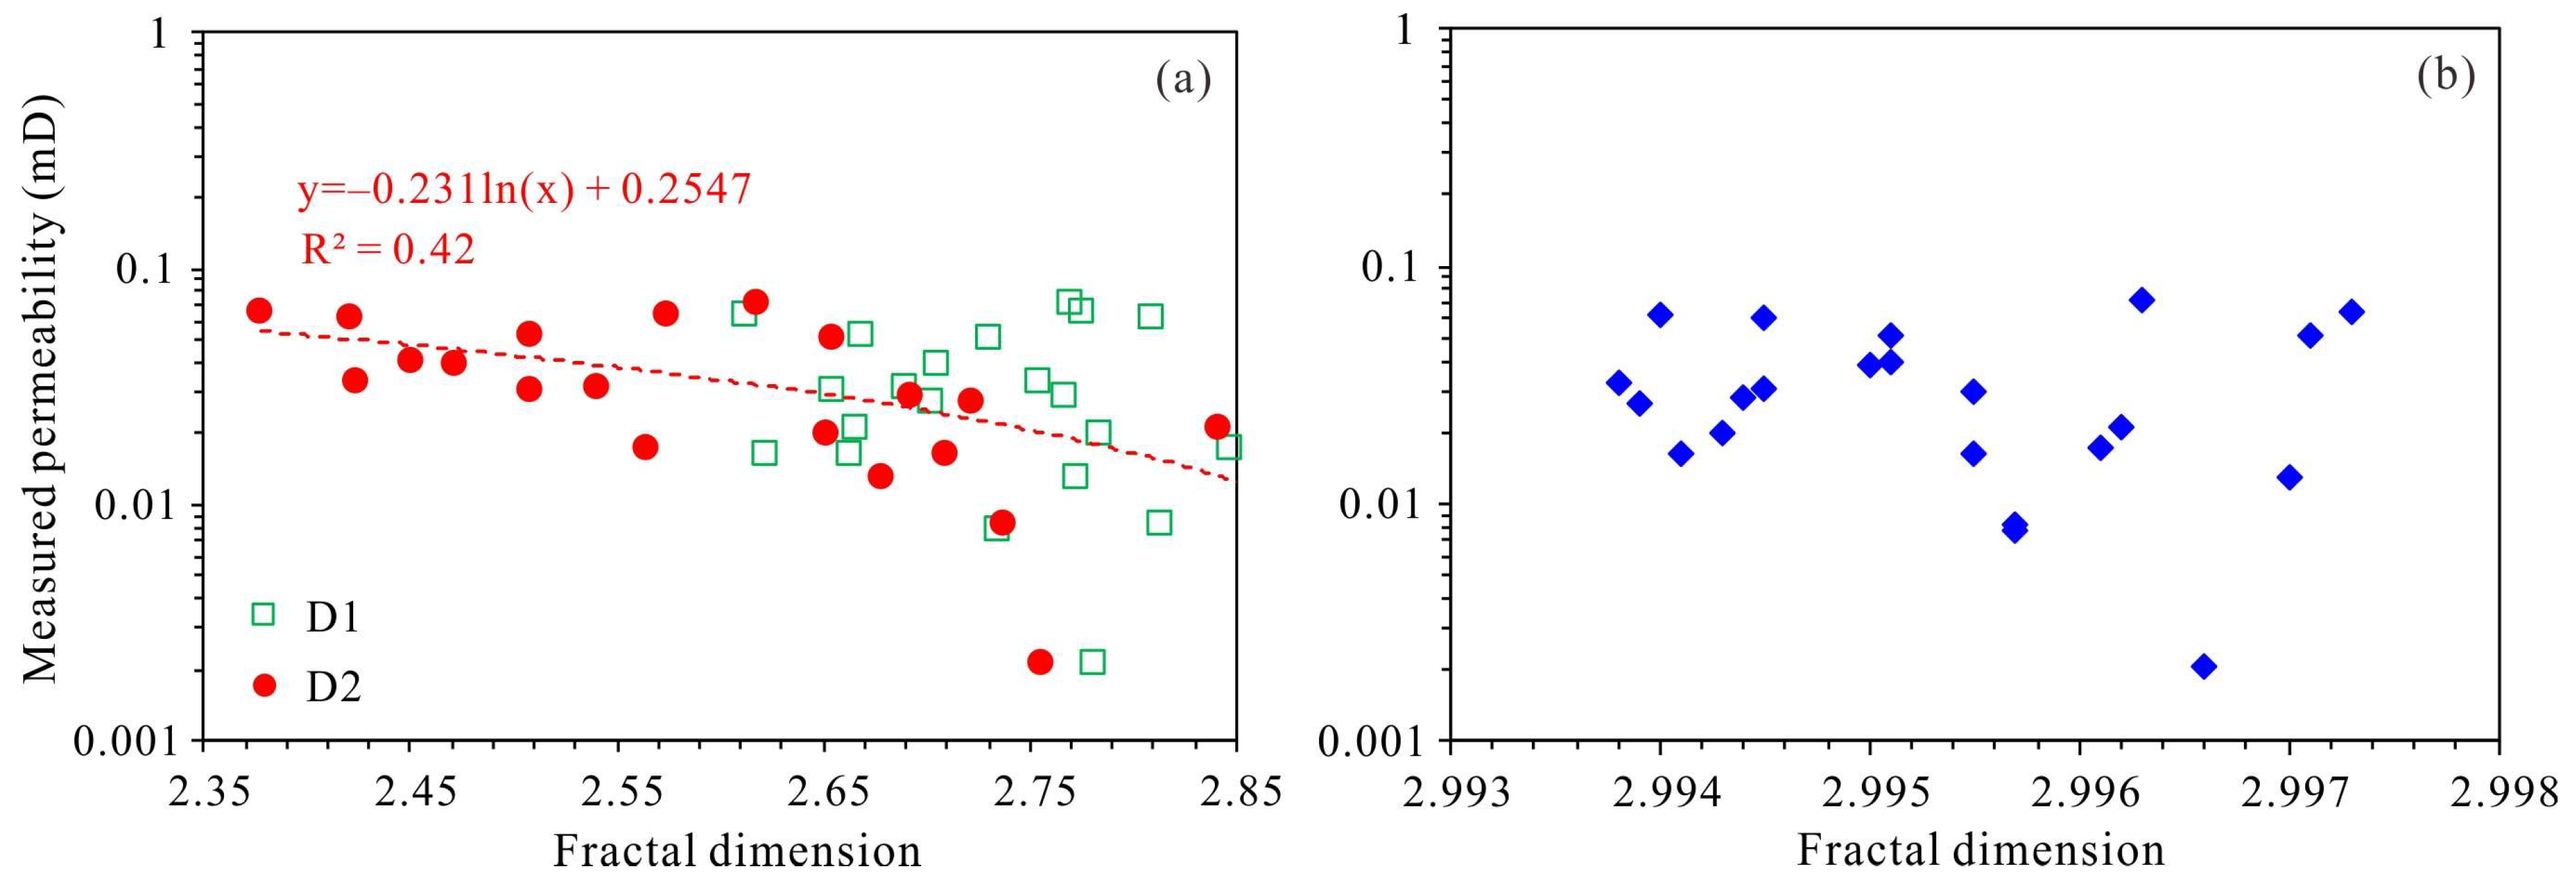
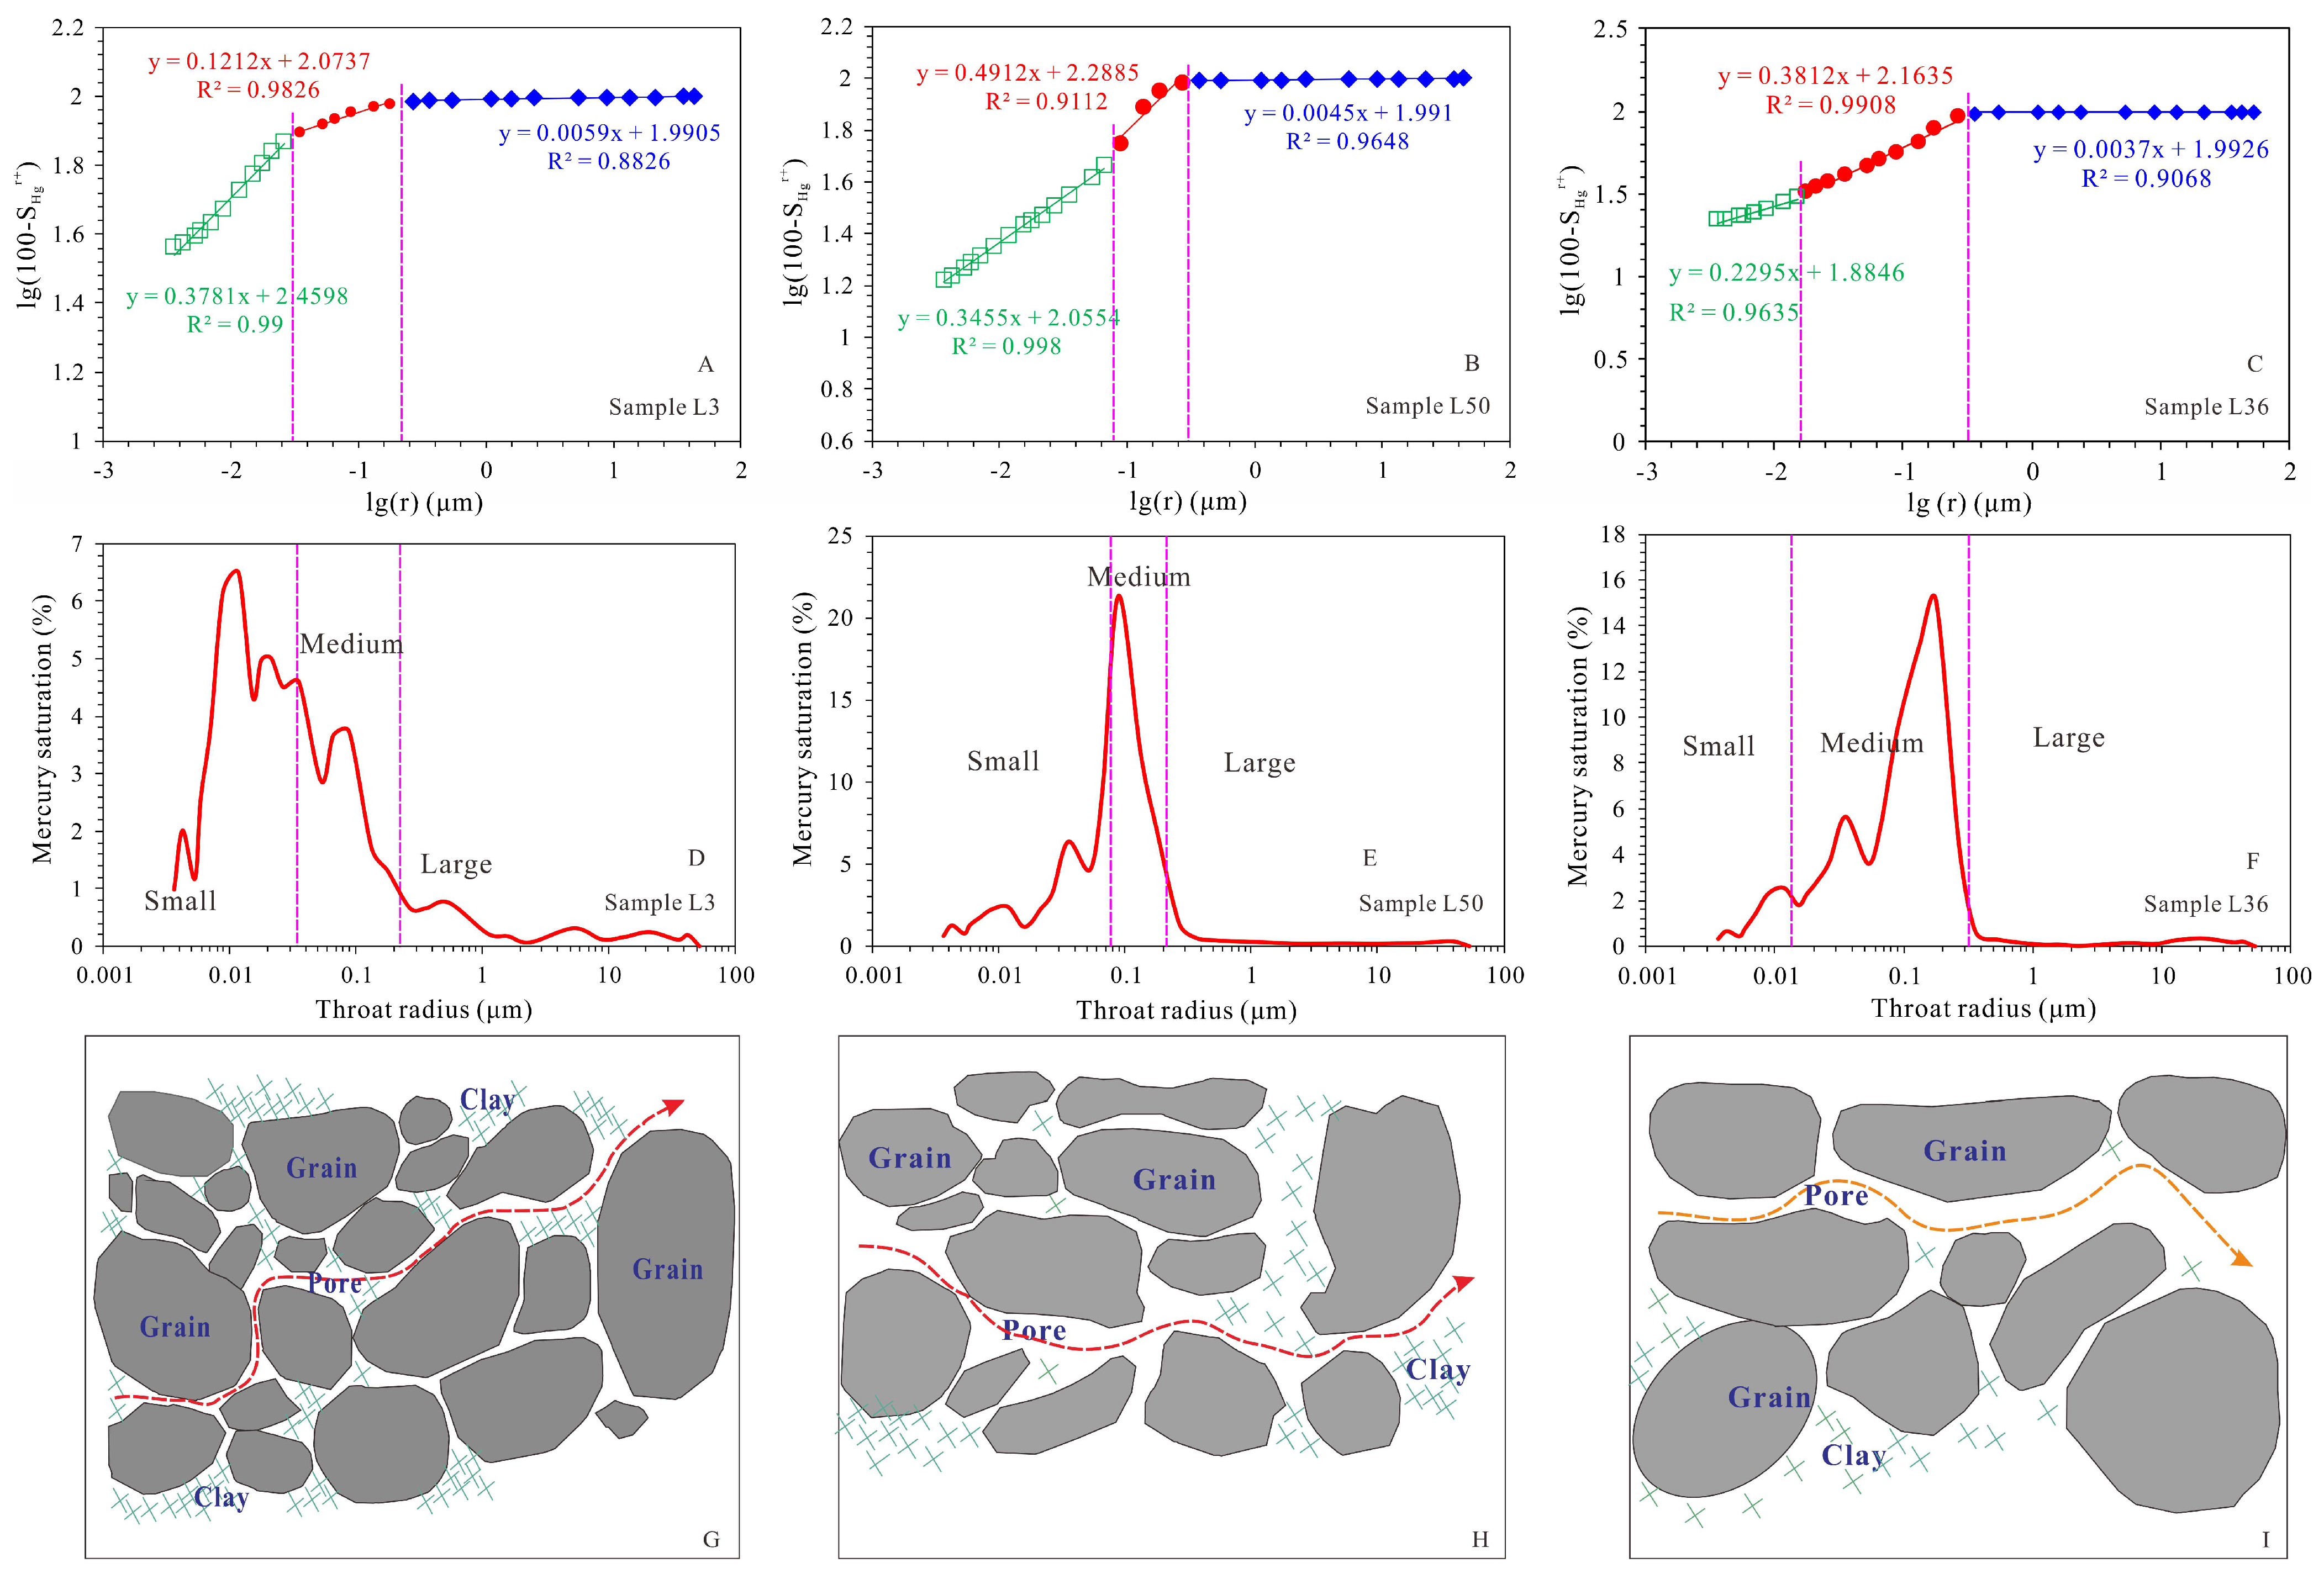
3.4. Fractal Characteristics and Pore Throat System Classification

Fractal theory can be used to analyze the heterogeneity and self-similarity of a complex pore throat system. Generally, the D values of the pore throat system are between two and three. The closer the D value is to two, the weaker the heterogeneity of the porous rock is. But the closer the D value is to three, the stronger the heterogeneity of the porous rock is [38,39,40].
D value can be calculated based on HPMI data [41], and the equation is as follows:
lg ( 100 S H g r + ) = ( 3 D ) lg ( r ) ( 3 D ) lg r max
where r is the pore throat radius, μm; SHgr+ is the mercury saturation of a pore throat with radius > r, %; D is the fractal dimension, dimensionless; and rmax is the maximum pore throat radius, μm.
The relationship between log(100 − SHgr+) and log(r) is displayed in Figure 6. The Chang 7 samples show three-stage fractal characteristics, and there are some differences in the fractal inflection points of different samples. The first inflection point (T1) is in the range of 0.0891~0.1340 μm, while the second inflection point (T2) is in the range of 0.3606~0.5482 μm. According to the two inflection points, the pore throat system of Chang 7 tight sandstone was divided into small pore throats, medium pore throats and large pore throats. The fractal dimensions of small pore throats, medium pore throats and large pore throats were named D1, D2 and D3, respectively. Among them, D1 was distributed between 2.652 and 2.870, with a mean of 2.755; D2 ranged from 2.378 to 2.997, with a mean of 2.797; and D3 ranged from 2.993 to 2.999, with a mean of 2.996. All the samples showed the largest D3 value, indicating that the heterogeneity of the large pore throat was the strongest.
The large pore throats correspond to the initial rising section. Due to the lower mercury injection pressure and mercury injection volume, we believe that the large pore throats mainly reflect the fracture system (Figure 6a,b,e). The medium pore throats correspond to the middle plateau section and have characteristics showing that a small change in the mercury injection pressure corresponds to a large amount of mercury injection. Therefore, the medium pore throats are dominated by DPs and RIPs (named the conventional pore throat system), which have large pore throat ratios (Figure 6a,b,d). The small pore throat corresponds to the end upwarping section and has characteristics showing that a large change in mercury injection pressure corresponds to a small amount of mercury injection. The small pore throats are mainly composed of clay IPs and nanoscale intragranular dissolution pores (named the tree-shaped pore throat system) (Figure 6a–c).
We further analyzed the relationships between different pore throat volumes and permeability. The pore throat volumes are given as follows:
V 1 = r m i n T 1 f r d r
V 2 = T 1 T 2 f r d r
V 3 = T 2 r m a x f r d r
where V1 is the volume of the small pore throat, mL; V2 is the volume of the medium pore throat, mL; V3 is the volume of the large pore throat, mL; f(r) is the volume of a pore throat with radius r; and rmin is the minimum pore throat radius, μm.
Permeability displays a weak positive correlation with V3, with an R2 of 0.2932 (Figure 7b). Permeability has an excellent positive correlation with V2, with an R2 of 0.7537 (Figure 7a). However, there is no obvious correlation between permeability and V1 (Figure 7a). These results indicate that the permeability of Chang 7 tight sandstone is mainly contributed by the medium pore throat.
Permeability has an obvious negative correlation with D2 but has no obvious correlation with D1 and D3 (Figure 8), indicating that the stronger the heterogeneity of the medium pore throat, the lower the permeability of the sample.

4. Discussion

4.1. Evaluation Criteria for the Prediction Effect of the Permeability Model

Due to the large differences in the pore structure of tight reservoirs in different regions, the applicability of different permeability prediction models varies greatly. Therefore, it is necessary to evaluate the prediction effects of various models to select the most suitable permeability prediction model for the study area. At present, RMSE and MAPE are commonly used as the basis to analyze the applicability of different permeability prediction models.
RMSE mostly represents the square root of the ratio of the square of the deviation between the predicted value and the measured value and the number of observations (n). MAPE refers to the average value of the absolute error between the predicted value and the measured value. Therefore, the smaller the values of RMSE and MAPE, the closer the predicted value is to the measured value.
The calculation equations for RMSE and MAPE are as follows:
R M S E = i 1 n ( K m e a s K p r e d ) n
M A P E = 1 n i = 1 2 K m e a s K p r e d K m e a s × 100
where Kmeas is the measured permeability of the core samples, mD; Kpred is the predicted permeability of the model, mD; and n is the total number of core samples.

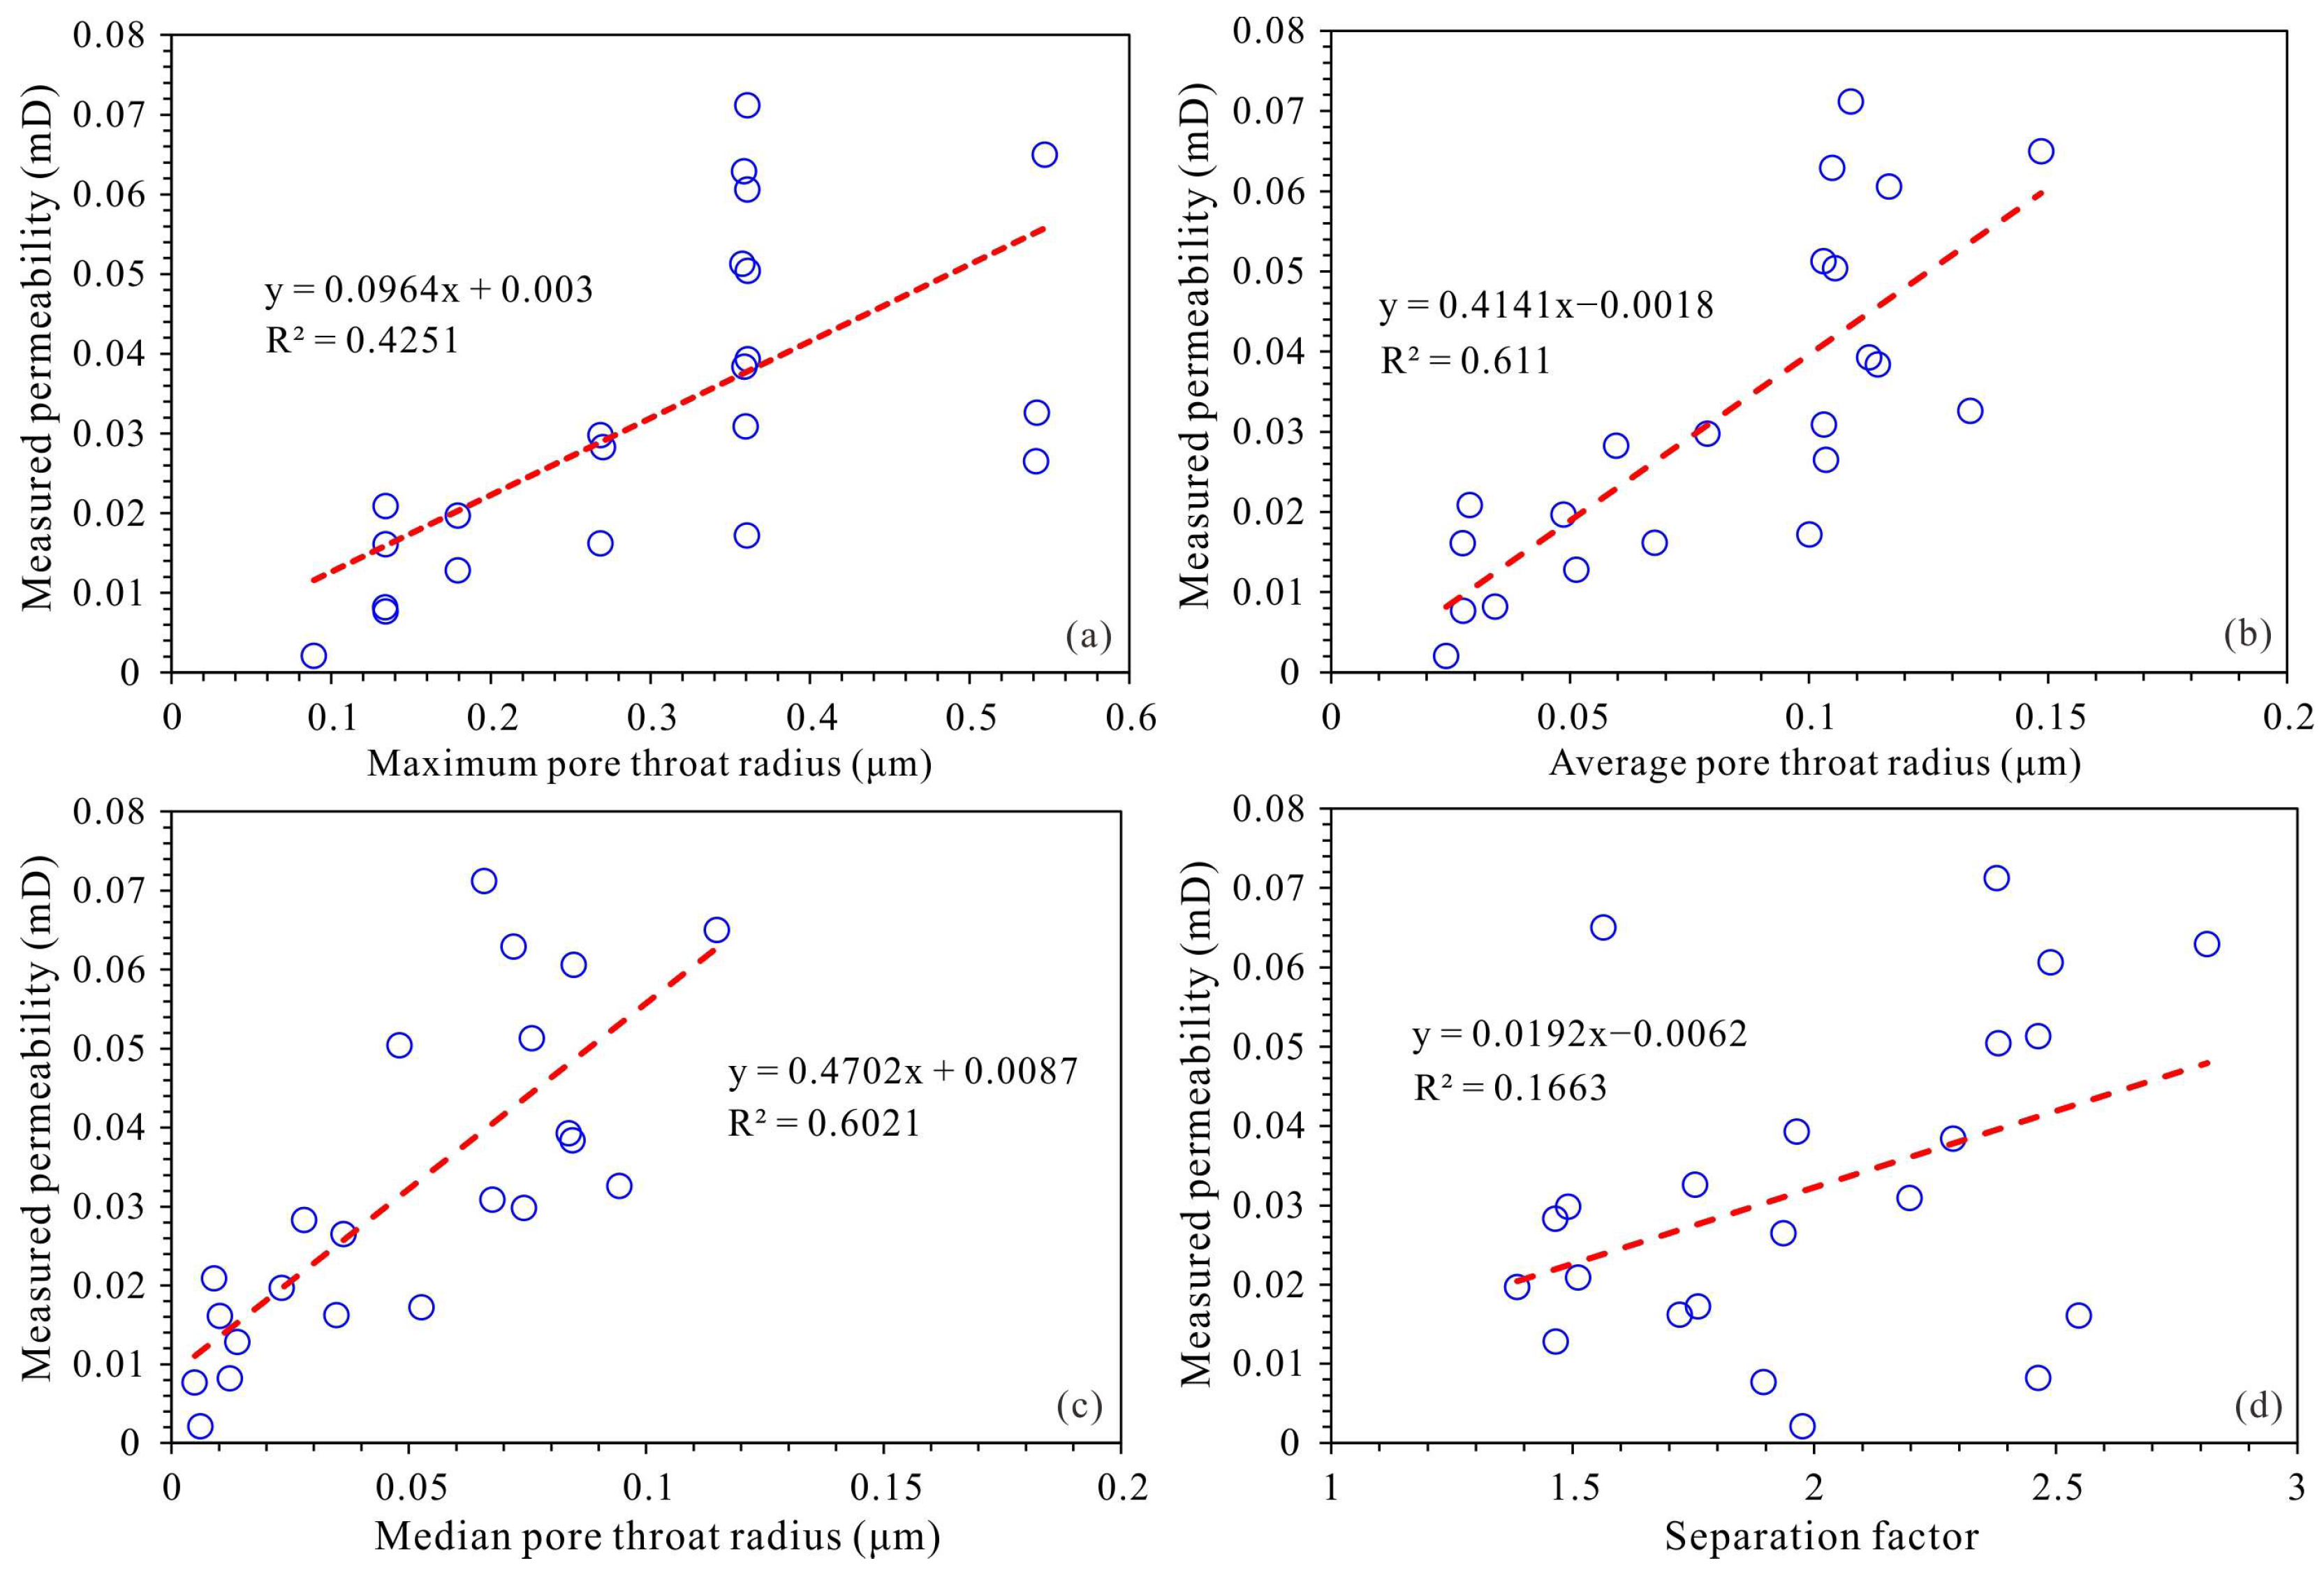
4.2. Permeability Prediction Based on Early Models

Figure 9 displays a plot of measured permeability versus predicted permeability using the Pittman model, Winland model and Rezaee model. In the Pittman model, the predicted permeability is significantly lower than the measured permeability. Moreover, the RMSE and MAPE are 0.139 and 117.9%, respectively. For the Winland model, the relationship between the predicted permeability and the measured permeability is discrete, and the error is large (RMSE = 0.545, MAPE = 89%). Obviously, the Winland and Pittman models are not suitable for predicting permeability in the study area. For the Rezaee model, the relationship between the predicted permeability and the measured permeability is better. However, when the permeability is lower than 0.02 mD, the results predicted by the Rezaee model seriously deviate from the measured permeability. Therefore, the Rezaee model is not suitable for predicting samples with low permeability.
Based on the above analysis, among the selected early permeability models, the Rezaee model has the best prediction effect. However, for tight sandstones with extremely low permeability (<0.02 mD), the permeability predicted by the three models all have large errors.

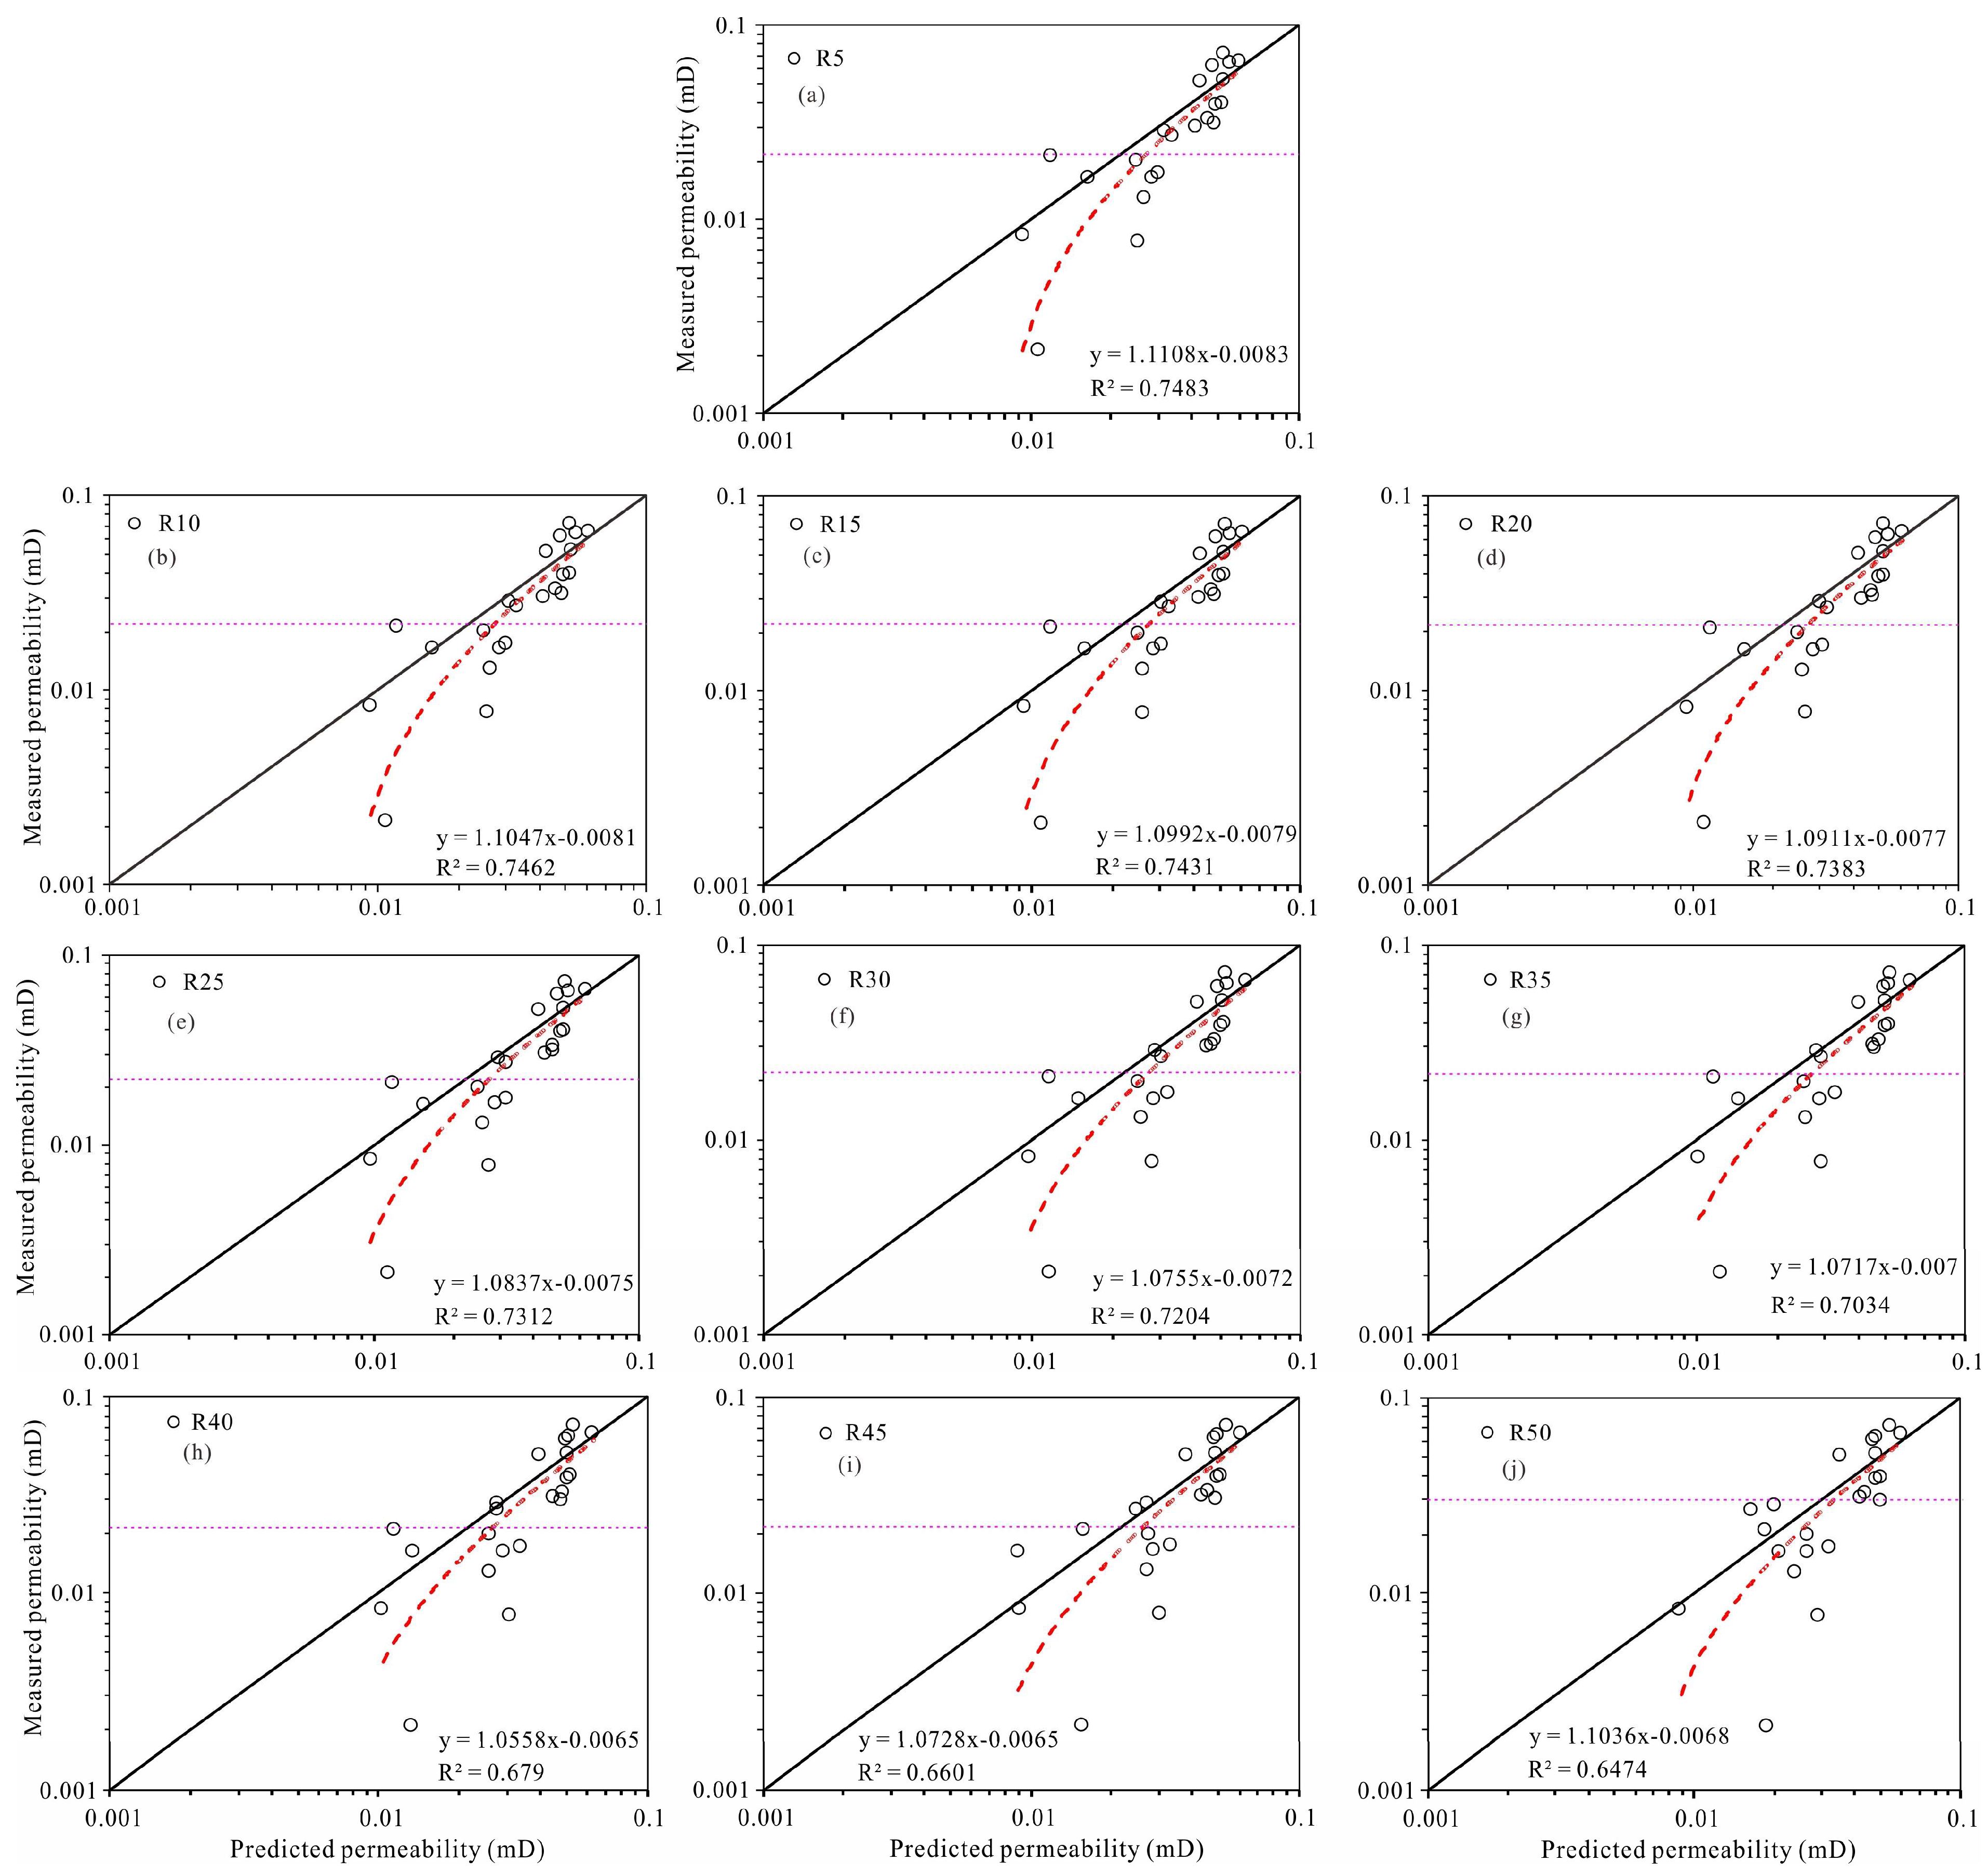
4.3. Permeability Prediction Based on Rn Model Derived from HPMI Parameter

Referring to the Winland model and the Rezaee model, mercury saturations of 5% to 50% (in 5% intervals) were chosen to establish a better correlation between measured permeability, porosity and Rn:
L o g K = A L o g R n + B L o g φ + C
where K is the measured permeability, mD; Rn denotes the pore throat radius at mercury injection saturation of n%, μm; φ is the porosity, %; A, B and C are the parameters obtained by multiple linear regression.
Table 2 presents a series of multiple regression equations and the corresponding R2 and RMSE and MAPE between the measured and predicted permeability. From the R5 model to the R50 model, R2 decreased from 0.7485 to 0.6474, RMSE increased from 0.01096 to 0.01230 and MAPE increased from 59.83% to 82.28%, showing that as the pore throat radius decreases, the permeability prediction effect of the Rn model becomes worse. These results further prove that the permeability of tight reservoirs is mainly contributed by some larger pore throats [42]. Therefore, the R5 model is the model with the highest accuracy among all Rn models in predicting the permeability of the Chang 7 tight reservoir. However, the R5 model significantly overestimates the permeability of extremely low permeability samples (K < 0.02 mD) (Figure 10).

4.4. Permeability Prediction Model Based on Fractal Dimension

The previous analysis revealed that the measured permeability has the best correlation with D2 and V2; that is, the volume and heterogeneity of the medium pore throat control the permeability of the sample. Therefore, this paper attempts to construct a permeability prediction model using the fractal dimensions and volumes of different pore throats as independent variables (Table 3 and Figure 11).
The equations, R2, RMSE and MAPE of the three models are displayed in Table 3. The R2 between the measured permeability and predicted permeability derived from the fractal dimension and volume of medium pore throats is the highest. In addition, the RMSE and MAPE derived from the fractal dimension and volume of medium pore throats are the lowest. In addition, the small pore throat model has the worst permeability prediction effect. Therefore, the permeability of Chang 7 tight sandstone is mainly contributed by medium pore throats, while an increase in small pore throat content will damage the permeability of the reservoir.

4.5. Comparison of Various Permeability Prediction Models

For the Winland model and Pittman model, permeability is strongly affected by pore throat radius (e.g., R35 and Rapex) and a small coefficient of porosity reduces the contribution of porosity to permeability. The Rezaee and Rn models not only consider the effect of pore throat radius on permeability but also the effect of porosity on permeability. Therefore, the Rezaee and Rn models are better than the Winland model and Pittman model, in predicting permeability. The R5 model has the best prediction effect on permeability among all Rn models. However, for samples with a different porosity, the pore throat volumes corresponding to a mercury saturation of 5% are different. Simultaneously, the pore structure of Chang 7 tight sandstone is relatively complex, and its pore space is composed of microfractures, RIPs, DPs and IPs. Moreover, different pore spaces contribute differently to permeability. Therefore, it may not be reasonable to directly use porosity as a key parameter to predict permeability. Daigle and Johnson (2016) believed that only when the connected pore throat reaches a certain volume, fluids can flow through the reservoir [43]. In summary, the R5 model is not the best among all Rn models for predicting permeability. The new permeability prediction model was constructed using medium pore throat volume and fractal dimension. Medium pore throat volume reflected both the size and volume of the pore throat, and fractal dimension reflected the tortuosity of the medium pore throat. Therefore, the new model predicted permeability with the highest accuracy. Therefore, there are several reasons why models based on medium pore throat volume and fractal dimension are the best at predicting permeability: (1) Fractal dimension can characterize pore structure heterogeneity across scales [44]. Based on multi-stage fractal characteristics, pore throats are classified and the contribution of different pore throats to permeability is clarified. (2) For tight sandstones, the complex pore throat system will make the tortuosity higher. Higher tortuosity reduces fluid mobility. The fractal dimension can reflect the tortuosity of different pore throats to a certain extent [45]. In summary, we believe that a good permeability prediction model should be able to reflect information such as pore throat size, pore throat volume and pore throat shape.
The pore throat system of Chang 7 tight sandstone is composed of several different types of pore throats (large pore throats, medium pore throats and small pore throats). Among them, the medium pore throats contribute the most to permeability, while an increase in the small pore throat content will damage the percolation capacity of the reservoir. Taking sample L36 as an example, its pore throat system is dominated by medium pore throats, accounting for 83.84%, indicating that its percolation network is mainly composed of medium pore throats. Thus, the permeability of sample L36 is high, which is 0.0712 mD. The pore throat system of sample L3 is dominated by small pore throats, accounting for 66.06%, indicating that its percolation network is mainly composed of small pore throats. Therefore, the corresponding permeability is very low, only 0.0161 mD. The proportions of medium pore throats and small pore throats of sample L50 are 48.14% and 46.81%, respectively, indicating that the percolation network is composed of medium pore throats and small pore throats. The permeability of sample L50 is low, which is 0.0298 mD (Figure 12). Therefore, the model constructed using the medium pore throat volume and its fractal dimension as key parameters can accurately predict the permeability of Chang 7 tight sandstone.

5. Conclusions

  • The pores of Chang 7 tight sandstone are not developed. The pore types are dominated by DPs, followed by IPs, RIPs and microfractures. The pore throat of Chang 7 tight sandstone is characterized by good sorting but small size and poor connectivity.
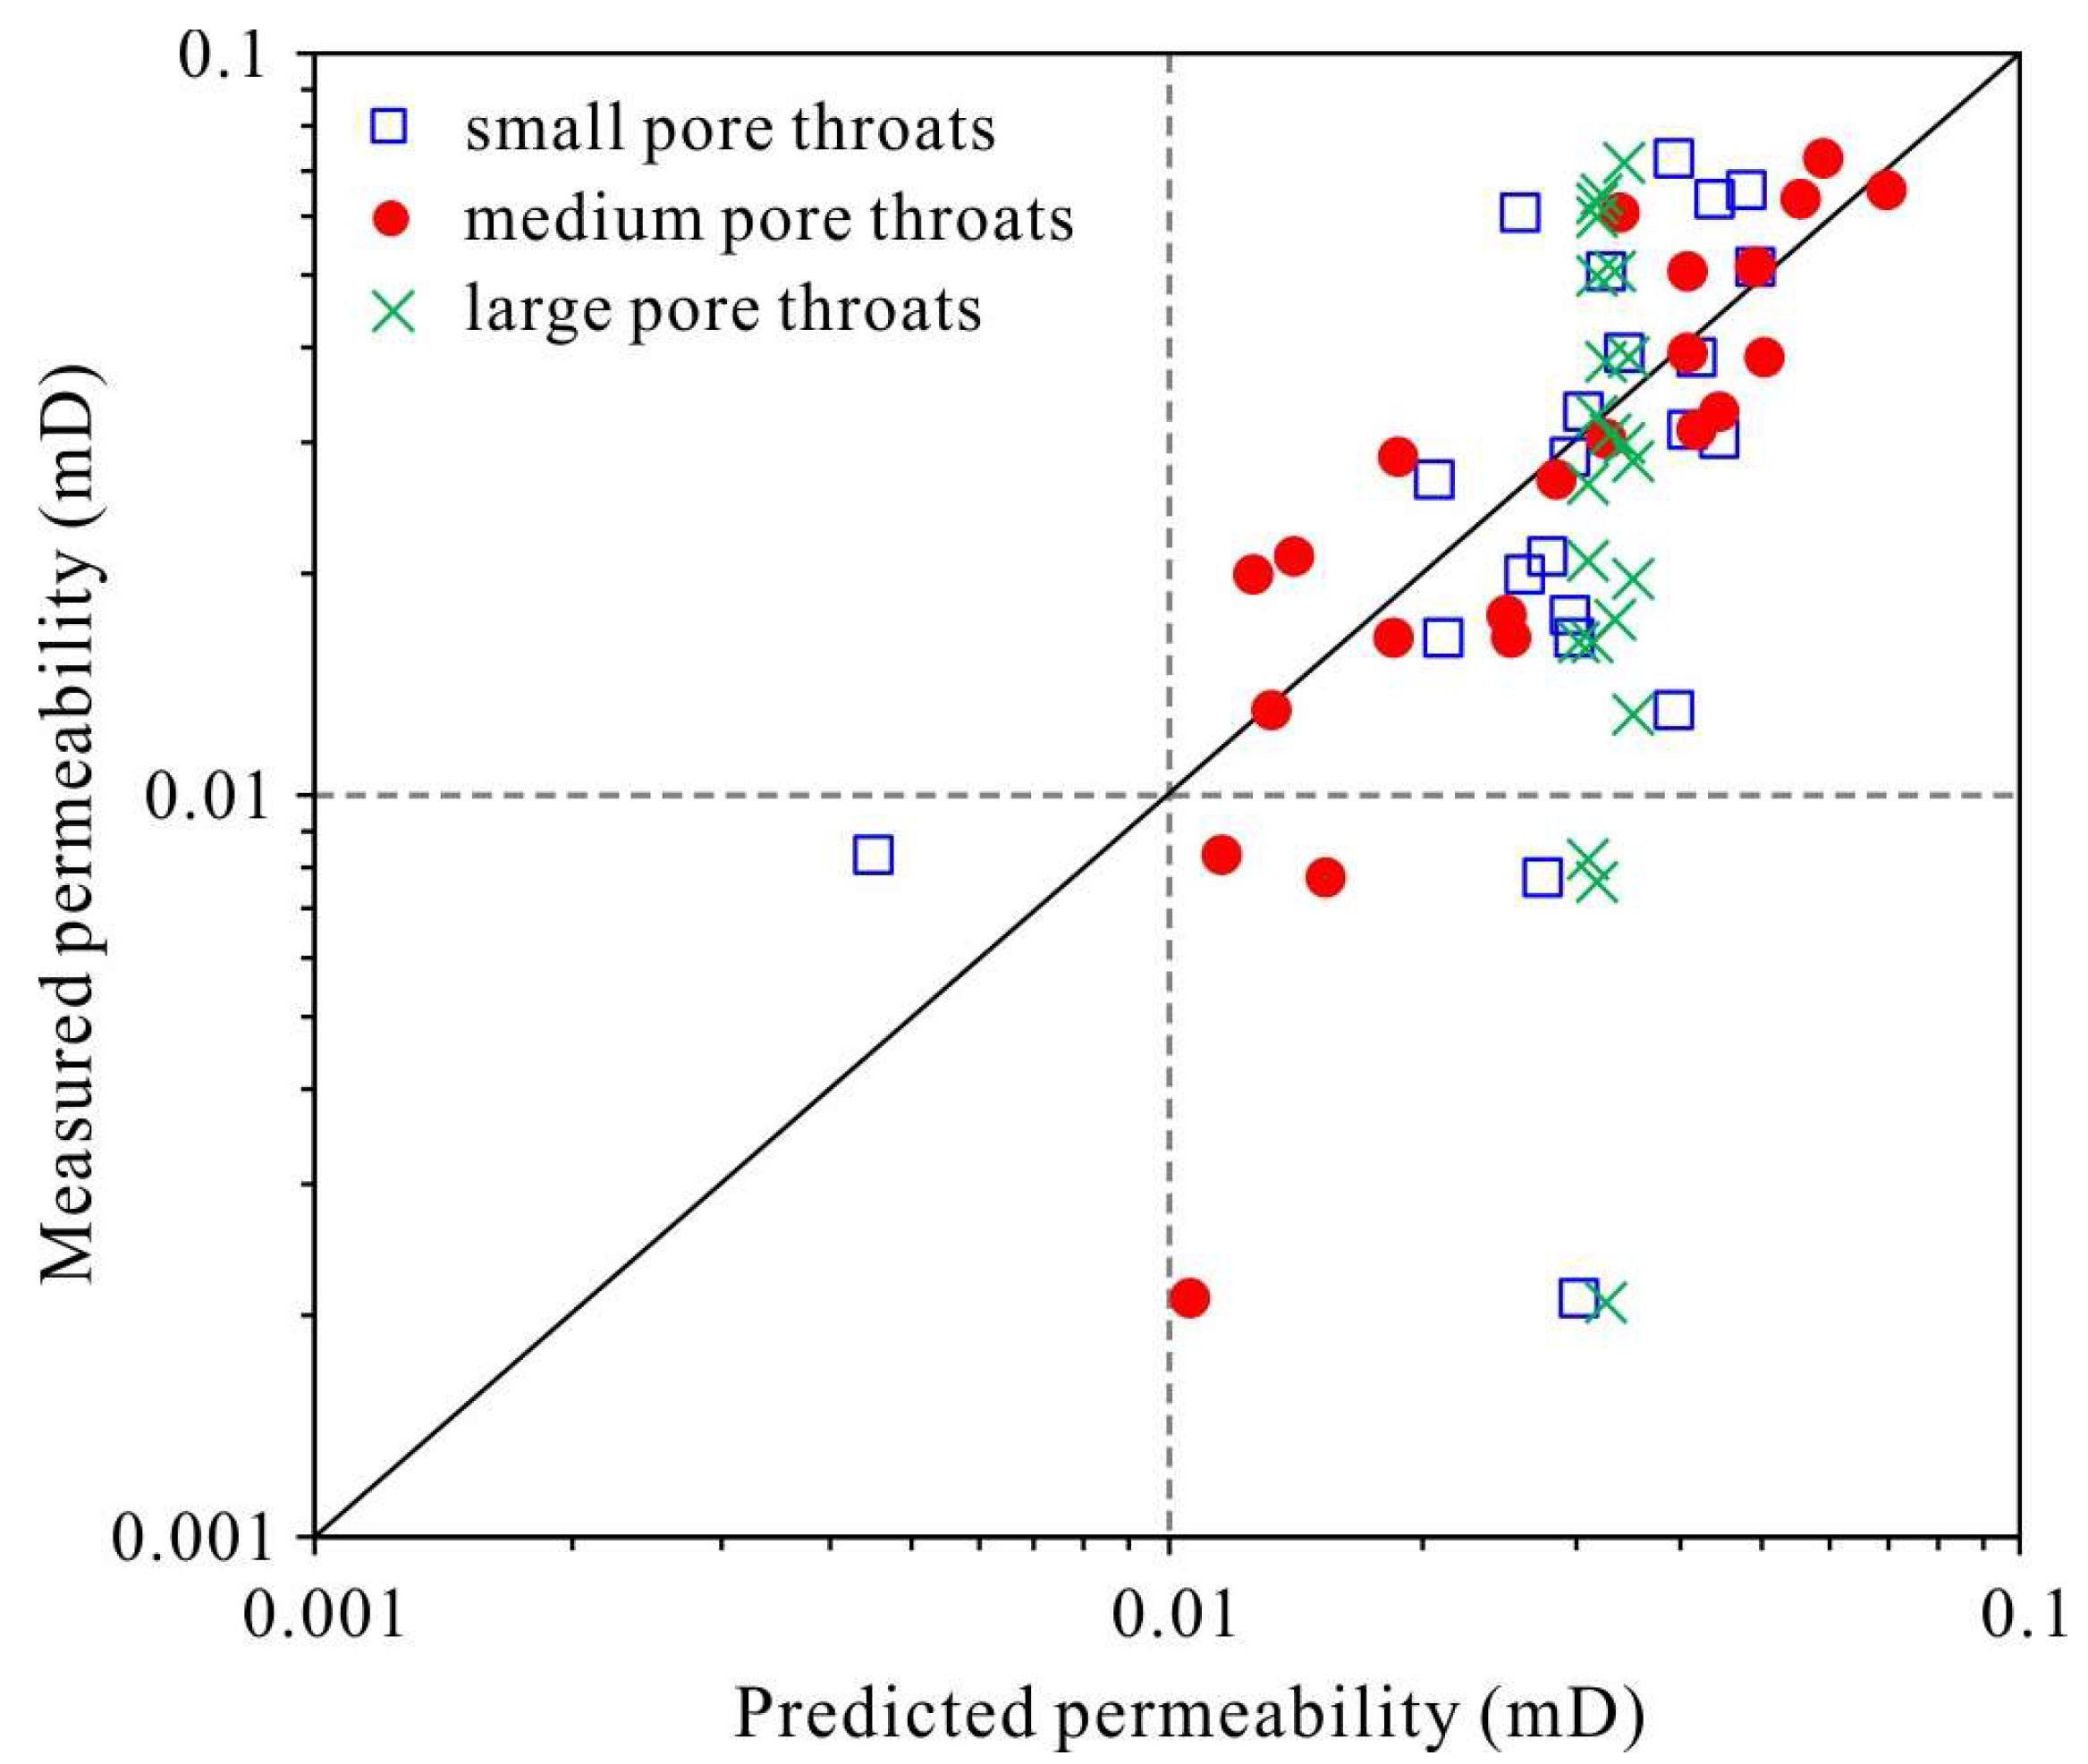
  • According to the fractal characteristics, the pore throat system is divided into three parts: small pore throats, medium pore throats and large pore throats. Large pore throats are mainly composed of microfractures. Medium pore throats are dominated by DPs and RIPs. Small pore throats are mainly composed of IPs.
  • A good permeability prediction model should be able to reflect information such as pore throat size, pore throat volume and pore throat heterogeneity. The new model based on medium pore throat volume and fractal dimension can accurately predict the permeability of tight sandstones.

Author Contributions

Conceptualization, Z.W.; methodology, W.T.; formal analysis, Y.F.; investigation, Y.Y.; resources, W.T.; data curation, H.G.; writing—original draft, Y.Y.; writing—review & editing, W.T.; supervision, Z.W. and W.T.; project administration, Z.W. and W.T.; funding acquisition, Z.W. and W.T. All authors have read and agreed to the published version of the manuscript.

Funding

This research was funded by the National Natural Science Foundation of China (Grant Nos. 42202187 and 42272160).

Data Availability Statement

Data are contained within the article.

Conflicts of Interest

The authors declare no conflicts of interest.

References

  1. Jia, C.; Zou, C.; Li, J.; Li, D.; Zheng, M. Assessment criteria, main types, basic features and resource prospects of the tight oil in China. Acta Pet. Sin. 2012, 33, 343–350. [Google Scholar] [CrossRef]
  2. Chen, Z.J.; Ren, Z.L. Method for calculating single-well producing geological reserves and single-well technically recoverable reserves in tight sandstone gas reservoirs: A case of carboniferous-permian gas reservoirs in yanchang gas field, ordos basin. Xinjiang Pet. Geol. 2022, 43, 360–367. [Google Scholar] [CrossRef]
  3. Zou, C.; Zhu, R.; Dong, D.; Wu, S. Scientific and technological progress, development strategy and policy suggestion regarding shale oil and gas. Acta Pet. Sin. 2022, 43, 1675–1686. [Google Scholar] [CrossRef]
  4. US Energy Information Administration. How Much Shale (Tight) Oil is Produced in The United States? Available online: https://www.eia.gov/tools/faqs/faq.php?id=847&t=6 (accessed on 4 September 2019).
  5. Cao, Y.; Zhu, N.; Zhang, S.; Xi, K.; Xue, X. Diagenesis and reserving space characteristics of tight oil reservoirs of permian lucaogou formation in jimusar sag of junggar basin. China J. Earth Sci. Environ. 2019, 41, 253–266. [Google Scholar] [CrossRef]
  6. Fu, S.; Jin, Z.; Fu, J.; Li, S.; Yang, W. Transformation of understanding from tight oil to shale oil in the member 7 of yanchang formation in ordos basin and its significance of exploration and development. Acta Pet. Sin. 2021, 42, 561–569. [Google Scholar] [CrossRef]
  7. Meng, Q.; Zhao, B.; Chen, S.; Lin, T.; Zhou, Y.; Qiao, W. Sedimentary enrichment mode and effect analysis of exploration and development: A case study of Fuyu reservoir tight oil in northern Songliao Basin. Acta Sedimentol. Sin. 2021, 39, 112–125. [Google Scholar] [CrossRef]
  8. Rezaee, R.; Saeedi, A.; Clennell, B. Tight gas sands permeability estimation from mercury injection capillary pressure and nuclear magnetic resonance data. J. Pet. Sci. Eng. 2012, 88, 92–99. [Google Scholar] [CrossRef]
  9. Coates, G.R.; Galford, J.; Mardon, D.; Marschall, D. A new characterization of bulk-volume irreducible using magnetic resonance. Log. Anal. 1998, 39, 51–63. [Google Scholar]
  10. Xie, R.; Zhang, S.F.; Zhou, L.; Liu, H.T.; Yao, M.J.; Jiang, X.G. Hydrocarbon accumulation characteristics of tight reservoirs of da’anzhai member of jurassic ziliujing formation in eastern Sichuan Basin. Lithol. Reserv. 2023, 35, 108–119. [Google Scholar] [CrossRef]
  11. Zou, C.; Zhu, R.; Liu, K.; Su, L.; Bai, B.; Zhang, X.; Yuan, X.; Wang, J. Tight gas sandstone reservoirs in China: Characteristics and recognition criteria. J. Pet. Sci. Eng. 2012, 88, 82–91. [Google Scholar] [CrossRef]
  12. Liu, M.; Xie, R.; Wu, S.; Zhu, R.; Mao, Z.; Wang, C. Permeability prediction from mercury injection capillary pressure curves by partial least squares regression method in tight sandstone reservoirs. J. Pet. Sci. Eng. 2018, 169, 135–145. [Google Scholar] [CrossRef]
  13. Zhang, L.; Lu, S.; Xiao, D.; Gu, M. Characterization of full pore size distribution and its significance to macroscopic physical parameters in tight glutenites. J. Nat. Gas. Sci. Eng. 2017, 38, 434–449. [Google Scholar] [CrossRef]
  14. Cheng, H.; Wang, F.; Zai, Y.; Zhou, S. Prediction of tight sandstone permeability based on high-pressure mercury intrusion (HPMI) and nuclear magnetic resonance (NMR). Lithol. Reserv. 2020, 32, 122–132. [Google Scholar] [CrossRef]
  15. He, J.; Ling, K. Measuring permeabilities of Middle-Bakken samples using three different methods. J. Nat. Gas. Sci. Eng. 2016, 31, 28–38. [Google Scholar] [CrossRef]
  16. Nelson, P.H. Permeability-porosity relationships in sedimentary rocks. Log. Anal. 1994, 35, 38–62. [Google Scholar]
  17. Hui, G.; Chen, Z.; Wang, Y.; Zhang, D.; Gu, F. An integrated machine learning-based approach to identifying controlling factors of unconventional shale productivity. Energy 2023, 266, 126512. [Google Scholar] [CrossRef]
  18. Wang, H.; Wang, S.; Chen, S.; Hui, G. Predicting long-term production dynamics in tight/shale gas reservoirs with dual-stage attention-based TEN-Seq2Seq model: A case study in Duvernay formation. Geoenergy Sci. Eng. 2023, 223, 211495. [Google Scholar] [CrossRef]
  19. Lala, A.M.S.; El-Sayed, N.A. Controls of pore throat radius distribution on permeability. J. Pet. Sci. Eng. 2017, 157, 941–950. [Google Scholar] [CrossRef]
  20. Wang, W.; Xu, Z.; Li, W.; Hou, T.; Li, Y.; Bai, Y.; Zhu, Y. Determination of permeability in tight sandstone reservoirs using gaussian process regression and high-pressure porosimetry: A case study of the member-7 of yanchang formation in the Jiyuan area of the ordos basin. Bull. Geol. Sci. Technol. 2022, 41, 30–37. [Google Scholar] [CrossRef]
  21. Wang, J.; Xi, Z.; Lu, D. Pore structure of shale gas reservoirs revealed by constant-speed mercury injection experiments: A case study of wufeng formation shale from northwestern Hunan Province. Geol. Explor. 2021, 57, 450–456. [Google Scholar] [CrossRef]
  22. Shao, X.; Pang, X.; Li, H.; Zhang, X. Fractal analysis of pore network in tight gas sandstones using NMR method: A case study from the ordos basin, China. Energy Fuels 2017, 31, 10358–10368. [Google Scholar] [CrossRef]
  23. Yan, Q.; Zhang, Y.; Fu, H.; Jiang, M.; Wang, J.; Sui, S.; Fu, H.; Hao, R.; Guo, M. High pressure mercury injection and scanning electron microscopy applied to characterize micro-and nano-scale pore throats in tight sandstone reservoirs: A case study of the fourth member of shahejie formation in Yi176 block, zhanhua sag, bohai bay basin. Pet. Geol. Exp. 2018, 40, 280–287. [Google Scholar] [CrossRef]
  24. Purcell, W. Capillary pressures—Their measurement using mercury and the calculation of permeability therefrom. J. Pet. Technol. 1949, 1, 39–48. [Google Scholar] [CrossRef]
  25. Swanson, B. A simple correlation between permeabilities and mercury capillary pressures. J. Pet. Technol. 1981, 33, 2498–2504. [Google Scholar] [CrossRef]
  26. Pittman, E.D. Relationship of porosity and permeability to various parameters derived from mercury injection-capillary pressure curves for sandstone. AAPG Bull. 1992, 76, 191–198. [Google Scholar] [CrossRef]
  27. Guo, B.; Ghalambor, A.; Duan, S. Correlation between sandstone permeability and capillary pressure curves. J. Pet. Sci. Eng. 2004, 43, 239–246. [Google Scholar] [CrossRef]
  28. Kolodzie, S., Jr. Analysis of pore throat size and use of the Waxman-Smits equation to determine OOIP in Spindle Field, Colorado. In Proceedings of the SPE Annual Technical Conference and Exhibition, Dallas, TX, USA, 21–24 September 1980. [Google Scholar]
  29. Chang, D.; Vinegar, H.J.; Morriss, C.; Straley, C. Effective Porosity, Producible Fluid and Permeability in Carbonates from Nmr Logging. In Proceedings of the SPWLA 35th Annual Logging Symposium, Tulsa, OK, USA, 19 June 1994; p. SPWLA-1994-A. [Google Scholar]
  30. Mandelbrot, B.B. The Fractal Geometry of Nature; WH Freeman: New York, NY, USA, 1982; pp. 1–532. [Google Scholar]
  31. Mandelbrot, B.B. On the geometry of homogeneous turbulence, with stress on the fractal dimension of the iso-surfaces of scalars. J. Fluid. Mech. 1975, 72, 401–416. [Google Scholar] [CrossRef]
  32. Zhang, Q.; Jiao, T.; Huang, H.; Qi, Z.; Jiang, T.; Chen, G.; Zhu, Y.; Jia, N. Pore structure and fractal characteristics of ultralow-permeability sandstone reservoirs in the upper triassic yanchang formation, ordos basin. Interpretation 2021, 9, T747–T765. [Google Scholar] [CrossRef]
  33. Pape, H.; Clauser, C.; Iffland, J. Permeability prediction based on fractal pore-space geometry. Geophysics 1999, 64, 1447–1460. [Google Scholar] [CrossRef]
  34. Zhang, K.; Liu, R.; Liu, Z.; Li, B.; Han, J.; Zhao, K. Influence of volcanic and hydrothermal activity on organic matter enrichment in the upper triassic yanchang formation, Southern ordos basin, Central China. Mar. Pet. Geol. 2020, 112, 104059. [Google Scholar] [CrossRef]
  35. Yang, Y.; Li, W.; Ma, L. Tectonic and stratigraphic controls of hydrocarbon systems in the Ordos basin: A multicycle cratonic basin in central China. AAPG Bull. 2005, 89, 255–269. [Google Scholar] [CrossRef]
  36. Gao, H.; Zhou, X.; Wen, Z.; Guo, W.; Tian, W.; Li, S.; Fan, Y.; Luo, Y. Classification and evaluation of shale oil reservoirs of the Chang 71-2 Sub-Member in the Longdong area. Energies 2022, 15, 5364. [Google Scholar] [CrossRef]
  37. Lai, J.; Wang, G.; Ran, Y.; Zhou, Z.; Cui, Y. Impact of diagenesis on the reservoir quality of tight oil sandstones: The case of Upper Triassic Yanchang Formation Chang 7 oil layers in Ordos Basin, China. J. Pet. Sci. Eng. 2016, 145, 54–65. [Google Scholar] [CrossRef]
  38. Ji, F.; Zhang, Y. Application of fractal geometry in de⁃ scription of heterogeneity. J. Univ. Pet. China Ed. Nat. Sci. 1994, 18, 161–168. [Google Scholar]
  39. Mandelbrot, B.B.; Passoja, D.E.; Paullay, A.J. Fractal character of fracture surfaces of metals. Nature 1984, 308, 721–722. [Google Scholar] [CrossRef]
  40. Huang, J.; Dong, D.; Li, J.; Hu, J.; Wang, Y. Reservoir fractal characteristics of continental shale: An example from triassic xujiahe formation shale, Sichuan Basin, China. Nat. Gas. Geosci. 2016, 27, 1611–1618. [Google Scholar] [CrossRef]
  41. Tian, W.; Wen, Z.; Luo, Y.; Xi, Y.; Han, X. The grading evaluation of physical properties of tight sandstone in chang 7 member of wujiao area in ordos basin. J. Yangtze Univ. (Nat. Sci. Ed.) 2021, 18, 24–32. [Google Scholar]
  42. Xi, K.; Cao, Y.; Haile, B.G.; Zhu, R.; Jahren, J.; Bjørlykke, K.; Zhang, X.; Hellevang, H. How does the pore-throat size control the reservoir quality and oiliness of tight sandstones? The case of the Lower Cretaceous Quantou Formation in the southern Songliao Basin, China. Mar. Pet. Geol. 2016, 76, 1–15. [Google Scholar] [CrossRef]
  43. Daigle, H.; Johnson, A. Combining mercury intrusion and nuclear magnetic resonance measurements using percolation theory. Transp. Porous Media 2015, 111, 669–679. [Google Scholar] [CrossRef]
  44. Zhou, N.; Lu, S.; Wang, M.; Liu, W.; Guan, Y.; Tan, H.; Wang, Z. Applicability of fractal capillary pressure models to sandstones. J. Pet. Sci. Eng. 2020, 185, 106626. [Google Scholar] [CrossRef]
  45. Pape, H.; Riepe, L.; Schopper, J.R. Theory of self-similar network structures in sedimentary and igneous rocks and their investigation with microscopical and physical methods. J. Microsc. 1987, 148, 121–147. [Google Scholar] [CrossRef]
Figure 1. Location of the study area and lithological characteristics of Chang 7 member (modified from Gao et al. [36]).
Energies 17 00821 g001
Figure 2. The correlation between permeability and porosity of Chang 7 tight sandstone in the study area. All symbols represent porosity and permeability data for different samples. The blue dashed line reflects the fitted trend line of porosity and permeability data.
Energies 17 00821 g002
Figure 3. The main diagenesis and pore types of Chang 7 tight sandstone; (a) dissolution pores and residual intergranular pores, L1, 2082.42 m, casting thin section; (b) intercrystalline pores in clay minerals, L8, 2279.57 m, SEM; (c) microfractures, intergranular pores, L13, 1987.87 m, casting thin section; (d) residual intergranular pores, L6, 2246.7 m, SEM; (e) dissolution pores, L31, 1808.67 m, casting thin section; (f) microfractures, L6, 2246.7 m, SEM.
Energies 17 00821 g003
Figure 4. High-pressure mercury intrusion and withdrawal curve of typical samples.
Energies 17 00821 g004
Figure 5. The relationships between permeability and the maximum pore throat radius (a) and the average pore throat radius (b) and the median pore throat radius (c) and the sorting coefficient (d).
Energies 17 00821 g005
Figure 6. The mercury intrusion curves (a), fractal characteristics (b), and the corresponding microscopic photos (ce) of Sample L6.
Energies 17 00821 g006
Figure 7. The correlation diagram between the measured permeability and different pore throat volumes. (a) Measured permeability versus medium pore throat and small pore throat, and (b) measured permeability versus large pore throat.
Energies 17 00821 g007
Figure 8. The relationship between measured permeability and fractal dimension. (a) D1 and D2, and (b) D3. Blue symbols represent measured permeability and D3 data for different samples.
Energies 17 00821 g008
Figure 9. Relationships between measured permeability and predicted permeability derived from the Winland model, Pittman model and Rezaee model.
Energies 17 00821 g009
Figure 10. The relationship between measured permeability and predicted permeability derived from the R5~R50 models. (a) is from the R5 model, (b) is from the R10 model, (c) is from the R15 model, (d) is from the R20 model, (e) is from the R25 model, (f) is from the R30 model, (g) is from the R35 model, (h) is from the R40 model, (i) is from the R45 model and (j) is from the R50 model.
Energies 17 00821 g010
Figure 11. The relationships between measured permeability and predicted permeability based on volume and fractal dimensions of different pore throats.
Energies 17 00821 g011
Figure 12. Fractal characteristics (AC), pore throat distribution characteristics (DF) and fluid percolation diagrams of typical samples (GI).
Energies 17 00821 g012
Table 1. Common permeability prediction models. K is the permeability and φ is the porosity.
Model NameExpression
Purcell model K = F ( σ cos θ ) 2 φ 2 × 10 4 0 100 d S H G P c 2
Winland model lg R 35 = 0.732 + 0.588 lg K 0.864 lg φ
Swanson model K = 399 S H g P c a p e x 1.691
Thomeer model K = 3.806 F 1.3334 S H g P d 2
Pittman model lg r a p e x = 0.117 + 0.475 lg K 0.099 lg φ
Razaee Model lg K = 1.92 + 0.949 lg φ + 0.18 lg R 10
Guo model K = C × ( S H g P c 2 ) max D
Coates model K = φ C 2 F F I B V I 2
SDR model K = a T 2 g m 2 φ 4
Table 2. Multiple regression equations and the corresponding R2 and RMSE and MAPE between measured and predicted permeability.
ModelEquationR2RMSEMAPE (%)
R5LogK = 0.859 × LogR5 + 0.868 × Logφ − 1.6700.74830.0109659.83
R10LogK = 0.842 × LogR10 + 0.851 × Logφ − 1.6290.74620.0110260.31
R15LogK = 0.822 × LogR15 + 0.832 × Logφ − 1.5870.74310.0110660.64
R20LogK = 0.795 × LogR20 + 0.808 × Logφ − 1.5420.73830.0111661.52
R25LogK = 0.760 × LogR25 + 0.779 × Logφ − 1.4970.73120.0112762.49
R30LogK = 0.712 × LogR30 + 0.742 × Logφ − 1.4530.72040.0114564.04
R35LogK = 0.642 × LogR35 + 0.692 × Logφ − 1.4160.70340.0117266.64
R40LogK = 0.545 × LogR40 + 0.656 × Logφ − 1.4180.6790.0121270.88
R45LogK = 0.383 × LogR45 + 0.753 × Logφ − 1.6290.66010.0122576.44
R50LogK = 0.265 × LogR50 + 0.895 × Logφ − 1.8560.64740.0123082.28
Table 3. Equations and parameters of the permeability prediction model based on volume and fractal dimensions of different pore throats.
ModelEquationR2RMSEMAPE (%)
Large pore throatK = −53.515/D3 + 1.886 × V3 + 17.8640.21830.01645113.46
Medium pore throatK = −0.264/D2 + 0.144 × V2 + 0.1060.77730.0093946.81
Small pore throatK = −0.142/D1 + 0.014 × V1 + 0.0790.00080.01978137.10
Disclaimer/Publisher’s Note: The statements, opinions and data contained in all publications are solely those of the individual author(s) and contributor(s) and not of MDPI and/or the editor(s). MDPI and/or the editor(s) disclaim responsibility for any injury to people or property resulting from any ideas, methods, instructions or products referred to in the content.

