Abstract
In order to reduce CO2 emissions in the brick manufacturing process, the effectiveness of the energy-intensive firing process needs to be improved. This can be achieved by enhancing the heat transfer in order to reduce firing times. As a result, current development of tunnel kilns is oriented toward fast firing as a long-term goal. However, a struggling building sector and complicated challenges, such as different requirements for product quality, have impeded developments in this direction. This creates potential for the further development of oven designs, such as improved airflow through the kiln. In this article, numerical flow simulations are used to investigate two different reconstruction measures and compare them to the initial setup. In the first measure, the kiln height is reduced, while in the second measure, the kiln cars are adjusted to alternate the height of the bricks so that every other pair of bricks is elevated, creating a staggered arrangement. Both measures are investigated to determine the effect on the heating rate compared to the initial configuration. A transient grid independence study is performed, ensuring numerical convergence and the setup is validated by experimental results from measurements on the initial kiln configuration. The simulations show that lowering the kiln height improves the heat transfer rate by , while the staggered arrangement of the bricks triples it. This leads to an average brick temperature after two hours which is around 130 °C higher compared to the initial kiln configuration. Therefore, the firing time can be significantly reduced. However, the average pressure loss coefficient rises by to , respectively, in the staggered configuration.
1. Introduction
Brick manufacturing, a key industry in the construction sector, is under increasing pressure to reduce energy consumption and environmental impact, as highlighted in numerous studies [1]. Therefore, brick manufacturers are making tremendous efforts to reach their goal of CO2 neutrality.
The most common method of making bricks is to first dry and then fire them. The firing process especially, depending on the clay mixture [2], is relatively energy intensive. Thermal energy expenditures alone currently account for approximately 25 to 35% of the total cost of brick production [3]. Therefore, energy efficiency is of significant importance for brick manufacturers [4]. An important factor in terms of energy efficiency is the type of kiln [5]. There are intermittent kilns, where bricks are fired in batches, and continuous kilns, where bricks move through different temperature-controlled sections of the kiln. The advantage of the continuous approach lies in the higher efficiency through heat recovery measures [6]. With regard to energy efficiency, the aim is to keep the firing time as low as possible, as it is a direct measure of kiln efficiency. Vogt [3] demonstrates this assertion by depicting the specific kiln losses as a function of the firing time achieved in conventional kilns for the production of backing bricks. Specific losses were found to increase by around 15 kJ/kg per hour [3]. Depending on the production capacity, bricks are often stacked together in groups, commonly referred to as stacks, as can be seen in [7]. However, to enhance energy efficiency and enable uniform heating, so-called fast-firing single-layer kilns are proposed. The uniformity leads to a better controllability of the temperature in the bricks compared to brick stacks. Therefore, lower production reject rates can be achieved. A downside of the fast-firing kiln is that with its recirculation loops, it consumes around more electricity than a conventional tunnel kiln [8]. However, that higher consumption is, in theory, more than compensated by the achieved savings on thermal energy, leading to a total reduction of around specific energy input [8]. Moreover, fast firing can also have a positive effect on brick quality, such as higher bend strength and better thermal insulation due to a higher mean pore size, which is discussed by Dondi et al. [9]. Similarly, it was also shown through experimental measures conducted by Hauk et al. [10] that fast firing leads to an enhancement of the thermal isolation properties.
The most influential parameter of these important properties is the composite of the clay mixture. However, a comprehensive analysis of the influence of the raw material mixture on the cracking process is not yet possible. A first attempt was published by Vogt [3]. Additionally, Gencel et al. [11] showed that, for example, the addition of zeolite could reduce the bending strength by around under the same firing conditions. Makrygiannis and Karalis [12] investigated the possibility of inducing a lower thermal conductivity of the product through the introduction of solid waste material as an additive. During the firing process, the organic materials within, for example, paper sludge combust and create voids in the brick, and these serve as channels for the escape of gases. This significantly prevents the formation of defects such as cracks or warping that could compromise the structure strength of the bricks.
A schematic view of a fast-firing single-layer kiln design is depicted in Figure 1. The single layers of bricks are arranged in rows in kiln cars and are continuously transported through the heating and cooling zones until the firing process is finished. The most important external heat transfer mechanism is forced convection by airflow in the counter direction. The kiln length is usually around 150 m with a width of approximately 5–6 m.
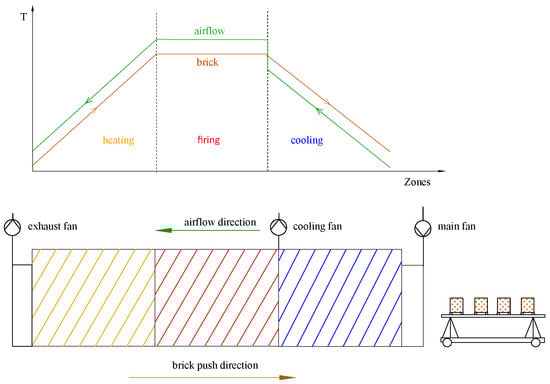
Figure 1.
Schematic drawing of a fast-firing kiln.
However, the first single-layer fast-fired tunnel kilns, built in Germany and Italy in the 1990s to fire roofing tiles and retaining bricks, had good firing qualities but also significantly higher thermal energy consumption than expected [3]. An approach to further develop the technology would be to enhance the effective heat transfer coefficient by reducing the area in which undisturbed airflow channels can be formed. Thus, the reduced airflow area should result in more air flowing through the brick holes, leading to a significant increase in heat exchange. As heat transfer is highly dominated by enforced convection, computational fluid dynamics (CFD) can be a valuable tool to further assess heat transfer. Tasbim et al. [13] used CFD simulations to prove the superiority of zigzag kilns over fixed chimney kilns in terms of efficiency. Using numerical methods, Rafaey et al. [14] investigated the influence of different lattice settings on convective heat transfer. Alrahmani et al. [15] investigated the effect of the setting density, concluding that low-density settings are always advantageous. Nagy et al. [16] presented a model for the brick burning process of a tunnel kiln with simplified brick stacks.
Many other studies used CFD to investigate the drying process, in which lower temperatures are needed and water is evaporated. For example, Rzig et al. [17] presented a model for drying a whole brick under industrial drying conditions. Furthermore, de Vasconcellos Araújo et al. [18] proposed an equation to calculate the brick water mass diffusivity depending on the drying air temperature based on numerical simulations. Santos et al. [19] compared their numerical results to the experimental data of the surface temperature and the average moisture content, resulting in a sufficient agreement. However, to the best of our knowledge, no numerical investigations on the firing process in a single-layer brick kiln have been published so far. This paper suggests a model that is capable of capturing heat transfer as well as flow behavior in the kiln, which supports further development of the technology.
2. Methodology
2.1. Computational Domain and Boundary Conditions
The basic idea is to investigate how different strategies to reduce the airflow area affect the heat transfer. Therefore, three different settings are investigated, as shown in Figure 2. In Figure 2a, the initial setup with a total height of 1.095 m, in which measurements are performed (large setup), is shown. Meanwhile, Figure 2b shows the experimental setup with a reduced ceiling height (small setup) of around . The setup with the staggered arrangement of the bricks (offset setup) has a slightly reduced height (14%) and is shown in Figure 2c.
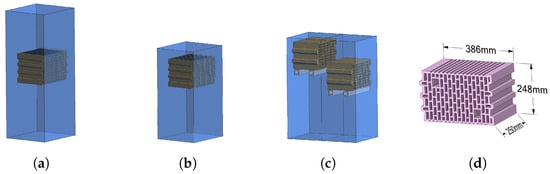
Figure 2.
Three different brick settings—(a) big setup, (b) small setup, and (c) offset setup—and (d) the brick dimensions.
The brick itself is modeled in detail as solid with holes. Still, the porosity of the material, the water content (approximately ), and reactions like the burning of additives or changes in the crystalline structure during the heating process are neglected. The dimensions of the brick are presented in Figure 2d. Considering a kiln width of around 5.5 m, this results in 12 bricks side by side.
Figure 3 depicts the computational domain with the inlet in blue, the outlet in red, the walls in gray, and an evaluation plane in yellow. Due to the kiln’s length and the complexity of the burning process, a reduced model accounting for only a section of one kiln car is used. The first approach was to model only one brick, which significantly overpredicted the heat transfer values due on an insufficiently resolved flow field [20]. The flow around the bricks is influenced by fluid barriers and the distance and operation of the burners. Therefore, it was decided to model the boundary conditions of a four-brick setting to simulate the movement through the different burning zones, which always resembles the worst-case situation in the kiln. A section of four bricks is used to evaluate the results, as a flow barrier is placed after every fourth brick, creating a periodically repeating arrangement. The fifth brick is included to prevent any influence on the evaluation plane by the boundary conditions of the outlet.
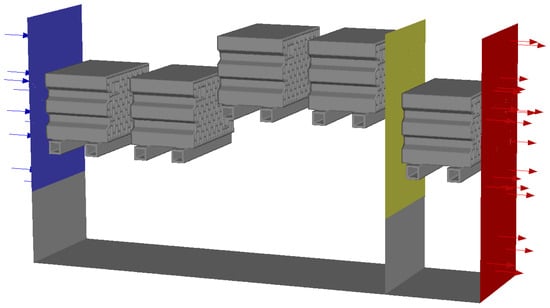
Figure 3.
Computational domain of the offset setup (blue—inlet; red—outlet; grey—walls; yellow—evaluation plane).
Temperature and velocity profiles are used as inlet boundary conditions. To obtain them, a stationary simulation under ambient conditions with a mass flow of is performed. The velocity, turbulent kinetic energy, and specific dissipation rate profile in space obtained from the results, all at the evaluation plane, are used as an inlet condition for another stationary simulation. The second step is repeated twice, and the resulting profiles were used as inlet conditions for the transient simulations.
Since the temperature increases over time, the temperature profile is scaled to meet the actual temperature inlet conditions. This leads to a change in density; therefore, the velocity profile needs to be scaled accordingly to ensure a constant mass flow rate.
This scaled velocity profile is then used as a component-wise boundary condition. In Section 3.1, the velocity profile boundary condition with an average temperature of 303.15 K is shown.
The temperature profile at the evaluation plane is evaluated at every time-step and is scaled according to a linear temperature ramp
in order to reach a mean temperature of 950 °C after 2 h. In Equation (2), all constants are described using the unit degrees Kelvin, resulting in a temperature , which is also specified in degrees Kelvin. This leads to a scaling of the temperature profile according to Equation (3).
Averaging in the case of is achieved by calculating the mass flow average. On the outlet depicted in red, there is a pressure boundary condition assuming ambient pressure. This condition is equally applied in all three simulation setups.
The wall boundary conditions are shown in Table 1.

Table 1.
Wall boundary conditions.
The properties of the used materials are shown in Table 2.
Table 2.
Material properties.
A NASA 9-coefficient polynomial according to Equation (4) was used for the specific heat of air:
Meanwhile, Sutherland’s law, as shown in Equation (5), was used for the viscosity of air:
with a reference viscosity of , a reference temperature of K, and an effective temperature of .
For each transient simulation, the entire domain consisting of bricks, walls, and air was initialized with a temperature of K.
2.2. Numerical Setup
All simulations were performed using the commercial software Ansys® Fluent, Release 23.2. To model turbulent airflow, unsteady Reynolds-averaged Navier–Stokes equations (URANS) using the shear stress transport (SST) model introduced by Menter et al. [21], which is considered the gold standard for industrial-scaled CFD applications, was applied. Radiation was modeled using the surface-to-surface (S2S) model, which assumes the surfaces to be gray and diffuse. The emissivity and absorptivity of a gray surface are independent of the wavelength and equal to each other according to Kirchoff’s law [22]. A maximum of five iterations were used for radiation. The advection term was discretized by a second-order upwind scheme, while the turbulence was approximated by a first-order scheme. Convergence was checked by the residuals, and key variables were monitored across iterations. For transient simulations, a time step size of s was used with a maximum of eight iterations per time step, which was found to be sufficient.
The mesh was created using Ansys Mechanical, and the metrics as well as the cell count are shown in Table 3. The mesh was fully hex type and was generated only for one section according to the domain displayed in Figure 2. In the case of the offset setting, this led to the requirement of a static general grid interface (GGI) between the differently placed bricks.
Table 3.
Mesh metrics.
2.3. Grid Independence Study
A grid independence study (GIS) was used in accordance with the approach of Celik et al. [23] to demonstrate sufficient mesh size. As such, the representative cell size h was increased and decreased by one-third while keeping constant. This led to three mesh sizes later referred to as 1—course, 2—medium, and 3—fine.
The representative cell size h for the three-dimensional case was defined by
with N being the total number of cells and being the volume of the i-th cell. Next, one or more key parameters for the analysis, like temperature or total pressure, were chosen. In the next step, the order of the accuracy was calculated as
with
and
where r is the refinement factor from one mesh to another. This set of equations can be solved using fixed-point iteration with an initial guess for p. The absolute value of p (Equation (7)) ensures extrapolation towards . The convergence study was verified by comparing different parameters with their extrapolated value
for a normalized grid size . The extrapolation ansatz was based on Richardson [24] and was generalized by Roache [25] and Celik et al. [23] in addition to being successfully applied by Cadafalch et al. [26], among others. The grid convergence was evaluated using the discriminating ratio
and the grid convergence index
as a measure of numerical uncertainty. Thus, is the relative error from the fine mesh to the medium mesh. In addition, a safety factor of was used, as suggested by Celic et al. [23] and other authors.
2.4. Global Performance Criteria
To analyze the behavior of fluid flow and heat transfer, several performance criteria were defined. To evaluate heat transfer, an effective heat transfer coefficient
as described by Schröder [27] was used. This formulation was based on the fundamental research published by Jeschar et al. [28]. The methodology was further evaluated in the context of brick firing by Vogt et al. [29]. Thus, is the air mass flow, is the specific heat coefficient, and A is the total airflow area. Moreover, is the volume-averaged temperature of the brick, while the indices and describe the inflow and outflow streams in planes shortly before and after the brick. For and , the average was computed as the mass flow average.
The pressure loss of the kiln was evaluated by a drag coefficient
which is the relation of the pressure loss to the dynamic pressure. In this equation, is calculated over four bricks, is the average velocity at the inlet plane, and is the average density at the inlet plane.
3. Results
3.1. Inlet Velocity Profile
As described in Section 2.1, stationary simulations were performed to generate a fully developed velocity, turbulent kinetic energy, and specific dissipation rate profile, which were used as the inlet conditions. In Figure 4, the velocity profile at a temperature of K is displayed.
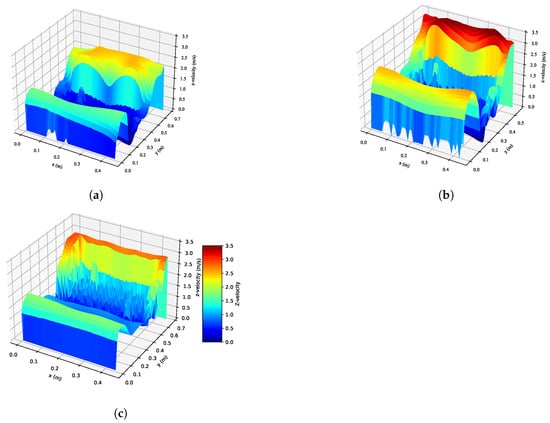
Figure 4.
Velocity profiles for the (a) large setup, (b) small setup, and (c) offset setup.
3.2. Grid Independence Study (GIS)
The results of the GIS are shown in Figure 5. As key variables, the average temperature, maximum temperature, and the temperature at the measurement point P1, as can be seen in Figure 6, of the brick were chosen. These are the most important parameters for the investigation. The medium mesh with around 6.2 million cells (see Table 3) was coarsened by a refinement factor of , leading to around 2.5 million cells. Simultaneously, it was refined to approximately 14.5 million cells by a refinement factor of .
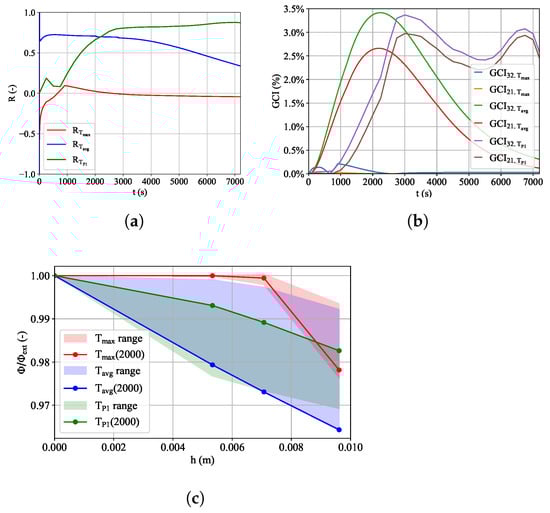
Figure 5.
Transient behavior of the mesh based on (a) R (b) GCI and (c) .
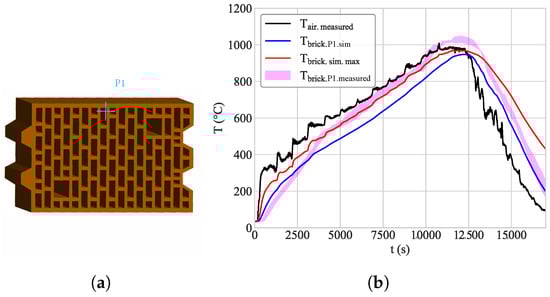
Figure 6.
(a) Position of the temperature sensor and (b) simulated and measured brick and air temperature in the cooling and heating zones.
In Figure 5, the transient results of the grid convergence study are shown. The convergence or discriminating ratio R for the average brick temperature and the temperature at P1 always remains between , suggesting monotonic convergence according to Ali et al. [30]. In the case of the maximum temperature, R lies between and from 1000 s until the end. This indicates oscillatory convergence in this section. This numerical oscillatory behavior occurs because the differences between the solutions of the fine and medium mesh are very small. Upon accessing , it can be seen that in most cases, its value stays well below , ensuring sufficient precision. Figure 5c shows the relative value of the simulated temperatures to the values of the Richardson extrapolation for all three meshes. The light red, light blue, and light green areas show the envelope of all time steps, while the three lines display examples at 2000 s. It can be seen that for the maximum temperature, the difference between the medium and fine mesh in all cases is around , supporting the chosen mesh size.
3.3. Experimental Model Validation
In order to evaluate the results, previously measured data were used and compared with the simulation results. A thermocouple placed in a 3 cm-deep hole on the front surface of the brick was used to measure its temperature during the heating and cooling process. Its position is shown in Figure 6a. In addition, the air temperature above the brick was measured. For validation, the measured air temperature, instead of the linear temperature ramp given in Equation (2), was used as a boundary condition in ANSYS Fluent. A comparison between the measured and simulated data is shown in Figure 6. The measured data depicted in magenta correspond to six sensors mounted at position P1 but on six different bricks. Although the measurements were taken at the same position on the brick, a difference in the temperature can be noticed. The reason for this is most likely a different heating profile across the whole oven width based on local flow and burner operation. While the brick heats up right at the beginning in the simulation, in the actual measurements, this process was delayed by around 300 s. One reason for this could be the mitigation of the remaining water from internal pores to the surface; the numerical model does not take into account these phenomena related to mass and heat transfer inside the porous medium, leading to a faster temperature increase in the beginning.
After those 300 s, the measured temperature increased faster than the simulated temperature. At 573 °C, the theoretical quartz inversion point [31] was reached, leading to a flattening of the firing curve due to a change in the crystal structure. This effect was not depicted in the simulation. After 4000 s, the measurement point showed a difference of around 50 K. This could be a result of the simplifications in the simulation model. As mentioned above, changes in the crystal structure and thermal reactions of the aggregates were not considered in the simulation. Another difference is that during the measurements, the kiln was heated by natural gas burners distributed over the length of the kiln. This led to discontinuities in the heating process that could not be covered in the simulations. Moreover, at the end of the burning zone, the brick temperature exceeded the air temperature as a result of carbon afterglow. Since this effect was not captured in the simulation, it resulted in a different starting point for the cooling. The mass flow in the cooling zone was scaled to 1 . However, since there were no reactions other than quartz inversion, the measured and experimental data fit better than in the heating zone.
Figure 7a,b show surface temperature graphs during brick heating and cooling. Although the average temperatures of the brick in the heating and cooling zones were roughly the same, it can be seen that the distribution was different. The higher mass flow in the cooling zone led to faster cooling at the top of the brick. Therefore, the location of the maximum temperature on the brick changed from the top of the brick during firing to the left side of the interior during cooling. Figure 7c shows the surface temperature after 12,000 s, which is at the end of the heating zone. In this stage, the brick was fully heated with a temperature spread of around 40 °C, while during the heating process, the temperature spread, on average, was around 120 °C.
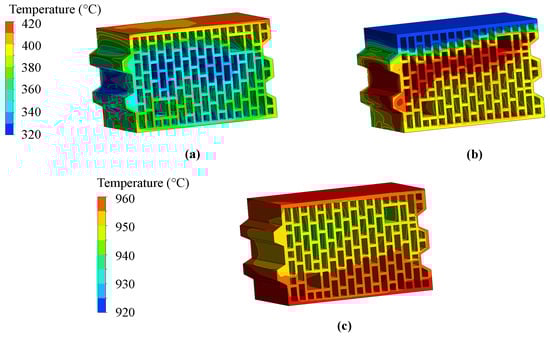
Figure 7.
Comparison of the brick temperatures after (a) 3000 s; (b) 16,200 s; (c) 12,000 s.
3.4. Comparison of the Three Setups
Figure 8 shows a comparison of the brick temperatures of the significant fourth brick between all three setups. The minimum temperature , the maximum temperature , and the average temperature are distinguished by color, while the individual setups are differentiated by the line style. The difference between the initial big setup and the small setup with the lower ceiling was just around 30 °C for and 65 °C for at the end of the simulated time. However, the offset setup greatly outperformed both of the others, reaching a higher by 120 °C and a higher by 160 °C compared to the big setup. Furthermore, the temperature spread within the brick, which is a measure of product quality, was improved by 100 °C.
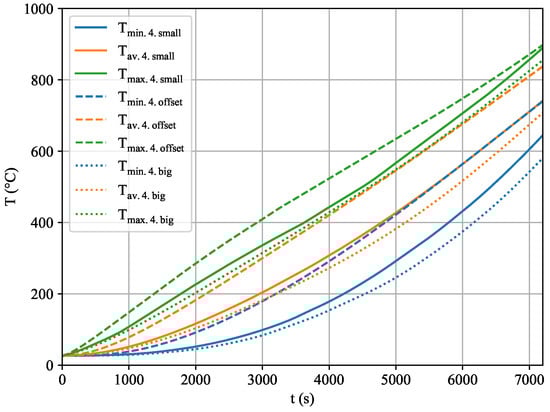
Figure 8.
Comparison of the brick temperature between three different setups.
Figure 9 shows a plot of the static temperature in the kiln cross section in the three setups after 2000 s. It can be seen that three temperature zones formed in the big and small setups: the hottest zone above the bricks where the airflow is undisturbed, a slightly cooler zone beneath the bricks where the flow barriers are in place, and a significantly cooler zone in the location of the bricks. As there was little to no mixing between these zones, heat transfer was limited between these streams. The temperature was distributed more evenly in the offset setup. The staggered brick configuration redirected and mixed the airflow, improving temperature distribution within both the kiln and the bricks. This resulted in increased heat transfer to the bricks despite lower local airflow velocities, which can be seen in Figure 10. In general, it can be stated that, for the small setup, the increased velocity at the top contributed to enhanced heat transfer. Conversely, in the offset setup, the elevated velocities around the entire brick, as well as within its holes, resulted in an even greater enhancement of heat transfer.
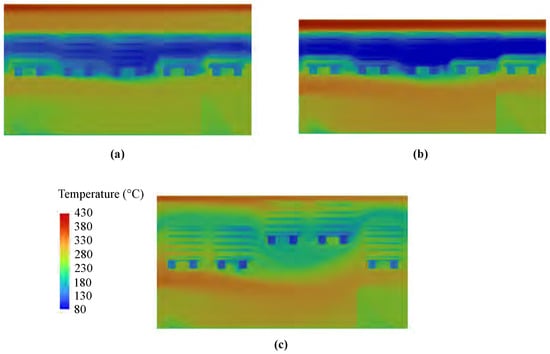
Figure 9.
Temperature plot at 2000 s for the (a) big, (b) small, and (c) offset setups.
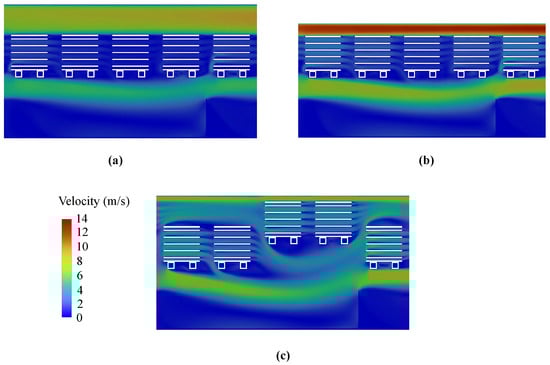
Figure 10.
Velocity plot at 5000 s for the (a) big, (b) small, and (c) offset setups.
Figure 11a shows as a measure of heat transfer from the fourth brick. The results show that lowering the ceiling improved , thus enhancing heat transfer by up to , while the staggered brick configuration led to an increase of more than . Another important parameter is pressure loss, which is contrary to the efficiency of the kiln, since it corresponds to the energy input of the fan. The drag coefficient is used as a measure of pressure loss. In Figure 11b is plotted over time for all three setups. It can be seen that was around three- to five-times higher in the offset setup than in the big setup. The higher degree of mixing led to better heat transfer but simultaneously to higher pressure loss. That is a trade-off that has to be considered based on the kiln fan setup. The mass flow difference between the cooling zone and the heating zone is achieved by a blowing and a suction fan (see Figure 1). The additional pressure loss can be compensated for by optimizing the fan system and upgrading the van power. A simplified assumption using volume flow rates and pressure losses leads to a power requirement of 1.5 kW, while one could save around 50 kW heating power based on an average temperature difference of approximately 120 °C. The bigger problem with the increased pressure loss is the leakages in the kiln, which have to be overcome by the fan system.
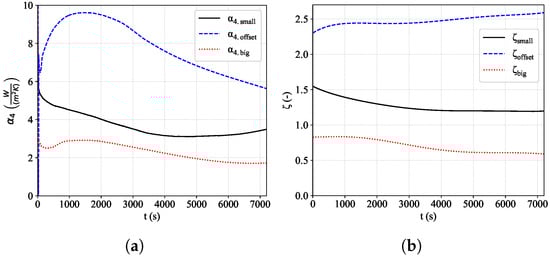
Figure 11.
(a) Heat transfer coefficient of the fourth brick and the (b) pressure loss coefficient for four bricks during the heating process.
To investigate whether the benefits would be as significant using the measured temperature, further simulations using the measured air temperature as the inlet condition were performed. Figure 12 shows the comparison between the big setup in blue and the offset setup in red. It can be seen that the average brick temperature in the offset setup followed the air temperature much more closely than in the big setup. This also supports the results from Figure 11 in which it can be seen that the staggered brick setting led to a highly increased heat transfer. Fully heated, the temperature spread decreased from around 35 K to 15 K, while during the heating process, the offset setup led to higher spreads. However, it has to be mentioned that the discontinuity of the air temperature curve is related to reactions within the brick during burning. Therefore, in reality, some of the highest temperature differences might be slightly lower. There is also the option of optimizing the firing curve in the offset setup. For example, if a spread of 35 K is sufficient in terms of product quality, it is possible to accelerate the process by around 1000 s.
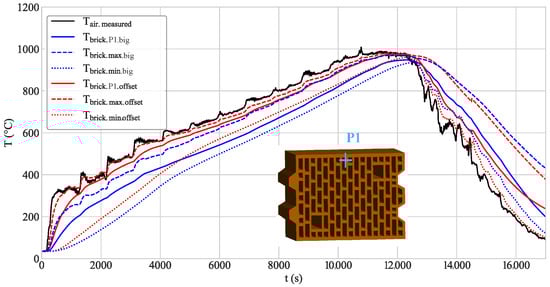
Figure 12.
Comparison between the big and offset setups in terms of air temperature ramp based on measurements.
Fully heated, the temperature spread decreased from around 35 K in the big setup to 15 K in the offset setup. This is because the brick in the offset setting was heated more uniformly, and, therefore, more thermal energy was absorbed.
In the cooling zone, the behavior was similar. Once again, higher convectional heat transfer values led to higher spreads at the beginning. However, close to the end at 16,000 s, the minimum of the offset setup was very close to the air temperature, leading to a significant decrease in the temperature spread. It can be concluded that the bricks in the offset setting adapt faster to temperature changes in their surroundings.
Figure 13 shows the difference between convective and radiative heat transfer. Similarly to Figure 14, it can be seen that the convective heat transfer had a stronger impact on the offset setup. The dominance of convection over radiation can be seen throughout the whole duration in the offset setup, whereas this behavior is not observed in the big setup. The sudden increase in air temperature at the beginning, however, also strongly affected the big setup. At first, convective heat transfer dominates over radiative heat transfer; over time, the radiative heat transfer’s impact exceeds that of convection. A convection-dominant process is generally advantageous when there is a high degree of mixing within the kiln, ensuring that not only the outer surfaces of the bricks but also the internal surfaces within the brick holes experience elevated air velocities. Radiation-dominant processes are limited by the fact that only surfaces directly exposed to the radiation source are effectively heated. Consequently, convection-dominant processes generally promote more uniform heating, resulting in a smaller temperature gradient within the brick, enhancing overall product quality. Therefore, even in brick kilns where heat is supplied solely through electrical heating elements, as in [7], it is essential to enhance convection for optimal heat distribution.
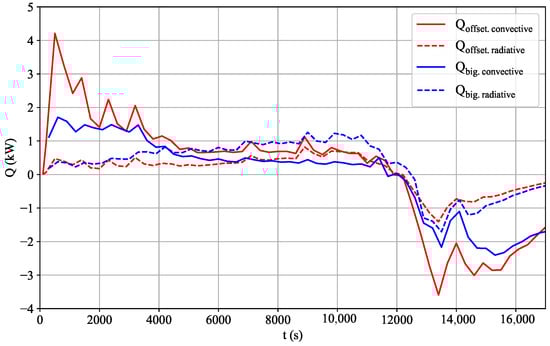
Figure 13.
Convectional and radiative heat transfer.
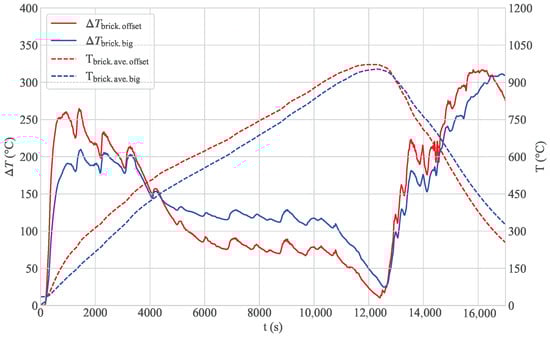
Figure 14.
Temperature spread in the brick T and average temperature from the big setup compared to those of the offset setup, with the air temperature ramp based on measurements.
4. Conclusions and Outlook
To improve the energy efficiency of a fast-firing brick kiln, two different modifications of the kiln aimed at improving heat transfer were tested. The first setting proposed a reduction of the top ceiling by approximately 25% compared to the initial kiln. For the second measure, the kiln stayed as it was, while the bricks were placed in a staggered setting by modifying the kiln cars. To investigate the change in heat transfer, CFD simulations were conducted. The model was validated by comparing the initial setup with measurements, and a sufficient agreement was reached considering simplifications such as neglecting chemical reactions within the firing process. Moreover, a transient grid independence study proved numerical convergence with a low GCI < for the brick temperature. The comparison of the three experimental setups showed a significant improvement in heat transfer in the offset setup with the staggered brick arrangement. Due to better airflow mixing, the significant fourth brick was able reach a higher average temperature by 130 °C and a higher minimum temperature of 160 °C after 2 h compared to the big setup. In other words, considering the minimum temperature, the duration of the firing process can be reduced by around 1000 s. This effect was also reflected in an increase in effective alpha —which is a measure of heat transfer—by around 300%. However, this came with a trade-off. The pressure loss tripled in this setup, resulting in a higher energy demand for the fan. As the mass flow in the heating zone is controlled by a suction fan, it could be possible to cover the additional pressure losses by adjusting it. To determine the exact sweet spot between heat transfer and pressure loss, further simulations will be conducted. The new offset setup was also subjected to a real firing curve in order to evaluate the performance compared to the original setup. Although the filing curve was optimized for the original setup, the huge potential of the offset brick setup was highlighted by a reduction of the final temperate explosion in the brick by around 50%. To validate these results, in the future, a measurement of the offset brick setting, including temperature and pressure measurements, will be performed.
Author Contributions
Conceptualization, J.U., M.S., S.P., S.V. and B.S.; methodology, J.U., M.S., S.G., S.P., S.V. and B.S.; formal analysis, J.U. and S.G.; investigation, J.U., M.S., S.G., S.P., S.V. and B.S.; resources, J.U., S.P. and S.V.; data creation, J.U., M.S. and S.G.; writing—original draft preparation, J.U. and M.S.; writing—review and editing, J.U., M.S., S.P., S.V. and B.S.; visualization, J.U., S.G. and M.S.; supervision, B.S. and S.V.; project administration, J.U. and S.V. All authors have read and agreed to the published version of the manuscript.
Funding
This publication has been conducted within the project “GreenBricks” (FFG no. 999894581). The project is supported with funds from the Climate and Energy Fund and implemented in the framework of the RTI-initiative “Flagship Region Energy”.
Data Availability Statement
The original contributions presented in the study are included in the article, further inquiries can be directed to the corresponding author.
Conflicts of Interest
Authors Stefan Puskas and Stefan Vogt were employed by the company Wienerberger AG. Author Bernhard Streibl was employed by the company DrS3—Strömungsberechnung und Simulation e.U. The remaining authors declare that the research was conducted in the absence of any commercial or financial relationships that could be construed as a potential conflict of interest.
Abbreviations
The following abbreviations are used in this manuscript:
| Acronyms | |
| CFD | Computational fluid dynamics |
| GGI | General grid interface |
| GIS | Grid independence study |
| Abbreviations | |
| h | Heat transfer coefficient () |
| Pressure difference (bar) | |
| Temperature spread (°C) | |
| Volume (m3) | |
| Drag coefficient (-) | |
| Parameter for GIS (undefined) | |
| Density () | |
| Thermal conductivity () | |
| Viscosity () | |
| A | Total brick surface (m2) |
| CFL | Courant–Friedrichs–Lewy number (-) |
| Specific heat coefficient () | |
| h | Representative cell height (m) |
| Mass flow () | |
| N | Number of cells (-) |
| p | Pressure (bar) |
| Order of accuracy (-) | |
| R | Discriminating ratio (-) |
| r | Refinement factor (-) |
| T | Temperature (°C) |
| v | Velocity () |
| Dimensionless wall distance (-) | |
| x | x-direction (m) |
| y | y-direction (m) |
| z | z-direction, main flow direction (m) |
| Subscripts | |
| 1 | Fine mesh |
| 2 | Medium mesh |
| 3 | Course mesh |
| ave | Average |
| eff | Effective |
| ext | Extrapolated |
| i | Counter cell number |
| in | Inlet |
| max | Maximum |
| min | Minimum |
| out | Outlet |
| ∞ | Undisturbed inflow |
References
- Abbas, A.; Sajid, M.B.; Iftikhar, M.A.; Khoja, A.H.; Ahmad, M.M.; Shahid, M.; Ullah, K. Assessment of long-term energy and environmental impacts of the cleaner technologies for brick production. Energy Rep. 2021, 7, 7157–7169. [Google Scholar] [CrossRef]
- Galan-Marin, C.; Rivera-Gomez, C.; Garcia-Martinez, A. Use of natural-fiber bio-composites in construction versus traditional solutions: Operational and embodied energy assessment. Materials 2016, 9, 465. [Google Scholar] [CrossRef] [PubMed]
- Vogt, S. Benefits and boundary conditions of fast firing clay building products (Part 1). ZI Brick Tile Ind. Int. 2017, 5, 35–43. [Google Scholar]
- Brick Development Association. UK Brick Sustainability Report 2022. Available online: https://www.brick.org.uk/uploads/downloads/Sustainability-Report-Template-1.8.f1675267411.pdf (accessed on 8 August 2024).
- Gomes, E.; Hossain, I. Transition from traditional brick manufacturing to more sustainable practices. Energy Sustain. Dev. 2003, 7, 66–76. [Google Scholar] [CrossRef]
- Weyant, C.; Kumar, S.; Maithel, S.; Thompson, R.; Baum, E.; Floess, E.; Bond, T. Brick kiln measurement guidelines: Emissions and energy performance. Paris Clim. Clean Air Coalit. 2016. [Google Scholar]
- Schieder, M.; Unterluggauer, J.; Puskas, S.; Vogt, S. Numerical simulations of a novel electrical heated brick firing kiln. In Proceedings of the 37th International Conference on Efficiency, Cost, Optimization, Simulation and Environmental Impact of Energy Systems, Rhodes, Greece, 30 June–5 July 2024. [Google Scholar]
- Vogt, S. Benefits and boundary conditions of fast firing clay building products (Part 2). ZI Brick Tile Ind. Int. 2017, 6, 29–38. [Google Scholar]
- Dondi, M.; Marsigli, M.; Venturi, I. Microstructure and mechanical properties of clay bricks: Comparison between fast firing and traditional firing. Br. Ceram. Trans. 1999, 98, 12–18. [Google Scholar] [CrossRef]
- Hauck, D.; Ruppik, M.; Petereit, S. Laborsimulation des Durchströmungsbrandes an Hochlochziegeln. In Zi-Jahrbuch 2005; Bauverlag BV GmbH Gütersloh: Gütersloh, Germany, 2005; pp. S.50–S.77. [Google Scholar]
- Gencel, O.; Sutcu, M.; Erdogmus, E.; Koc, V.; Cay, V.V.; Gok, M.S. Properties of bricks with waste ferrochromium slag and zeolite. J. Clean. Prod. 2013, 59, 111–119. [Google Scholar] [CrossRef]
- Makrygiannis, I.; Karalis, K. Optimizing Building Thermal Insulation: The Impact of Brick Geometry and Thermal Coefficient on Energy Efficiency and Comfort. Ceramics 2023, 6, 1449–1466. [Google Scholar] [CrossRef]
- Tasnim, F.; Istiaque, F.; Morshed, A.; Ahmad, M.U. A CFD investigation of conventional brick kilns. In Proceedings of the AIP Conference Proceedings; AIP Publishing: College Park, MD, USA, 2019; Volume 2121. [Google Scholar]
- Refaey, H.; Alharthi, M.A.; Salem, M.; Abdel-Aziz, A.A.; Abdelrahman, H.; Karali, M. Numerical investigations of convective heat transfer for lattice settings in brick tunnel Kiln: CFD simulation with experimental validation. Therm. Sci. Eng. Prog. 2021, 24, 100934. [Google Scholar] [CrossRef]
- Alrahmani, M.; Almesri, I.; Almutairi, J.; Abou-Ziyan, H. Combined Effect of Brick Surface Roughness and Lattice Setting Density on Brick Firing in Tunnel Kilns. Energies 2022, 15, 5670. [Google Scholar] [CrossRef]
- Nagy, J.; Horvath, A.; Jordan, C.; Harasek, M. CFD simulation of a high temperature furnace. In Proceedings of the 8th International Conference on CFD in Oil & Gas, Metallurgical and Process Industries, Trondheim, Norway, 21–23 June 2011. [Google Scholar]
- Rzig, R.; Khedher, N.B.; Nasrallah, S.B. Three-dimensional simulation of mass and heat transfer in drying unsaturated porous medium. Heat Transf. Res. 2017, 48, 985–1005. [Google Scholar] [CrossRef]
- de Vasconcellos Araújo, M.; Raquel de Brito Correia, B.; Alves Agra Brandão, V.; Rodrigues de Oliveira, I.; Sousa Santos, R.; de Oliveira Neto, G.L.; de Lucena Silva, L.P.; Gilson Barbosa de Lima, A. Convective drying of ceramic bricks by CFD: Transport phenomena and process parameters analysis. Energies 2020, 13, 2073. [Google Scholar] [CrossRef]
- Santos, R.; Delgado, J.; Silva, F.; Azevedo, A.; Farias Neto, S.; Farias, F.; Barbosa de Lima, A.; Barbosa de Lima, W.; Lima, E. Behind the manufacturing of industrial clay bricks: Drying stage predictions using CFD. Adv. Mater. Sci. Eng. 2022, 2022, 5530362. [Google Scholar] [CrossRef]
- Gutschka, S. Numerical investigations on heat transfer in a fast firing brick kiln. Master’s Thesis, TU Wien, Vienna, Austria, 2024. [Google Scholar]
- Menter, F. Zonal two equation kw turbulence models for aerodynamic flows. In Proceedings of the 23rd Fluid Dynamics, Plasmadynamics, and Lasers Conference, Orlando, FL, USA, 6–9 July 1993; p. 2906. [Google Scholar]
- Modest, M.F.; Mazumder, S. Radiative Heat Transfer; Academic Press: Cambridge, MA, USA, 2021. [Google Scholar]
- Celik, I.B.; Ghia, U.; Roache, P.J.; Freitas, C.J. Procedure for estimation and reporting of uncertainty due to discretization in CFD applications. J. Fluids-Eng.Trans. Asme 2008, 130. [Google Scholar] [CrossRef]
- Richardson, L.F., IX. The approximate arithmetical solution by finite differences of physical problems involving differential equations, with an application to the stresses in a masonry dam. Philos. Trans. R. Soc. London. Ser. Contain. Pap. Math. Phys. Character 1911, 210, 307–357. [Google Scholar]
- Roache, P.J. Verification and Validation in Computational Science and Engineering; Hermosa: Albuquerque, NM, USA, 1998; Volume 895. [Google Scholar]
- Cadafalch, J.; Pérez Segarra, C.; Consul, R.; Oliva, A. Verification of finite volume computations on steady-state fluid flow and heat transfer. J. Fluids Eng. 2002, 124, 11–21. [Google Scholar] [CrossRef]
- Schröder, U. Modellversuche über Druckverlust und Wärmeübergang in Gitterförmigen Tunnelfenbesatz. Ph.D. Thesis, Technical University of Clausthal, Clausthal-Zellerfeld, Germany, 1971. [Google Scholar]
- Jeschar, R.; Alt, R.; Specht, E. Grundlagen der Wärmeübertragung; Viola-Jeschar-Verlag: Goslar, Germany, 1990. [Google Scholar]
- Vogt, S.; Nover, K. Zur Anwendung von Computermodellen für die Auslegung und Optimierung von grobkeramischen Tunnelöfen. In Zi-Jahrbuch 1992; Bauverlag: Wiesbaden, Germany, 1992; pp. S.74–S.87. [Google Scholar]
- Ali, M.S.M.; Doolan, C.J.; Wheatley, V. Grid convergence study for a two-dimensional simulation of flow around a square cylinder at a low Reynolds number. In Proceedings of the Seventh International Conference on CFD in The Minerals and Process Industries (ed. PJ Witt & MP Schwarz), Melbourne, Australia, 9–11 December 2009; pp. 1–6. [Google Scholar]
- Sun, Q.; Lü, C.; Cao, L.; Li, W.; Geng, J.; Zhang, W. Thermal properties of sandstone after treatment at high temperature. Int. J. Rock Mech. Min. Sci. 2016, 85, 60–66. [Google Scholar] [CrossRef]
Disclaimer/Publisher’s Note: The statements, opinions and data contained in all publications are solely those of the individual author(s) and contributor(s) and not of MDPI and/or the editor(s). MDPI and/or the editor(s) disclaim responsibility for any injury to people or property resulting from any ideas, methods, instructions or products referred to in the content. |
© 2024 by the authors. Licensee MDPI, Basel, Switzerland. This article is an open access article distributed under the terms and conditions of the Creative Commons Attribution (CC BY) license (https://creativecommons.org/licenses/by/4.0/).