

Energy Planning of Renewable Energy Sources in an Italian Context: Energy Forecasting Analysis of Photovoltaic Systems in the Residential Sector


Abstract
1. Introduction
- (1)
- Is it possible to use only the roof surface of existing buildings for the new installations of photovoltaic panels?
- (2)
- What could be the productivity of the photovoltaic panels by 2050 and what could be the theoretical maximum power that could be placed on the roof surface of existing buildings?
- (3)
- Would it be possible to meet European targets by placing photovoltaic panels only on the roof surfaces of existing buildings?
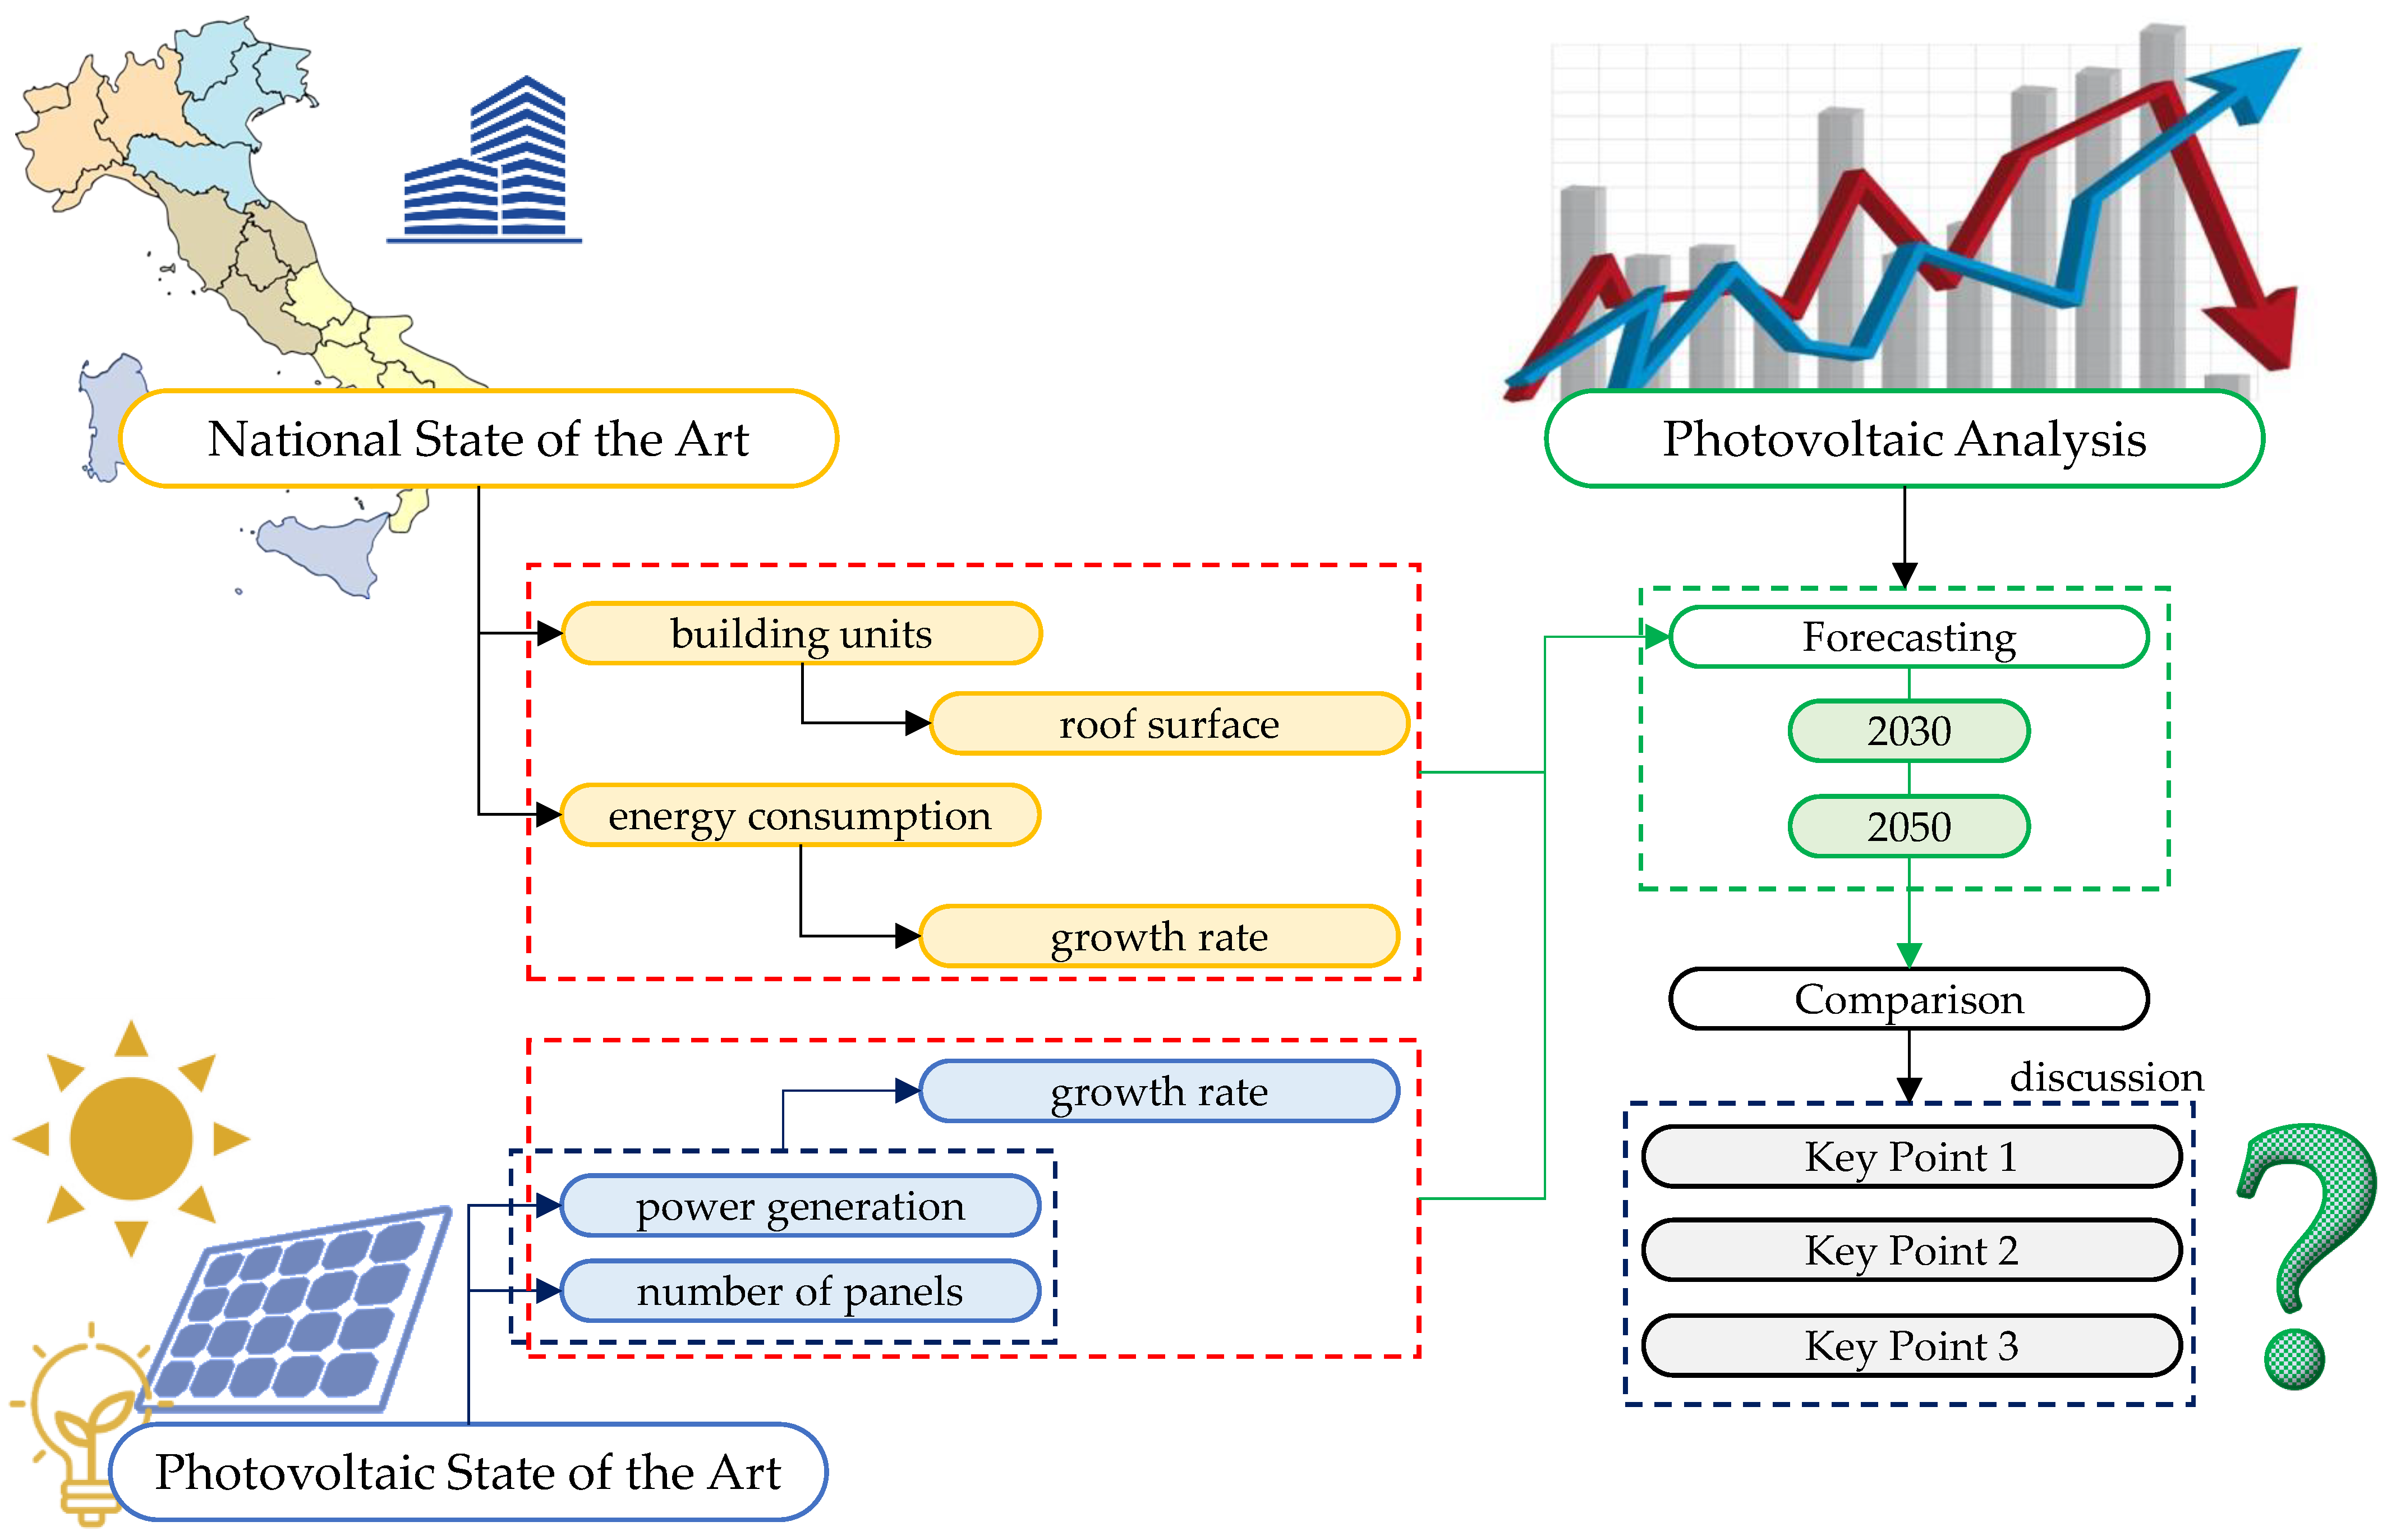
2. Materials and Methods
- Northwest: including Valle d’Aosta, Piemonte, Liguria, and Lombardia regions;
- Northeast: including Trentino, Friuli Venezia Giulia, Veneto, and Emilia Romagna;
- Centre: grouping Toscana, Umbria, Marche, and Lazio;
- South: grouping Abruzzo, Campania, Molise, Puglia, Basilicata, and Calabria;
- Islands: including the two islands of Sicilia and Sardegna.
- Growth rate of energy consumption (GREC): this was calculated considering the annual growth rates from 2014 (see Section 2.1);
- Growth rate of photovoltaic panels (GRPhV): this was calculated considering the annual growth rates from 2016 (see Section 2.2);
- Development rate of photovoltaic panels (DRP-PhV): this was calculated considering the annual development rates recorded from 2016 (see Section 2.2).
2.1. Energy Consumption of National Buildings Stock
2.2. Photovoltaic Systems: Growth and Development Rates and Energy Production
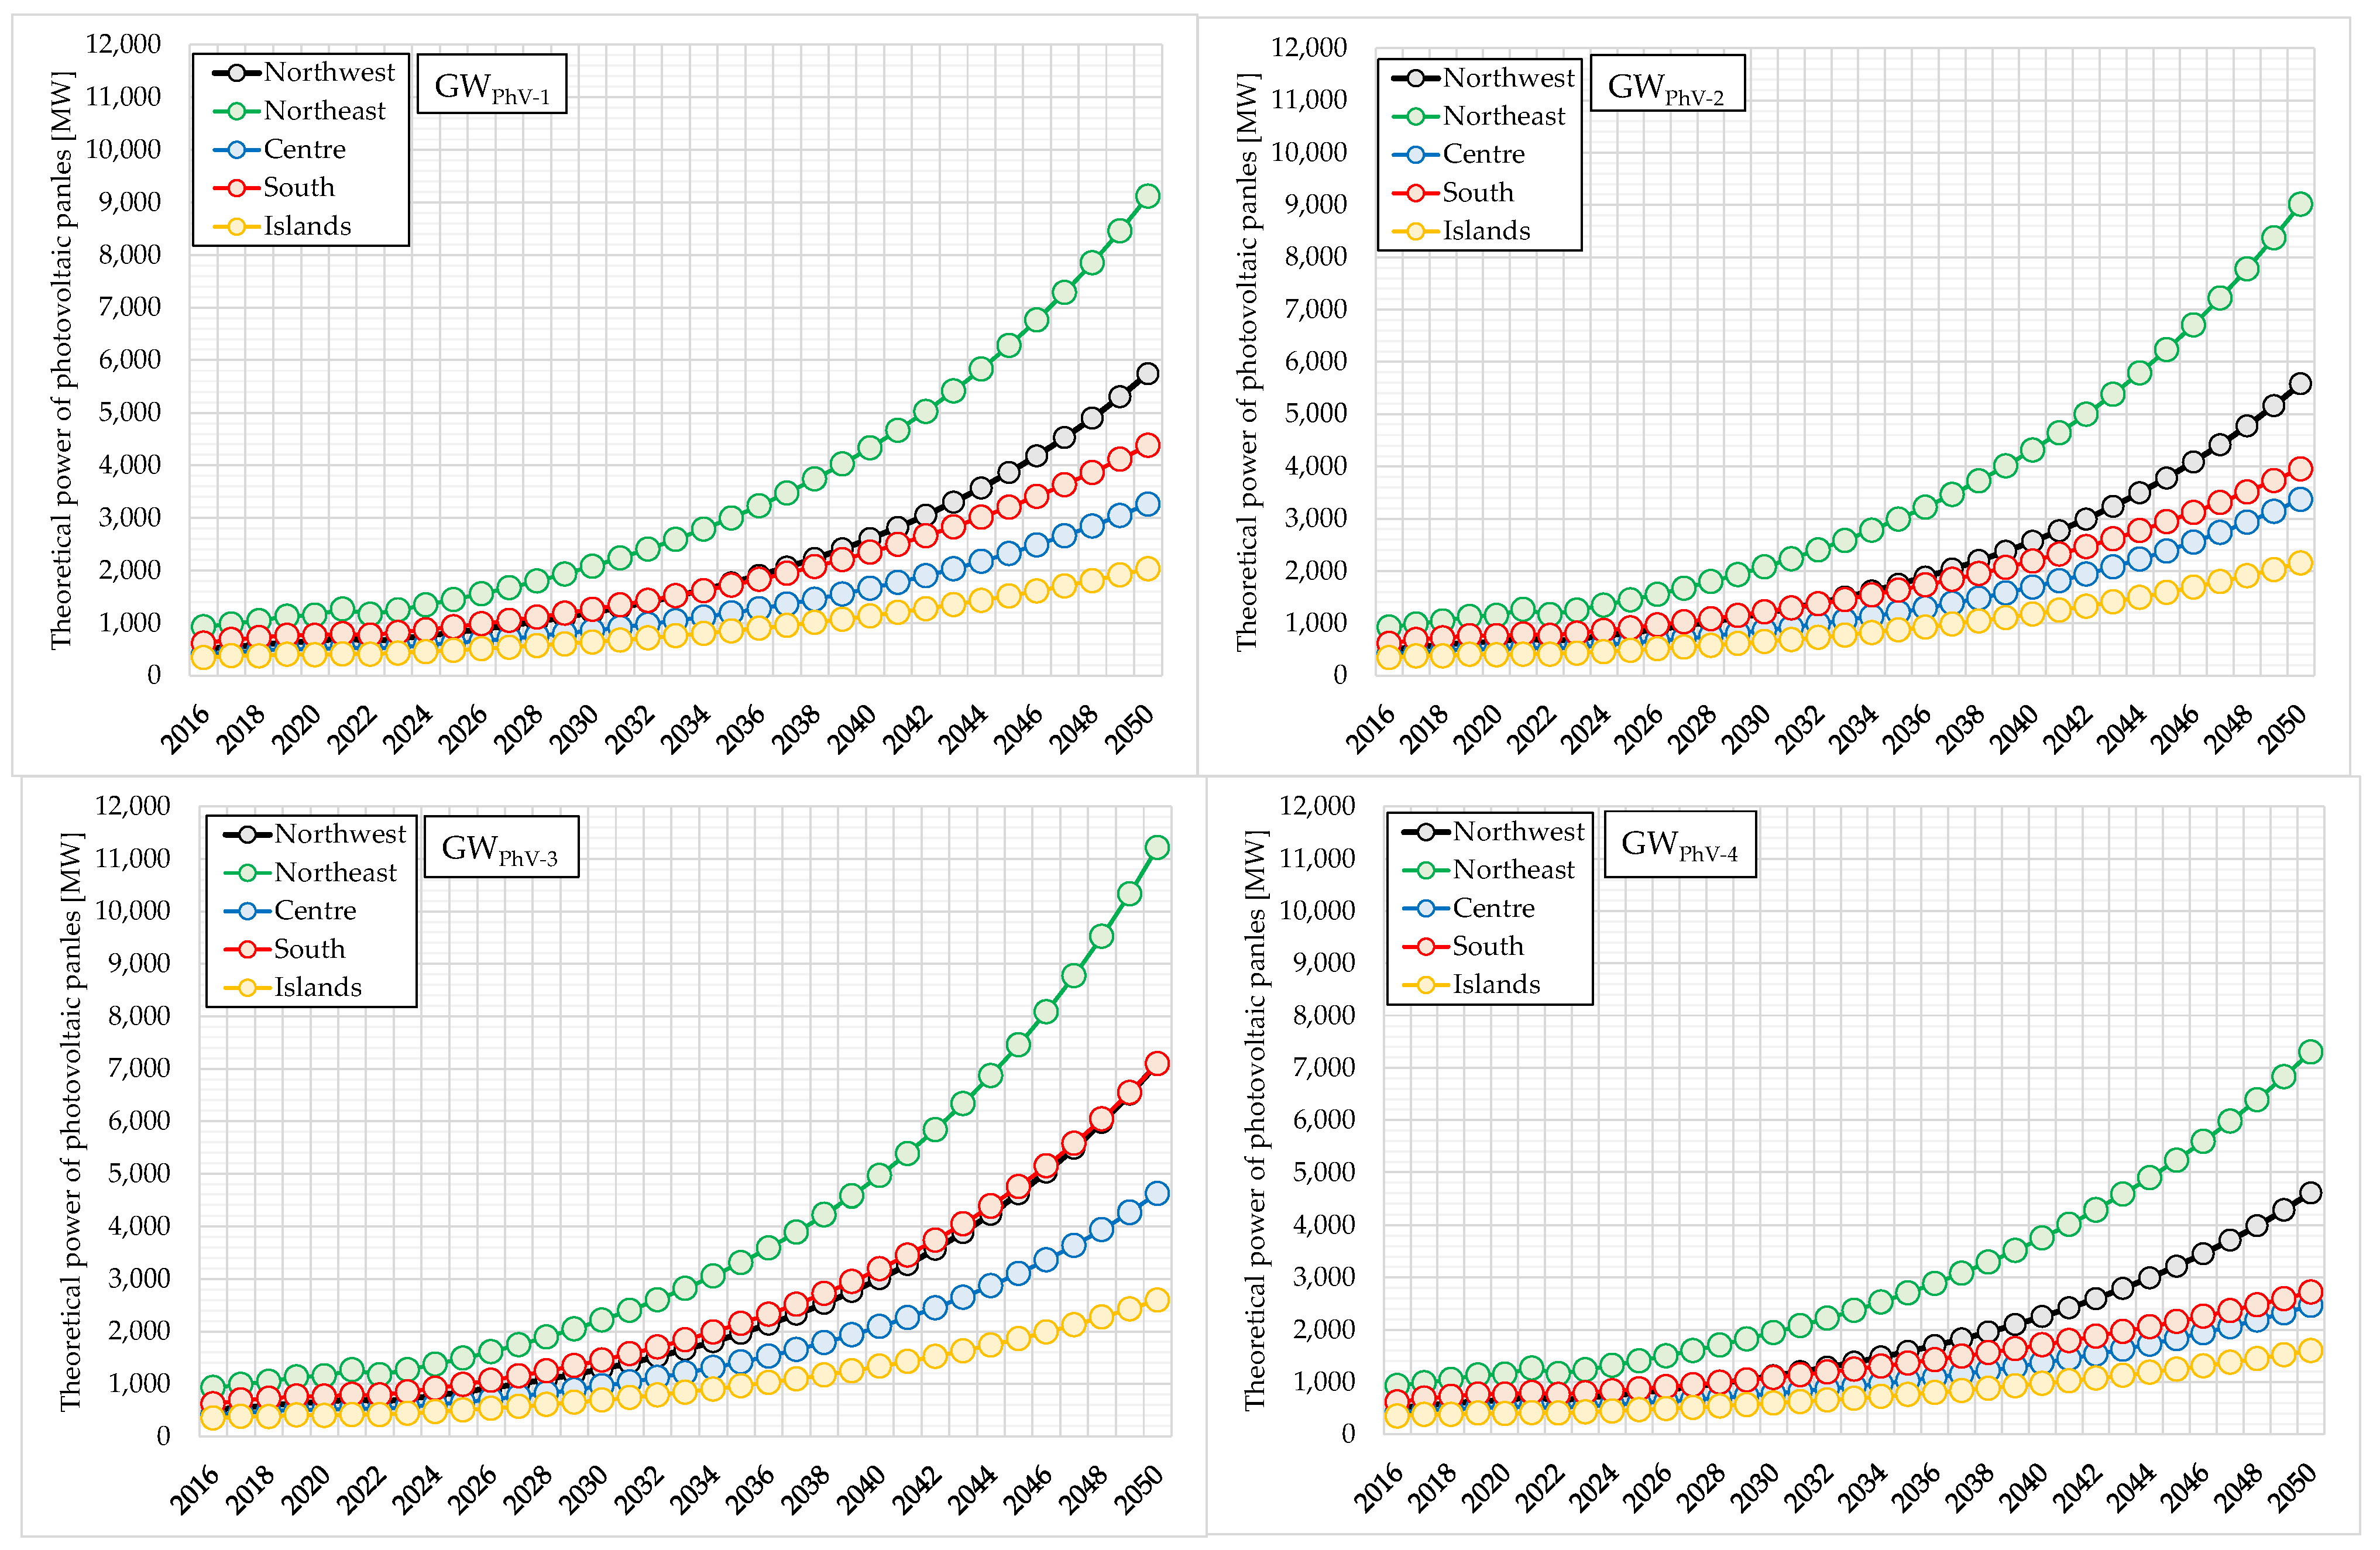
- GRPhV-1: this was assessed as the mean value considering all of the available data from 2016 to 2021;
- GRPhV-2: this was assessed as the mean value considering all of the available data by excluding the extreme values (i.e., the minimum and the maximum values in order to neglect the effect of the last national incentive (Superbonus), which led to a significant increase in the number of new installations in many regions);
- GRPhV-3: this was assessed as the maximum value considering all of the available data but excluding the extreme values;
- GRPhV-4: this was assessed as the minimum value considering all of the available data but excluding the extreme values.
2.3. National Building Stock: Roof Surface Area Calculation
- Step 1: a correlation between the number of buildings per number of floors (the National Institute of Statistics groups data into “one floor”, “two floors”, “three floors”, and “four and more floors”) and the number of buildings per building units (data grouped into “one unit”, “two units”, “three or four units”, “from five to eight units”, “from nine to fifteen units”, and “more than sixteen units”) was attempted;
- Step 2: the total net surface area of building units was assessed by correlating data obtained from step 1 and the number of building units per specific net surface range provided by [5] (data groups into “≤29 m2”, “30–39 m2”, “40–49 m2”, “50–59 m2”, “60–79 m2”, “80–99 m2”, “100–119 m2”, “120–149 m2”, and “≥150 m2”);
- Step 3: for the buildings falling into the group “four or more floors” provided by [5], an average and weighted height was assessed varying the number of the floors in the 4–14 range based on the number of building units;
- Step 4: for each group of buildings (“one floor”, “two floors”, “three floors”, and “four and more floors”), the total net surface area was assessed and divided for the height of the buildings, calculating the theoretical roof surface area of existing buildings.
- buildings on “one floor” were considered buildings with only one building unit;
- buildings on “two floors” were associated with buildings from one to four building units;
- buildings on “three floors” were considered as buildings from two to eight building units;
- buildings on “four or more floors” were associated with buildings with more than four building units.
3. Results and Discussion
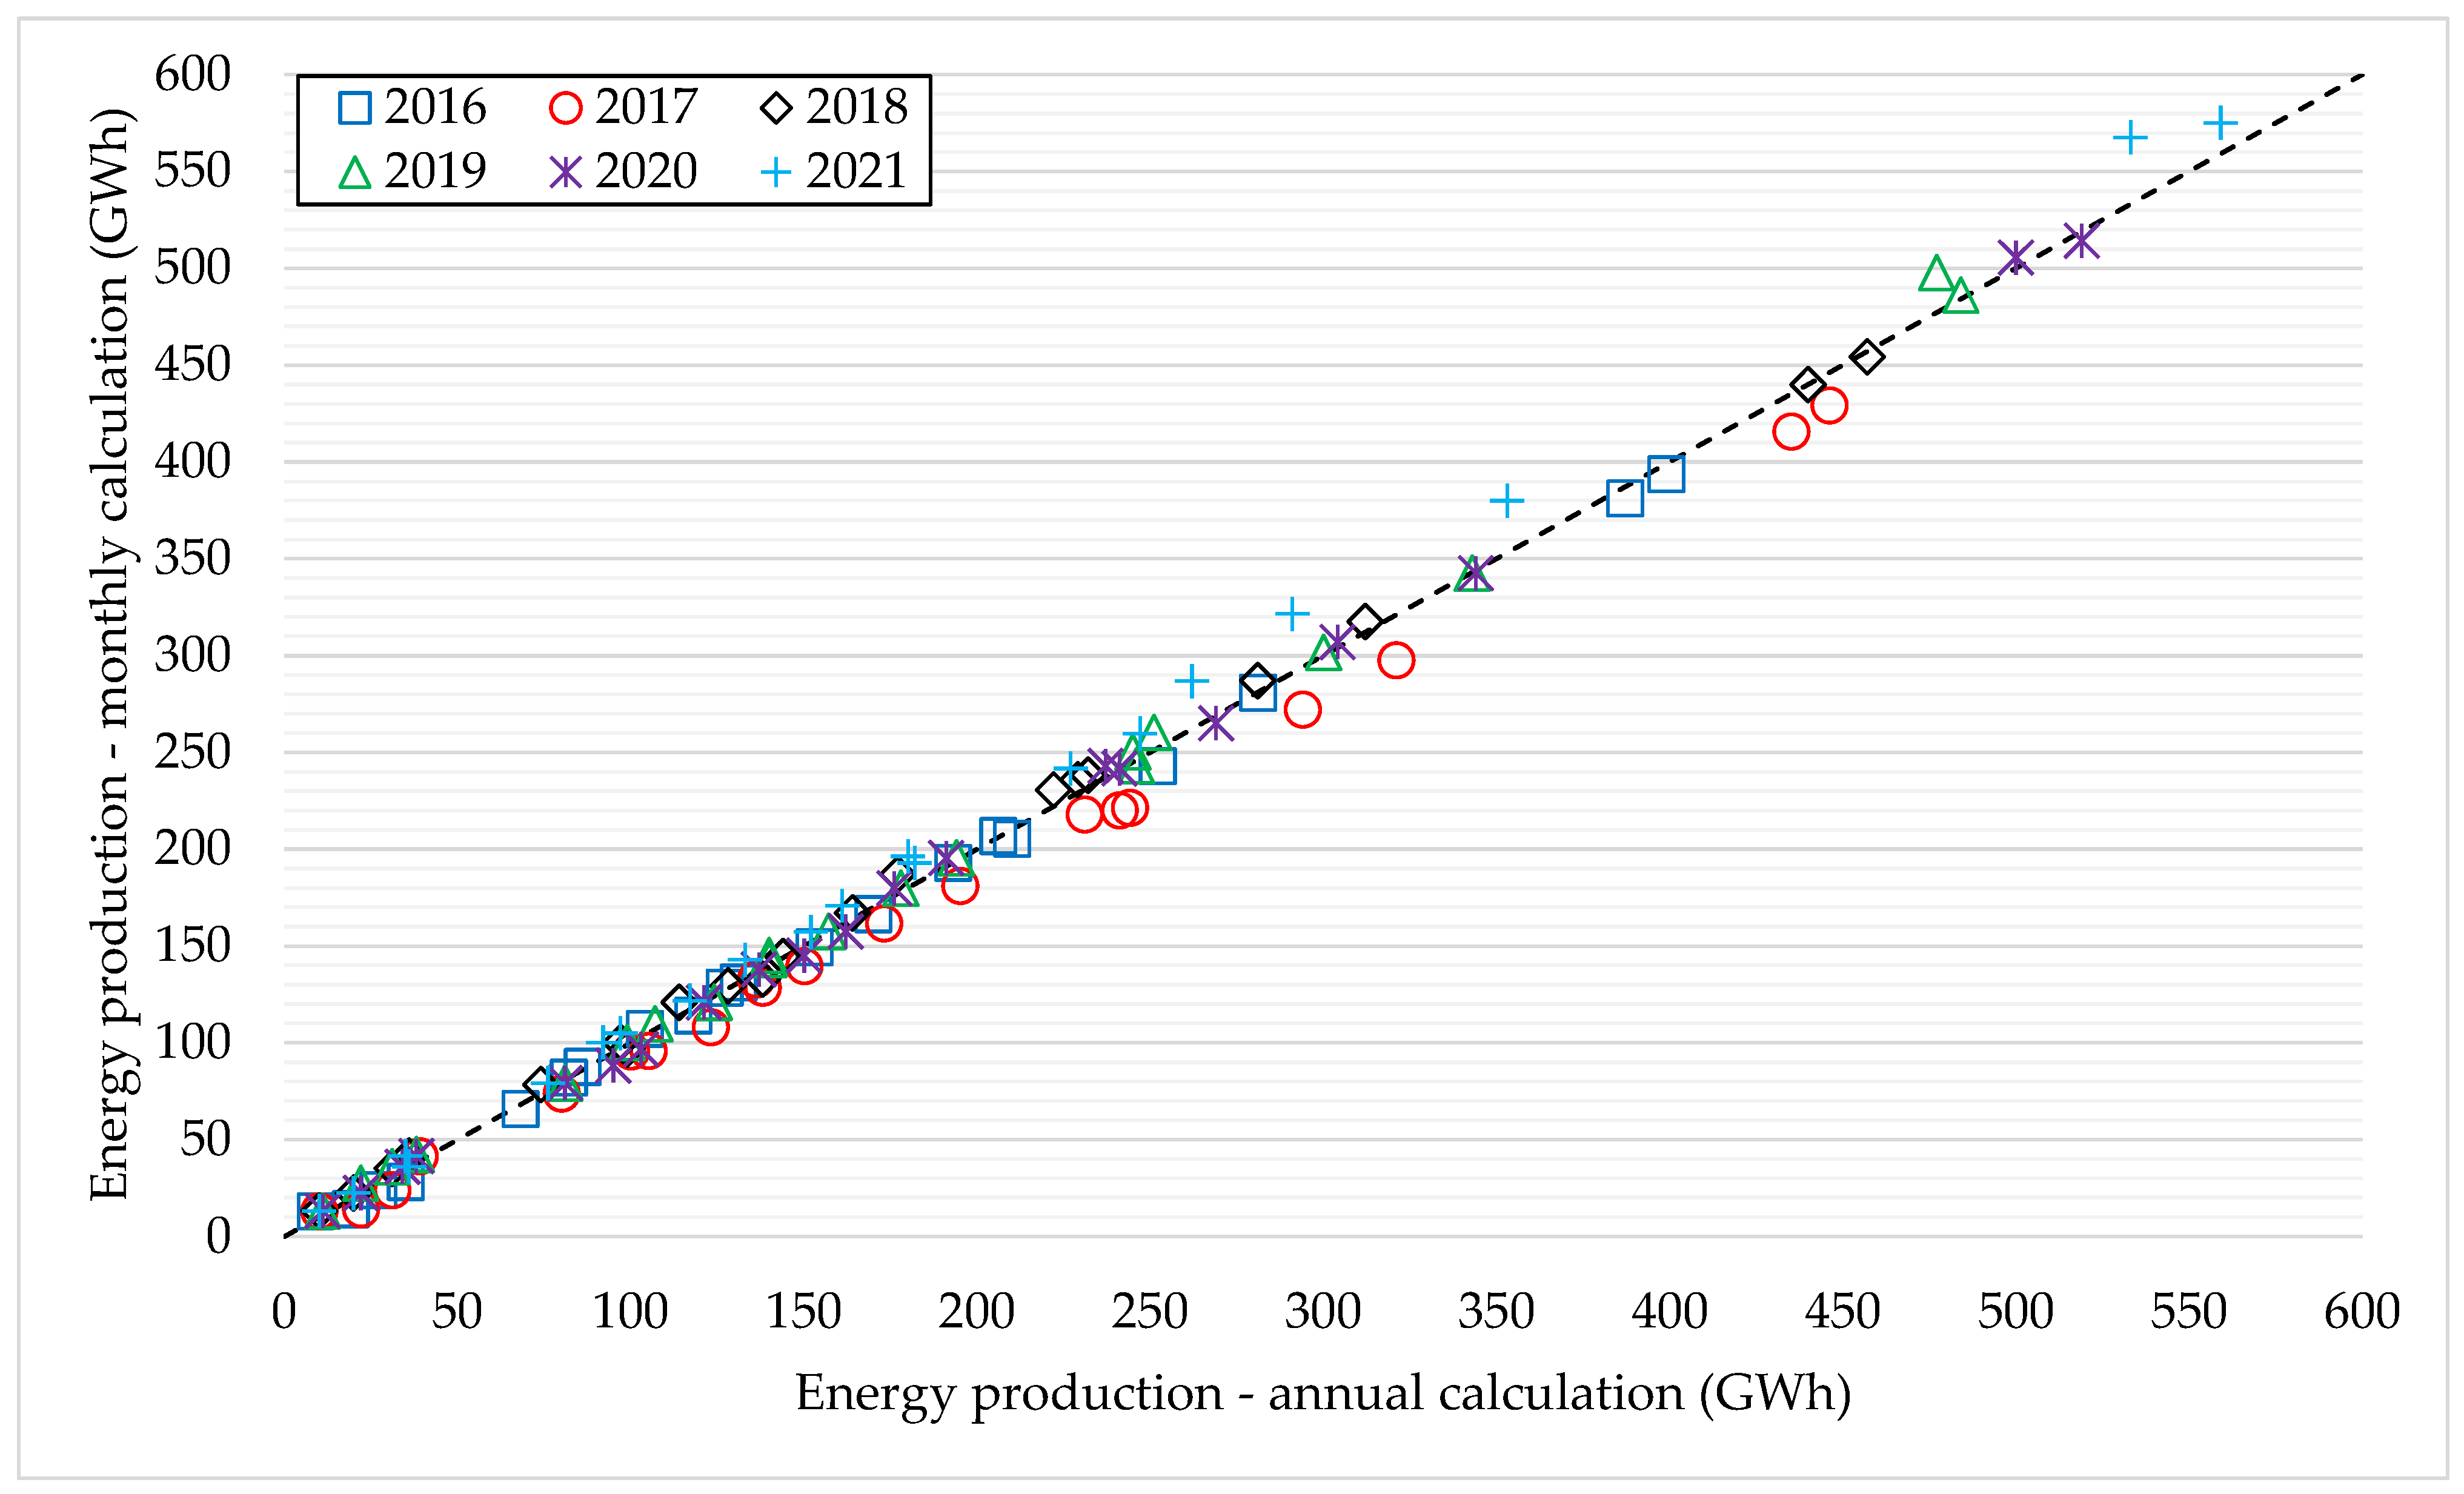
3.1. Photovoltaic Energy Production: Annual vs. Monthly Calculations
- The energy production per m2 of a photovoltaic system with monthly steps is assessed according to the solar atlas provided by the Energy Services Manager for each region and investigated year [41];
3.2. Photovoltaic Energy Forecasting
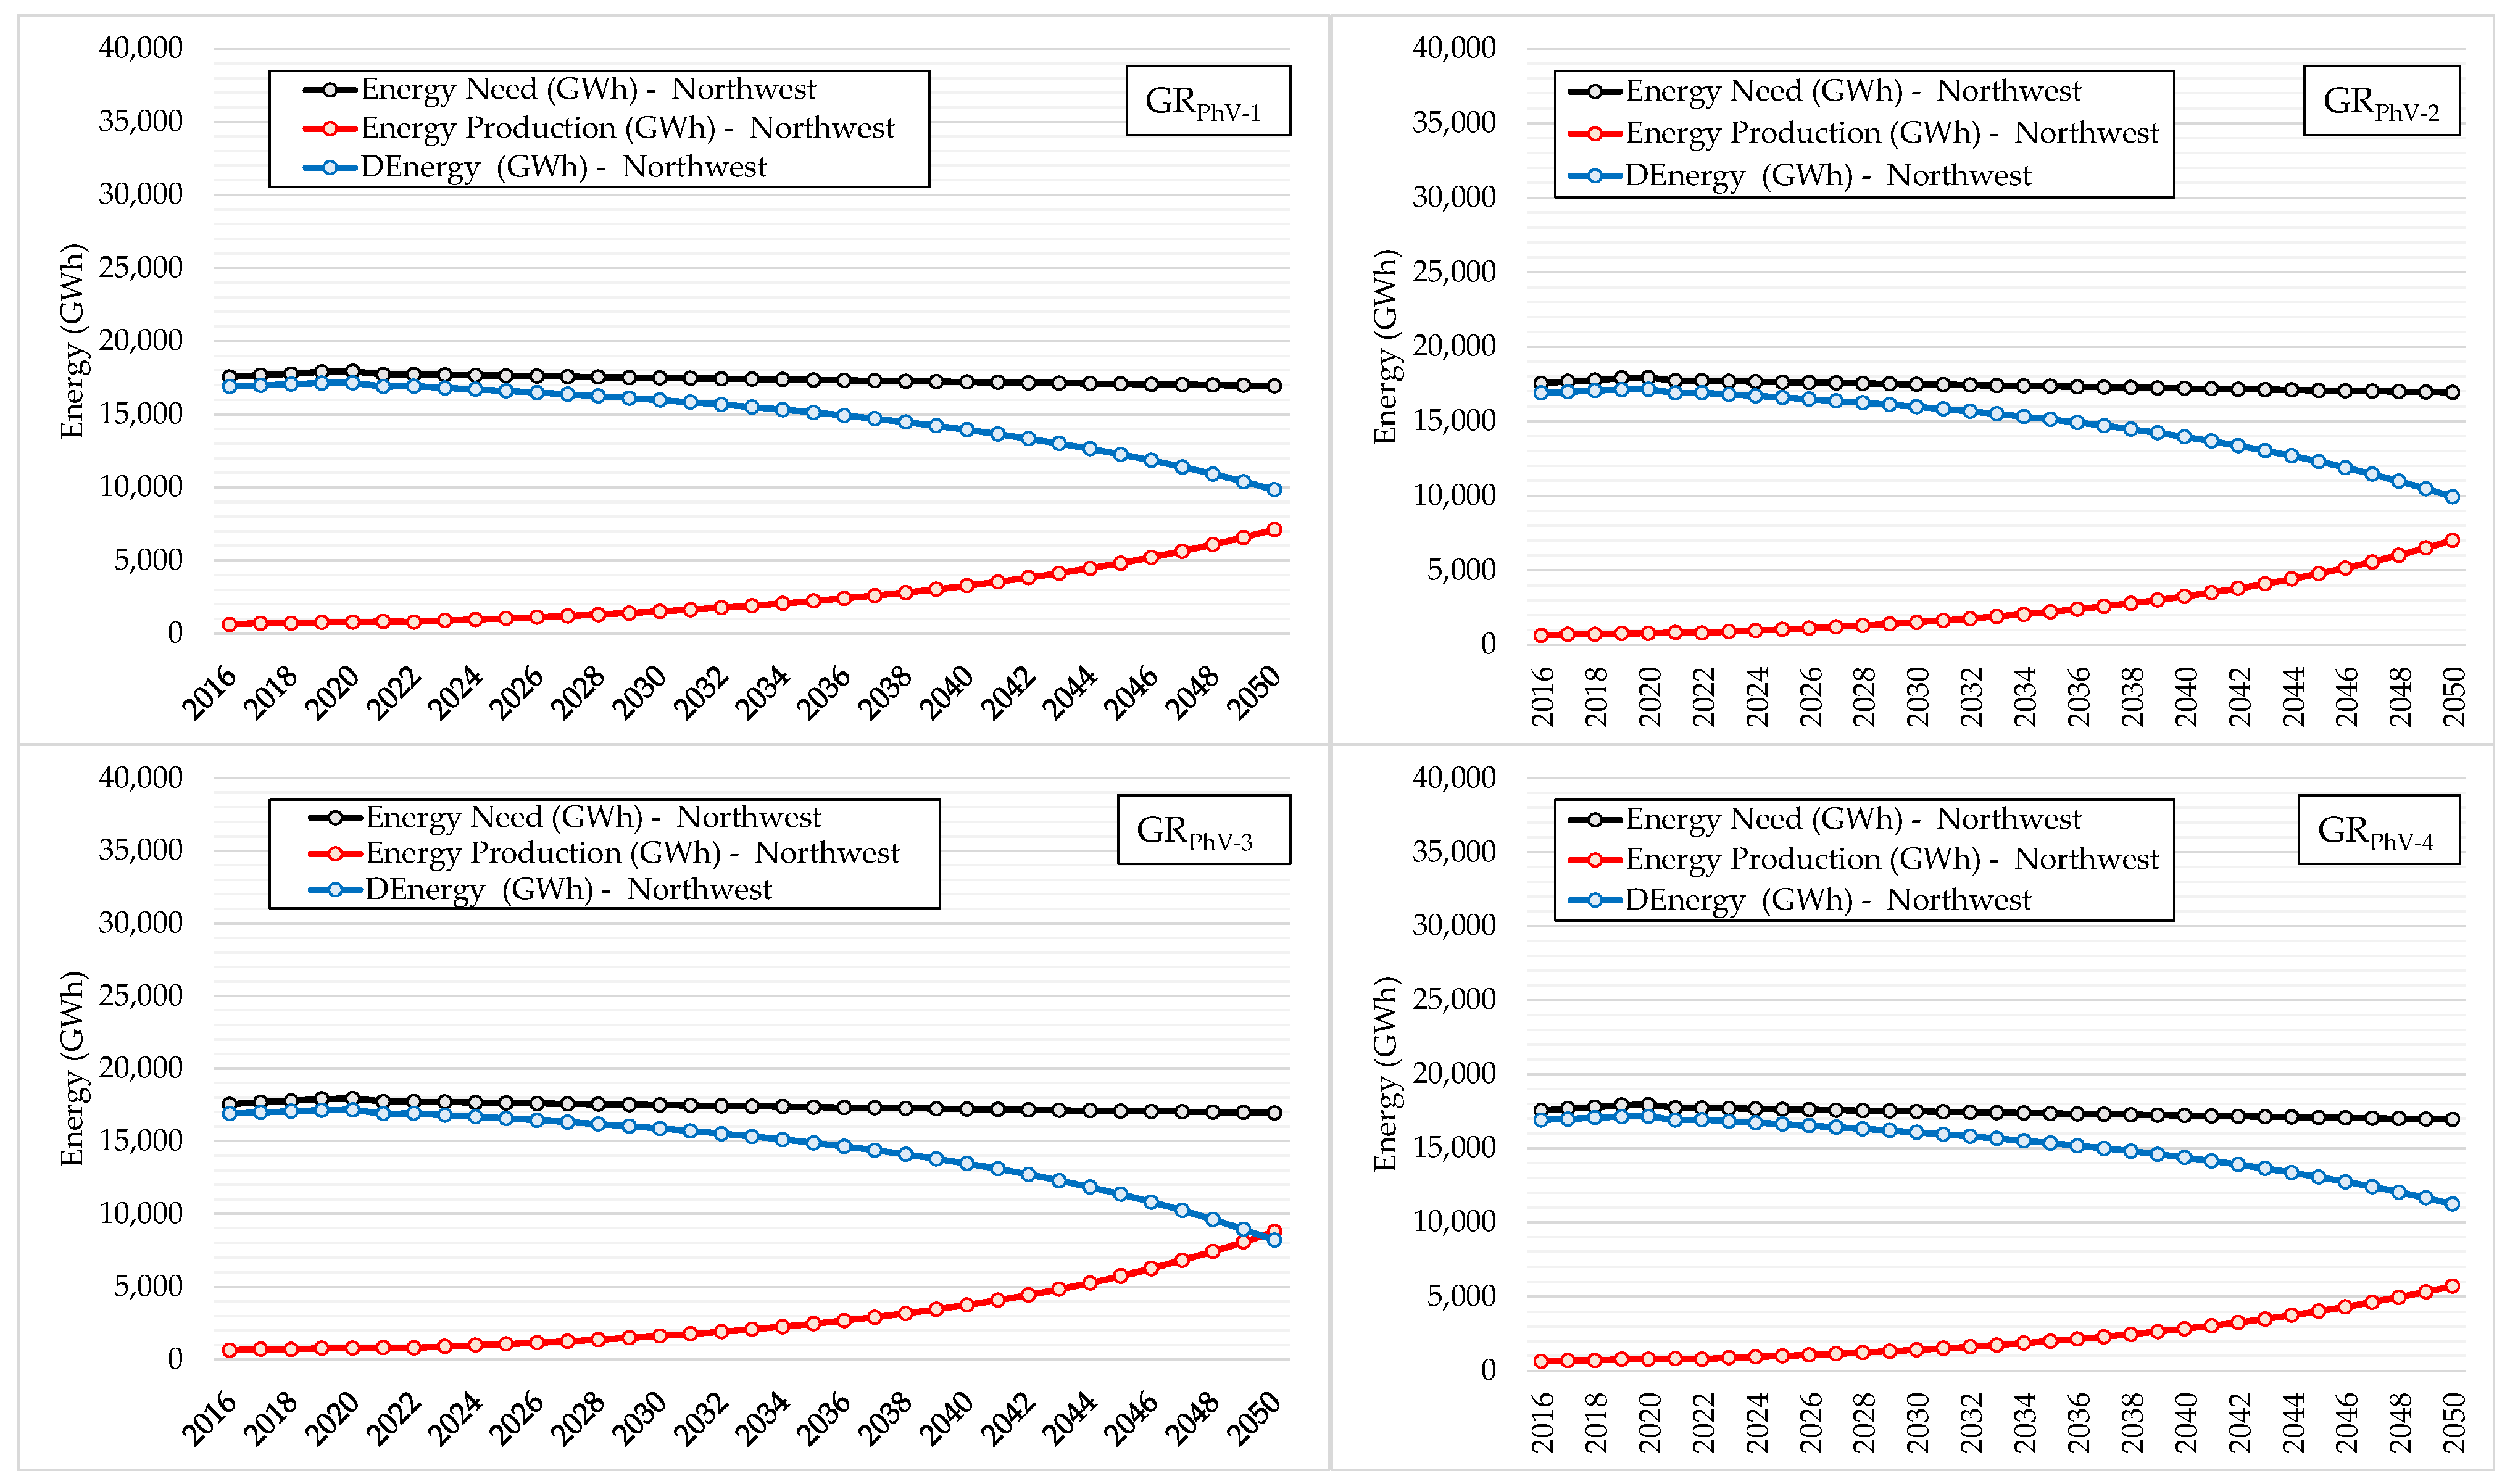
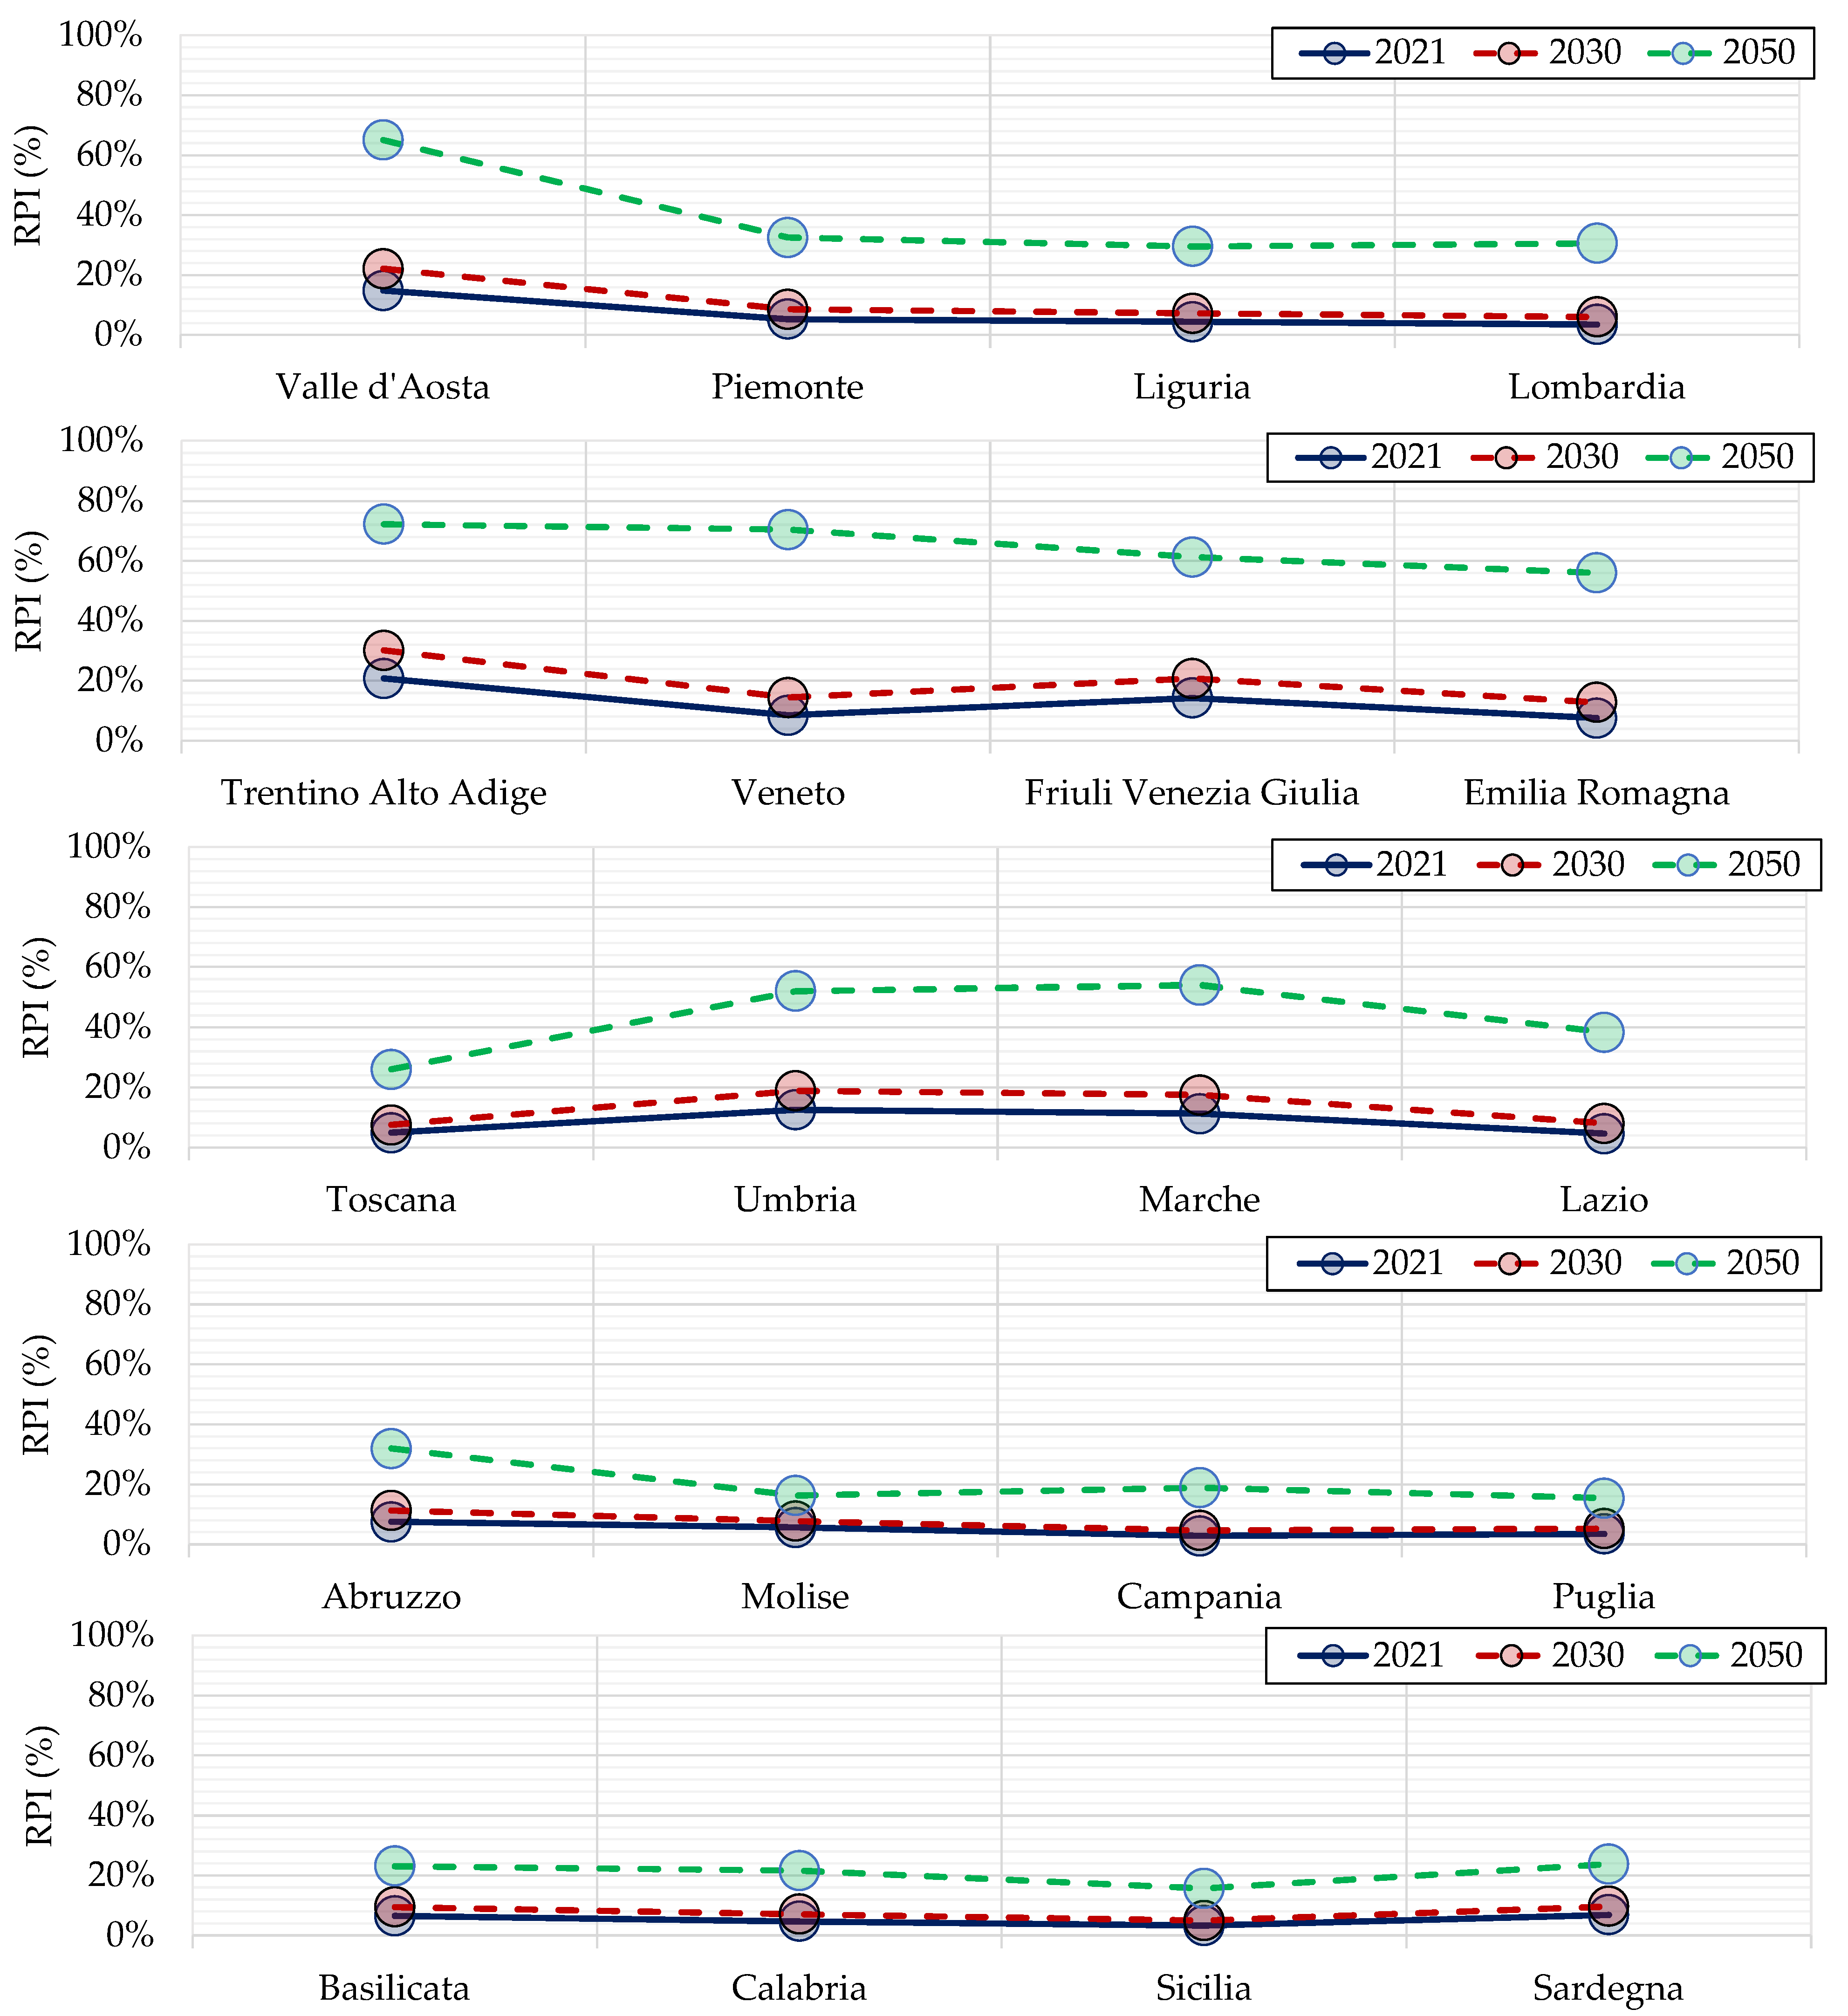
- Northwest zone: the energy supplied by photovoltaic panels could potentially exceed 5500 GWh in all of the GRPhV scenarios, allowing 40% to 50% of the electrical energy requirements by the building stock to be met, depending on the growth rate. It is worth noting that the blue lines in Figure 5, Figure 6, Figure 7, Figure 8 and Figure 9 (representing the electrical energy to be covered by other energy sources) always have a downward concavity, indicating the good impact of these technologies already in this zone;
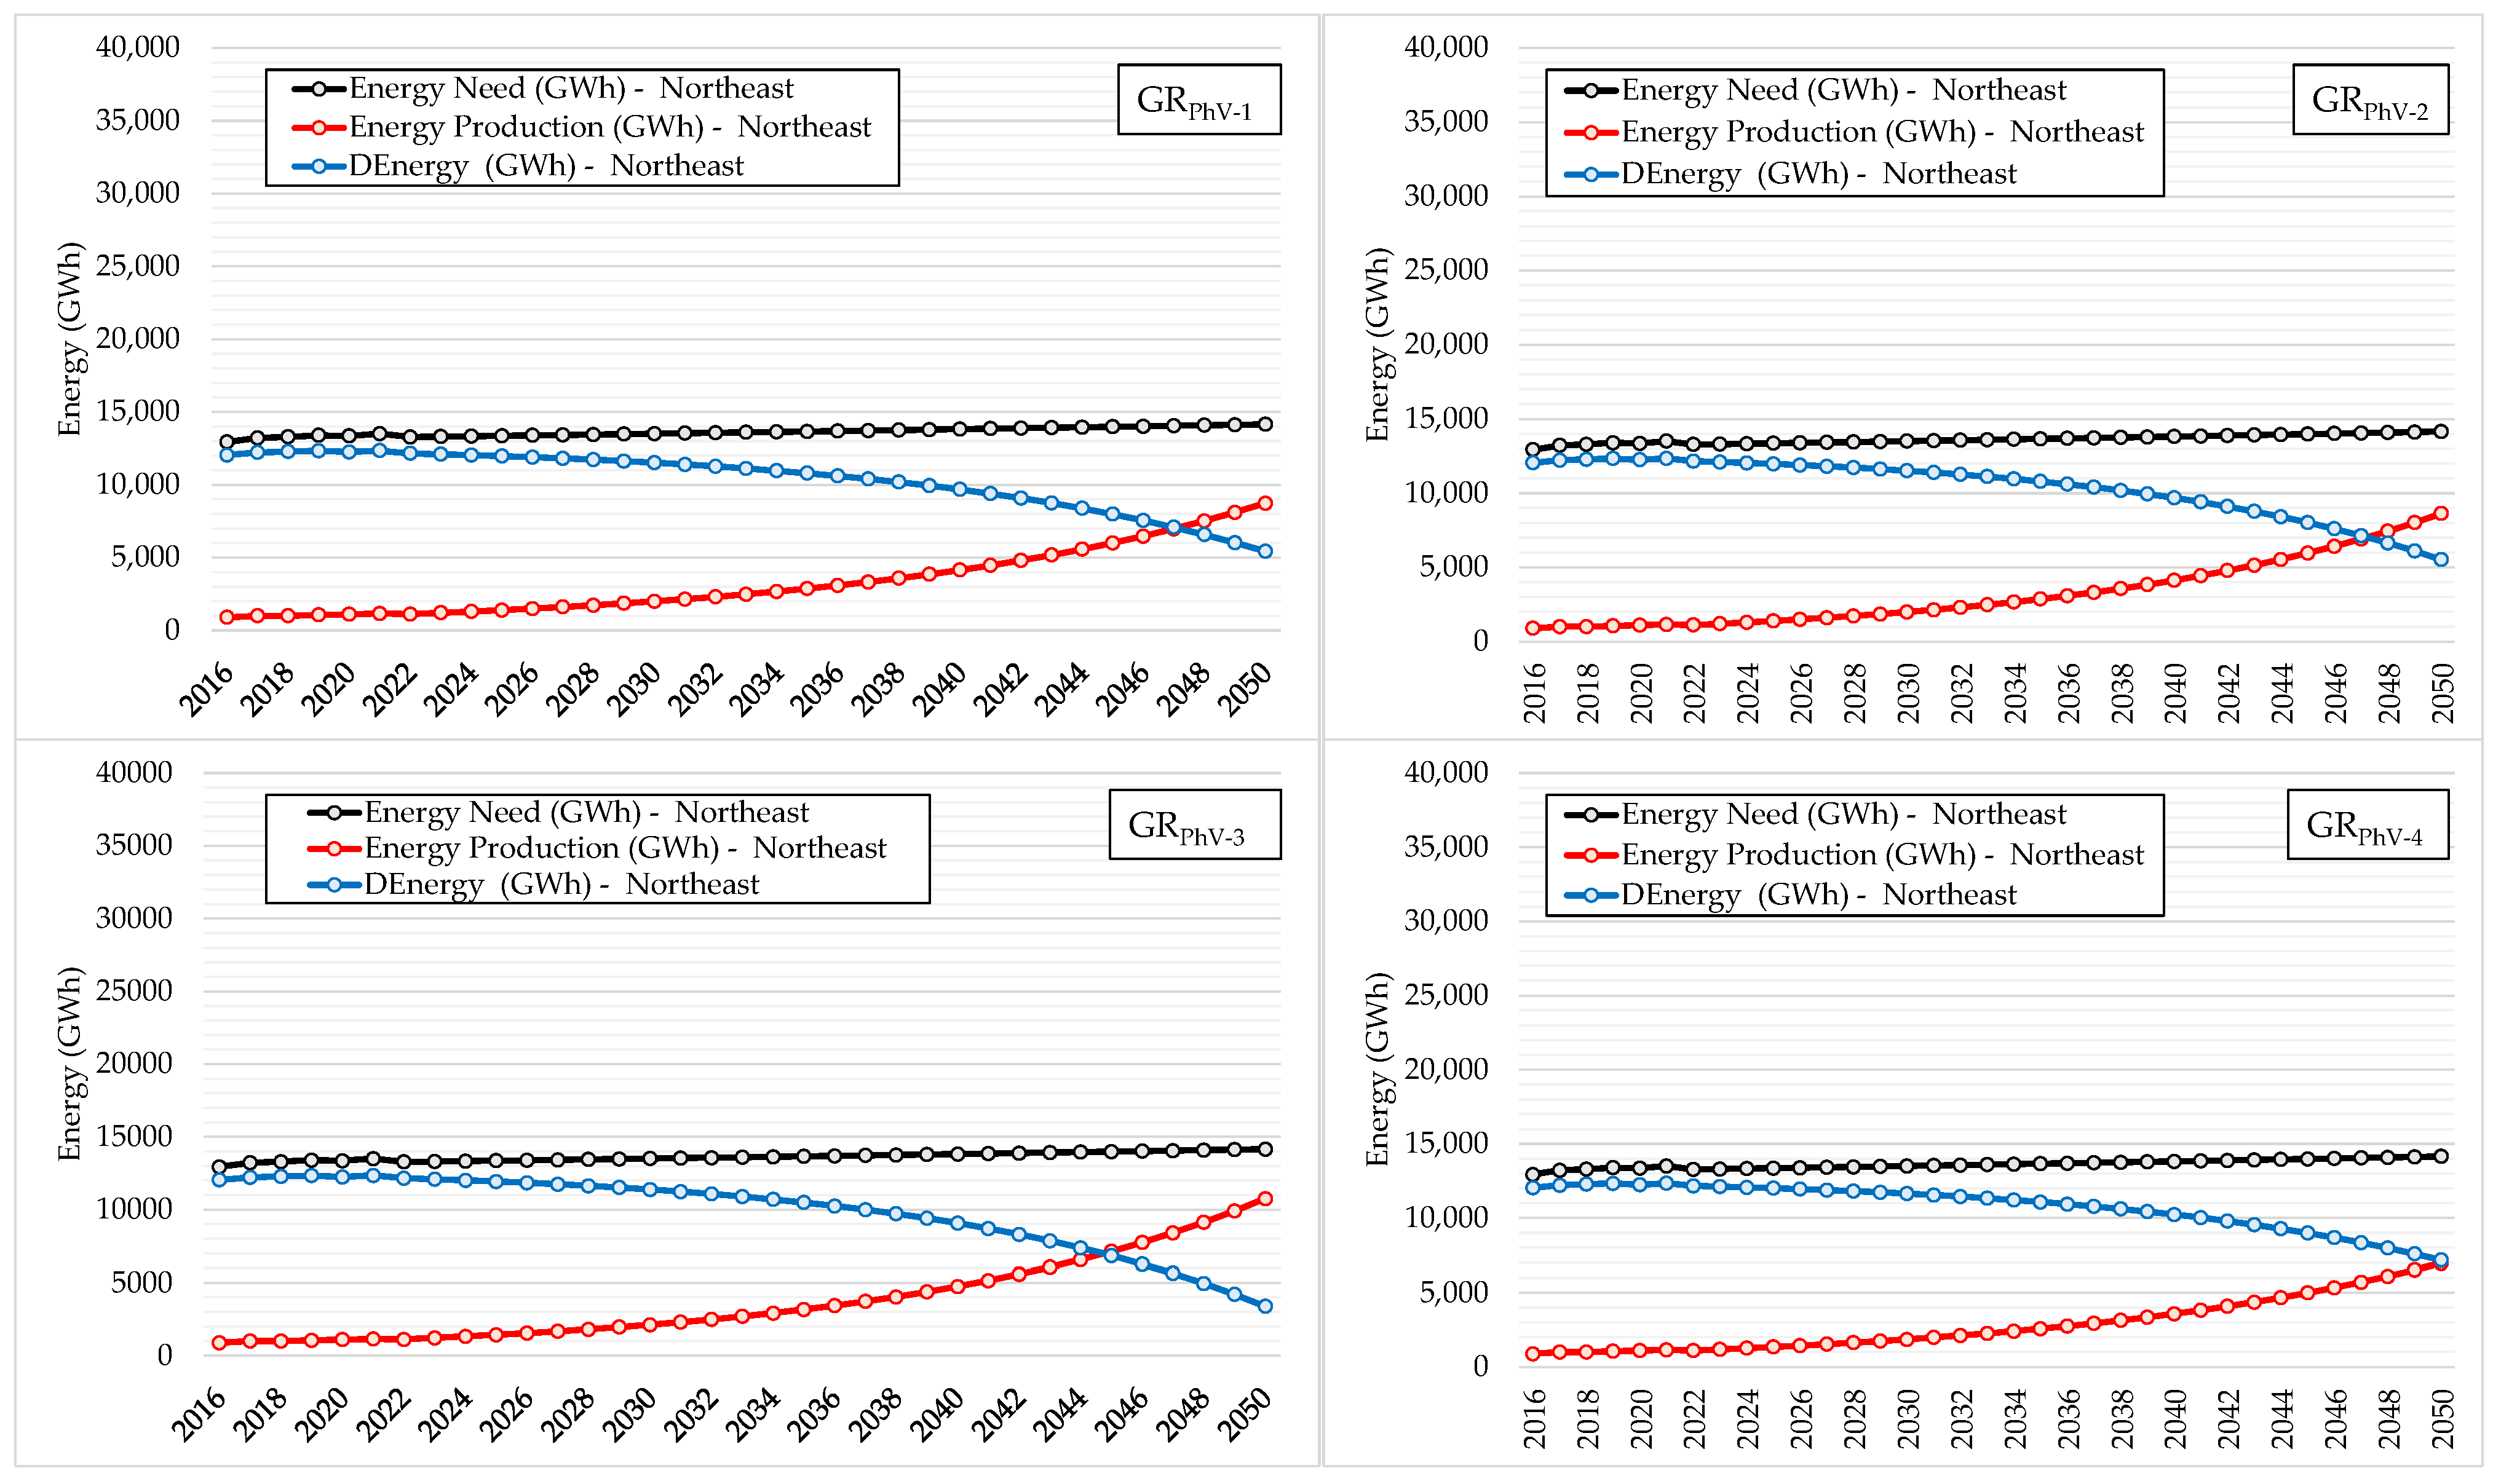
- Northeast zone: the energy supplied by photovoltaic panels could potentially reach 7100 GWh even with low growth rates (GRPhV-4), covering more than 50% of the predicted electrical energy requirements of the building stock by 2050 (the red line crosses the blue line). Moreover, in the most promising scenario (GRPhV-3), the energy produced by photovoltaic panels could potentially reach more than 10,000 GWh, meeting more than 74% of electrical energy requirements;
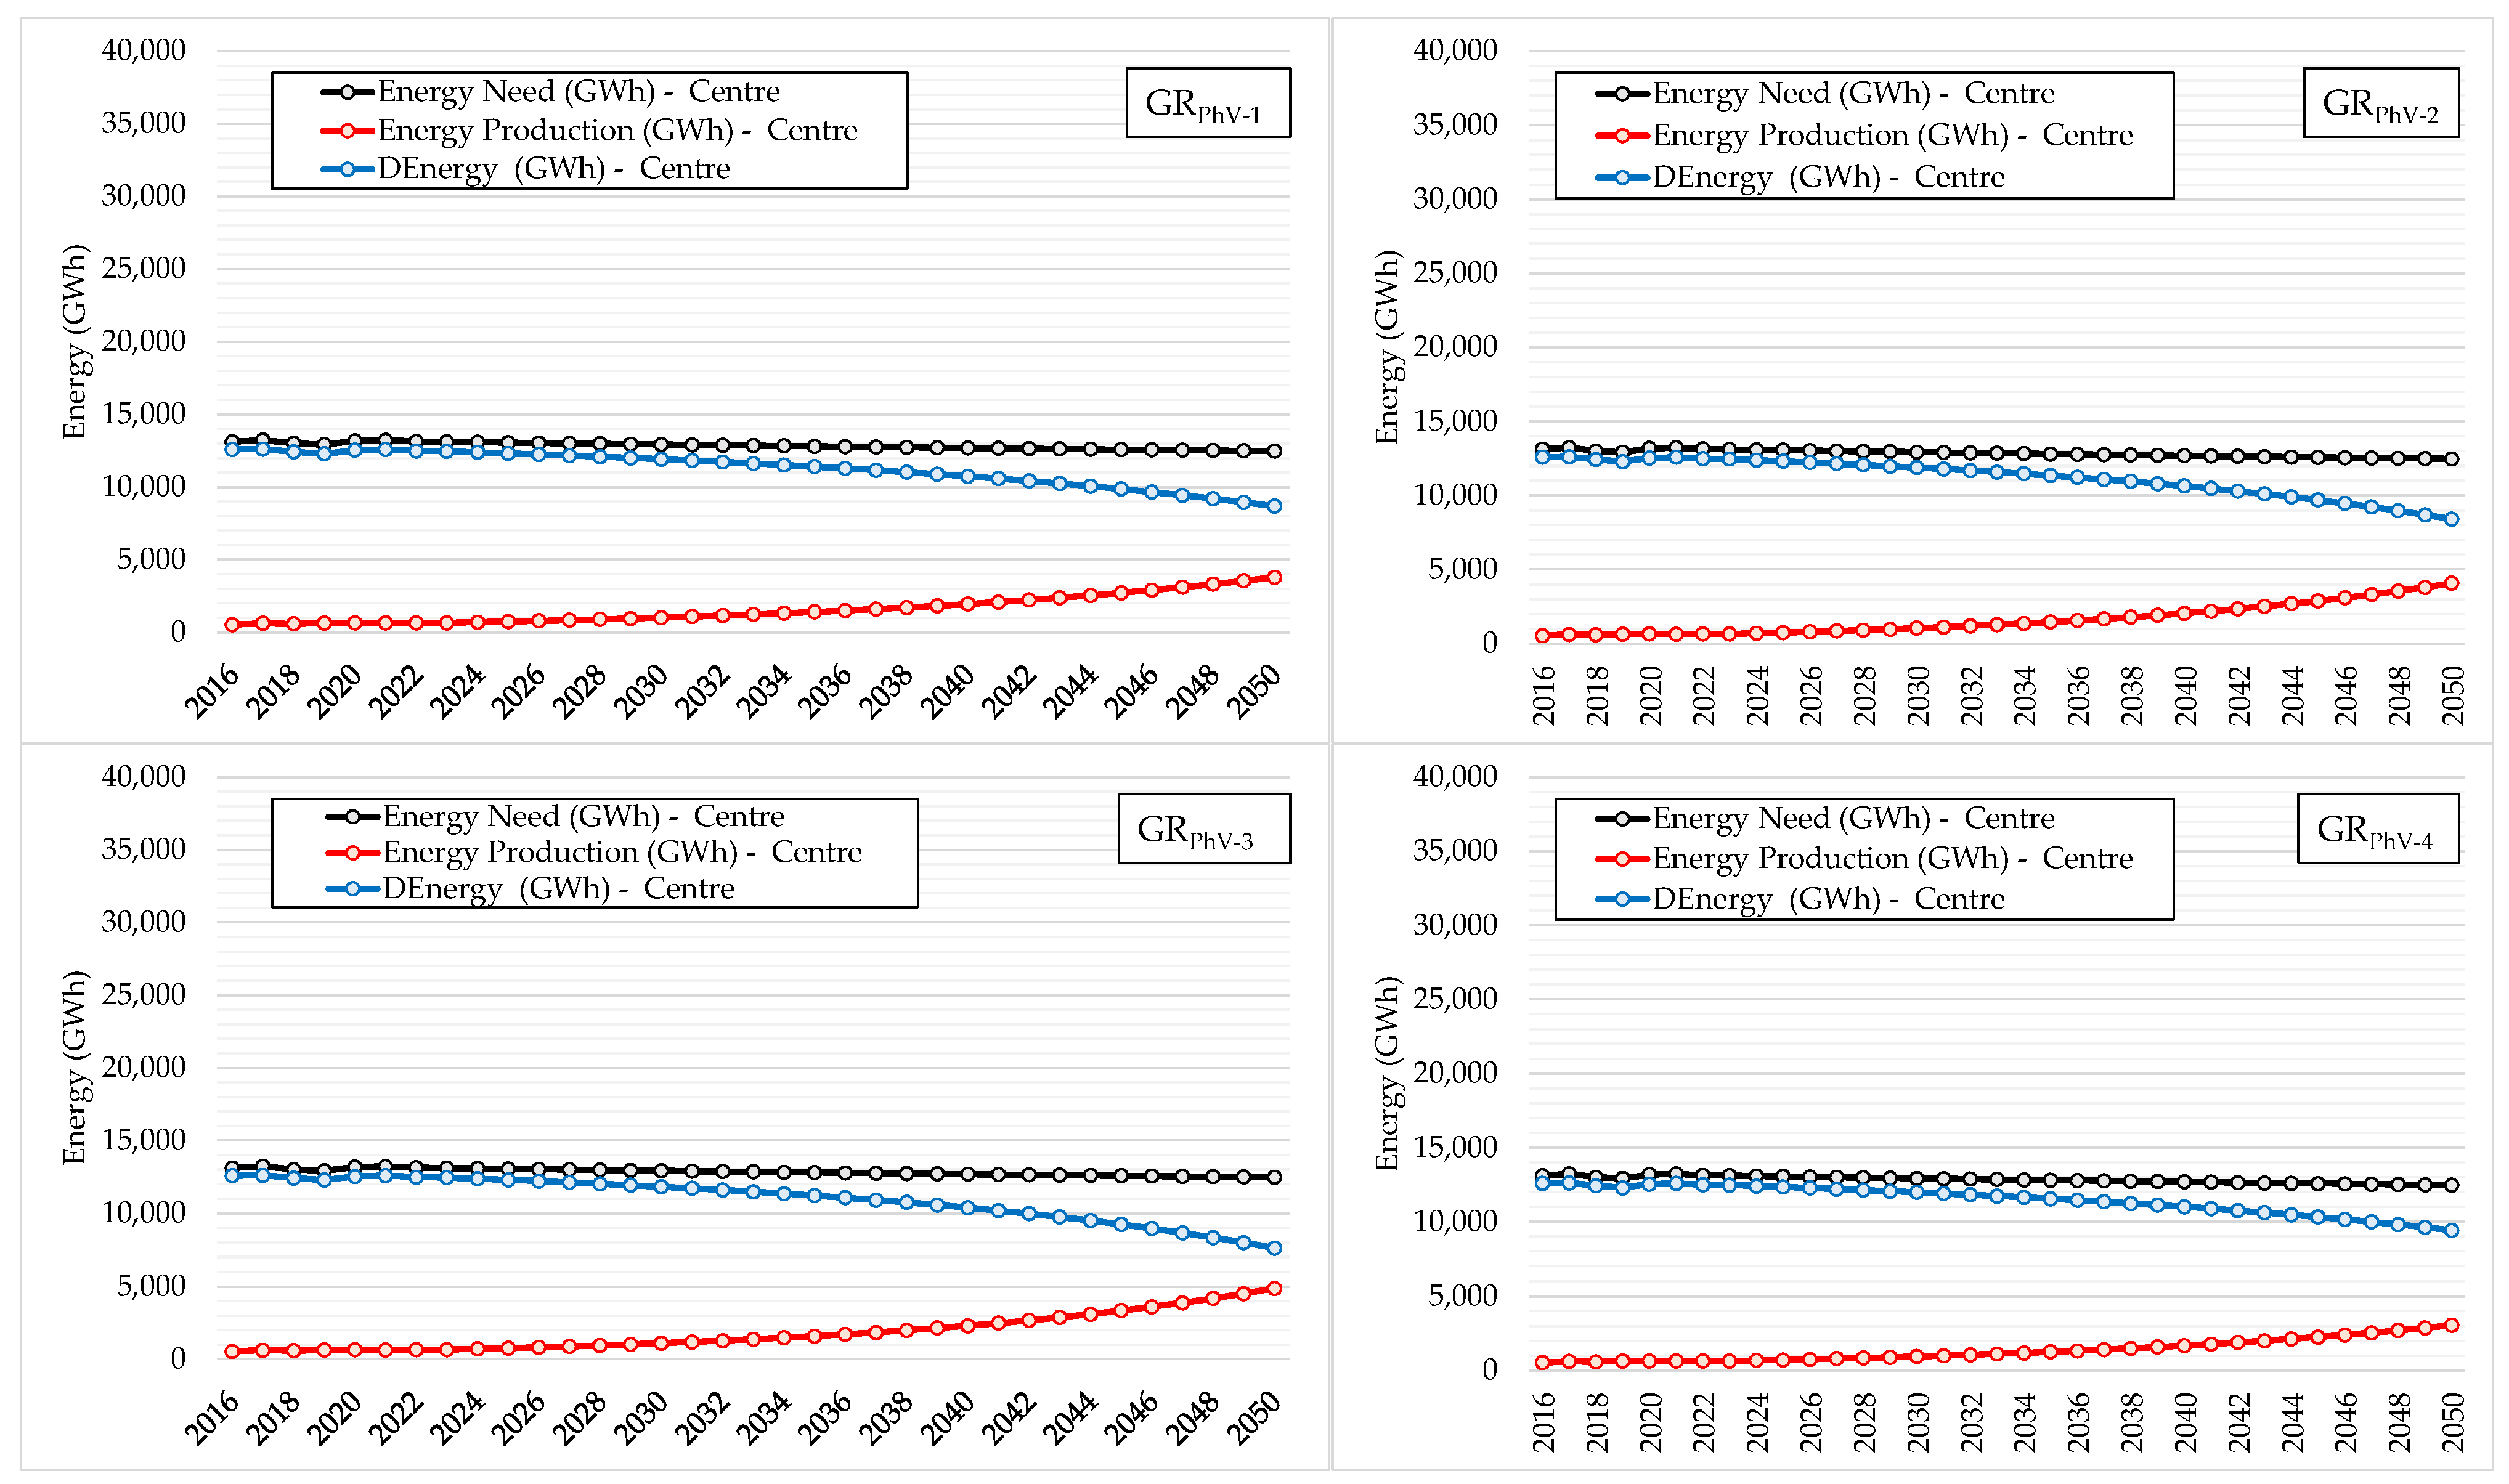
- Centre zone: although a smaller growth than in the northern area of Italy, it could be possible to meet 27–39% of the electrical energy requirements of the building stock by 2050. In that case, the most probable scenarios (GRPhV-1 and GRPhV-2) showed an energy coverage of 30–32% by achieving a potential energy production of around 3700–4000 GWh. However, these results pointed out that it could be necessary to take specific energy actions to reach the 50% threshold;
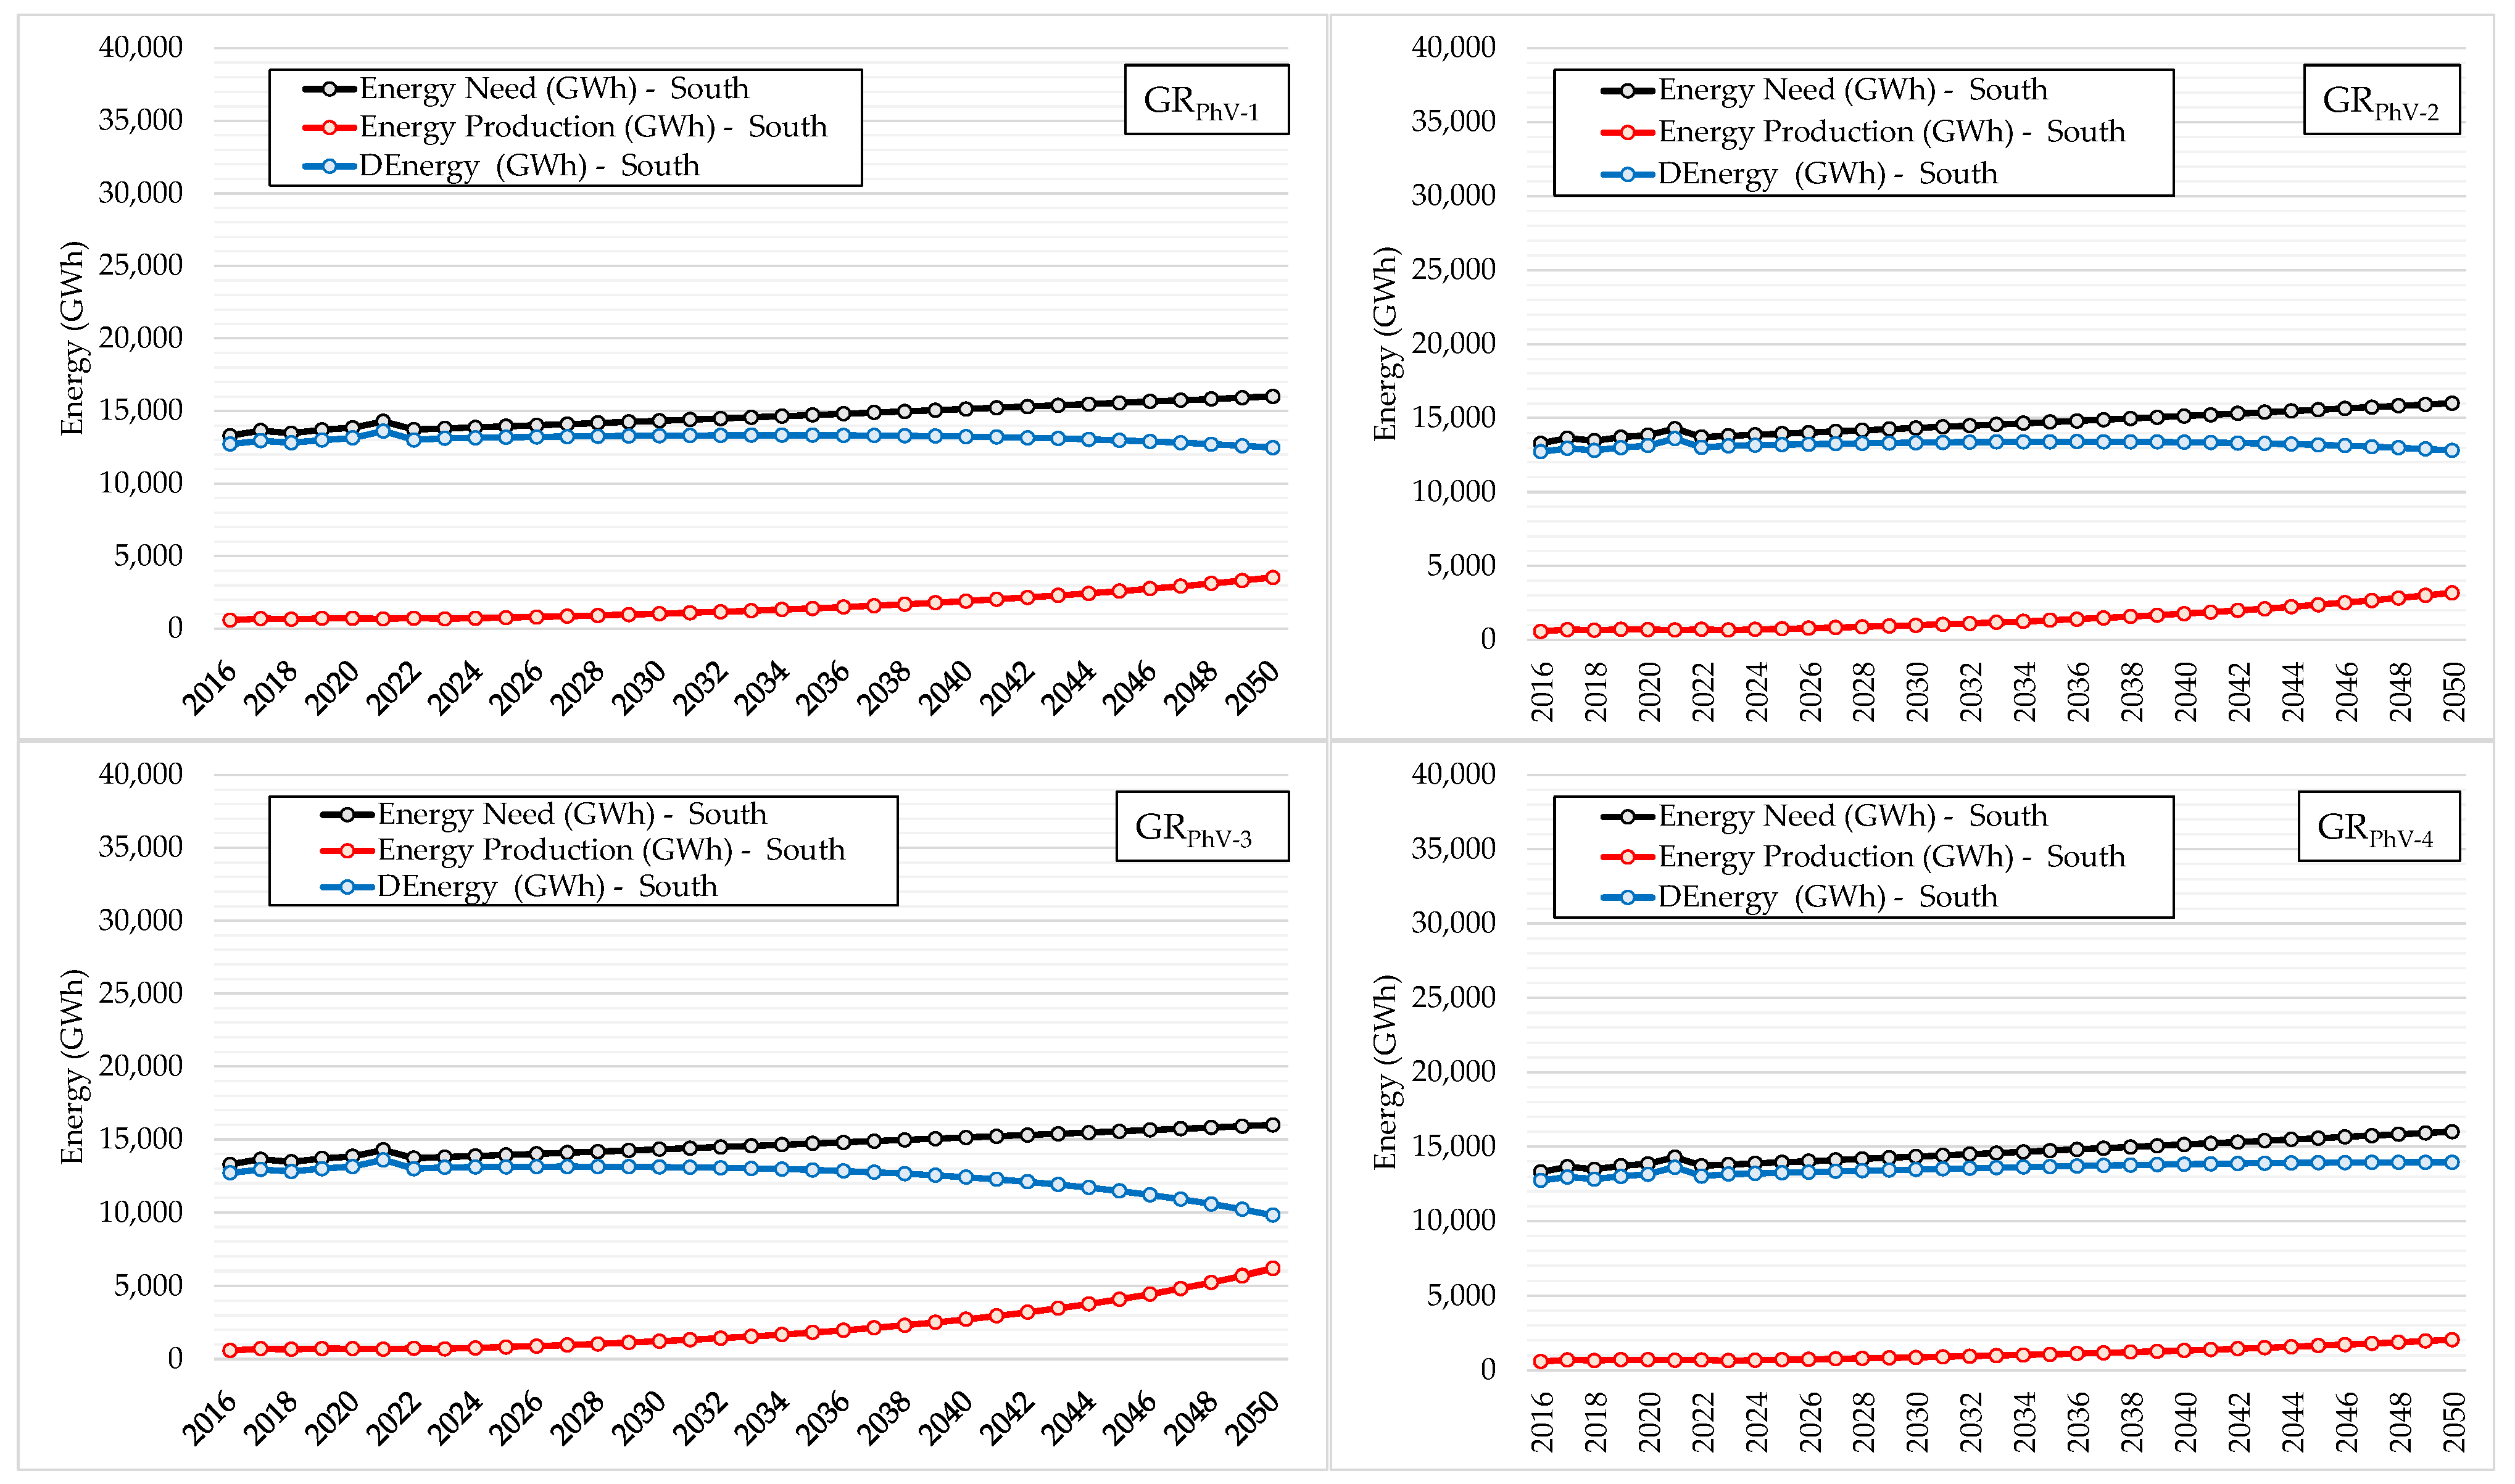
- South zone: a completely different trend can be observed in this zone, which could underline possible issues of these regions to achieve the national target by 2050, where Puglia and Campania alone could produce more than 65% of the whole photovoltaic energy production. Nevertheless, the energy production would not exceed 6200 GWh, even in the most optimistic scenario (GRPhV-3), which would allow the meeting of 38% of the predicted electrical energy requirements of the building stock. The evaluated trends highlighted significant issues for all of these regions mainly due to the limited number of installations recorded to date. In this case, it could also be necessary to implement additional actions to reach the 50% threshold;
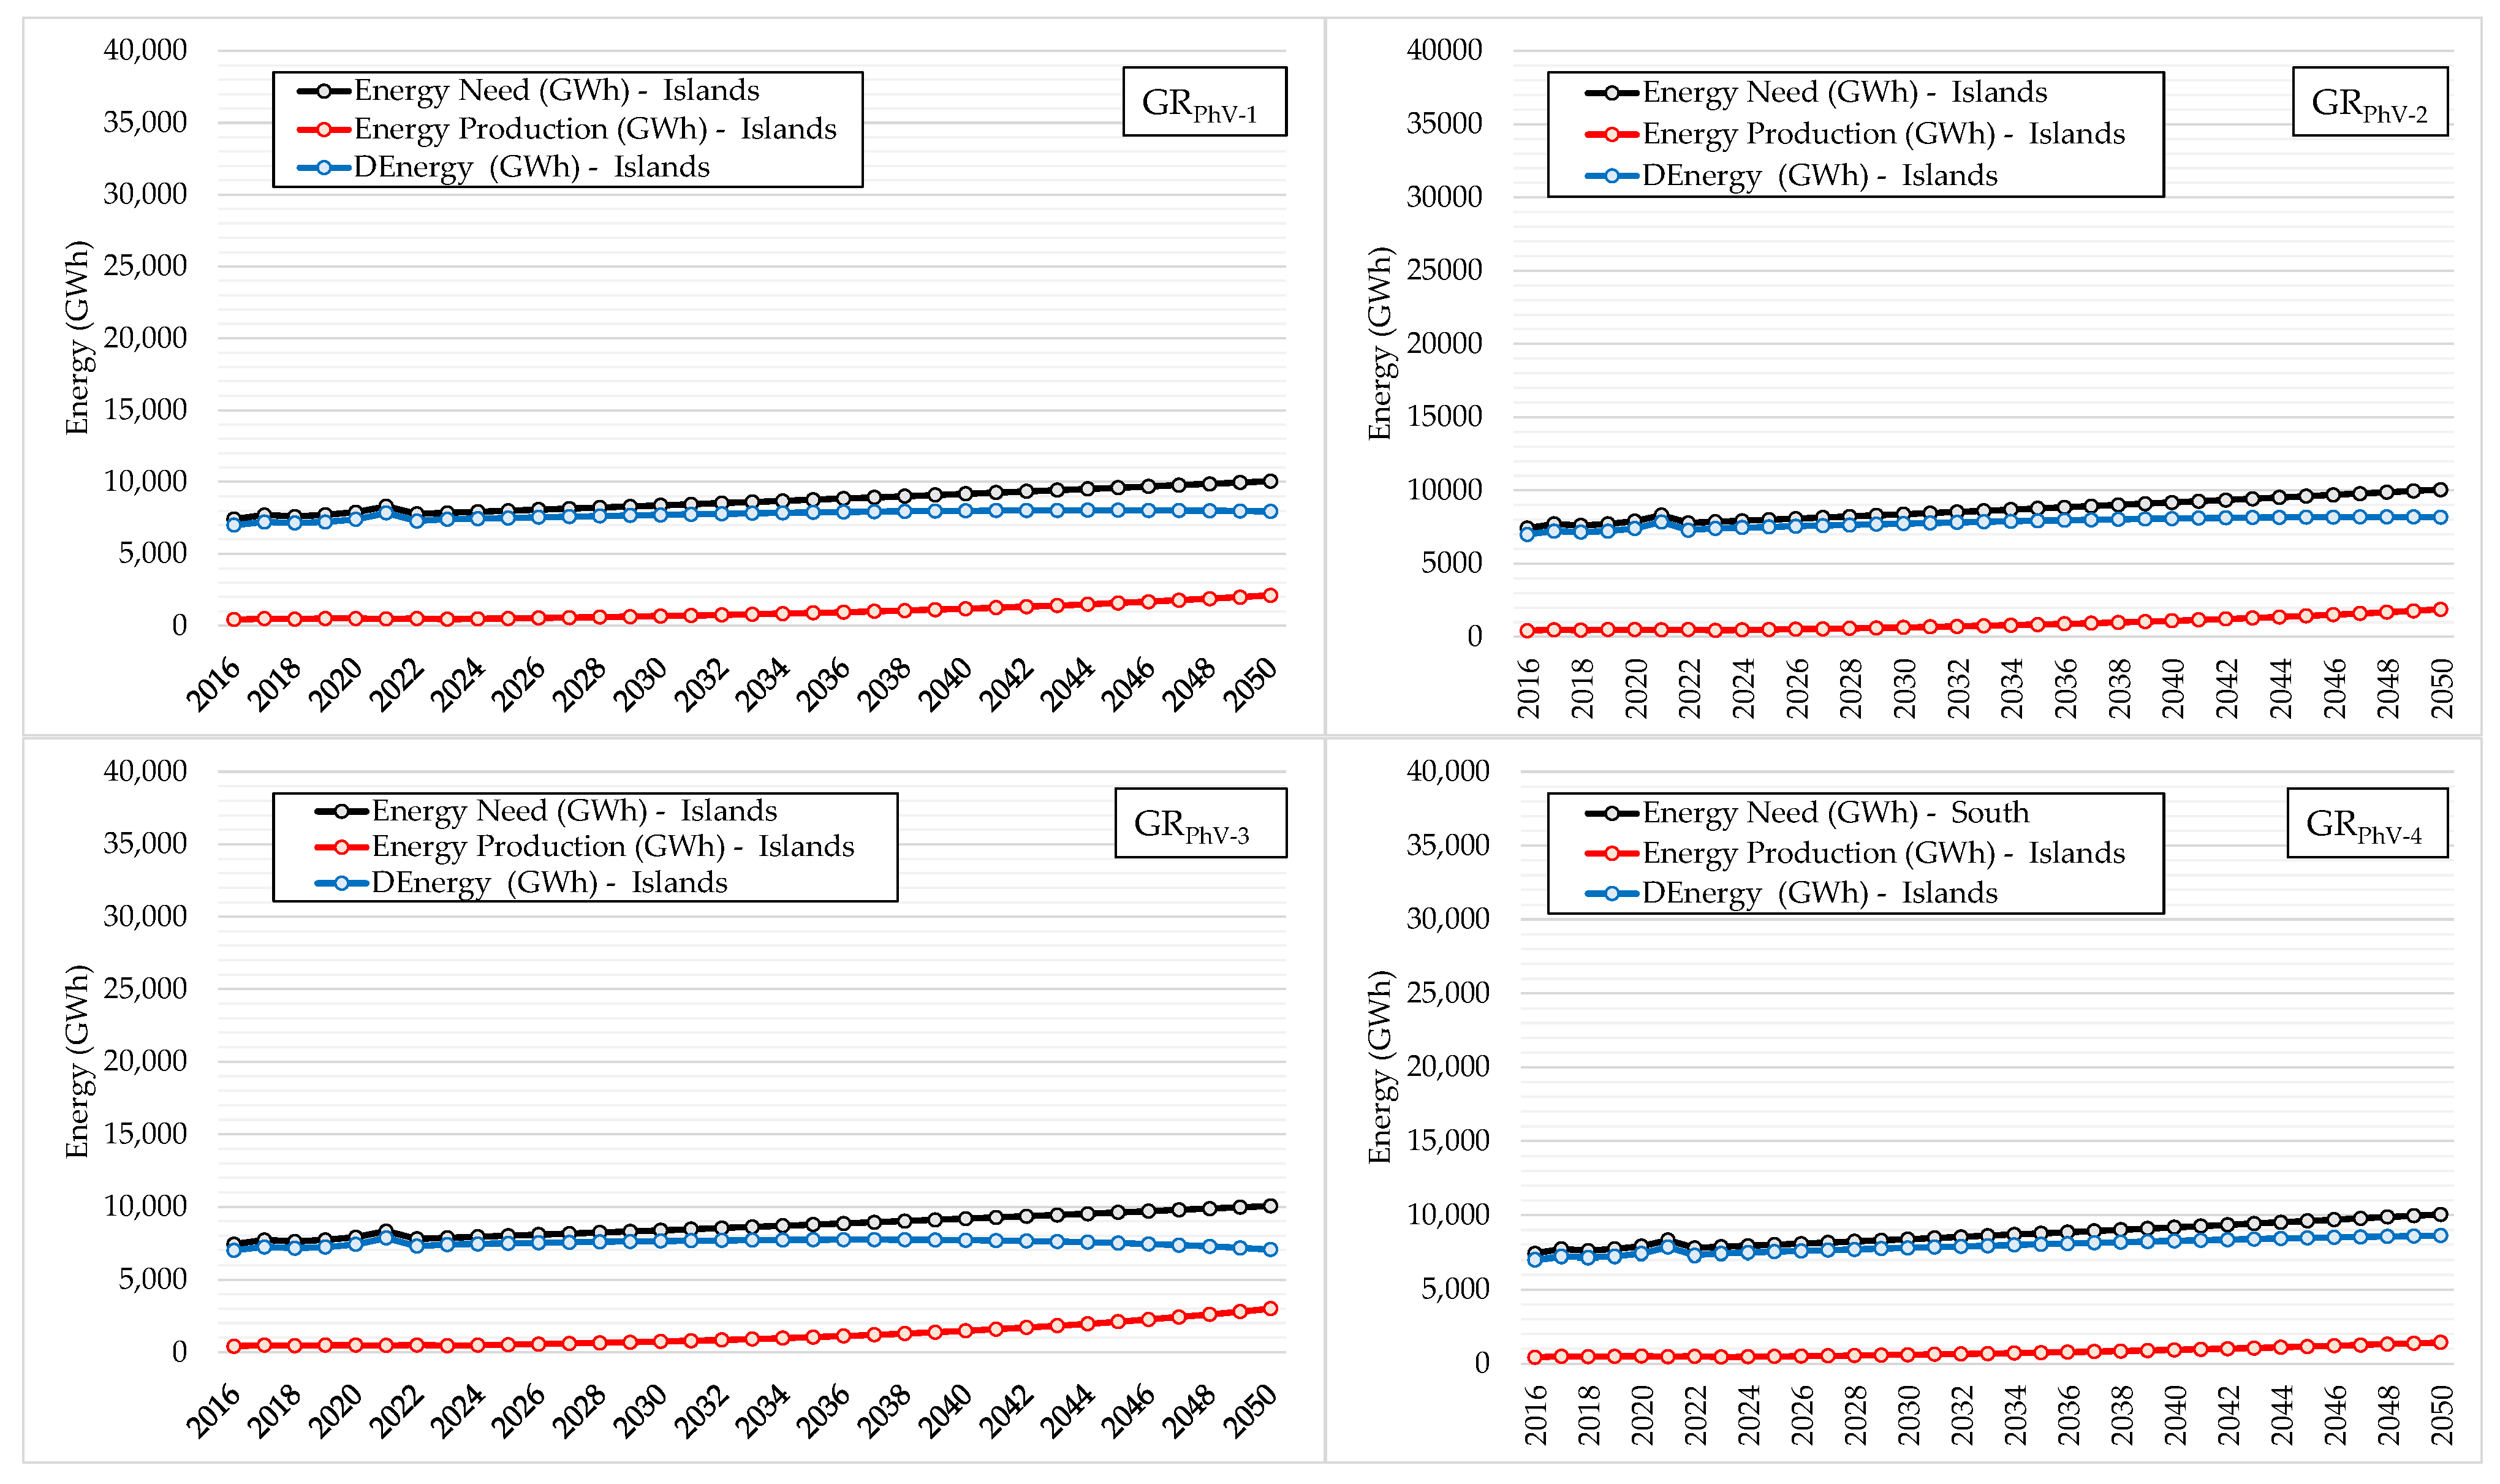
- Islands: similar to the South zone, the results have also underlined how far away the target is for the Islands zone, even if the Sicilia region alone could produce more than 1200–1500 GWh on average. The produced energy in that zone could allow between 13% (GRPhV-4) and 28% (GRPhV-3) of electrical energy requirements to be met, with an average and most probable outcome of 19–20%; therefore, additional specific energy actions should also be considered to reach the 50% threshold in this area.
4. Conclusions
Author Contributions
Funding
Data Availability Statement
Conflicts of Interest
Abbreviation
| BU | Building units |
| C | Centre |
| DE | Difference between energy consumption and energy produced by photovoltaic panels |
| DR | Development rate |
| EC | Energy consumption |
| GR | Growth rate |
| I | Islands |
| KP | Key point |
| MFH | Multi-family house |
| NE | Northeast |
| NW | Northwest |
| P | Power |
| PhV | Photovoltaics |
| RPI | Regional potential index |
| S | South |
| SFH | Single-family house |
Appendix A

| Zones | SFH | MFH | |||||||||
|---|---|---|---|---|---|---|---|---|---|---|---|
| 1 Floor | 2 Floors | 3 Floors | ≥4 Floors | ||||||||
| n. 1 | n. 1 | n. 2 | n. 3–4 | n. 2 | n. 3–4 | n. 5–8 | n. 3–4 | n. 5–8 | n. 9–15 | n. ≥16 | |
| Piemonte | 2,083,389 | 4,458,357 | 1,232,233 | 290,666 | 1,506,062 | 407,623 | 646,827 | 728,390 | 71,870 | 324,261 | 219,559 |
| Valle d’Aosta | 82,127 | 475,443 | 51,209 | 5690 | 147,405 | 24,361 | 39,776 | 55,212 | 4420 | 25,045 | 21,953 |
| Liguria | 3135 | 15,452 | 0 | 0 | 11,400 | 2050 | 2670 | 5125 | 297 | 1056 | 701 |
| Lombardia | 29,963 | 86,319 | 25,020 | 2780 | 34,336 | 10,097 | 19,193 | 22,462 | 2133 | 13,698 | 14,919 |
| Trentino Alto Adige | 135,547 | 519,959 | 170,355 | 118,771 | 208,211 | 61,571 | 106,533 | 35,156 | 13,047 | 57,984 | 44,248 |
| Veneto | 10,893 | 65,281 | 0 | 0 | 47,781 | 9288 | 17,109 | 23,219 | 1901 | 5617 | 3110 |
| Friuli Venezia Giulia | 93,862 | 478,762 | 118,525 | 69,672 | 144,863 | 32,775 | 47,210 | 12,265 | 12,832 | 23,705 | 10,824 |
| Emilia Romagna | 35,916 | 156,712 | 0 | 0 | 57,459 | 6240 | 12,549 | 15,600 | 1394 | 8393 | 4217 |
| Toscana | 60,500 | 310,998 | 93,821 | 28,403 | 114,671 | 33,069 | 60,398 | 54,270 | 6711 | 30,295 | 15,597 |
| Umbria | 79,859 | 279,145 | 79,127 | 42,309 | 96,711 | 29,111 | 48,438 | 30,468 | 5382 | 21,313 | 11,218 |
| Marche | 15,817 | 86,717 | 16,748 | 1861 | 37,430 | 7007 | 8708 | 15,656 | 968 | 3661 | 1946 |
| Lazio | 21,253 | 122,228 | 21,674 | 2408 | 63,507 | 12,725 | 20,476 | 29,404 | 2275 | 8801 | 3501 |
| Abruzzo | 153,357 | 220,709 | 81,749 | 63,115 | 99,916 | 31,844 | 41,628 | 16,496 | 19,242 | 33,933 | 27,743 |
| Molise | 44,813 | 153,658 | 16,368 | 1819 | 60,139 | 11,102 | 15,242 | 25,937 | 1694 | 6716 | 3775 |
| Campania | 13,351 | 48,913 | 0 | 0 | 17,693 | 2383 | 2806 | 5957 | 312 | 1412 | 977 |
| Puglia | 159,125 | 270,142 | 97,531 | 98,438 | 119,205 | 28,335 | 26,714 | 0 | 32,444 | 22,885 | 18,287 |
| Basilicata | 427,892 | 160,169 | 76,919 | 81,820 | 94,012 | 0 | 0 | 0 | 39,413 | 19,612 | 13,488 |
| Calabria | 39,307 | 53,922 | 14,972 | 1664 | 19,950 | 4978 | 6364 | 10,781 | 707 | 2493 | 1133 |
| Sicilia | 138,784 | 217,662 | 48,505 | 5389 | 80,147 | 19,152 | 25,177 | 42,491 | 2797 | 9583 | 4677 |
| Sardegna | 400,175 | 477,253 | 56,842 | 6316 | 226,965 | 39,849 | 48,536 | 93,306 | 5393 | 21,251 | 13,485 |
| Zones | SFH | MFH | |||||||||
|---|---|---|---|---|---|---|---|---|---|---|---|
| 1 Floor | 2 Floors | 3 Floors | ≥4 Floors | ||||||||
| n. 1 | n. 1 | n. 2 | n. 3–4 | n. 2 | n. 3–4 | n. 5–8 | n. 3–4 | n. 5–8 | n. 9–15 | n. ≥16 | |
| Piemonte | 82,127 | 475,443 | 102,418 | 22,760 | 294,810 | 97,442 | 238,658 | 220,846 | 26,518 | 300,540 | 526,872 |
| Valle d’Aosta | 3135 | 15,452 | 0 | 0 | 22,800 | 8200 | 16,022 | 20,500 | 1780 | 12,672 | 16,824 |
| Liguria | 29,963 | 86,319 | 50,040 | 11,120 | 68,672 | 40,387 | 115,160 | 89,849 | 12,796 | 164,376 | 358,056 |
| Lombardia | 135,547 | 519,959 | 340,709 | 475,085 | 416,423 | 246,283 | 639,197 | 140,623 | 78,283 | 695,808 | 1,061,952 |
| Trentino Alto Adige | 10,893 | 65,281 | 0 | 0 | 95,562 | 37,151 | 102,654 | 92,877 | 11,406 | 67,404 | 74,640 |
| Veneto | 93,862 | 478,762 | 237,049 | 278,690 | 289,727 | 131,101 | 283,259 | 49,062 | 76,993 | 284,460 | 259,776 |
| Friuli Venezia Giulia | 35,916 | 156,712 | 0 | 0 | 114,918 | 24,960 | 75,292 | 62,400 | 8366 | 100,716 | 101,208 |
| Emilia Romagna | 60,500 | 310,998 | 187,643 | 113,610 | 229,341 | 132,277 | 362,389 | 217,081 | 40,265 | 363,540 | 374,328 |
| Toscana | 79,859 | 279,145 | 158,254 | 169,236 | 193,422 | 116,442 | 290,628 | 121,870 | 32,292 | 255,756 | 269,232 |
| Umbria | 15,817 | 86,717 | 33,496 | 7444 | 74,860 | 28,027 | 52,245 | 62,625 | 5805 | 43,932 | 46,704 |
| Marche | 21,253 | 122,228 | 43,348 | 9633 | 127,014 | 50,899 | 122,855 | 117,616 | 13,651 | 105,612 | 84,024 |
| Lazio | 153,357 | 220,709 | 163,499 | 252,459 | 199,832 | 127,377 | 249,766 | 65,984 | 115,454 | 407,196 | 665,832 |
| Abruzzo | 44,813 | 153,658 | 32,737 | 7275 | 120,277 | 44,409 | 91,454 | 103,748 | 10,162 | 80,592 | 90,600 |
| Molise | 13,351 | 48,913 | 0 | 0 | 35,386 | 9531 | 16,837 | 23,829 | 1871 | 16,944 | 23,448 |
| Campania | 159,125 | 270,142 | 195,062 | 393,751 | 238,410 | 113,341 | 160,285 | 0 | 194,663 | 274,620 | 438,888 |
| Puglia | 427,892 | 160,169 | 153,838 | 327,280 | 188,024 | 0 | 0 | 0 | 236,478 | 235,344 | 323,712 |
| Basilicata | 39,307 | 53,922 | 29,945 | 6654 | 39,899 | 19,911 | 38,183 | 43,123 | 4243 | 29,916 | 27,192 |
| Calabria | 138,784 | 217,662 | 97,009 | 21,558 | 160,295 | 76,608 | 151,060 | 169,962 | 16,784 | 114,996 | 112,248 |
| Sicilia | 400,175 | 477,253 | 113,684 | 25,263 | 453,930 | 159,394 | 291,217 | 373,223 | 32,357 | 255,012 | 323,640 |
| Sardegna | 137,713 | 216,538 | 69,622 | 15,472 | 104,636 | 41,697 | 85,369 | 88,771 | 9485 | 81,696 | 90,240 |
| Building Type | Area | Net Surface Distribution of the Building Units (km2) | ||||||||
|---|---|---|---|---|---|---|---|---|---|---|
| ≤29 | 30–39 | 40–49 | 50–59 | 60–79 | 80–99 | 100–119 | 120–149 | ≥150 | ||
| SFH | Northwest | 0.00 | 0.22 | 1.15 | 2.84 | 13.25 | 21.72 | 18.33 | 17.45 | 27.77 |
| Northeast | 0.00 | 0.12 | 0.69 | 1.74 | 9.36 | 18.25 | 19.79 | 20.40 | 35.66 | |
| Centre | 0.00 | 0.15 | 0.76 | 1.90 | 9.69 | 17.41 | 16.57 | 14.84 | 21.76 | |
| South | 0.00 | 0.31 | 1.34 | 3.04 | 15.87 | 37.16 | 38.98 | 36.09 | 47.29 | |
| Islands | 0.00 | 0.21 | 0.96 | 2.14 | 10.63 | 23.48 | 28.72 | 27.59 | 33.67 | |
| MFH (2 floors) | Northwest | 0.03 | 0.72 | 2.41 | 4.31 | 15.62 | 22.70 | 16.62 | 13.74 | 18.71 |
| Northeast | 0.01 | 0.18 | 0.68 | 1.26 | 5.50 | 9.04 | 8.36 | 7.76 | 12.50 | |
| Centre | 0.01 | 0.31 | 0.96 | 1.74 | 6.75 | 9.18 | 7.08 | 5.52 | 7.30 | |
| South | 0.02 | 0.41 | 1.09 | 1.80 | 7.35 | 13.79 | 11.71 | 8.78 | 10.05 | |
| Islands | 0.00 | 0.06 | 0.17 | 0.28 | 1.08 | 1.96 | 2.05 | 1.65 | 1.77 | |
| MFH (3 floors) | Northwest | 0.03 | 0.90 | 2.99 | 5.36 | 19.51 | 27.80 | 20.29 | 16.83 | 23.22 |
| Northeast | 0.01 | 0.25 | 0.91 | 1.67 | 7.15 | 11.43 | 10.39 | 9.33 | 14.56 | |
| Centre | 0.01 | 0.33 | 1.01 | 1.84 | 7.27 | 10.22 | 8.03 | 6.26 | 8.22 | |
| South | 0.01 | 0.24 | 0.64 | 1.06 | 4.29 | 7.81 | 6.81 | 5.19 | 6.00 | |
| Islands | 0.01 | 0.24 | 0.68 | 1.09 | 4.23 | 7.71 | 8.10 | 6.32 | 6.66 | |
| MFH (≥4 floors) | Northwest | 0.03 | 0.73 | 2.43 | 4.36 | 15.90 | 22.46 | 16.33 | 13.52 | 18.69 |
| Northeast | 0.01 | 0.17 | 0.60 | 1.11 | 4.71 | 7.45 | 6.67 | 5.91 | 9.10 | |
| Centre | 0.01 | 0.30 | 0.94 | 1.70 | 6.56 | 8.97 | 6.96 | 5.41 | 7.10 | |
| South | 0.01 | 0.26 | 0.68 | 1.13 | 4.63 | 8.71 | 7.52 | 5.76 | 6.62 | |
| Islands | 0.01 | 0.16 | 0.44 | 0.70 | 2.74 | 5.00 | 5.25 | 4.10 | 4.33 | |
| Years | National Regions | |||||||||||||||||||
|---|---|---|---|---|---|---|---|---|---|---|---|---|---|---|---|---|---|---|---|---|
| 1 | 2 | 3 | 4 | 5 | 6 | 7 | 8 | 9 | 10 | 11 | 12 | 13 | 14 | 15 | 16 | 17 | 18 | 19 | 20 | |
| 2016 | 210 | 9 | 27 | 387 | 86 | 399 | 127 | 281 | 153 | 68 | 104 | 206 | 82 | 19 | 131 | 193 | 35 | 118 | 252 | 170 |
| 2017 | 231 | 10 | 31 | 435 | 100 | 446 | 136 | 321 | 173 | 80 | 123 | 241 | 105 | 22 | 150 | 244 | 39 | 138 | 294 | 195 |
| 2018 | 222 | 10 | 31 | 440 | 97 | 457 | 138 | 312 | 164 | 74 | 114 | 232 | 99 | 20 | 144 | 229 | 36 | 128 | 281 | 177 |
| 2019 | 246 | 11 | 31 | 484 | 99 | 477 | 140 | 343 | 178 | 81 | 124 | 251 | 107 | 22 | 157 | 245 | 38 | 140 | 300 | 194 |
| 2020 | 237 | 11 | 34 | 500 | 95 | 519 | 150 | 344 | 176 | 81 | 121 | 269 | 103 | 22 | 162 | 241 | 38 | 137 | 304 | 191 |
| 2021 | 247 | 10 | 36 | 533 | 92 | 559 | 152 | 353 | 182 | 76 | 117 | 262 | 97 | 20 | 161 | 227 | 35 | 133 | 291 | 180 |
| 2022 | 248 | 11 | 34 | 505 | 99 | 518 | 148 | 351 | 182 | 80 | 124 | 264 | 105 | 22 | 161 | 246 | 39 | 140 | 307 | 193 |
| 2023 | 263 | 10 | 38 | 578 | 101 | 573 | 159 | 374 | 186 | 78 | 120 | 264 | 100 | 20 | 161 | 228 | 35 | 127 | 275 | 173 |
| 2024 | 280 | 11 | 40 | 627 | 105 | 622 | 167 | 402 | 198 | 81 | 127 | 285 | 107 | 21 | 172 | 244 | 37 | 133 | 293 | 181 |
| 2025 | 299 | 12 | 43 | 681 | 109 | 675 | 176 | 431 | 210 | 84 | 134 | 308 | 114 | 21 | 184 | 260 | 39 | 141 | 313 | 189 |
| 2026 | 319 | 12 | 47 | 740 | 113 | 733 | 185 | 463 | 223 | 87 | 142 | 332 | 121 | 22 | 196 | 278 | 40 | 148 | 333 | 198 |
| 2027 | 340 | 13 | 50 | 803 | 117 | 795 | 195 | 498 | 237 | 91 | 150 | 358 | 129 | 23 | 209 | 297 | 42 | 156 | 355 | 207 |
| 2028 | 362 | 14 | 53 | 872 | 122 | 863 | 206 | 535 | 252 | 95 | 158 | 387 | 137 | 24 | 223 | 318 | 44 | 164 | 378 | 216 |
| 2029 | 386 | 14 | 57 | 947 | 127 | 936 | 217 | 574 | 268 | 98 | 167 | 417 | 146 | 25 | 238 | 340 | 46 | 173 | 403 | 226 |
| 2030 | 411 | 15 | 61 | 1029 | 132 | 1016 | 228 | 617 | 285 | 102 | 177 | 450 | 155 | 26 | 254 | 363 | 48 | 183 | 430 | 236 |
| 2031 | 439 | 16 | 66 | 1117 | 137 | 1103 | 240 | 663 | 303 | 106 | 187 | 486 | 165 | 27 | 270 | 388 | 50 | 192 | 458 | 247 |
| 2032 | 468 | 17 | 71 | 1213 | 143 | 1197 | 253 | 712 | 322 | 111 | 198 | 524 | 176 | 28 | 289 | 414 | 53 | 203 | 488 | 258 |
| 2033 | 498 | 18 | 76 | 1317 | 148 | 1299 | 266 | 765 | 343 | 115 | 209 | 566 | 187 | 30 | 308 | 443 | 55 | 214 | 520 | 270 |
| 2034 | 531 | 19 | 81 | 1430 | 154 | 1409 | 281 | 821 | 364 | 120 | 221 | 611 | 199 | 31 | 328 | 473 | 58 | 225 | 554 | 282 |
| 2035 | 566 | 20 | 87 | 1553 | 160 | 1529 | 295 | 882 | 387 | 125 | 233 | 659 | 212 | 32 | 350 | 506 | 60 | 237 | 590 | 295 |
| 2036 | 604 | 21 | 93 | 1686 | 167 | 1660 | 311 | 948 | 412 | 130 | 247 | 711 | 226 | 34 | 374 | 540 | 63 | 250 | 629 | 308 |
| 2037 | 644 | 22 | 100 | 1831 | 173 | 1801 | 328 | 1018 | 438 | 135 | 261 | 767 | 240 | 35 | 398 | 578 | 66 | 263 | 670 | 322 |
| 2038 | 686 | 23 | 107 | 1988 | 180 | 1954 | 345 | 1094 | 465 | 140 | 276 | 828 | 256 | 36 | 425 | 617 | 69 | 277 | 714 | 337 |
| 2039 | 731 | 24 | 115 | 2159 | 188 | 2121 | 363 | 1175 | 494 | 146 | 291 | 893 | 272 | 38 | 453 | 660 | 72 | 292 | 761 | 352 |
| 2040 | 779 | 26 | 123 | 2345 | 195 | 2301 | 383 | 1262 | 526 | 152 | 308 | 964 | 290 | 39 | 484 | 705 | 75 | 308 | 811 | 368 |
| 2041 | 831 | 27 | 132 | 2546 | 203 | 2497 | 403 | 1356 | 559 | 158 | 326 | 1040 | 308 | 41 | 516 | 753 | 79 | 324 | 864 | 384 |
| 2042 | 886 | 29 | 142 | 2765 | 211 | 2710 | 424 | 1456 | 594 | 164 | 344 | 1122 | 328 | 43 | 550 | 805 | 82 | 342 | 921 | 402 |
| 2043 | 944 | 30 | 152 | 3002 | 219 | 2941 | 447 | 1564 | 631 | 171 | 364 | 1211 | 349 | 45 | 587 | 860 | 86 | 360 | 981 | 420 |
| 2044 | 1006 | 32 | 163 | 3260 | 228 | 3192 | 471 | 1680 | 671 | 178 | 385 | 1307 | 372 | 46 | 626 | 919 | 90 | 379 | 1046 | 439 |
| 2045 | 1073 | 33 | 175 | 3540 | 237 | 3463 | 496 | 1805 | 714 | 185 | 407 | 1410 | 396 | 48 | 668 | 982 | 94 | 400 | 1115 | 459 |
| 2046 | 1144 | 35 | 188 | 3844 | 246 | 3758 | 522 | 1939 | 759 | 192 | 430 | 1522 | 421 | 50 | 713 | 1050 | 98 | 421 | 1188 | 480 |
| 2047 | 1219 | 37 | 201 | 4174 | 256 | 4079 | 550 | 2083 | 806 | 200 | 454 | 1642 | 448 | 52 | 760 | 1122 | 103 | 444 | 1266 | 502 |
| 2048 | 1300 | 39 | 216 | 4532 | 266 | 4426 | 579 | 2237 | 857 | 208 | 480 | 1772 | 477 | 55 | 811 | 1199 | 108 | 467 | 1349 | 524 |
| 2049 | 1385 | 41 | 231 | 4922 | 277 | 4803 | 610 | 2403 | 911 | 216 | 508 | 1912 | 508 | 57 | 865 | 1281 | 112 | 492 | 1437 | 548 |
| 2050 | 1477 | 43 | 248 | 5344 | 288 | 5212 | 642 | 2582 | 969 | 225 | 537 | 2063 | 540 | 59 | 923 | 1369 | 118 | 519 | 1531 | 573 |
| Years | National Regions | |||||||||||||||||||
|---|---|---|---|---|---|---|---|---|---|---|---|---|---|---|---|---|---|---|---|---|
| 1 | 2 | 3 | 4 | 5 | 6 | 7 | 8 | 9 | 10 | 11 | 12 | 13 | 14 | 15 | 16 | 17 | 18 | 19 | 20 | |
| 2016 | 210 | 9 | 27 | 387 | 86 | 399 | 127 | 281 | 153 | 68 | 104 | 206 | 82 | 19 | 131 | 193 | 35 | 118 | 252 | 170 |
| 2017 | 231 | 10 | 31 | 435 | 100 | 446 | 136 | 321 | 173 | 80 | 123 | 241 | 105 | 22 | 150 | 244 | 39 | 138 | 294 | 195 |
| 2018 | 222 | 10 | 31 | 440 | 97 | 457 | 138 | 312 | 164 | 74 | 114 | 232 | 99 | 20 | 144 | 229 | 36 | 128 | 281 | 177 |
| 2019 | 246 | 11 | 31 | 484 | 99 | 477 | 140 | 343 | 178 | 81 | 124 | 251 | 107 | 22 | 157 | 245 | 38 | 140 | 300 | 194 |
| 2020 | 237 | 11 | 34 | 500 | 95 | 519 | 150 | 344 | 176 | 81 | 121 | 269 | 103 | 22 | 162 | 241 | 38 | 137 | 304 | 191 |
| 2021 | 247 | 10 | 36 | 533 | 92 | 559 | 152 | 353 | 182 | 76 | 117 | 262 | 97 | 20 | 161 | 227 | 35 | 133 | 291 | 180 |
| 2022 | 249 | 11 | 34 | 504 | 99 | 517 | 148 | 351 | 183 | 81 | 124 | 264 | 104 | 22 | 162 | 243 | 39 | 140 | 305 | 193 |
| 2023 | 264 | 11 | 38 | 576 | 101 | 571 | 160 | 376 | 186 | 80 | 120 | 266 | 98 | 20 | 163 | 222 | 35 | 128 | 272 | 173 |
| 2024 | 283 | 11 | 41 | 625 | 106 | 618 | 168 | 404 | 198 | 84 | 127 | 287 | 103 | 20 | 175 | 235 | 37 | 135 | 288 | 181 |
| 2025 | 302 | 12 | 44 | 677 | 111 | 669 | 178 | 435 | 211 | 88 | 134 | 311 | 109 | 21 | 188 | 247 | 39 | 143 | 305 | 189 |
| 2026 | 323 | 12 | 47 | 735 | 116 | 724 | 188 | 469 | 224 | 93 | 142 | 336 | 115 | 22 | 202 | 261 | 40 | 151 | 324 | 198 |
| 2027 | 345 | 13 | 50 | 797 | 121 | 784 | 198 | 505 | 239 | 97 | 150 | 364 | 121 | 23 | 216 | 275 | 42 | 159 | 343 | 207 |
| 2028 | 369 | 14 | 54 | 864 | 126 | 848 | 209 | 543 | 254 | 102 | 159 | 393 | 127 | 24 | 232 | 291 | 44 | 169 | 363 | 217 |
| 2029 | 394 | 15 | 58 | 937 | 132 | 918 | 221 | 585 | 270 | 108 | 168 | 425 | 134 | 25 | 249 | 307 | 46 | 178 | 385 | 227 |
| 2030 | 421 | 15 | 62 | 1016 | 138 | 994 | 233 | 630 | 288 | 113 | 178 | 460 | 141 | 25 | 267 | 323 | 48 | 189 | 408 | 237 |
| 2031 | 450 | 16 | 66 | 1101 | 144 | 1076 | 246 | 678 | 306 | 119 | 189 | 498 | 149 | 26 | 287 | 341 | 50 | 199 | 432 | 248 |
| 2032 | 481 | 17 | 71 | 1194 | 150 | 1165 | 259 | 730 | 326 | 125 | 199 | 538 | 157 | 27 | 308 | 360 | 53 | 211 | 457 | 259 |
| 2033 | 514 | 18 | 76 | 1295 | 157 | 1261 | 274 | 786 | 347 | 132 | 211 | 582 | 165 | 29 | 330 | 380 | 55 | 223 | 485 | 271 |
| 2034 | 549 | 19 | 82 | 1404 | 164 | 1365 | 289 | 846 | 369 | 139 | 223 | 630 | 174 | 30 | 355 | 401 | 58 | 236 | 513 | 284 |
| 2035 | 587 | 20 | 88 | 1522 | 171 | 1478 | 305 | 911 | 393 | 146 | 236 | 681 | 183 | 31 | 380 | 423 | 60 | 249 | 544 | 297 |
| 2036 | 627 | 21 | 94 | 1651 | 179 | 1600 | 322 | 981 | 418 | 154 | 250 | 737 | 193 | 32 | 408 | 446 | 63 | 263 | 576 | 311 |
| 2037 | 670 | 22 | 101 | 1790 | 187 | 1732 | 340 | 1056 | 445 | 162 | 264 | 797 | 204 | 33 | 438 | 471 | 66 | 279 | 610 | 325 |
| 2038 | 716 | 24 | 109 | 1941 | 195 | 1875 | 359 | 1137 | 473 | 170 | 280 | 862 | 215 | 34 | 470 | 497 | 69 | 295 | 647 | 340 |
| 2039 | 766 | 25 | 117 | 2104 | 204 | 2030 | 379 | 1224 | 504 | 179 | 296 | 933 | 226 | 36 | 504 | 524 | 72 | 311 | 685 | 355 |
| 2040 | 818 | 26 | 125 | 2282 | 213 | 2197 | 400 | 1318 | 536 | 188 | 313 | 1009 | 238 | 37 | 541 | 553 | 75 | 329 | 726 | 372 |
| 2041 | 874 | 28 | 134 | 2474 | 223 | 2379 | 422 | 1419 | 570 | 198 | 331 | 1091 | 251 | 38 | 581 | 583 | 79 | 348 | 769 | 389 |
| 2042 | 935 | 29 | 144 | 2683 | 233 | 2575 | 445 | 1528 | 607 | 208 | 351 | 1180 | 264 | 40 | 623 | 615 | 83 | 368 | 815 | 407 |
| 2043 | 999 | 31 | 155 | 2909 | 243 | 2788 | 470 | 1645 | 646 | 219 | 371 | 1276 | 278 | 41 | 669 | 649 | 86 | 389 | 863 | 425 |
| 2044 | 1067 | 33 | 166 | 3155 | 254 | 3018 | 496 | 1771 | 687 | 230 | 393 | 1381 | 293 | 43 | 718 | 685 | 90 | 412 | 914 | 445 |
| 2045 | 1141 | 35 | 178 | 3421 | 265 | 3267 | 524 | 1906 | 731 | 242 | 415 | 1493 | 309 | 45 | 770 | 723 | 94 | 435 | 969 | 465 |
| 2046 | 1219 | 36 | 191 | 3709 | 277 | 3536 | 553 | 2052 | 778 | 255 | 439 | 1615 | 325 | 46 | 826 | 762 | 99 | 460 | 1026 | 487 |
| 2047 | 1303 | 38 | 205 | 4022 | 290 | 3828 | 584 | 2210 | 828 | 268 | 465 | 1747 | 343 | 48 | 887 | 804 | 103 | 487 | 1087 | 509 |
| 2048 | 1392 | 41 | 220 | 4361 | 303 | 4144 | 616 | 2379 | 881 | 282 | 492 | 1890 | 361 | 50 | 951 | 849 | 108 | 515 | 1152 | 533 |
| 2049 | 1488 | 43 | 236 | 4729 | 316 | 4486 | 650 | 2561 | 938 | 297 | 521 | 2044 | 380 | 52 | 1021 | 895 | 113 | 544 | 1220 | 557 |
| 2050 | 1590 | 45 | 253 | 5128 | 330 | 4857 | 686 | 2758 | 998 | 312 | 551 | 2211 | 401 | 54 | 1095 | 945 | 118 | 575 | 1292 | 583 |
| Years | National Regions | |||||||||||||||||||
|---|---|---|---|---|---|---|---|---|---|---|---|---|---|---|---|---|---|---|---|---|
| 1 | 2 | 3 | 4 | 5 | 6 | 7 | 8 | 9 | 10 | 11 | 12 | 13 | 14 | 15 | 16 | 17 | 18 | 19 | 20 | |
| 2016 | 210 | 9 | 27 | 387 | 86 | 399 | 127 | 281 | 153 | 68 | 104 | 206 | 82 | 19 | 131 | 193 | 35 | 118 | 252 | 170 |
| 2017 | 231 | 10 | 31 | 435 | 100 | 446 | 136 | 321 | 173 | 80 | 123 | 241 | 105 | 22 | 150 | 244 | 39 | 138 | 294 | 195 |
| 2018 | 222 | 10 | 31 | 440 | 97 | 457 | 138 | 312 | 164 | 74 | 114 | 232 | 99 | 20 | 144 | 229 | 36 | 128 | 281 | 177 |
| 2019 | 246 | 11 | 31 | 484 | 99 | 477 | 140 | 343 | 178 | 81 | 124 | 251 | 107 | 22 | 157 | 245 | 38 | 140 | 300 | 194 |
| 2020 | 237 | 11 | 34 | 500 | 95 | 519 | 150 | 344 | 176 | 81 | 121 | 269 | 103 | 22 | 162 | 241 | 38 | 137 | 304 | 191 |
| 2021 | 247 | 10 | 36 | 533 | 92 | 559 | 152 | 353 | 182 | 76 | 117 | 262 | 97 | 20 | 161 | 227 | 35 | 133 | 291 | 180 |
| 2022 | 250 | 11 | 34 | 508 | 100 | 522 | 149 | 353 | 184 | 81 | 125 | 266 | 108 | 22 | 163 | 253 | 39 | 141 | 311 | 195 |
| 2023 | 267 | 11 | 38 | 586 | 103 | 582 | 160 | 379 | 189 | 81 | 122 | 268 | 106 | 20 | 164 | 240 | 37 | 129 | 283 | 176 |
| 2024 | 287 | 11 | 41 | 641 | 109 | 636 | 170 | 409 | 203 | 86 | 130 | 292 | 115 | 21 | 177 | 264 | 39 | 137 | 306 | 186 |
| 2025 | 309 | 12 | 45 | 700 | 115 | 696 | 179 | 443 | 217 | 91 | 138 | 317 | 126 | 22 | 190 | 289 | 41 | 146 | 330 | 196 |
| 2026 | 332 | 13 | 48 | 766 | 121 | 761 | 190 | 479 | 233 | 97 | 147 | 345 | 137 | 24 | 205 | 317 | 44 | 155 | 356 | 207 |
| 2027 | 357 | 14 | 52 | 838 | 127 | 832 | 201 | 517 | 250 | 103 | 157 | 375 | 150 | 25 | 220 | 348 | 47 | 164 | 385 | 218 |
| 2028 | 383 | 15 | 56 | 916 | 134 | 910 | 213 | 559 | 268 | 109 | 167 | 407 | 164 | 26 | 237 | 382 | 50 | 175 | 416 | 230 |
| 2029 | 412 | 16 | 61 | 1001 | 141 | 995 | 225 | 605 | 287 | 116 | 178 | 443 | 179 | 28 | 255 | 419 | 53 | 186 | 449 | 243 |
| 2030 | 443 | 17 | 65 | 1095 | 149 | 1087 | 238 | 654 | 308 | 123 | 189 | 481 | 195 | 29 | 274 | 459 | 57 | 197 | 485 | 256 |
| 2031 | 476 | 18 | 71 | 1197 | 157 | 1189 | 252 | 707 | 330 | 130 | 201 | 523 | 213 | 31 | 295 | 504 | 60 | 210 | 524 | 270 |
| 2032 | 511 | 19 | 76 | 1309 | 165 | 1300 | 266 | 764 | 354 | 138 | 214 | 569 | 233 | 32 | 318 | 553 | 64 | 223 | 566 | 285 |
| 2033 | 550 | 20 | 82 | 1431 | 174 | 1421 | 282 | 826 | 379 | 147 | 228 | 619 | 254 | 34 | 342 | 606 | 68 | 237 | 611 | 301 |
| 2034 | 591 | 21 | 89 | 1565 | 183 | 1554 | 298 | 893 | 407 | 156 | 243 | 672 | 278 | 36 | 368 | 665 | 73 | 252 | 660 | 317 |
| 2035 | 635 | 23 | 96 | 1711 | 193 | 1699 | 315 | 966 | 436 | 165 | 259 | 731 | 303 | 38 | 396 | 729 | 77 | 267 | 712 | 335 |
| 2036 | 682 | 24 | 104 | 1871 | 203 | 1858 | 334 | 1044 | 467 | 176 | 276 | 795 | 331 | 40 | 426 | 800 | 82 | 284 | 769 | 353 |
| 2037 | 733 | 26 | 112 | 2046 | 214 | 2031 | 353 | 1129 | 501 | 186 | 294 | 864 | 362 | 42 | 458 | 877 | 87 | 302 | 831 | 373 |
| 2038 | 788 | 28 | 121 | 2237 | 226 | 2221 | 374 | 1220 | 537 | 198 | 313 | 939 | 395 | 44 | 493 | 962 | 93 | 321 | 898 | 393 |
| 2039 | 847 | 29 | 131 | 2446 | 238 | 2428 | 395 | 1319 | 576 | 210 | 333 | 1021 | 431 | 47 | 530 | 1056 | 99 | 341 | 969 | 415 |
| 2040 | 910 | 31 | 141 | 2675 | 251 | 2655 | 418 | 1426 | 617 | 223 | 355 | 1110 | 471 | 49 | 571 | 1158 | 105 | 362 | 1047 | 437 |
| 2041 | 978 | 33 | 152 | 2925 | 264 | 2903 | 442 | 1542 | 662 | 237 | 378 | 1206 | 514 | 52 | 614 | 1270 | 112 | 385 | 1131 | 462 |
| 2042 | 1051 | 36 | 165 | 3198 | 278 | 3174 | 468 | 1667 | 710 | 251 | 403 | 1312 | 561 | 55 | 661 | 1393 | 119 | 409 | 1221 | 487 |
| 2043 | 1130 | 38 | 178 | 3497 | 293 | 3470 | 495 | 1803 | 761 | 266 | 429 | 1426 | 613 | 57 | 711 | 1529 | 127 | 435 | 1319 | 514 |
| 2044 | 1214 | 40 | 192 | 3824 | 309 | 3794 | 524 | 1949 | 816 | 283 | 457 | 1550 | 669 | 61 | 765 | 1677 | 135 | 462 | 1424 | 542 |
| 2045 | 1305 | 43 | 207 | 4181 | 325 | 4149 | 554 | 2107 | 874 | 300 | 486 | 1685 | 731 | 64 | 824 | 1839 | 144 | 491 | 1538 | 572 |
| 2046 | 1403 | 46 | 224 | 4572 | 343 | 4536 | 587 | 2278 | 938 | 319 | 518 | 1832 | 798 | 67 | 886 | 2017 | 153 | 522 | 1661 | 603 |
| 2047 | 1508 | 49 | 242 | 4999 | 361 | 4960 | 621 | 2463 | 1005 | 338 | 552 | 1991 | 871 | 71 | 954 | 2213 | 163 | 555 | 1794 | 636 |
| 2048 | 1620 | 52 | 261 | 5466 | 380 | 5423 | 657 | 2663 | 1078 | 359 | 588 | 2165 | 952 | 75 | 1026 | 2428 | 173 | 589 | 1938 | 671 |
| 2049 | 1741 | 55 | 282 | 5977 | 401 | 5929 | 695 | 2879 | 1155 | 381 | 626 | 2353 | 1039 | 79 | 1104 | 2663 | 184 | 626 | 2093 | 708 |
| 2050 | 1871 | 59 | 304 | 6535 | 422 | 6483 | 735 | 3112 | 1239 | 404 | 666 | 2558 | 1135 | 83 | 1188 | 2921 | 196 | 666 | 2261 | 747 |
| Years | National Regions | |||||||||||||||||||
|---|---|---|---|---|---|---|---|---|---|---|---|---|---|---|---|---|---|---|---|---|
| 1 | 2 | 3 | 4 | 5 | 6 | 7 | 8 | 9 | 10 | 11 | 12 | 13 | 14 | 15 | 16 | 17 | 18 | 19 | 20 | |
| 2016 | 210 | 9 | 27 | 387 | 86 | 399 | 127 | 281 | 153 | 68 | 104 | 206 | 82 | 19 | 131 | 193 | 35 | 118 | 252 | 170 |
| 2017 | 231 | 10 | 31 | 435 | 100 | 446 | 136 | 321 | 173 | 80 | 123 | 241 | 105 | 22 | 150 | 244 | 39 | 138 | 294 | 195 |
| 2018 | 222 | 10 | 31 | 440 | 97 | 457 | 138 | 312 | 164 | 74 | 114 | 232 | 99 | 20 | 144 | 229 | 36 | 128 | 281 | 177 |
| 2019 | 246 | 11 | 31 | 484 | 99 | 477 | 140 | 343 | 178 | 81 | 124 | 251 | 107 | 22 | 157 | 245 | 38 | 140 | 300 | 194 |
| 2020 | 237 | 11 | 34 | 500 | 95 | 519 | 150 | 344 | 176 | 81 | 121 | 269 | 103 | 22 | 162 | 241 | 38 | 137 | 304 | 191 |
| 2021 | 247 | 10 | 36 | 533 | 92 | 559 | 152 | 353 | 182 | 76 | 117 | 262 | 97 | 20 | 161 | 227 | 35 | 133 | 291 | 180 |
| 2022 | 246 | 11 | 34 | 501 | 97 | 513 | 148 | 349 | 181 | 79 | 123 | 262 | 102 | 21 | 160 | 238 | 38 | 139 | 302 | 192 |
| 2023 | 259 | 10 | 37 | 569 | 98 | 563 | 158 | 369 | 183 | 75 | 118 | 261 | 95 | 19 | 159 | 214 | 34 | 125 | 267 | 170 |
| 2024 | 274 | 11 | 40 | 614 | 101 | 606 | 165 | 395 | 193 | 77 | 124 | 280 | 98 | 20 | 168 | 221 | 35 | 131 | 280 | 176 |
| 2025 | 290 | 11 | 42 | 661 | 103 | 652 | 173 | 421 | 203 | 79 | 130 | 300 | 102 | 20 | 178 | 229 | 36 | 137 | 294 | 182 |
| 2026 | 306 | 12 | 45 | 713 | 106 | 701 | 182 | 450 | 214 | 81 | 136 | 322 | 105 | 21 | 189 | 237 | 37 | 143 | 309 | 189 |
| 2027 | 324 | 12 | 48 | 768 | 109 | 754 | 191 | 480 | 225 | 83 | 143 | 346 | 109 | 21 | 200 | 245 | 38 | 150 | 324 | 196 |
| 2028 | 342 | 13 | 51 | 828 | 112 | 811 | 200 | 513 | 237 | 85 | 150 | 371 | 113 | 22 | 211 | 254 | 38 | 157 | 341 | 203 |
| 2029 | 362 | 13 | 55 | 893 | 115 | 872 | 210 | 548 | 250 | 87 | 157 | 397 | 117 | 23 | 224 | 262 | 39 | 164 | 357 | 210 |
| 2030 | 383 | 14 | 58 | 962 | 118 | 938 | 220 | 585 | 264 | 89 | 165 | 426 | 121 | 23 | 237 | 272 | 40 | 172 | 375 | 218 |
| 2031 | 405 | 14 | 62 | 1037 | 121 | 1009 | 231 | 625 | 278 | 91 | 173 | 457 | 125 | 24 | 251 | 281 | 41 | 180 | 394 | 226 |
| 2032 | 428 | 15 | 66 | 1118 | 124 | 1085 | 242 | 667 | 293 | 93 | 181 | 490 | 130 | 24 | 266 | 291 | 43 | 188 | 413 | 234 |
| 2033 | 453 | 16 | 71 | 1205 | 128 | 1167 | 254 | 713 | 309 | 95 | 190 | 526 | 134 | 25 | 281 | 301 | 44 | 197 | 434 | 242 |
| 2034 | 479 | 16 | 75 | 1299 | 131 | 1256 | 266 | 761 | 325 | 98 | 199 | 564 | 139 | 26 | 298 | 311 | 45 | 206 | 456 | 251 |
| 2035 | 506 | 17 | 80 | 1400 | 135 | 1351 | 279 | 813 | 343 | 100 | 209 | 605 | 144 | 26 | 315 | 322 | 46 | 216 | 478 | 260 |
| 2036 | 535 | 18 | 86 | 1509 | 138 | 1453 | 293 | 868 | 361 | 102 | 219 | 649 | 149 | 27 | 334 | 333 | 47 | 226 | 502 | 269 |
| 2037 | 566 | 19 | 91 | 1626 | 142 | 1563 | 307 | 927 | 381 | 105 | 230 | 696 | 155 | 28 | 354 | 345 | 48 | 236 | 527 | 279 |
| 2038 | 599 | 19 | 97 | 1753 | 146 | 1681 | 322 | 990 | 401 | 107 | 241 | 746 | 160 | 29 | 374 | 357 | 49 | 247 | 553 | 289 |
| 2039 | 633 | 20 | 104 | 1889 | 149 | 1808 | 338 | 1057 | 423 | 110 | 253 | 800 | 166 | 29 | 396 | 369 | 51 | 259 | 581 | 299 |
| 2040 | 670 | 21 | 111 | 2036 | 153 | 1944 | 355 | 1129 | 446 | 113 | 265 | 858 | 172 | 30 | 420 | 382 | 52 | 271 | 609 | 310 |
| 2041 | 708 | 22 | 118 | 2195 | 158 | 2091 | 372 | 1205 | 470 | 115 | 278 | 921 | 178 | 31 | 444 | 396 | 53 | 284 | 640 | 321 |
| 2042 | 749 | 23 | 126 | 2366 | 162 | 2250 | 390 | 1287 | 495 | 118 | 291 | 987 | 184 | 32 | 470 | 409 | 55 | 297 | 671 | 333 |
| 2043 | 792 | 24 | 134 | 2550 | 166 | 2420 | 409 | 1374 | 522 | 121 | 306 | 1059 | 191 | 33 | 498 | 423 | 56 | 311 | 705 | 345 |
| 2044 | 837 | 25 | 143 | 2748 | 171 | 2602 | 429 | 1468 | 550 | 124 | 320 | 1136 | 197 | 34 | 527 | 438 | 57 | 325 | 740 | 357 |
| 2045 | 886 | 26 | 152 | 2962 | 175 | 2799 | 450 | 1567 | 579 | 127 | 336 | 1218 | 204 | 35 | 558 | 453 | 59 | 340 | 777 | 370 |
| 2046 | 937 | 27 | 162 | 3193 | 180 | 3011 | 472 | 1674 | 610 | 130 | 352 | 1306 | 212 | 35 | 591 | 469 | 60 | 356 | 815 | 383 |
| 2047 | 990 | 28 | 173 | 3441 | 185 | 3238 | 495 | 1787 | 643 | 133 | 370 | 1401 | 219 | 36 | 626 | 486 | 62 | 373 | 856 | 397 |
| 2048 | 1047 | 29 | 184 | 3709 | 190 | 3483 | 520 | 1909 | 678 | 136 | 388 | 1503 | 227 | 37 | 663 | 502 | 63 | 390 | 898 | 412 |
| 2049 | 1108 | 31 | 197 | 3998 | 195 | 3747 | 545 | 2038 | 715 | 139 | 407 | 1612 | 235 | 38 | 701 | 520 | 65 | 408 | 943 | 426 |
| 2050 | 1171 | 32 | 210 | 4309 | 200 | 4030 | 572 | 2177 | 753 | 143 | 426 | 1728 | 243 | 39 | 743 | 538 | 67 | 427 | 990 | 442 |
References
- European Commission. Communication from the Commission to the European Parliament, the European Council, the Council, the European Economic and Social Committee and the Committee of the Regions. The European Green Deal. 2019. Available online: https://eur-lex.europa.eu/legal-content/IT/TXT/?uri=CELEX:52019DC0640 (accessed on 10 November 2022).
- Italian Institute for Environmental Protection and Research. Efficiency and Decarbonization Indicators of the National Energy System and the Electricity Sector. 2022. Available online: https://www.isprambiente.gov.it/files2022/pubblicazioni/rapporti/r363-2022.pdf (accessed on 10 November 2022). (In Italian)
- Ministry of Ecological Transition. Annual Report on the National Energy Situation. Data 2021. Available online: https://dgsaie.mise.gov.it/pub/sen/relazioni/relazione_annuale_situazione_energetica_nazionale_dati_2021.pdf (accessed on 10 November 2022). (In Italian)
- ENEA. Annual Report on Energy Efficiency over the Country. 2021. Available online: https://www.efficienzaenergetica.enea.it/component/jdownloads/?task=download.send&id=511&catid=40&Itemid=101 (accessed on 23 November 2022). (In Italian).
- National Institute of Statistics. National Census of the Population, Buildings, Energy Consumptions. 2011. Available online: http://dati.istat.it/ (accessed on 10 November 2022). (In Italian)
- National Electricity Network S.p.A. Report on Electric Energy Consumption in Italy: The Year 2014. Available online: https://download.terna.it/terna/0000/0642/35.pdf (accessed on 10 November 2022). (In Italian).
- National Electricity Network S.p.A. Report on Electric Energy Consumption in Italy: The Year 2015. Available online: https://download.terna.it/terna/0000/0837/41.pdf (accessed on 10 November 2022). (In Italian).
- National Electricity Network S.p.A. Report on Electric Energy Consumption in Italy: The Year 2016. Available online: https://download.terna.it/terna/0000/0964/23.pdf (accessed on 10 November 2022). (In Italian).
- National Electricity Network S.p.A. Report on Electric Energy Consumption in Italy: The Year 2017. Available online: https://download.terna.it/terna/0000/1089/69.pdf (accessed on 10 November 2022). (In Italian).
- National Electricity Network S.p.A. Report on Electric Energy Consumption in Italy: The Year 2018. Available online: https://download.terna.it/terna/6-CONSUMI_8d726f170b61362.pdf (accessed on 10 November 2022). (In Italian).
- National Electricity Network S.p.A. Report on Electric Energy Consumption in Italy: The Year 2019. Available online: https://download.terna.it/terna/6-CONSUMI_8d9cfa23d9b95aa.pdf (accessed on 10 November 2022). (In Italian).
- National Electricity Network S.p.A. Report on Electric Energy Consumption in Italy: The Year 2020. Available online: https://download.terna.it/terna/6-CONSUMI_8d9cecfdb0ebb54.pdf (accessed on 10 November 2022). (In Italian).
- National Electricity Network S.p.A. Report on Electric Energy Consumption in Italy: The Year 2021. Available online: https://download.terna.it/terna/6%20-%20CONSUMI_8dae443b9f610d6.pdf (accessed on 10 November 2022). (In Italian).
- Energy Services Manager. Statistical Report of the Solar Photovoltaic System: The Year 2016. Available online: https://www.gse.it/documenti_site/Documenti%20GSE/Rapporti%20statistici/Solare%20Fotovoltaico%20-%20Rapporto%20Statistico%202016.pdf (accessed on 10 November 2022). (In Italian).
- Energy Services Manager. Statistical Report of the Solar Photovoltaic System: The Year 2017. Available online: https://www.gse.it/documenti_site/Documenti%20GSE/Rapporti%20statistici/Solare%20Fotovoltaico%20-%20Rapporto%20Statistico%202017.pdf (accessed on 10 November 2022). (In Italian).
- Energy Services Manager. Statistical Report of the Solar Photovoltaic System: The Year 2018. Available online: https://www.gse.it/documenti_site/Documenti%20GSE/Rapporti%20statistici/Solare%20Fotovoltaico%20-%20Rapporto%20Statistico%202018.pdf (accessed on 10 November 2022). (In Italian).
- Energy Services Manager. Statistical Report of the Solar Photovoltaic System: The Year 2019. Available online: https://www.gse.it/documenti_site/Documenti%20GSE/Rapporti%20statistici/Solare%20Fotovoltaico%20-%20Rapporto%20Statistico%202019.pdf (accessed on 10 November 2022). (In Italian).
- Energy Services Manager. Statistical Report of the Solar Photovoltaic System: The Year 2020. Available online: https://www.gse.it/documenti_site/Documenti%20GSE/Rapporti%20statistici/Solare%20Fotovoltaico%20-%20Rapporto%20Statistico%20GSE%202020.pdf (accessed on 10 November 2022). (In Italian).
- Energy Services Manager. Statistical Report of the Solar Photovoltaic System: The Year 2021. Available online: www.gse.it/documenti_site/Documenti%20GSE/Rapporti%20statistici/Solare%20Fotovoltaico%20-%20Rapporto%20Statistico%202021.pdf (accessed on 10 November 2022). (In Italian).
- International Energy Agency. Renewables 2020. Analysis and Forecast to 2025. Available online: https://iea.blob.core.windows.net/assets/1a24f1fe-c971-4c25-964a-57d0f31eb97b/Renewables_2020-PDF.pdf (accessed on 23 November 2022).
- Kampik, M.; Fice, M.; Pilśniak, A.; Bodzek, K.; Piaskowy, A. An Analysis of Energy Consumption in Small- and Medium-Sized Buildings. Energies 2023, 16, 1536. [Google Scholar] [CrossRef]
- Lillo-Bravo, I.; Lopez-Roman, A.; Moreno-Tejera, S.; Delgado-Sanchez, J.M. Photovoltaic energy balance estimation based on the building integration level. Energy Build. 2023, 282, 112786. [Google Scholar] [CrossRef]
- G. Landera, Y.; C. Zevallos, O.; Neto, R.C.; Castro, J.F.D.C.; Neves, F.A.S. A Review of Grid Connection Requirements for Photovoltaic Power Plants. Energies 2023, 16, 2093. [Google Scholar] [CrossRef]
- Kuczynski, W.; Chliszcz, K. Energy and exergy analysis of photovoltaic panels in northern Poland. Renew. Sustain. Energy Rev. 2023, 174, 113138. [Google Scholar] [CrossRef]
- Yao, W.; Kong, X.; Xu, A.; Xu, P.; Wang, Y.; Gao, W. New models for the influence of rainwater on the performance of photovoltaic modules under different rainfall conditions. Renew. Sustain. Energy Rev. 2023, 173, 113119. [Google Scholar] [CrossRef]
- Jiao, J.; Yang, M.; Li, J.; Xiong, D.; Li, H. A novel high reflective glass-ceramic ink with Bi2Ti2O7 nanocrystals used for the photovoltaic glass backplane. J. Eur. Ceram. Soc. 2023; in press. [Google Scholar] [CrossRef]
- Chirwa, D.; Goyal, R.; Mulenga, E. Floating solar photovoltaic (FSPV) potential in Zambia: Case studies on six hydropower power plant reservoirs. Renew. Energy Focus 2023, 44, 344–356. [Google Scholar] [CrossRef]
- Mannino, G.; Tina, G.M.; Cacciato, M.; Merlo, L.; Cucuzza, A.V.; Bizzarri, F.; Canino, A. Photovoltaic Module Degradation Forecast Models for Onshore and Offshore Floating Systems. Energies 2023, 16, 2117. [Google Scholar] [CrossRef]
- Li, G.; Wei, X.; Yang, H. Decomposition integration and error correction method for photovoltaic power forecasting. Measurement 2023, 208, 112462. [Google Scholar] [CrossRef]
- Bezerra Menezes Leite, H.; Zareipour, H. Six Days Ahead Forecasting of Energy Production of Small Behind-the-Meter Solar Sites. Energies 2023, 16, 1533. [Google Scholar] [CrossRef]
- Dolara, A.; Leva, S.; Manzolini, G. Comparison of different physical models for PV power output prediction. Sol. Energy 2015, 119, 83–99. [Google Scholar] [CrossRef]
- Borunda, M.; Ramírez, A.; Garduno, R.; Ruíz, G.; Hernandez, S.; Jaramillo, O.A. Photovoltaic Power Generation Forecasting for Regional Assessment Using Machine Learning. Energies 2022, 15, 8895. [Google Scholar] [CrossRef]
- Mohamad Radzi, P.N.L.; Akhter, M.N.; Mekhilef, S.; Mohamed Shah, N. Review on the Application of Photovoltaic Forecasting Using Machine Learning for Very Short- to Long-Term Forecasting. Sustainability 2023, 15, 2942. [Google Scholar] [CrossRef]
- Cabezón, L.; Ruiz, L.G.B.; Criado-Ramón, D.; J. Gago, E.; Pegalajar, M.C. Photovoltaic Energy Production Forecasting through Machine Learning Methods: A Scottish Solar Farm Case Study. Energies 2022, 15, 8732. [Google Scholar] [CrossRef]
- Polo, J.; Martín-Chivelet, N.; Alonso-Abella, M.; Sanz-Saiz, C.; Cuenca, J.; de la Cruz, M. Exploring the PV Power Forecasting at Building Façades Using Gradient Boosting Methods. Energies 2023, 16, 1495. [Google Scholar] [CrossRef]
- Huang, Y.; Wu, Y. Short-Term Photovoltaic Power Forecasting Based on a Novel Autoformer Model. Symmetry 2023, 15, 238. [Google Scholar] [CrossRef]
- Lim, S.-C.; Huh, J.-H.; Hong, S.-H.; Park, C.-Y.; Kim, J.-C. Solar Power Forecasting Using CNN-LSTM Hybrid Model. Energies 2022, 15, 8233. [Google Scholar] [CrossRef]
- Woźniak, M.; Badora, A.; Kud, K.; Woźniak, L. Renewable Energy Sources as the Future of the Energy Sector and Climate in Poland—Truth or Myth in the Opinion of the Society. Energies 2022, 15, 45. [Google Scholar] [CrossRef]
- Hermoso, V.; Bota, G.; Brotons, L.; Morán-Ordóñez, A. Addressing the challenge of photovoltaic growth: Integrating multiple objectives towards sustainable green energy development. Land Use Policy 2023, 128, 106592. [Google Scholar] [CrossRef]
- President of Italian Republic. Law Decree 1st March 2022, n. 17. Urgent Measures to Contain the Electric Energy and Natural Gas Costs, for the Development of Renewable Energy Sources, and for Industrial Policies Relaunch. Available online: https://www.gazzettaufficiale.it/eli/gu/2022/03/01/50/sg/pdf (accessed on 10 November 2022). (In Italian).
- Energy Services Manager. Solar Atlas and Weather Forecast (sunRISE). Available online: http://sunrise.rse-web.it/ (accessed on 23 March 2023). (In Italian).


| National Zones | 2014 | 2015 | 2016 | 2017 | 2018 | 2019 | 2020 | 2021 |
|---|---|---|---|---|---|---|---|---|
| Valle d’Aosta | 178.4 | 175.9 | 176.6 | 176.6 | 177.9 | 165.7 | 161.0 | 156.2 |
| Piemonte | 4579.3 | 4627.1 | 4538.6 | 4554.3 | 4555.6 | 4545.3 | 4623.2 | 4534.8 |
| Liguria | 1729.9 | 1737.5 | 1701.0 | 1693.0 | 1698.8 | 1687.3 | 1699.5 | 1686.5 |
| Lombardia | 10,999.5 | 11,341.4 | 11,124.3 | 11,258.9 | 11,333.8 | 11,511.6 | 11,456.7 | 11,346.1 |
| Trentino Alto Adige | 1195.2 | 1149.2 | 1156.2 | 1148.6 | 1160.1 | 1164.0 | 1158.9 | 1160.9 |
| Veneto | 5195.5 | 5570.4 | 5396.5 | 5552.7 | 5595.5 | 5688.0 | 5644.3 | 5747.4 |
| Friuli Venezia Giulia | 1316.4 | 1369.4 | 1340.2 | 1381.4 | 1391.2 | 1383.0 | 1377.4 | 1397.1 |
| Emilia Romagna | 4900.0 | 5201.7 | 5041.2 | 5136.2 | 5143.5 | 5159.8 | 5174.8 | 5199.8 |
| Toscana | 4032.9 | 4110.5 | 4026.9 | 4082.1 | 4087.0 | 4126.3 | 4156.8 | 4146.2 |
| Umbria | 912.0 | 935.4 | 907.6 | 926.3 | 921.6 | 925.2 | 938.4 | 945.4 |
| Marche | 1520.0 | 1555.2 | 1513.2 | 1537.2 | 1546.4 | 1543.7 | 1567.3 | 1584.6 |
| Lazio | 6699.9 | 6852.9 | 6670.5 | 6686.3 | 6456.3 | 6322.4 | 6518 | 6551.6 |
| Abruzzo | 1286.4 | 1320.9 | 1286.6 | 1304.8 | 1294.2 | 1318.1 | 1317.7 | 1337.1 |
| Molise | 284.4 | 286.4 | 279.8 | 282.4 | 276.1 | 277.7 | 281.0 | 284.8 |
| Campania | 5351.9 | 5484.1 | 5260.1 | 5347.6 | 5312.1 | 5443.8 | 5532.3 | 5633.0 |
| Puglia | 3988.5 | 4160.7 | 3996.7 | 4168.6 | 4100.6 | 4133.9 | 4175.4 | 4397.9 |
| Basilicata | 490.3 | 498.9 | 488.5 | 503.2 | 494.0 | 495.6 | 501.1 | 512.0 |
| Calabria | 1998.1 | 2044.8 | 1984.2 | 2041.9 | 1992.2 | 2036.3 | 2036.2 | 2120.7 |
| Sicilia | 5481.8 | 5614.1 | 5340.6 | 5552 | 5436.9 | 5433.2 | 5666.2 | 5974.6 |
| Sardegna | 2114.5 | 2150.5 | 2074.7 | 2156.6 | 2164.0 | 2277.1 | 2225.7 | 2335.5 |
| Northwest | 17,487.1 | 17,881.9 | 17,540.5 | 17,682.8 | 17,766.1 | 17,909.9 | 17,940.4 | 17,723.6 |
| Northeast | 12,607.1 | 13,290.7 | 12,934.1 | 13,218.9 | 13,290.3 | 13,394.8 | 13,355.4 | 13,505.2 |
| Centre | 13,164.8 | 13,454 | 13,118.2 | 13,231.9 | 13,011.3 | 12,917.6 | 13,180.5 | 13,227.8 |
| South | 13,399.6 | 13,795.8 | 13,295.9 | 13,648.5 | 13,469.2 | 13,705.4 | 13,843.7 | 14,285.5 |
| Islands | 7596.3 | 7764.6 | 7415.3 | 7708.6 | 7600.9 | 7710.3 | 7891.9 | 8310.1 |
| Total | 64,254.9 | 66,187 | 64,304 | 65,490.7 | 65,137.8 | 65,638 | 66,211.9 | 67,052.2 |
| National Zones | 2016 | 2017 | 2018 | 2019 | 2020 | 2021 |
|---|---|---|---|---|---|---|
| Valle d’Aosta | 1610 | 1738 | 1833 | 1925 | 1972 | 2094 |
| Piemonte | 39,350 | 41,976 | 44,641 | 48,030 | 50,060 | 54,141 |
| Liguria | 6204 | 6677 | 7219 | 7811 | 8282 | 8792 |
| Lombardia | 87,343 | 94,721 | 102,340 | 111,356 | 119,000 | 131,822 |
| Trentino Alto Adige | 16,715 | 17,568 | 18,284 | 19,056 | 19,004 | 20,287 |
| Veneto | 83,891 | 90,150 | 97,453 | 106,419 | 113,993 | 126,203 |
| Friuli Venezia Giulia | 25,784 | 27,159 | 28,660 | 30,323 | 31,480 | 33,395 |
| Emilia Romagna | 59,075 | 63,572 | 68,189 | 73,724 | 77,773 | 84,471 |
| Toscana | 30,705 | 32,565 | 34,604 | 36,999 | 38,420 | 41,666 |
| Umbria | 13,238 | 13,971 | 14,929 | 15,829 | 16,466 | 16,077 |
| Marche | 18,887 | 20,263 | 21,315 | 22,731 | 23,607 | 24,924 |
| Lazio | 39,906 | 43,526 | 47,159 | 51,268 | 54,328 | 58,368 |
| Abruzzo | 13,240 | 15,200 | 16,118 | 17,205 | 17,437 | 18,005 |
| Molise | 2748 | 2948 | 3049 | 3214 | 3282 | 3367 |
| Campania | 22,514 | 24,110 | 25,816 | 27,817 | 28,781 | 31,077 |
| Puglia | 30,903 | 36,235 | 38,117 | 40,644 | 42,551 | 42,782 |
| Basilicata | 4959 | 5393 | 5612 | 5974 | 5994 | 6186 |
| Calabria | 17,367 | 18,546 | 19,509 | 20,676 | 21,255 | 22,539 |
| Sicilia | 37,111 | 41,123 | 43,634 | 46,727 | 48,888 | 50,930 |
| Sardegna | 28,435 | 30,248 | 31,643 | 33,384 | 34,226 | 35,484 |
| Northwest | 134,507 | 145,112 | 156,033 | 169,122 | 179,314 | 196,849 |
| Northeast | 185,465 | 198,449 | 212,586 | 229,522 | 242,250 | 264,356 |
| Centre | 102,736 | 110,325 | 118,007 | 126,827 | 132,821 | 141,035 |
| South | 91,731 | 102,432 | 108,221 | 115,530 | 119,300 | 123,956 |
| Islands | 65,546 | 71,371 | 75,277 | 80,111 | 83,114 | 86,414 |
| Total | 579,985 | 627,689 | 670,124 | 721,112 | 756,799 | 812,610 |
| National Zones | 2016 | 2017 | 2018 | 2019 | 2020 | 2021 |
|---|---|---|---|---|---|---|
| Valle d’Aosta | 8.0 | 9.0 | 9.0 | 10.0 | 9.0 | 10.0 |
| Piemonte | 198.0 | 209.0 | 220.0 | 235.0 | 232.0 | 253.0 |
| Liguria | 26.0 | 29.0 | 31.0 | 34.0 | 34.0 | 37.0 |
| Lombardia | 390.0 | 421.0 | 453.0 | 493.0 | 516.0 | 578.0 |
| Trentino Alto Adige | 80.0 | 90.0 | 94.0 | 97.0 | 88.0 | 92.0 |
| Veneto | 393.0 | 421.0 | 451.0 | 491.0 | 509.0 | 568.0 |
| Friuli Venezia Giulia | 126.0 | 129.0 | 135.0 | 143.0 | 145.0 | 155.0 |
| Emilia Romagna | 271.0 | 287.0 | 306.0 | 330.0 | 330.0 | 361.0 |
| Toscana | 139.0 | 148.0 | 156.0 | 166.0 | 166.0 | 182.0 |
| Umbria | 62.0 | 66.0 | 70.0 | 74.0 | 73.0 | 73.0 |
| Marche | 93.0 | 100.0 | 104.0 | 110.0 | 106.0 | 111.0 |
| Lazio | 183.0 | 199.0 | 213.0 | 230.0 | 239.0 | 257.0 |
| Abruzzo | 71.0 | 84.0 | 88.0 | 93.0 | 88.0 | 91.0 |
| Molise | 16.0 | 17.0 | 18.0 | 19.0 | 18.0 | 18.0 |
| Campania | 118.0 | 126.0 | 134.0 | 144.0 | 145.0 | 158.0 |
| Puglia | 159.0 | 188.0 | 196.0 | 207.0 | 206.0 | 206.0 |
| Basilicata | 29.0 | 31.0 | 32.0 | 33.0 | 31.0 | 32.0 |
| Calabria | 96.0 | 106.0 | 111.0 | 117.0 | 114.0 | 120.0 |
| Sicilia | 199.0 | 221.0 | 232.0 | 247.0 | 250.0 | 262.0 |
| Sardegna | 136.0 | 148.0 | 154.0 | 161.0 | 159.0 | 163.0 |
| Northwest | 622.0 | 668.0 | 713.0 | 772.0 | 791.0 | 878.0 |
| Northeast | 870.0 | 927.0 | 986.0 | 1061.0 | 1072.0 | 1176.0 |
| Centre | 477.0 | 513.0 | 543.0 | 580.0 | 584.0 | 623.0 |
| South | 489.0 | 552.0 | 579.0 | 613.0 | 602.0 | 625.0 |
| Islands | 335.0 | 369.0 | 386.0 | 408.0 | 409.0 | 425.0 |
| Total | 2793.0 | 3029.0 | 3207.0 | 3434.0 | 3458.0 | 3727.0 |
| National Zones | 2016 | 2017 | 2018 | 2019 | 2020 | 2021 |
|---|---|---|---|---|---|---|
| Valle d’Aosta | 0.04 | 0.04 | 0.04 | 0.05 | 0.04 | 0.05 |
| Piemonte | 0.98 | 1.03 | 1.09 | 1.16 | 1.15 | 1.25 |
| Liguria | 0.13 | 0.14 | 0.15 | 0.17 | 0.17 | 0.18 |
| Lombardia | 1.93 | 2.08 | 2.24 | 2.44 | 2.55 | 2.86 |
| Trentino Alto Adige | 0.40 | 0.45 | 0.46 | 0.48 | 0.44 | 0.46 |
| Veneto | 1.94 | 2.08 | 2.23 | 2.43 | 2.52 | 2.81 |
| Friuli Venezia Giulia | 0.62 | 0.64 | 0.67 | 0.71 | 0.72 | 0.77 |
| Emilia Romagna | 1.34 | 1.42 | 1.51 | 1.63 | 1.63 | 1.79 |
| Toscana | 0.69 | 0.73 | 0.77 | 0.82 | 0.82 | 0.90 |
| Umbria | 0.31 | 0.33 | 0.35 | 0.37 | 0.36 | 0.36 |
| Marche | 0.46 | 0.49 | 0.51 | 0.54 | 0.52 | 0.55 |
| Lazio | 0.91 | 0.98 | 1.05 | 1.14 | 1.18 | 1.27 |
| Abruzzo | 0.35 | 0.42 | 0.44 | 0.46 | 0.44 | 0.45 |
| Molise | 0.08 | 0.08 | 0.09 | 0.09 | 0.09 | 0.09 |
| Campania | 0.58 | 0.62 | 0.66 | 0.71 | 0.72 | 0.78 |
| Puglia | 0.79 | 0.93 | 0.97 | 1.02 | 1.02 | 1.02 |
| Basilicata | 0.14 | 0.15 | 0.16 | 0.16 | 0.15 | 0.16 |
| Calabria | 0.47 | 0.52 | 0.55 | 0.58 | 0.56 | 0.59 |
| Sicilia | 0.98 | 1.09 | 1.15 | 1.22 | 1.24 | 1.30 |
| Sardegna | 0.67 | 0.73 | 0.76 | 0.80 | 0.79 | 0.81 |
| Northwest | 3.08 | 3.30 | 3.53 | 3.82 | 3.91 | 4.34 |
| Northeast | 4.30 | 4.59 | 4.88 | 5.25 | 5.30 | 5.82 |
| Centre | 2.36 | 2.54 | 2.69 | 2.87 | 2.89 | 3.08 |
| South | 2.42 | 2.73 | 2.86 | 3.03 | 2.98 | 3.09 |
| Islands | 1.66 | 1.83 | 1.91 | 2.02 | 2.02 | 2.10 |
| Total | 13.82 | 14.98 | 15.86 | 16.99 | 17.11 | 18.44 |
| Regions | GRPhV-1 | GRPhV-2 | GRPhV-3 | GRPhV-4 |
|---|---|---|---|---|
| Valle d’Aosta | 5.4 | 5.6 | 6.5 | 4.3 |
| Piemonte | 6.6 | 6.9 | 7.5 | 5.7 |
| Liguria | 7.2 | 7.3 | 8.0 | 6.6 |
| Lombardia | 8.6 | 8.4 | 9.3 | 7.8 |
| Trentino Alto Adige | 4.0 | 4.5 | 5.4 | 2.7 |
| Veneto | 8.5 | 8.3 | 9.3 | 7.6 |
| Friuli Venezia Giulia | 5.3 | 5.6 | 5.8 | 4.9 |
| Emilia Romagna | 7.4 | 7.7 | 8.1 | 6.8 |
| Toscana | 6.3 | 6.4 | 7.2 | 5.4 |
| Umbria | 4.0 | 5.2 | 6.1 | 2.4 |
| Marche | 5.7 | 5.8 | 6.5 | 4.9 |
| Lazio | 7.9 | 8.2 | 8.7 | 7.3 |
| Abruzzo | 6.4 | 5.3 | 9.2 | 3.5 |
| Molise | 4.2 | 3.8 | 5.4 | 2.7 |
| Campania | 6.7 | 7.3 | 7.6 | 5.9 |
| Puglia | 6.9 | 5.5 | 9.7 | 3.5 |
| Basilicata | 4.6 | 4.6 | 6.4 | 2.5 |
| Calabria | 5.4 | 5.7 | 6.3 | 4.7 |
| Sicilia | 6.6 | 5.9 | 8.0 | 5.0 |
| Sardegna | 4.5 | 4.6 | 5.5 | 3.6 |
| Italy | 7.0 | 7.2 | 7.7 | 6.4 |
| Regions | 2016–2017 | 2017–2018 | 2018–2019 | 2019–2020 | 2020–2021 | Mean |
|---|---|---|---|---|---|---|
| Valle d’Aosta | 5.6 | 5.3 | 6.8 | −1.3 | 9.1 | 5.1 |
| Piemonte | 12.5 | 0.0 | 11.1 | −10.0 | 11.1 | 4.9 |
| Liguria | 11.5 | 6.9 | 9.7 | 0.0 | 8.8 | 7.4 |
| Lombardia | 7.9 | 7.6 | 8.8 | 4.7 | 12.0 | 8.2 |
| Trentino Alto Adige | 12.5 | 4.4 | 3.2 | −9.3 | 4.5 | 3.1 |
| Veneto | 7.1 | 7.1 | 8.9 | 3.7 | 11.6 | 7.7 |
| Friuli Venezia Giulia | 2.4 | 4.7 | 5.9 | 1.4 | 6.9 | 4.3 |
| Emilia Romagna | 5.9 | 6.6 | 7.8 | 0.0 | 9.4 | 6.0 |
| Toscana | 6.5 | 5.4 | 6.4 | 0.0 | 9.6 | 5.6 |
| Umbria | 6.5 | 6.1 | 5.7 | −1.4 | 0.0 | 3.4 |
| Marche | 7.5 | 4.0 | 5.8 | −3.6 | 4.7 | 3.7 |
| Lazio | 8.7 | 7.0 | 8.0 | 3.9 | 7.5 | 7.0 |
| Abruzzo | 18.3 | 4.8 | 5.7 | −5.4 | 3.4 | 5.4 |
| Molise | 6.3 | 5.9 | 5.6 | −5.3 | 0.0 | 2.5 |
| Campania | 6.8 | 6.3 | 7.5 | 0.7 | 9.0 | 6.1 |
| Puglia | 18.2 | 4.3 | 5.6 | −0.5 | 0.0 | 5.5 |
| Basilicata | 6.9 | 3.2 | 3.1 | −6.1 | 3.2 | 2.1 |
| Calabria | 10.4 | 4.7 | 5.4 | −2.6 | 5.3 | 4.6 |
| Sicilia | 11.1 | 5.0 | 6.5 | 1.2 | 4.8 | 5.7 |
| Sardegna | 8.8 | 4.1 | 4.5 | −1.2 | 2.5 | 3.7 |
| Italy | 9.1 | 5.2 | 6.6 | −1.5 | 6.2 | 5.1 |
| Zones | SFH | MFH | |||||||||
|---|---|---|---|---|---|---|---|---|---|---|---|
| 1 Floor | 2 Floors | 3 Floors | ≥4 Floors | ||||||||
| n. 1 | n. 1 | n. 2 | n. 3–4 | n. 2 | n. 3–4 | n. 5–8 | n. 3–4 | n. 5–8 | n. 9–15 | n. ≥16 | |
| Piemonte | 0.3 | 1.5 | 0.3 | 0.1 | 0.9 | 0.3 | 0.8 | 0.7 | 0.1 | 1.0 | 1.7 |
| Valle d’Aosta | 0.0 | 0.0 | 0.0 | 0.0 | 0.1 | 0.0 | 0.1 | 0.1 | 0.0 | 0.0 | 0.1 |
| Liguria | 0.1 | 0.3 | 0.2 | 0.0 | 0.2 | 0.1 | 0.4 | 0.3 | 0.0 | 0.5 | 1.1 |
| Lombardia | 0.4 | 1.7 | 1.1 | 1.5 | 1.3 | 0.8 | 2.1 | 0.5 | 0.3 | 2.2 | 3.4 |
| Trentino Alto Adige | 0.0 | 0.2 | 0.0 | 0.0 | 0.3 | 0.1 | 0.3 | 0.3 | 0.0 | 0.2 | 0.2 |
| Veneto | 0.3 | 1.5 | 0.8 | 0.9 | 0.9 | 0.4 | 0.9 | 0.2 | 0.2 | 0.9 | 0.8 |
| Friuli Venezia Giulia | 0.1 | 0.5 | 0.0 | 0.0 | 0.4 | 0.1 | 0.2 | 0.2 | 0.0 | 0.3 | 0.3 |
| Emilia Romagna | 0.2 | 1.0 | 0.6 | 0.4 | 0.7 | 0.4 | 1.2 | 0.7 | 0.1 | 1.2 | 1.2 |
| Toscana | 0.3 | 0.9 | 0.5 | 0.5 | 0.6 | 0.4 | 0.9 | 0.4 | 0.1 | 0.8 | 0.9 |
| Umbria | 0.1 | 0.3 | 0.1 | 0.0 | 0.2 | 0.1 | 0.2 | 0.2 | 0.0 | 0.1 | 0.1 |
| Marche | 0.1 | 0.4 | 0.1 | 0.0 | 0.4 | 0.2 | 0.4 | 0.4 | 0.0 | 0.3 | 0.3 |
| Lazio | 0.5 | 0.7 | 0.5 | 0.8 | 0.6 | 0.4 | 0.8 | 0.2 | 0.4 | 1.3 | 2.1 |
| Abruzzo | 0.1 | 0.5 | 0.1 | 0.0 | 0.4 | 0.1 | 0.3 | 0.3 | 0.0 | 0.3 | 0.3 |
| Molise | 0.0 | 0.2 | 0.0 | 0.0 | 0.1 | 0.0 | 0.1 | 0.1 | 0.0 | 0.1 | 0.1 |
| Campania | 0.5 | 0.9 | 0.6 | 1.3 | 0.8 | 0.4 | 0.5 | 0.0 | 0.6 | 0.9 | 1.4 |
| Puglia | 1.4 | 0.5 | 0.5 | 1.1 | 0.6 | 0.0 | 0.0 | 0.0 | 0.8 | 0.8 | 1.0 |
| Basilicata | 0.1 | 0.2 | 0.1 | 0.0 | 0.1 | 0.1 | 0.1 | 0.1 | 0.0 | 0.1 | 0.1 |
| Calabria | 0.4 | 0.7 | 0.3 | 0.1 | 0.5 | 0.2 | 0.5 | 0.5 | 0.1 | 0.4 | 0.4 |
| Sicilia | 1.3 | 1.5 | 0.4 | 0.1 | 1.5 | 0.5 | 0.9 | 1.2 | 0.1 | 0.8 | 1.0 |
| Sardegna | 0.4 | 0.7 | 0.2 | 0.0 | 0.3 | 0.1 | 0.3 | 0.3 | 0.0 | 0.3 | 0.3 |
| Northwest | 0.8 | 3.5 | 1.6 | 1.6 | 2.6 | 1.3 | 3.2 | 1.5 | 0.4 | 3.8 | 6.3 |
| Northeast | 0.6 | 3.2 | 1.4 | 1.3 | 2.3 | 1.0 | 2.6 | 1.4 | 0.4 | 2.6 | 2.6 |
| Centre | 0.9 | 2.3 | 1.3 | 1.4 | 1.9 | 1.0 | 2.3 | 1.2 | 0.5 | 2.6 | 3.4 |
| South | 2.6 | 2.9 | 1.6 | 2.4 | 2.5 | 0.8 | 1.5 | 1.1 | 1.5 | 2.4 | 3.3 |
| Islands | 1.7 | 2.2 | 0.6 | 0.1 | 1.8 | 0.6 | 1.2 | 1.5 | 0.1 | 1.1 | 1.3 |
| Total | 6.7 | 14.3 | 7.9 | 3.7 | 9.7 | 5.2 | 12.4 | 9.3 | 1.4 | 12.5 | 16.9 |
| Building Type | Area | Net Surface Area Distribution of the Building Units (%) | ||||||||
|---|---|---|---|---|---|---|---|---|---|---|
| ≤29 * | 30–39 | 40–49 | 50–59 | 60–79 | 80–99 | 100–119 | 120–149 | ≥150 | ||
| SFH | NW | 0.0 | 0.0 | 0.2 | 0.5 | 2.2 | 3.6 | 3.1 | 2.9 | 4.6 |
| NE | 0.0 | 0.0 | 0.1 | 0.3 | 1.6 | 3.0 | 3.3 | 3.4 | 5.9 | |
| C | 0.0 | 0.0 | 0.1 | 0.3 | 1.6 | 2.9 | 2.8 | 2.5 | 3.6 | |
| S | 0.0 | 0.1 | 0.2 | 0.5 | 2.6 | 6.2 | 6.5 | 6.0 | 7.9 | |
| I | 0.0 | 0.0 | 0.2 | 0.4 | 1.8 | 3.9 | 4.8 | 4.6 | 5.6 | |
| MFH (2 floors) | NW | 0.0 | 0.3 | 1.0 | 1.8 | 6.4 | 9.3 | 6.8 | 5.7 | 7.7 |
| NE | 0.0 | 0.1 | 0.3 | 0.5 | 2.3 | 3.7 | 3.4 | 3.2 | 5.1 | |
| C | 0.0 | 0.1 | 0.4 | 0.7 | 2.8 | 3.8 | 2.9 | 2.3 | 3.0 | |
| S | 0.0 | 0.2 | 0.4 | 0.7 | 3.0 | 5.7 | 4.8 | 3.6 | 4.1 | |
| I | 0.0 | 0.0 | 0.1 | 0.1 | 0.4 | 0.8 | 0.8 | 0.7 | 0.7 | |
| MFH (3 floors) | NW | 0.0 | 0.3 | 1.1 | 1.9 | 6.9 | 9.8 | 7.2 | 6.0 | 8.2 |
| NE | 0.0 | 0.1 | 0.3 | 0.6 | 2.5 | 4.0 | 3.7 | 3.3 | 5.1 | |
| C | 0.0 | 0.1 | 0.4 | 0.7 | 2.6 | 3.6 | 2.8 | 2.2 | 2.9 | |
| S | 0.0 | 0.1 | 0.2 | 0.4 | 1.5 | 2.8 | 2.4 | 1.8 | 2.1 | |
| I | 0.0 | 0.1 | 0.2 | 0.4 | 1.5 | 2.7 | 2.9 | 2.2 | 2.4 | |
| MFH (≥4 floors) | NW | 0.0 | 0.3 | 1.1 | 1.9 | 7.0 | 9.9 | 7.2 | 6.0 | 8.3 |
| NE | 0.0 | 0.1 | 0.3 | 0.5 | 2.1 | 3.3 | 2.9 | 2.6 | 4.0 | |
| C | 0.0 | 0.1 | 0.4 | 0.7 | 2.9 | 4.0 | 3.1 | 2.4 | 3.1 | |
| S | 0.0 | 0.1 | 0.3 | 0.5 | 2.0 | 3.9 | 3.3 | 2.5 | 2.9 | |
| I | 0.0 | 0.1 | 0.2 | 0.3 | 1.2 | 2.2 | 2.3 | 1.8 | 1.9 | |
| Zones | SFH | MFH | Total | 25° | 30% |
|---|---|---|---|---|---|
| Piemonte | 41.85 | 46.74 | 88.58 | 97.74 | 29.32 |
| Valle d’Aosta | 1.19 | 0.07 | 1.26 | 1.39 | 0.42 |
| Liguria | 8.08 | 7.44 | 15.53 | 17.13 | 5.14 |
| Lombardia | 51.63 | 251.99 | 303.62 | 335.01 | 100.50 |
| Trentino Alto Adige | 5.52 | 2.76 | 8.28 | 9.13 | 2.74 |
| Veneto | 53.63 | 71.34 | 124.97 | 137.89 | 41.37 |
| Friuli Venezia Giulia | 16.61 | 3.68 | 20.30 | 22.40 | 6.72 |
| Emilia Romagna | 30.24 | 58.96 | 89.20 | 98.42 | 29.53 |
| Toscana | 29.55 | 39.96 | 69.51 | 76.69 | 23.01 |
| Umbria | 8.74 | 2.11 | 10.85 | 11.98 | 3.59 |
| Marche | 11.89 | 6.56 | 18.45 | 20.36 | 6.11 |
| Lazio | 32.90 | 71.37 | 104.27 | 115.05 | 34.51 |
| Abruzzo | 18.00 | 4.71 | 22.72 | 25.06 | 7.52 |
| Molise | 5.73 | 0.24 | 5.97 | 6.59 | 1.98 |
| Campania | 38.42 | 66.67 | 105.09 | 115.95 | 34.78 |
| Puglia | 72.93 | 38.16 | 111.09 | 122.58 | 36.77 |
| Basilicata | 8.41 | 0.85 | 9.26 | 10.22 | 3.07 |
| Calabria | 36.59 | 11.74 | 48.33 | 53.32 | 16.00 |
| Sicilia | 89.58 | 60.16 | 149.74 | 165.22 | 49.57 |
| Sardegna | 37.82 | 6.63 | 44.45 | 49.04 | 14.71 |
| Northwest | 102.75 | 306.24 | 408.99 | 451.27 | 135.38 |
| Northeast | 106.01 | 136.74 | 242.75 | 267.84 | 80.35 |
| Centre | 83.09 | 119.99 | 203.08 | 224.07 | 67.22 |
| South | 180.09 | 122.36 | 302.45 | 333.72 | 100.12 |
| Islands | 127.40 | 66.79 | 194.18 | 214.26 | 64.28 |
| Total | 599.33 | 752.13 | 1351.45 | 1491.16 | 447.35 |
| National Zones | Number (-) | Power (kW) | Energy (kWh/kW) | Available Roof Surface (km2) | Energy Consumption (kWh) | GREC (%) |
|---|---|---|---|---|---|---|
| Valle d’Aosta | 1862.0 | 9.2 | 1111.6 | 0.42 | 172.3 | −1.36 |
| Piemonte | 46,366.3 | 224.5 | 1036.6 | 29.32 | 4566.1 | −0.44 |
| Liguria | 7497.5 | 31.8 | 998.7 | 5.14 | 1701.6 | −0.54 |
| Lombardia | 107,763.7 | 475.2 | 978.3 | 100.50 | 11,310.2 | 0.01 |
| Trentino Alto Adige | 18,485.7 | 90.2 | 1053.0 | 2.74 | 1158.2 | −0.64 |
| Veneto | 103,018.2 | 472.2 | 1010.5 | 41.37 | 5574.6 | 0.54 |
| Friuli Venezia Giulia | 29,466.8 | 138.8 | 1013.1 | 6.72 | 1373.8 | 0.35 |
| Emilia Romagna | 71,134.0 | 314.2 | 1039.1 | 29.53 | 5142.6 | 0.01 |
| Toscana | 35,826.5 | 159.5 | 1075.6 | 23.01 | 4097.5 | 0.15 |
| Umbria | 15,085.0 | 69.7 | 1101.9 | 3.59 | 926.5 | 0.19 |
| Marche | 21,954.5 | 104.0 | 1127.9 | 6.11 | 1545.0 | 0.32 |
| Lazio | 49,092.5 | 220.2 | 1110.4 | 34.51 | 6597.1 | −0.61 |
| Abruzzo | 16,200.8 | 85.8 | 1152.8 | 7.52 | 1307.1 | 0.22 |
| Molise | 3101.3 | 17.7 | 1180.7 | 1.98 | 281.7 | −0.19 |
| Campania | 26,685.8 | 137.5 | 1100.3 | 34.78 | 5412.0 | 0.47 |
| Puglia | 38,538.7 | 193.7 | 1189.2 | 36.77 | 4122.7 | 0.92 |
| Basilicata | 5686.3 | 31.3 | 1176.8 | 3.07 | 497.2 | 0.24 |
| Calabria | 19,982.0 | 110.7 | 1198.5 | 16.00 | 2024.9 | 0.34 |
| Sicilia | 44,735.5 | 235.2 | 1224.9 | 49.57 | 5530.7 | 0.87 |
| Sardegna | 32,236.7 | 153.5 | 1204.6 | 14.71 | 2181.4 | 1.03 |
| Northwest | 163,489.5 | 740.7 | 1031.3 | 135.4 | 17,750.1 | −0.58 |
| Northeast | 222,104.7 | 1015.3 | 1028.9 | 80.4 | 13,249.1 | 0.06 |
| Centre | 121,958.5 | 553.3 | 1103.9 | 67.2 | 13,166.1 | 0.01 |
| South | 110,195.0 | 576.7 | 1166.4 | 100.1 | 13,645.5 | 0.33 |
| Islands | 76,972.2 | 388.7 | 1214.7 | 64.3 | 7712.1 | 0.95 |
| Total | 694,719.8 | 3274.7 | 1104.2 | 447.3 | 65,522.8 | 0.09 |
| National Zones | Energy Forecasting without DRP-PhV | Energy Forecasting with DRP-PhV | ||
|---|---|---|---|---|
| 2030 | 2050 | 2030 | 2050 | |
| Northwest | 1513.8 | 7016.7 | 1623.3 | 7537.5 |
| Northeast | 1994.5 | 8630.8 | 2122.5 | 9207.1 |
| Centre | 1039.4 | 4071.6 | 1098.3 | 4313.8 |
| South | 994.7 | 3188.1 | 1046.7 | 3358.6 |
| Islands | 644.8 | 1875.0 | 676.9 | 1970.5 |
| Italy | 6187.2 | 24,782.2 | 6567.7 | 26,387.4 |
Disclaimer/Publisher’s Note: The statements, opinions and data contained in all publications are solely those of the individual author(s) and contributor(s) and not of MDPI and/or the editor(s). MDPI and/or the editor(s) disclaim responsibility for any injury to people or property resulting from any ideas, methods, instructions or products referred to in the content. |
© 2023 by the authors. Licensee MDPI, Basel, Switzerland. This article is an open access article distributed under the terms and conditions of the Creative Commons Attribution (CC BY) license (https://creativecommons.org/licenses/by/4.0/).
Share and Cite
Palladino, D.; Calabrese, N. Energy Planning of Renewable Energy Sources in an Italian Context: Energy Forecasting Analysis of Photovoltaic Systems in the Residential Sector. Energies 2023, 16, 3042. https://doi.org/10.3390/en16073042
Palladino D, Calabrese N. Energy Planning of Renewable Energy Sources in an Italian Context: Energy Forecasting Analysis of Photovoltaic Systems in the Residential Sector. Energies. 2023; 16(7):3042. https://doi.org/10.3390/en16073042
Chicago/Turabian StylePalladino, Domenico, and Nicolandrea Calabrese. 2023. "Energy Planning of Renewable Energy Sources in an Italian Context: Energy Forecasting Analysis of Photovoltaic Systems in the Residential Sector" Energies 16, no. 7: 3042. https://doi.org/10.3390/en16073042
APA StylePalladino, D., & Calabrese, N. (2023). Energy Planning of Renewable Energy Sources in an Italian Context: Energy Forecasting Analysis of Photovoltaic Systems in the Residential Sector. Energies, 16(7), 3042. https://doi.org/10.3390/en16073042