Article

Probing the Pre-Ignition Behavior of Negative Temperature Coefficient Fuels at Low to High Temperatures: A Case Study of Dimethyl Ether

1
State Key Laboratory of Multiphase Flow in Power Engineering, Xi’an Jiaotong University, Xi’an 710049, China
2
Jiangsu Province Key Laboratory of Aerospace Power Systems, Nanjing University of Aeronautics and Astronautics, Nanjing 210016, China
*
Author to whom correspondence should be addressed.
Energies 2023, 16(5), 2118; https://doi.org/10.3390/en16052118
Submission received: 9 January 2023 / Revised: 7 February 2023 / Accepted: 15 February 2023 / Published: 22 February 2023
(This article belongs to the Special Issue Trends and Prospects in Engine Combustion)

Abstract

:
Pre-ignition, involving complex interactions of physical and chemical processes, occurs not only in actual combustion engines but also in fundamental research equipment such as rapid compression machines and shock tubes. Thus, identifying the combustion conditions prone to pre-ignition is critical for the interpretation of ignition data and fuel design. Shock tube experiments with dimethyl ether (DME) were carried out in this study to investigate the pre-ignition behavior during fuel auto-ignition. The experimental conditions included a wide range of temperatures (620–1370 K), pressures (1–9 atm), and equivalence ratios (0.5–5.0). The results indicate that pre-ignition of DME is prone to occur in the transition region from a high temperature to an intermediate temperature (~1000 K), and the decrease in pressure and equivalency ratio will aggravate the pre-ignition behavior. Theoretical analysis was then performed using four physical-based criteria: temperature perturbation sensitivity of ignition delay times, thermal diffusivity, a dimensionless parameter analogous to the Damköhler number, and the Sankaran number. According to experimental observations and theoretical analysis, it was found that the temperature sensitivity (Stp = 75 μs/K) and Sankaran number (Sap = 1) are the best available criteria for predicting the pre-ignition behavior of negative temperature coefficient (NTC) fuels. The pre-ignition region of non-NTC fuels can be accurately predicted by thermal diffusivity and the Damköhler number, but they deviate greatly when predicting the pre-ignition of NTC fuels. This strategy is expected to provide a feasible method for identifying the critical conditions under which pre-ignition may occur and for revealing the pre-ignition mechanisms for other NTC fuels.

1. Introduction

Pre-ignition is an unwanted ignition event that occurs before it is expected and can lead to non-homogeneous combustion. Pre-ignition has been observed in systems such as aero engines and internal combustion engines [1], particularly in highly blown spark-ignition engines operating under high-load and low-speed conditions [2]. Pre-ignition is known as an initiator for engine super-knock, which causes extremely high peak pressure with associated pressure oscillations to occur instantly, destroying the piston head and combustion chamber [3,4]. Therefore, understanding the kinetics and dynamic mechanism of pre-ignition and predicting this phenomenon is critical for engine design and optimization.
Pre-ignition is well known as a complex physical-chemical process, and decoupling the interactions between physical flow and chemical reactions in actual combustors is difficult. Since it was first observed in aviation engines in the 1920s, numerous efforts have been made to decipher pre-ignition [5]. Shock tubes are widely used for chemical kinetic measurements and are widely accepted as equipment that creates a nearly stagnant and zero-dimensional test environment [6,7,8]. Experiments conducted in shock tubes can eliminate the interference of composite factors found in engine combustors and serve as a better guide in revealing the pre-ignition mechanism. Previous studies [9,10] have shown that pre-ignition occurs on hot surfaces or around hot particles. Pre-ignition was attributed to lubricating oil droplets and spark plugs in engine combustors by Akram et al. [11], Menrad et al. [10], Zöbinger et al. [12], and Hamilton et al. [13]. Ninnemann et al. [14] believed that impurities, e.g., residual broken films in the shock tube from the previous experiment, were the cause of pre-ignition in shock tube experiments. Fei et al. [15] demonstrated in a rapid compression machine that oil droplets can cause pre-ignition. Pryor et al. [16] discovered that the bifurcation caused by the interaction of a reflected shock wave with a boundary layer can result in an inhomogeneous pressure and temperature distribution and the formation of hotspots. Regardless of the origin of the hot spots, numerous simulations using a temperature gradient have been carried out to investigate the effects of mixture composition, hot spot size, and boundary conditions [3,17,18]. The pre-ignition was discovered to be strongly dependent on the mixture composition (fuel type and equivalence ratio) and thermal boundary conditions (pressure and temperature behind the reflected shock wave). The process of pre-ignition can be captured with high-speed imaging techniques. Shock tube experiments have revealed the pre-ignition behavior for a variety of fuels, including H2 [14], CH4 [16], ethanol [19,20,21], dimethyl ether (DME) [22], and n-heptane [23]. All the results indicate that lower pressures, lower equivalence ratios, higher fuel concentrations, and Ar gas diluents make pre-ignition easier. Pre-ignition, on the other hand, occurs at low temperatures for non-negative temperature coefficient (NTC) fuels and at medium temperatures for NTC fuels.
According to past studies [3,20], the occurrence of pre-ignition usually requires (a) an ignition source that can induce a premature flame, (b) a flame that can propagate steadily, and (c) these processes to occur sufficiently early before the main ignition. Based on the experimental and numerical studies mentioned above, dimensionless parameters analogous to the Damköhler number (Da*), thermal diffusivity, and laminar flame thickness were proposed as criteria for recognizing the likelihood of pre-ignition [3,19,20,24,25,26]. According to these theoretical criteria, the pre-ignition tendency of various mixtures such as H2 [14], CH4 [16], methanol, and ethanol [19,20] can be accurately predicted. However, there has been only limited research into the relationship between the experimental phenomenon and theoretical criteria for the pre-ignition of NTC fuels. It is unclear whether the current theoretical criteria can accurately predict NTC fuel pre-ignition. DME is an appealing renewable and basic fuel owing to its low-temperature chemistry and NTC phenomenon [22,27]. In our previous study [22], it was found that DME mixtures are prone to pre-ignition at around 1000 K. However, this was not the focus of our previous work and the pre-ignition mechanism of DME was not profoundly analyzed. Therefore, DME was chosen as the study target. This study aims to comprehensively investigate the effect of temperature, pressure, and equivalence ratio on the pre-ignition behavior of DME through shock tube experiments. Moreover, it is hoped that through theoretical analysis and verification with experimental results, a universal criterion that can assess the likelihood of pre-ignition of NTC fuels can be proposed.

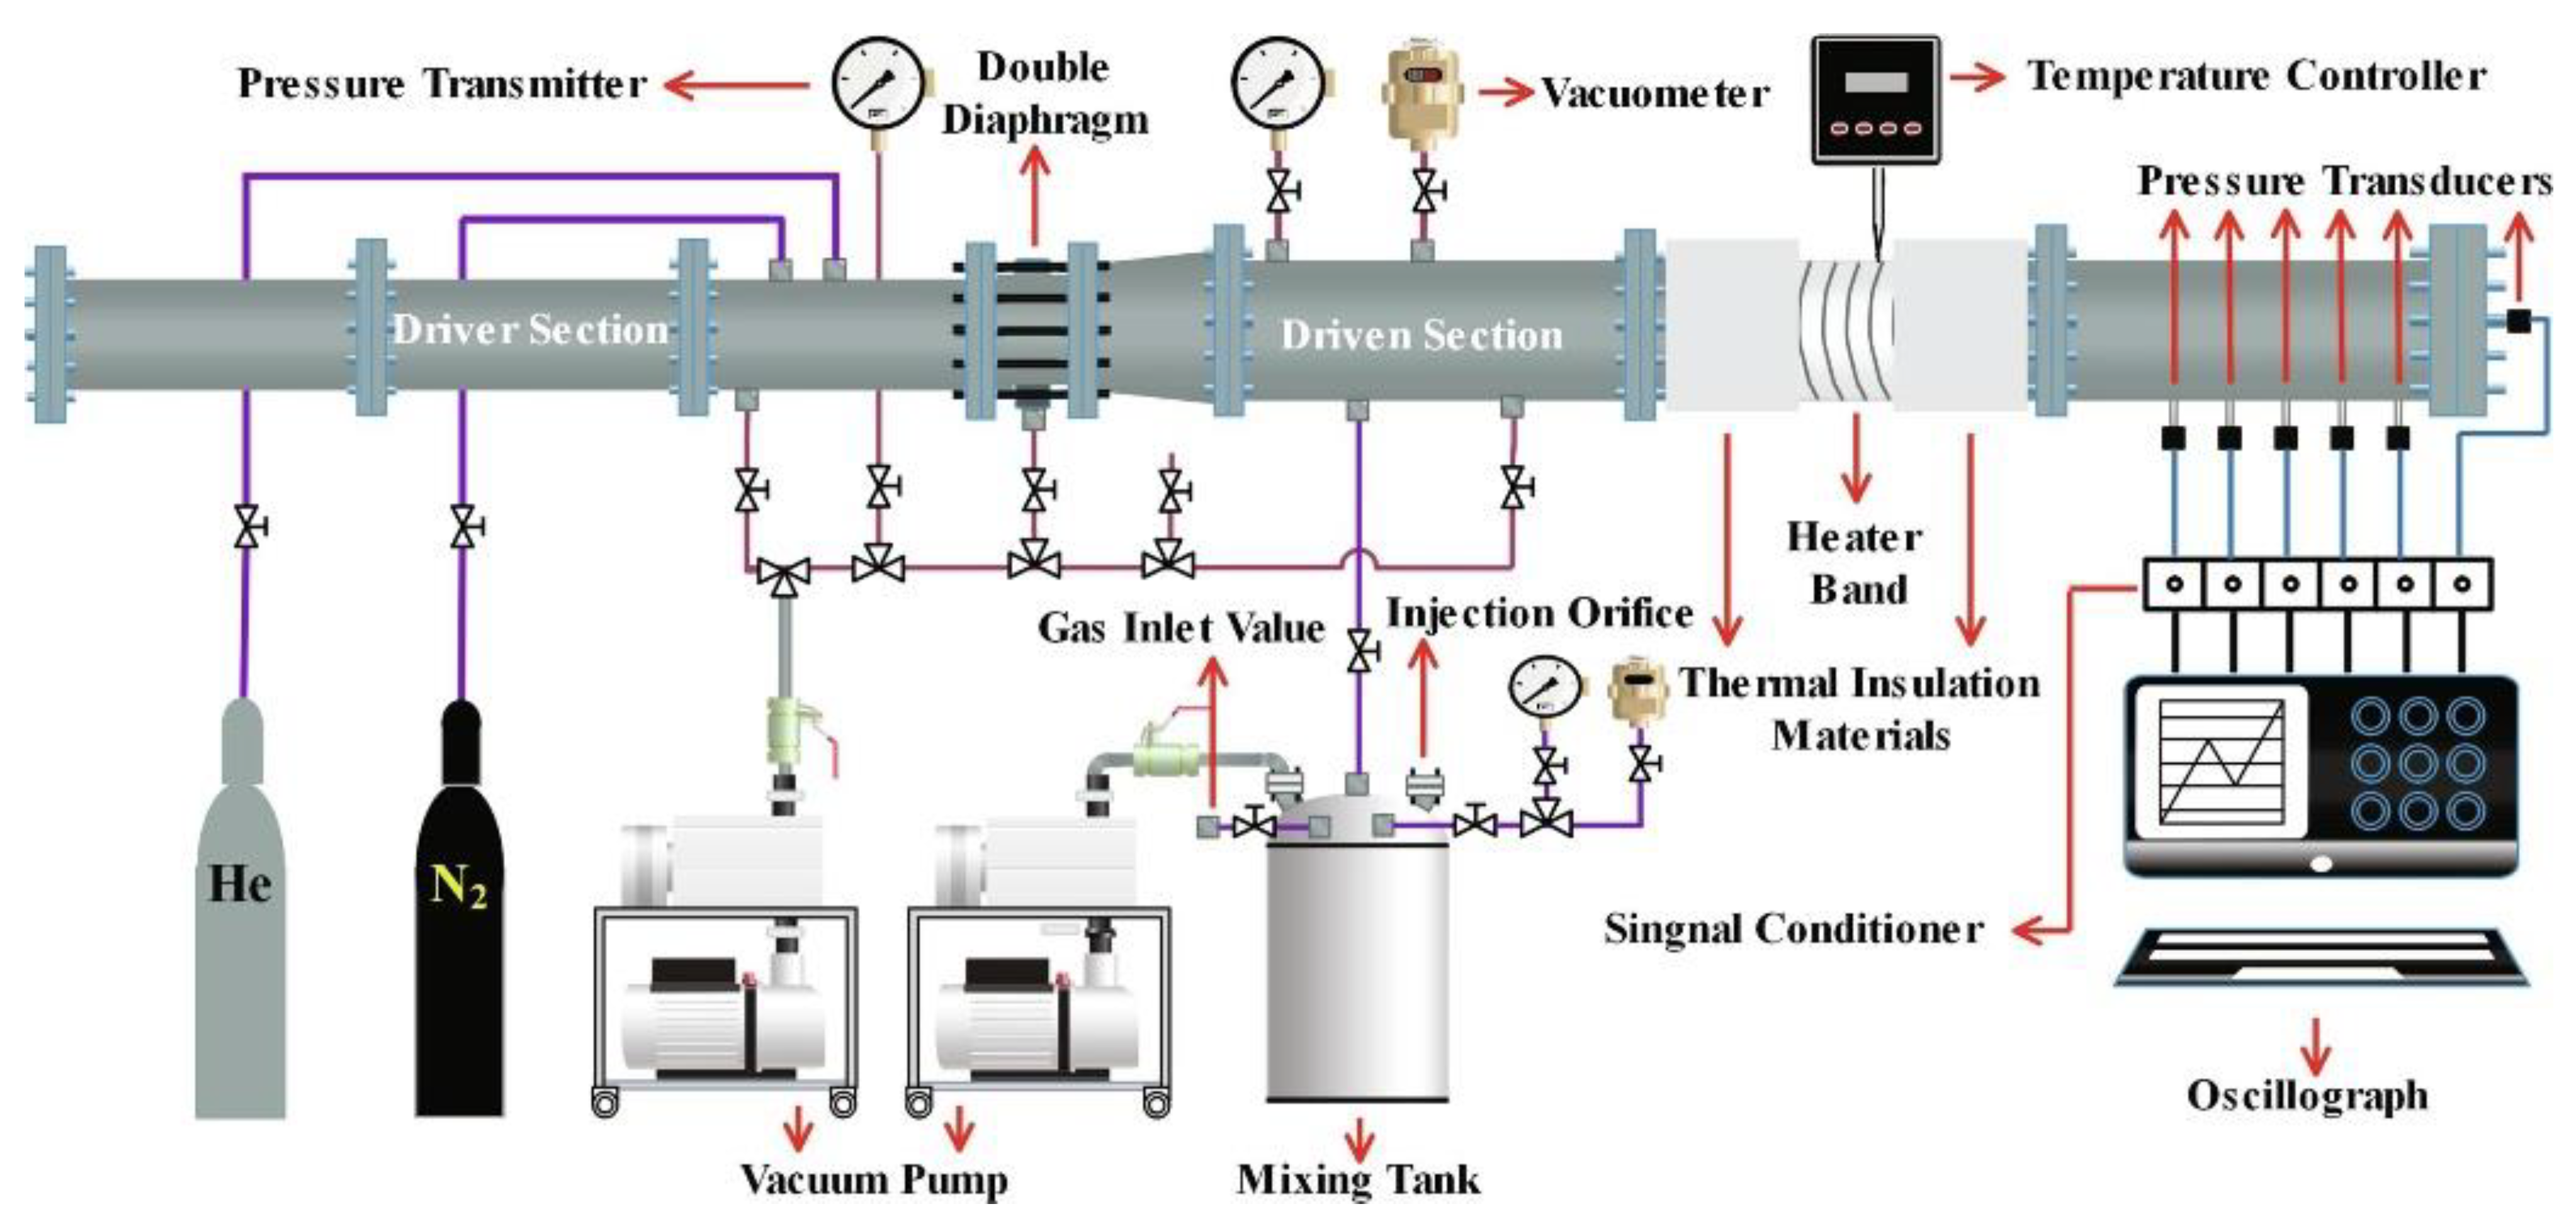
2. Experimental and Numerical Methods

To better understand the kinetics and dynamics mechanism of pre-ignition, ignition delay times (IDTs) of DME/‘air’ mixtures were measured behind reflected shock waves at Xi’an Jiaotong University using a variable cross-section high-pressure shock tube (HPST), as shown in Figure 1. Details of the HPST can be found elsewhere [22,28], and only a summary is provided here. The stainless-steel shock tube had a 6.4-m-long driver section and a 7.6-m-long driven section (150 mm inner diameter). Because of the larger inner diameter of the driven section, the influence of the non-ideal boundary layer on the experimental measurement was effectively reduced. The primary signals detected in the experiments were sidewall pressure from four piezoelectric pressure transducers (PCB 113B22), end-wall pressure from a charge output dynamic pressure transducer (PCB 113B03), and OH* light emission from a photomultiplier tube (Hamamatsu CR131) with a narrow bandpass filter (centered at 306 nm with FWHM < 10 nm) located at the end wall. The reflected shock pressure (p5) and temperature (T5) were calculated using one-dimensional shock jump equations. The largest uncertainty in T5 was estimated to be 22 K using the standard root–sum–squares (RSS) method [29]. The measured IDT was defined as the time between the passage of the reflected shock wave and the time of the rapid rise in end wall pressure; thus, the time interval could be precisely determined. The driver gases were high-purity nitrogen (99.999%) and helium (99.999%), and the test mixtures contained high-purity argon (99.9999%), oxygen (99.9999%), and DME (99.9%). To reduce the non-ideal gas dynamic effects, the artificial air (21% O2 and 79% Ar) was made up of the monoatomic molecule argon rather than nitrogen. Shock tube experiments on DME mixtures were carried out at various pressures (1, 3, and 9 atm) and at temperatures ranging from 620 K to 1370 K, as shown in Table 1. DME, O2, and Ar were filled into the mixing tank in turn. Dalton’s law of partial pressure was used to control the components of the gas mixtures. The mixture was placed overnight to ensure sufficient diffusion and mixing. All the experiments were tailored when the IDTs were longer than 2 ms. The Chemkin-Pro package [30] was used to simulate the IDTs and laminar flame speeds with a closed homogeneous batch reactor and a premixed laminar flame speed calculation reactor, respectively.

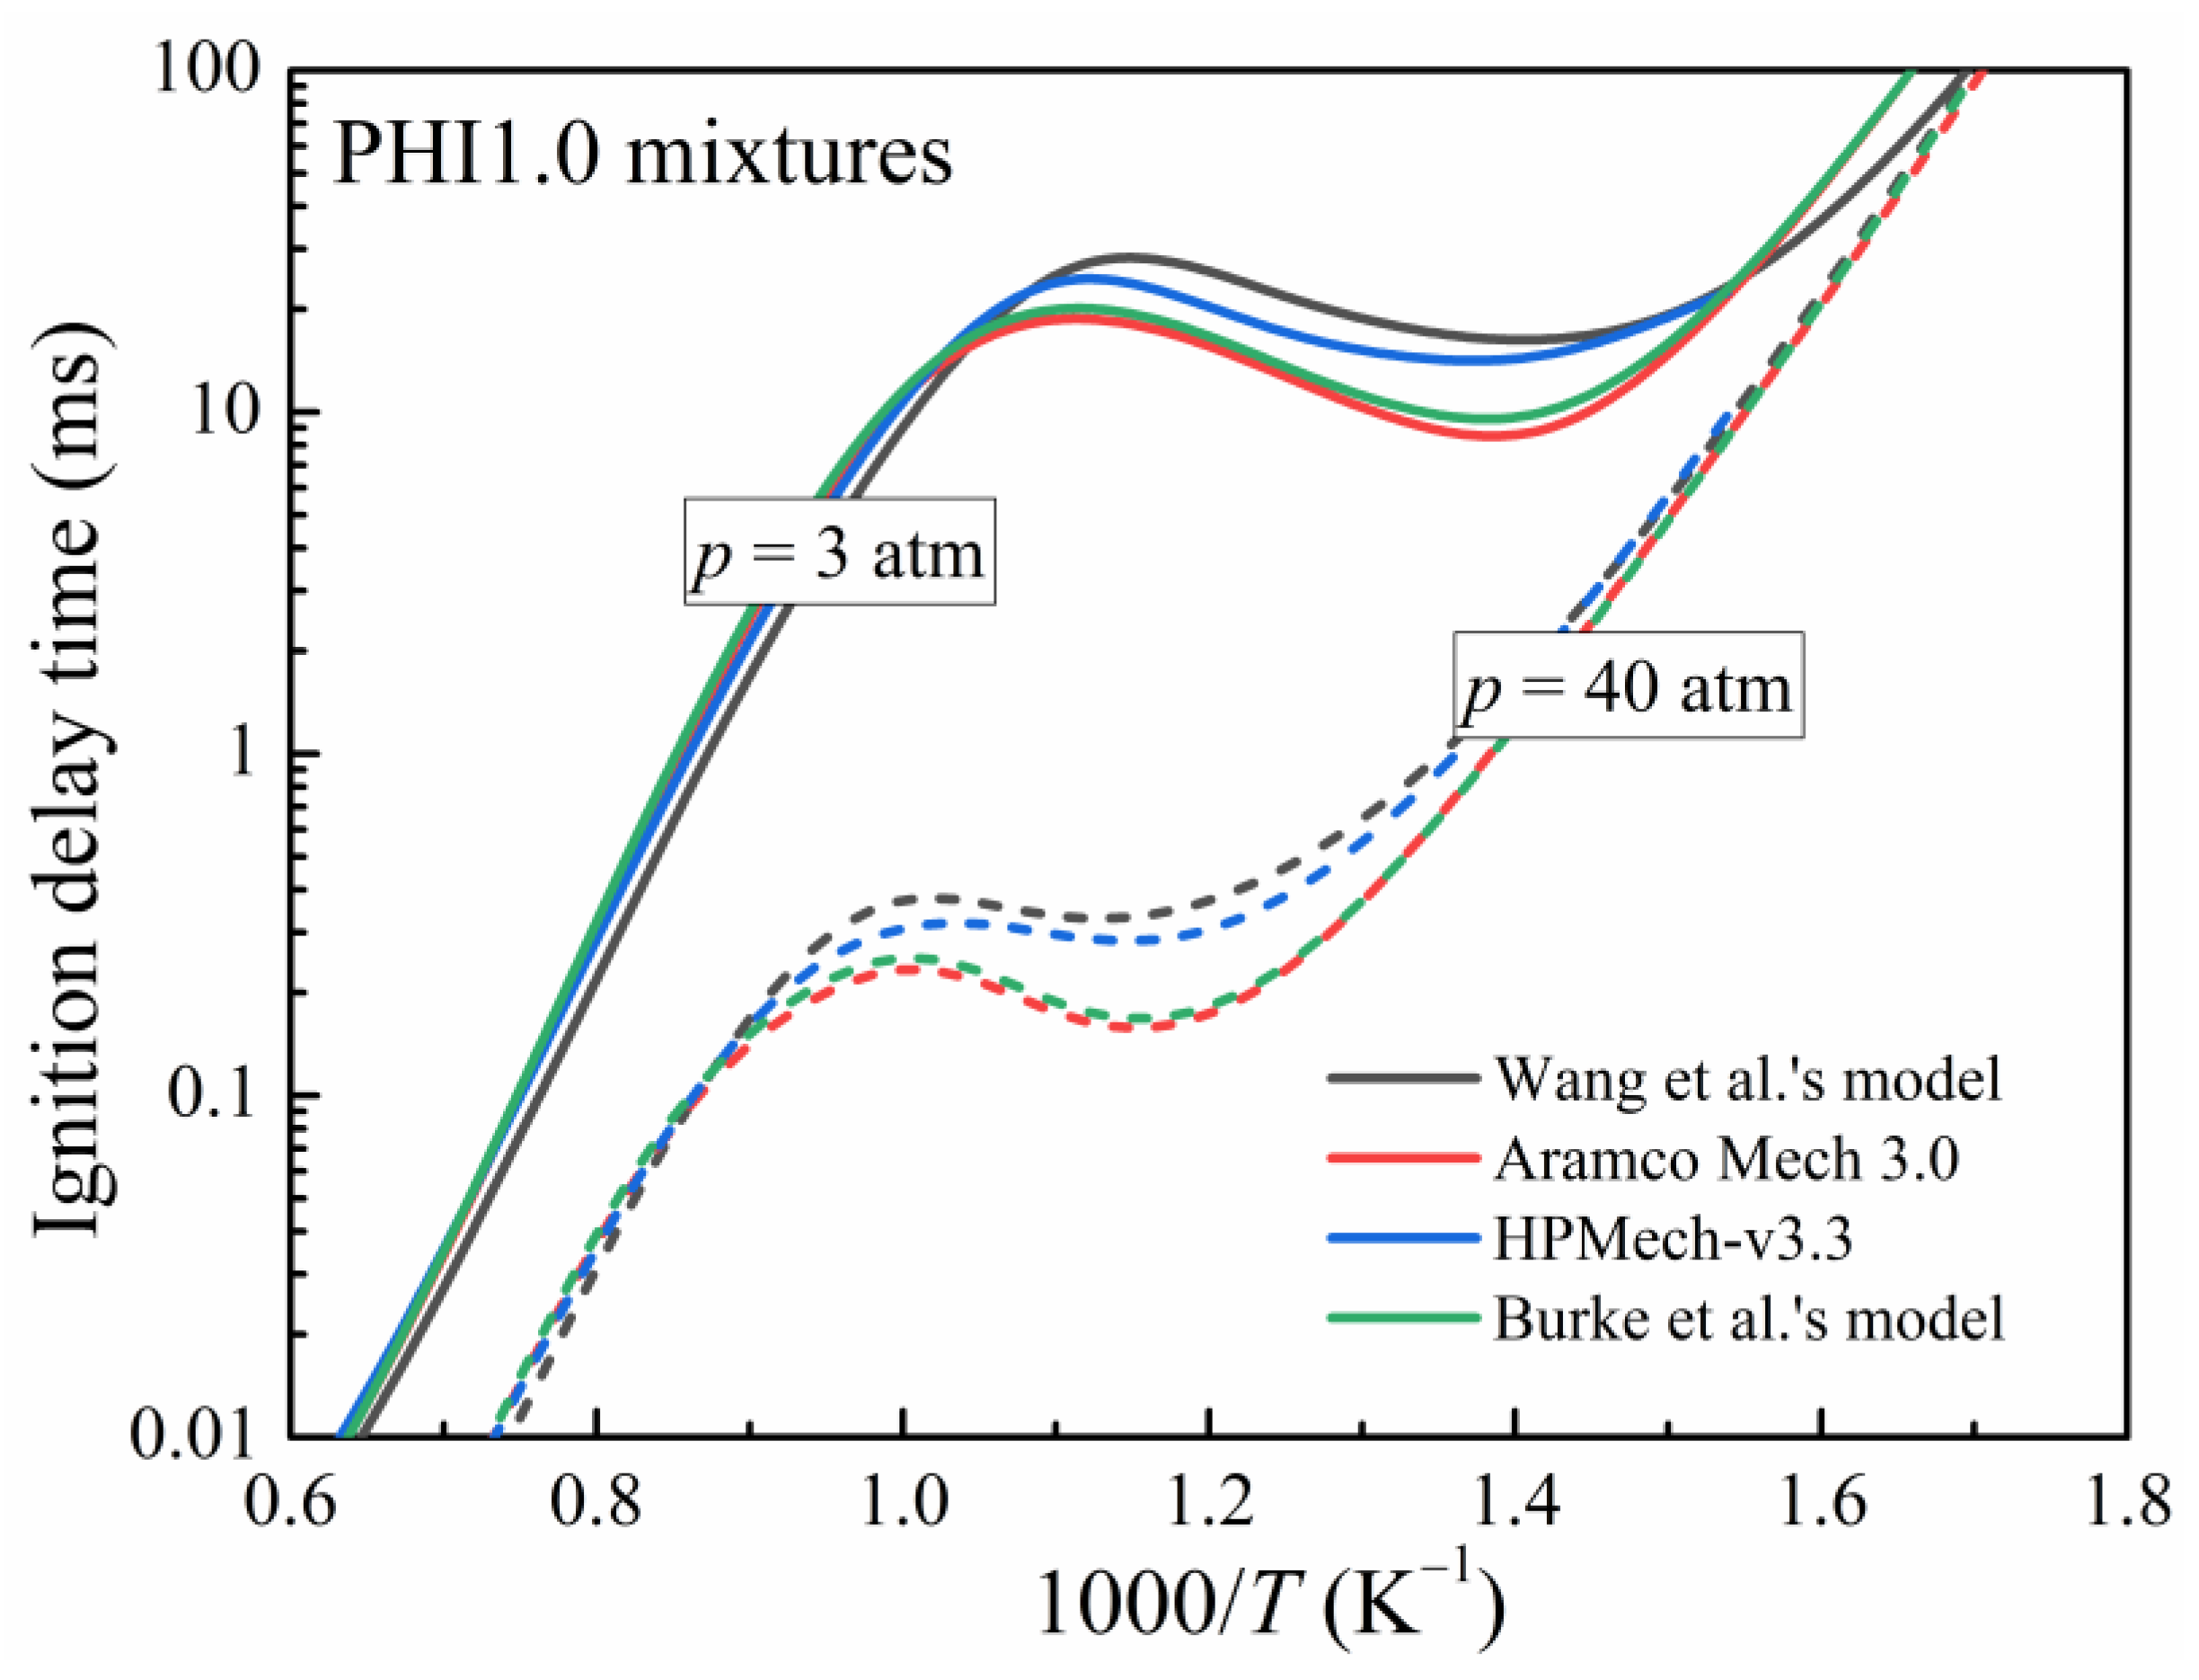
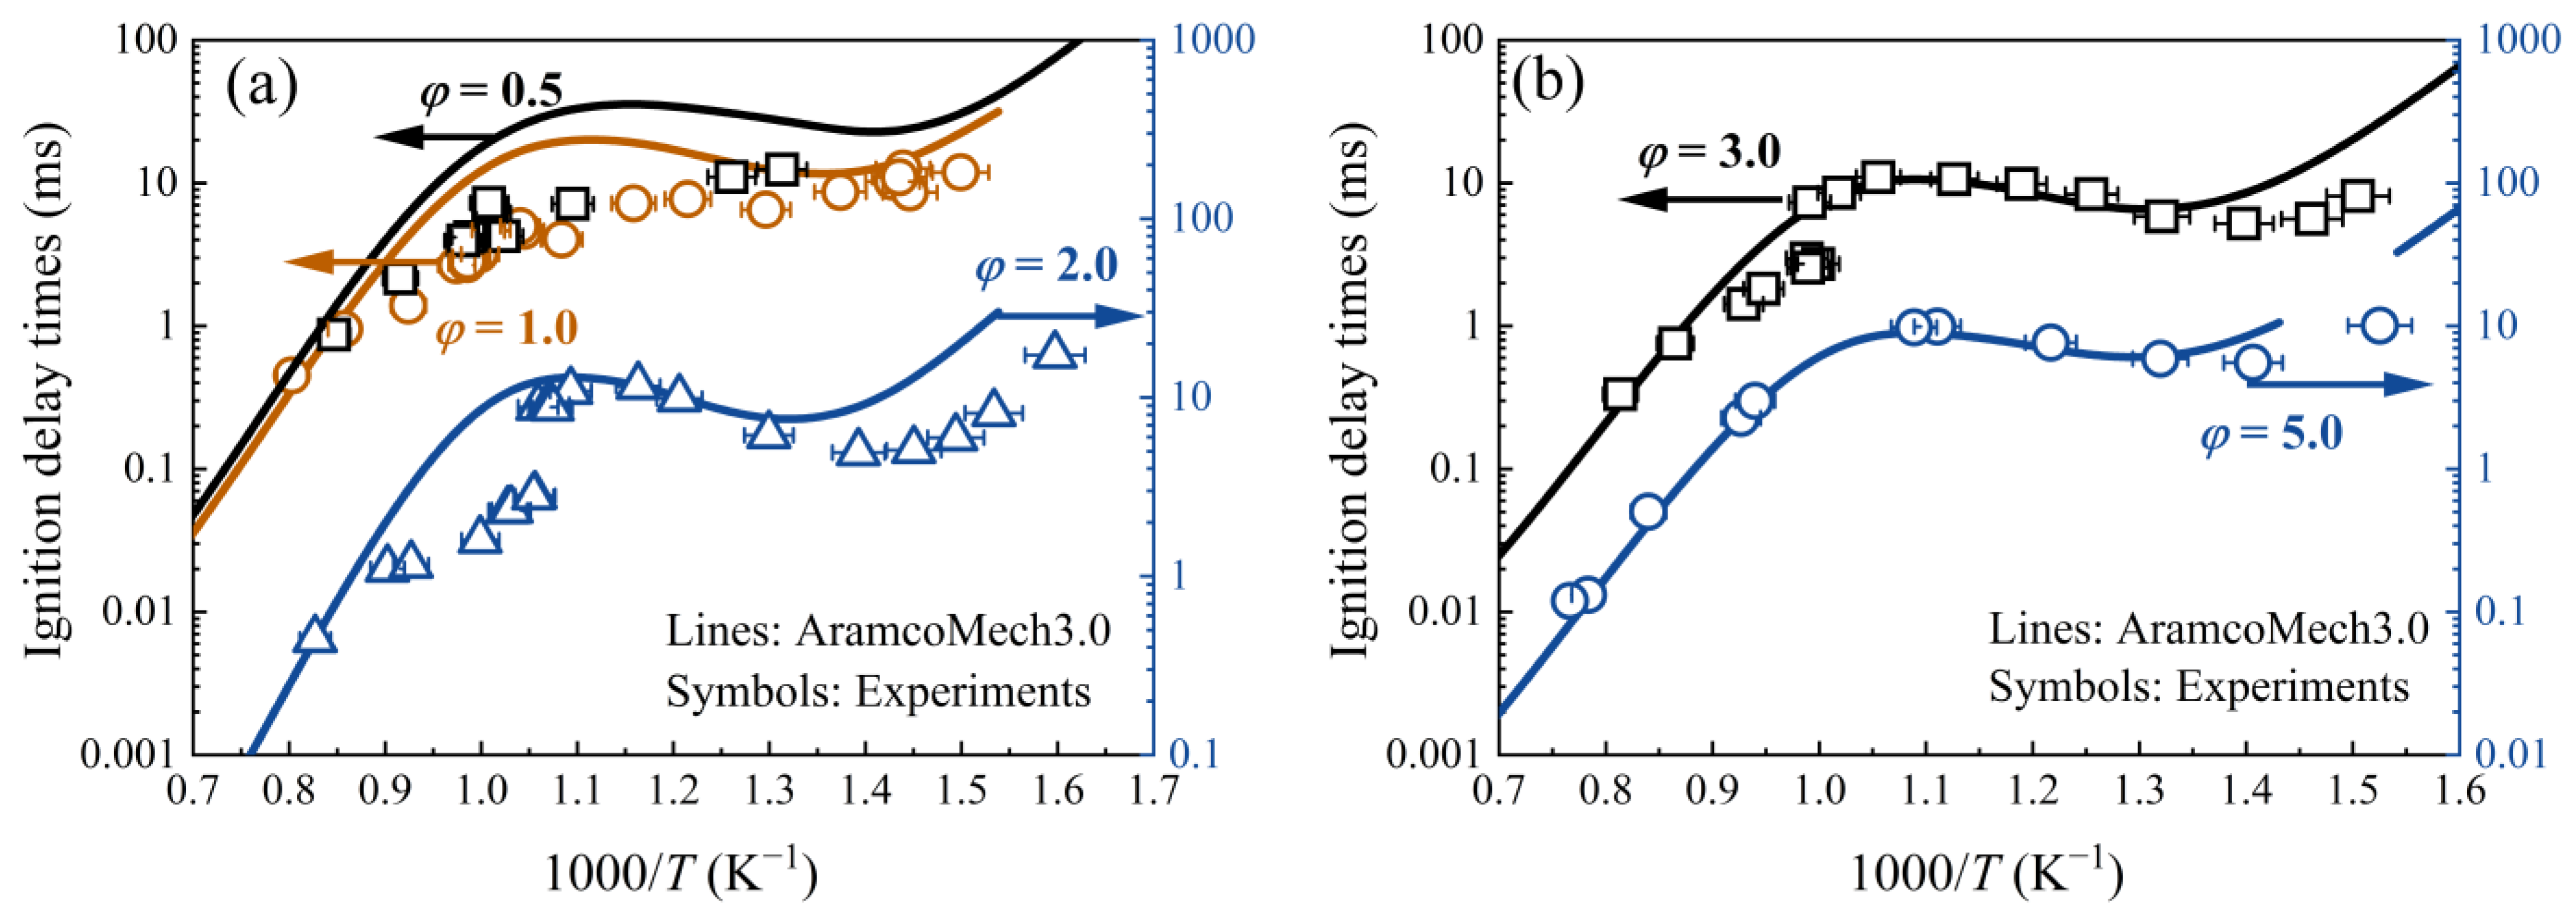
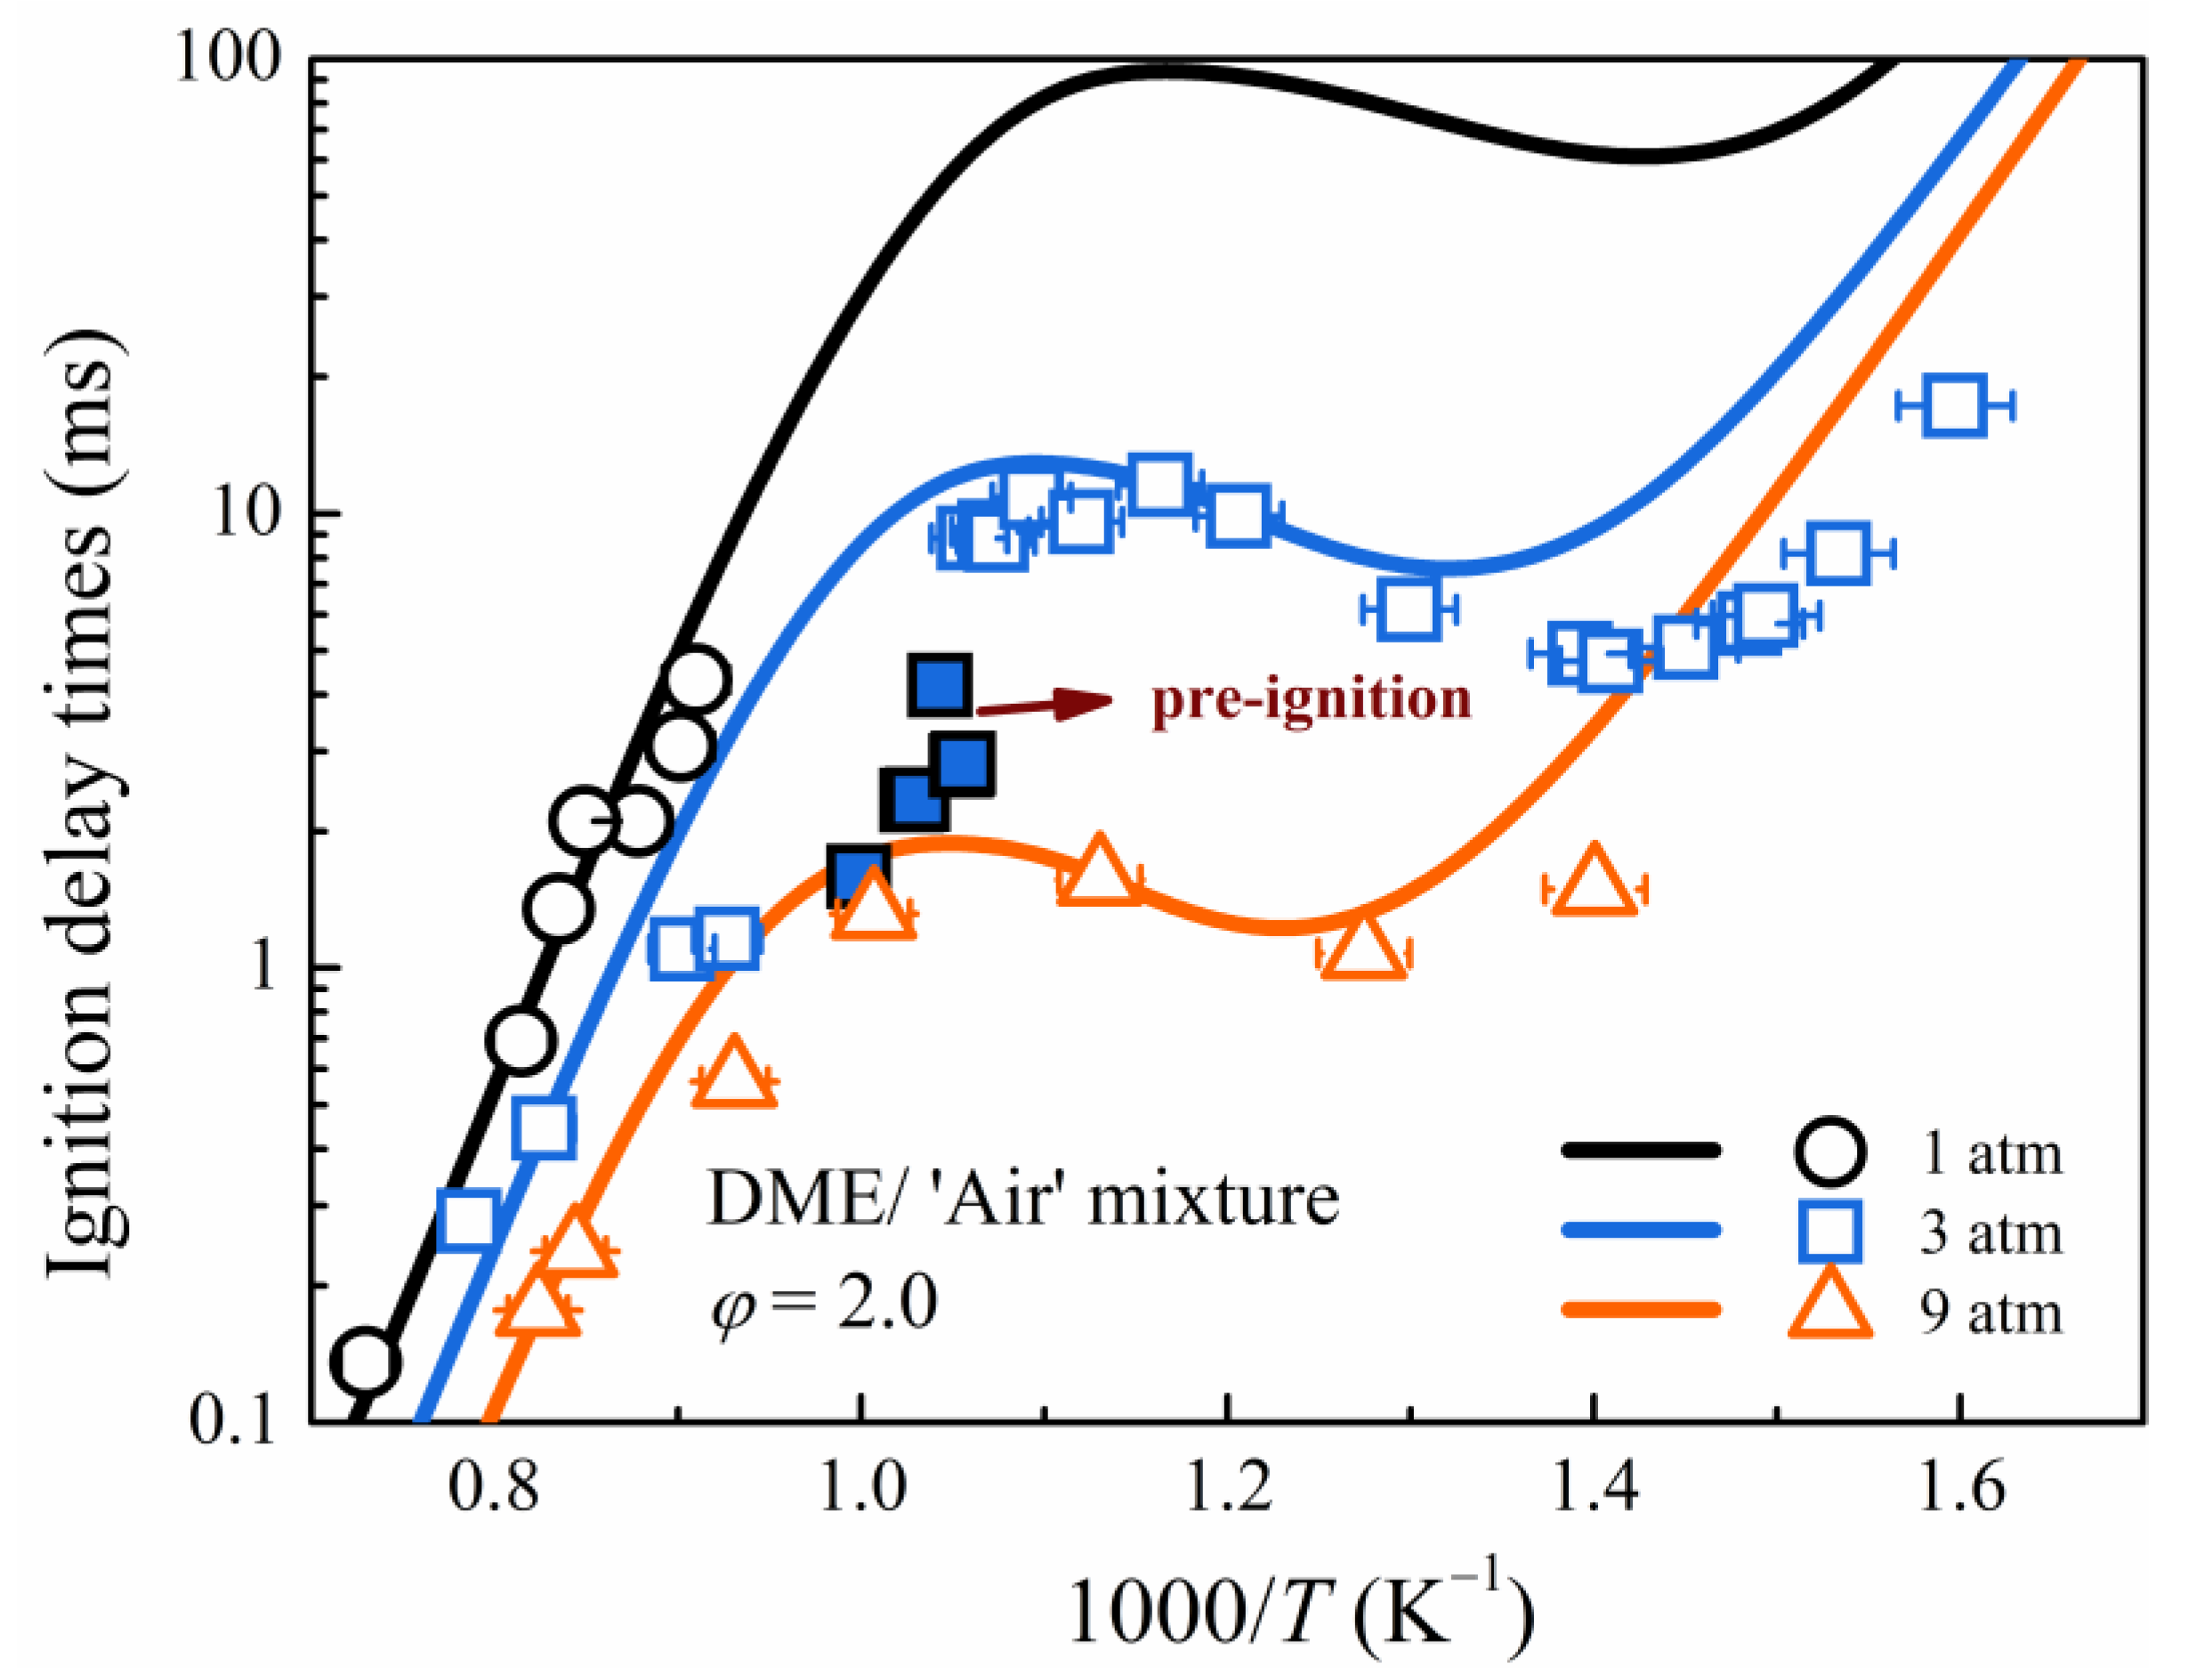
3. Results and Discussion

The models of Wang et al. [31], AramcoMech 3.0 [32], HPMech-v3.3 [33], and Burke et al. [27] were used to predict the IDTs of DME/O2/Ar mixtures under the assumption of constant U and V, as shown in Figure 2. Except for some differences in the NTC region, the performance of all the models in describing DME auto-ignition was essentially identical. AramcoMech 3.0 [32] has been widely validated against a variety of experimental data, including IDTs, laminar flame speeds, and speciation profiles, under a variety of conditions [22,27]. Therefore, it is used in this study’s discussion.
A strong pre-ignition tendency of DME mixtures was observed in previous studies around temperatures of 1000 K [22]. IDTs of DME/‘air’ mixtures ranging from 0.13 ms to 14 ms at various equivalence ratios (0.5–5.0) were also measured at pressures of 1, 3, and 9 atm over temperatures of 628–1370 K to gain a better understanding of the pre-ignition mechanism in this study, as shown in Figure 3 and Figure 4. Under the assumption of constant U and V, AramcoMech 3.0 [32] was used to predict the IDTs. Because of the negligible dp5/pdt value (<1%/ms), the non-ideal facility effect was excluded from all simulations. All the data sets showed the expected Arrhenius-like behavior in both the low (<670 K) and high (>1150 K) temperature ranges, while the conventional NTC behavior was seen in the temperature range 770–900 K. The AramcoMech 3.0 reproduced the measured IDTs well for all the mixtures at temperatures above 1100 K but underestimated them for partial mixtures (PHI0.5, PHI1.0, PHI2.0, PHI3.0) in the temperature transition zone (950–1100 K) and low-temperature region (<770 K). AramcoMech 3.0, for the mixture with an equivalence ratio of 2.0, underestimated IDTs by a factor of 5.7 and 3.0 at 1000 K and 700 K, respectively.
Unlike extremely rich mixtures (PHI5.0) or high-pressure mixtures (PHI2.0, p = 9 atm), the mixtures (PHI0.5, PHI1.0, PHI2.0, PHI3.0) exhibit a repeatable fall-off feature of ignition delay time in the temperature transition zone (~1000 K) at low pressure (p < 9 atm). The IDT fall-off behavior is dependent on the equivalence ratio and pressure, and it is not observed in the PHI5.0 mixture at a pressure of 3 atm or in the PHI2.0 mixture at a pressure of 9 atm. Because of the limited test time of the HPST, the fall-off behavior of IDTs is not observed at 1 atm, but a comparison of experimental data at 3 atm and 9 atm can demonstrate such a pressure-dependence behavior. The IDTs’ fall-off behavior cannot be reproduced using the available kinetic mechanisms with a conventional homogeneous ignition simulation approach, which is consistent with the observation made by Javed et al. [23] in the ignition of n-heptane. The unusual IDT fall-off behavior was thought to be the result of pre-ignition. At T5 < 770 K, it is different. Princeton University [34,35,36] and Sandia National Laboratories [37] investigated the low-temperature oxidation chemistry of DME using jet-stirred reactor and flow reactor experiments and discovered that existing kinetic models tend to over-predict or under-predict DME oxidation. Our recent study [22] also demonstrated that existing kinetic models tend to overpredict the IDTs of DME mixtures at low pressure and low temperature. Therefore, in the low-temperature region (<770 K), the distinct discrepancy between the experimental measurements and simulations is considered to be due to the effect of the low-temperature chemistry of DME rather than the effect of pre-ignition.
The high-speed image sequences recorded behind the reflected shock waves by Figueroa–Labastida et al. [19,20] and Ninnemann et al. [14] demonstrated that if pre-ignition occurs, a localized non-homogeneous ignition can be triggered before the main ignition, which is consistent with the experimental observation in Figure 5. Pre-ignition behavior can be identified experimentally in the temperature transition zone (~1000 K) by comparing the time histories of pressure and OH* chemiluminescence, as shown in Figure 5. The OH* light emission occurs approximately 700 μs before the pressure rises at 970 K with pre-ignition, whereas it increases almost simultaneously with pressure at 718 K without pre-ignition. At T5 = 970 K, the fact that the OH* signal shows a significant step while at the same time the pressure trace is not showing any premature pressure increase could be attributed to far-end wall pre-ignitions. Therefore, the photomultiplier detects a flame kernel away from the end wall while the pressure sensor does not see anything.

4. Analysis of Pre-Ignition Criteria

This study evaluated various pre-ignition criteria for DME/‘air’ mixtures. Following a discussion of an ignition characterization based on the temperature perturbation sensitivity coefficient (Stp) of IDTs and thermal diffusivity, a dimensionless parameter analogous to Da* based on the timescale competition of flame propagation and auto-ignition is presented. The Sankaran number criteria have been discussed. AramcoMech 3.0 was used in the following analysis. As previously stated, the DME mechanism has significant uncertainties under both low-temperature and low-pressure conditions. Therefore, a detailed analysis was limited to temperatures above 770 K.

4.1. Temperature Perturbation Sensitivity

IDTs can be significantly advanced through pre-ignition. The temperature perturbation sensitivity coefficient, an ignition characteristic parameter, is discussed in this study to validate the effect of hot spots on IDTs. Meyer et al. used this coefficient as an indicator to predict the pre-ignition of H2/O2 mixtures [38]. Based on their experiments, Stp = 2 μs/K was proposed as the critical value for the pre-ignition of stoichiometric H2/O2 mixtures. The absolute value was considered in this study, taking into account both positive and negative temperature fluctuations, and we have the following definition:
S t p = | τ T |
where τ is the IDT in ms, and T is the temperature in K. Stp denotes the magnitude of the change in IDT caused by the temperature perturbation.
Figure 6 shows the effects of equivalence ratio and pressure on the Stp of DME/‘air’ mixtures at pressures of 3–9 atm and temperatures of 770–1250 K. Stp is small for PHI2.0 DME/‘air’ mixtures at high temperatures (>1250 K) but gradually increases with decreasing temperature. Stp reached the maximum value at ~1000 K, after which it began to decrease until the temperature behind the reflected shock wave fell below 940 K. Stp decreased after a slight increase in the NTC region as the temperature decreased. Notably, the peak of Stp occurs in the temperature transition zone, which corresponds exactly to the pre-ignition region shown in Figure 3 and Figure 4. Based on our experiments and simulations, the critical value of Stp for determining the pre-ignition limit was found to be 75 μs/K, which differs from the value recommended by Meyer et al. [38]. This could be attributed to differences between the experimental devices and the tested mixtures. Furthermore, as the equivalence ratio or pressure increases, the peak value of Stp decreases, which is consistent with the experimental observations in Figure 3 and Figure 4. Therefore, the Stp criterion is appropriate for determining the pre-ignition tendency and region of DME mixtures.

4.2. Thermal Diffusivity

Thermal dissipation is also closely related to the ignition of a local mixture that may induce pre-ignition. Thus, thermal diffusivity has been used to interpret the pre-ignition behavior of H2 [14], iso-octane [23], and ethanol mixtures [39]. The thermal diffusivity α is also used in this study to evaluate the effect of thermal dissipation on the pre-ignition of DME and is defined as
α = λ ρ c
where λ denotes thermal conductivity, ρ denotes density, and c denotes specific heat capacity. α represents the rate of dissipation of the temperature gradient. Figure 7 shows the thermal diffusivity of DME mixtures with different equivalence ratios at various pressures. As the temperature decreases, the thermal diffusivity decreases monotonically. At a given temperature, thermal diffusivity decreases with increasing equivalence ratio and pressure. A low thermal diffusivity α implies a more pronounced non-uniform temperature distribution, which increases the possibility of pre-ignition. However, as observed in the experiments (Figure 3 and Figure 4), low equivalence ratios and lower pressures favor DME mixture pre-ignition, which appears to contradict the trend predicted by thermal diffusivity. In fact, under all conditions considered, the value of α is very small, on the order of 10−4 m2·s−1, indicating that thermal diffusion has a negligible influence on the ignition of the mixtures. Therefore, predicting pre-ignition based on thermal diffusivity alone is insufficient; additional parameters must be considered.

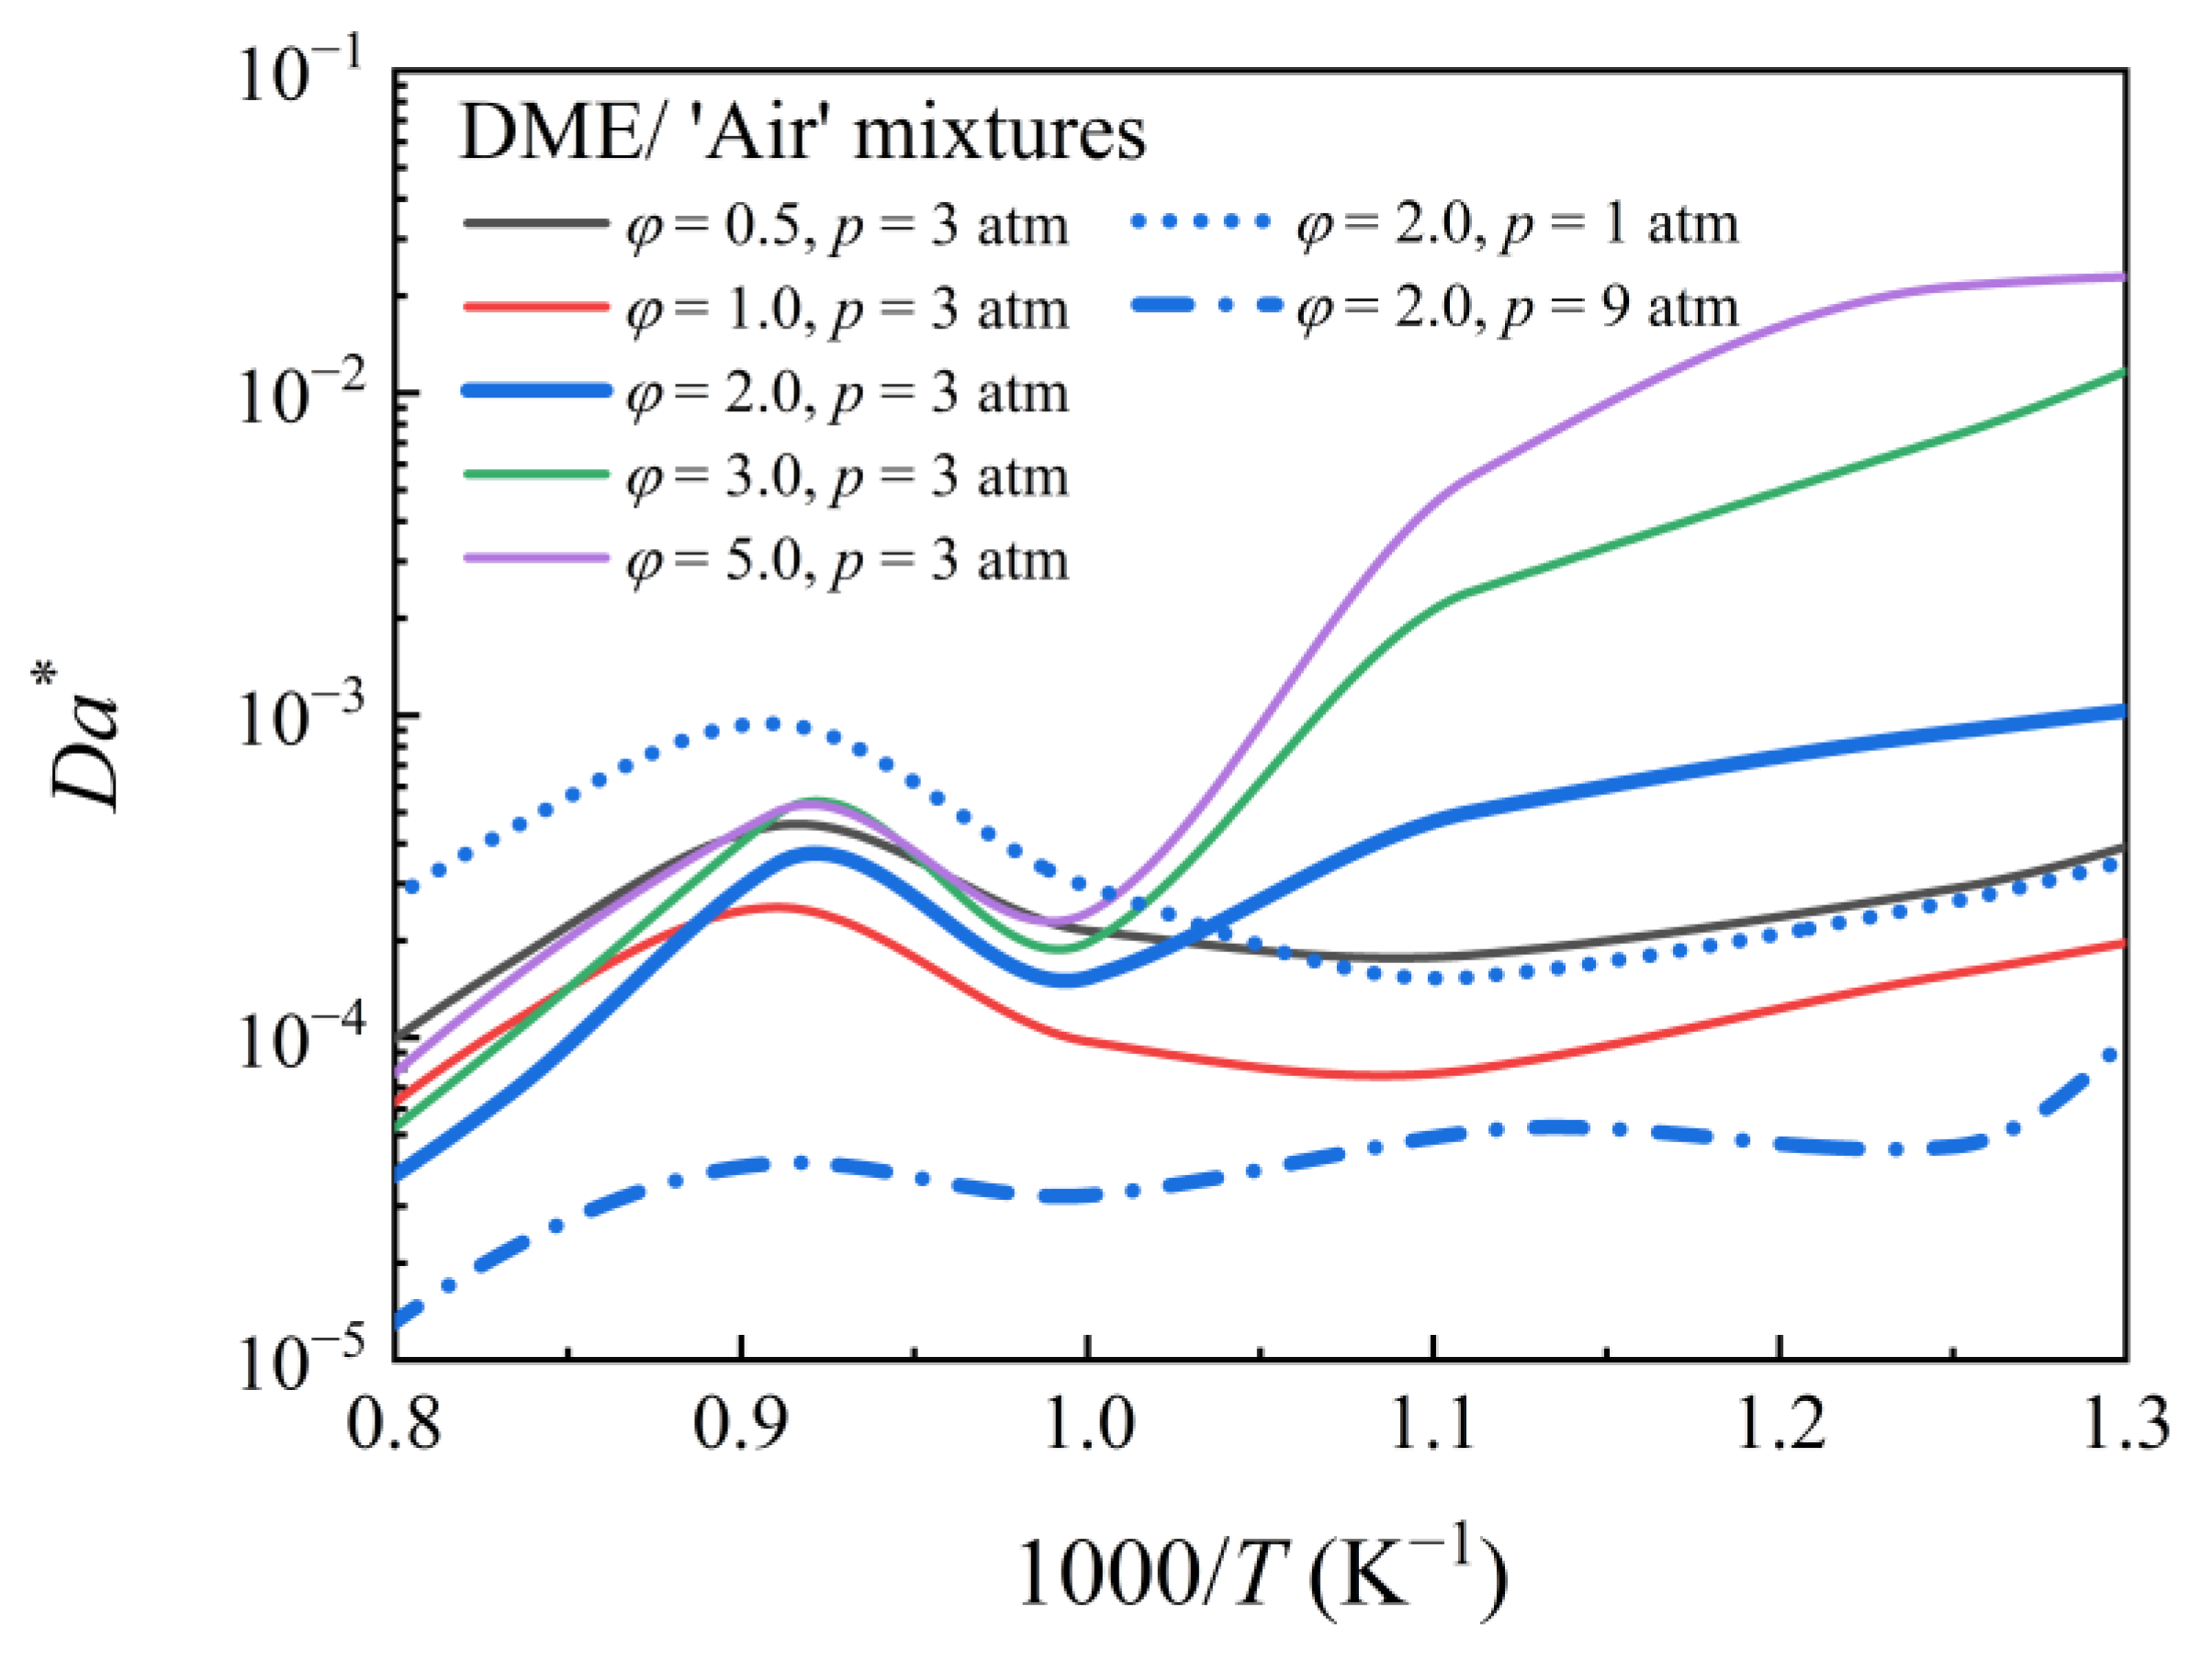
4.3. Damköhler Number

The competition between the auto-ignition timescale and flame propagation speed also influences pre-ignition. Even if the local mixture is ignited by hotspots, pre-ignition cannot be observed if the flame propagation timescale is sufficiently slow relative to the auto-ignition delay of mixtures. Therefore, the relationship between IDT and the characteristic time of flame propagation must be estimated. Consider a dimensionless parameter analogous to Da [19,20,40]:
D a * = τ c h a r τ i g n
τign denotes the IDTs, and τchar denotes the characteristic flame propagation time, which is defined as
τ c h a r = δ S L
where δ is the flame thickness and SL is the laminar flame speed. The flame thickness is the thermal diffusion thickness in this study, which is defined as
δ = α S L
Figure 8 depicts the flame thickness of DME/‘air’ mixtures at various equivalence ratios (φ = 0.5, 1.0, 2.0, 3.0, and 5.0) at different pressures (1, 3, and 9 atm). To simulate the τign and SL, AramcoMech 3.0 was used. A small Da* indicates that the IDT is sufficiently long relative to the flame propagation characteristic time. As a result of the greater impact of the local flame on the main ignition, mixtures with longer IDT and shorter flame propagation characteristic times are expected to be more prone to pre-ignition. Da* varies monotonically with temperature for non-NTC fuels. However, this is not true for NTC fuels. The temperature dependence of Da* for DME mixtures with different equivalence ratios at different pressures is shown in Figure 9. Da* has a turning point at ~1000 K for PHI2.0, PHI3.0, and PHI5.0 mixtures at 3 atm. The value of Da* was smaller at higher pressures (9 atm), indicating a strong pre-ignition trend, which contradicts the experimental observation. Therefore, predicting pre-ignition using Da* alone is insufficient.

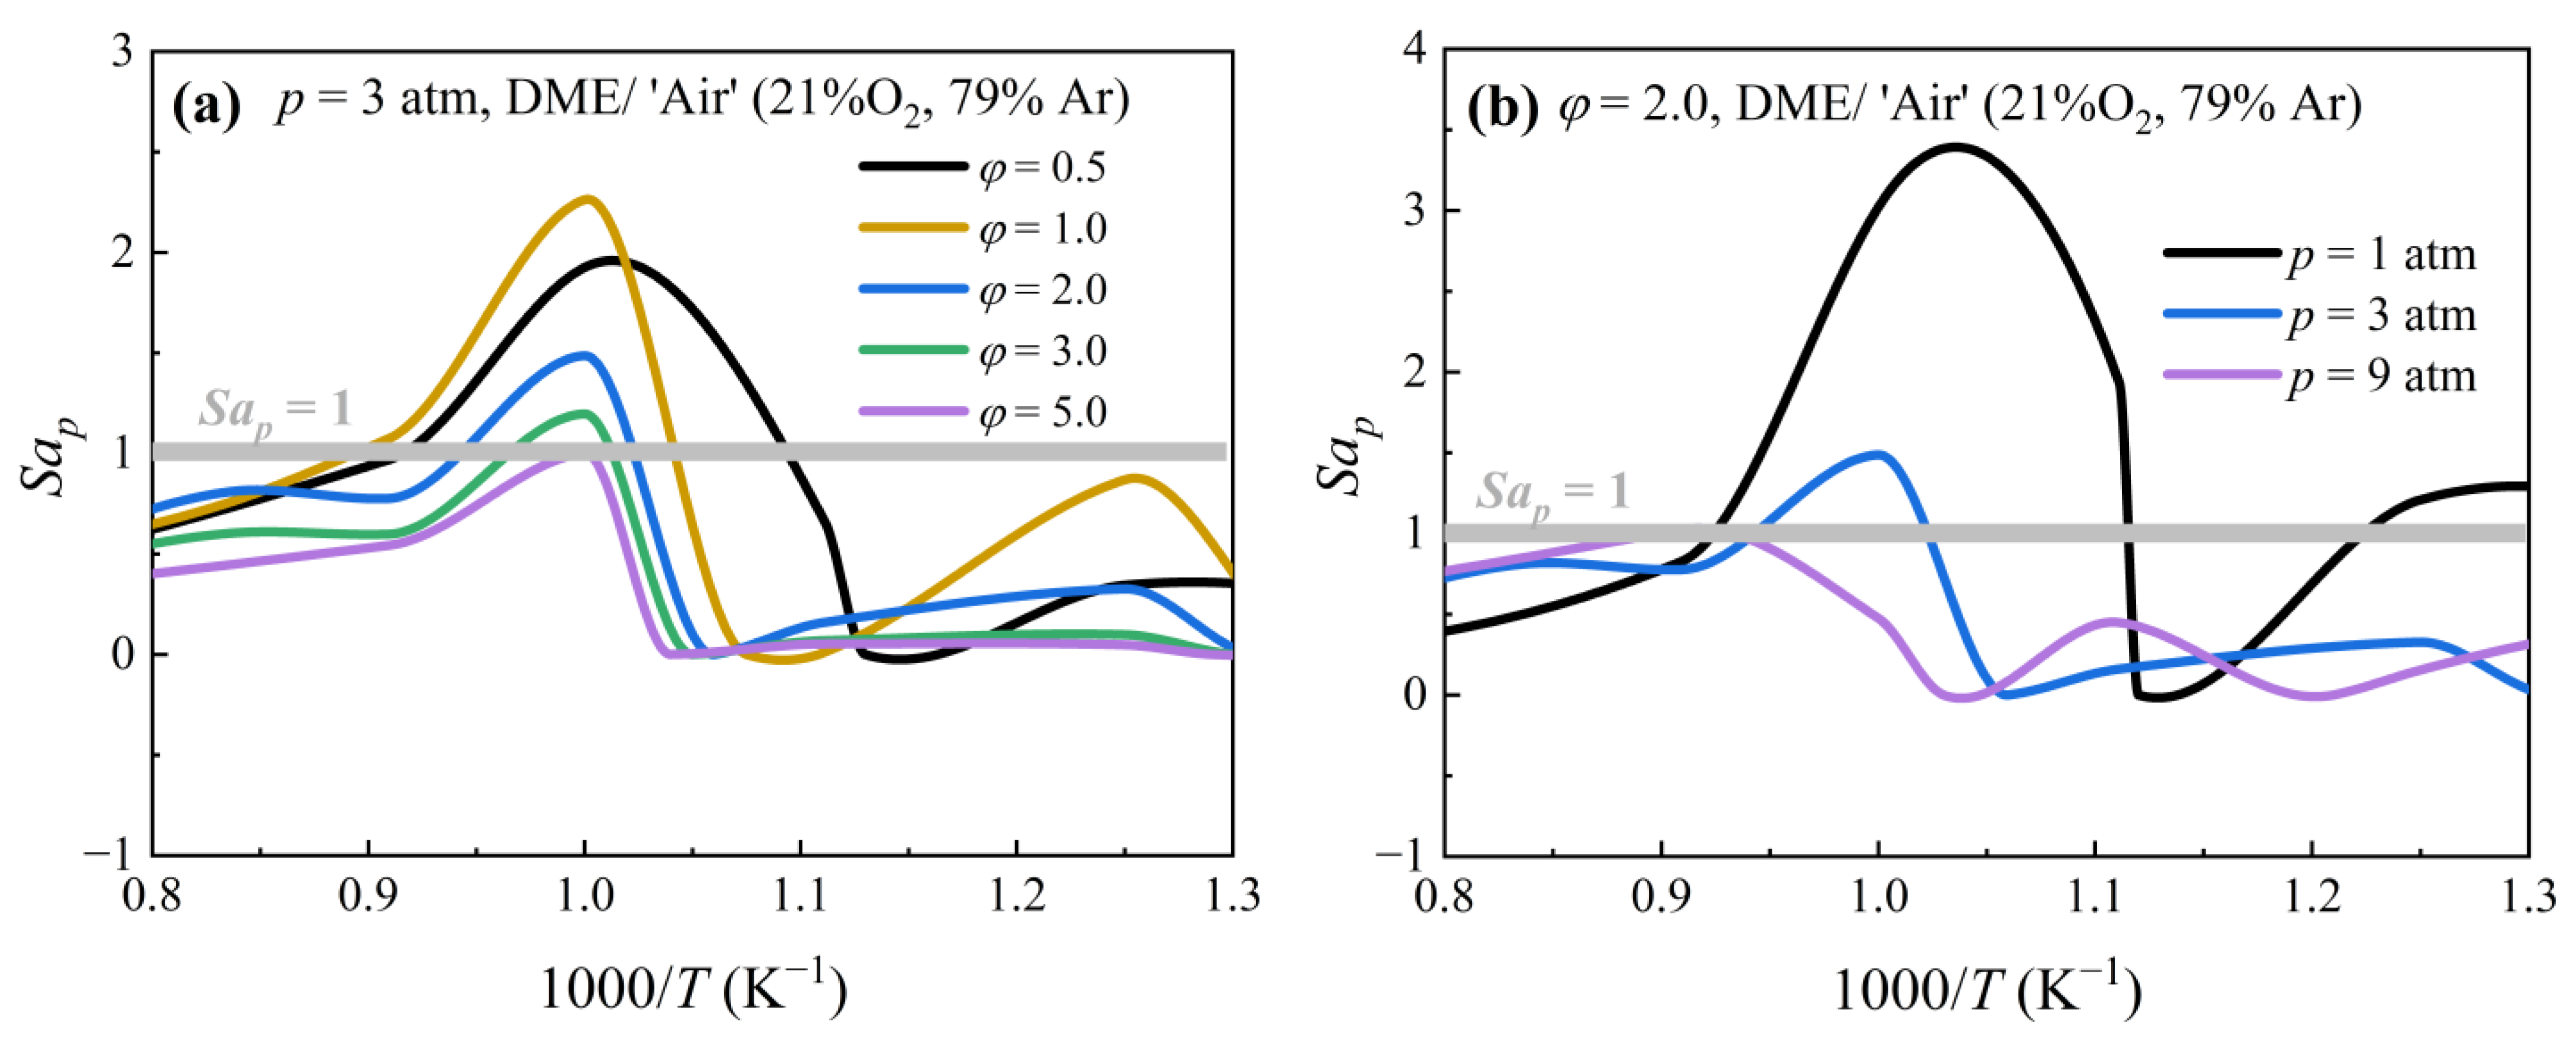
4.4. Sankaran Number Criterion

Sankaran et al. [41] proposed another dimensionless number to represent the competition between the auto-ignition timescale and flame propagation speed and to distinguish weak ignition from strong ignition. The ratio of the laminar flame velocity to the spontaneous front velocity is defined as the parameter. This criterion was successfully used by Strozzi et al. [42] and Figueroa–Labastida et al. [20] to interpret the observed preignition of methane, methanol, and ethanol. The predictive criterion for DME/‘air’ mixtures is defined as follows:
S a p = β S L | τ T | T l T R e T 0.5
where β is a constant, T’ is the root mean square of the core gas temperature fluctuation, and lT is the characteristic length scale of the core gas temperature fluctuation field, which is comparable to the size of the hotspot. ReT is defined as
R e T = T l T α
This study determined β as 0.5, T’ as 1.5 K, and lT as 2 mm, based on the recommendations of Sankaran et al. [41], Figueroa–Labastida et al. [20], and Javed et al. [23]. Sankaran number criterion (Sap) = 1 was used as the threshold to distinguish between strong (Sap < 1) and weak (Sap > 1) ignition modes. Sap < 1 occurs in the case of a highly reactive mixture with a small temperature gradient, and each local point auto-ignites like a homogeneous mixture. Sap > 1, on the other hand, indicates that the less reactive mixture will allow the flame to develop within the mixture, making pre-ignition more likely. The effects of equivalence ratio and pressure on the Sap value of DME/‘air’ mixtures at temperatures ranging from 770 K to 1250 K are depicted in Figure 10. Clearly, the Sap-predicted ignition modes for DME/‘air’ mixtures well reproduce the equivalence ratio and pressure dependences of the pre-ignition observed experimentally in Figure 3 and Figure 4. Specifically, in the temperature transition zone, the lean and stoichiometric DME mixtures (PHI0.5, PHI1.0) were predicted to be more prone to pre-ignition than the rich mixtures (PHI2.0, PHI3.0, PHI5.0), whereas PHI2.0 mixtures tended to undergo strong/homogeneous ignition at 9 atm compared to the mixtures at 3 atm and 1 atm. Overall, the Sap prediction performance for the pre-ignition of DME/‘air’ mixtures has been validated across a wider range of equivalence ratios, temperatures, and pressures.

5. Conclusions

Understanding hydrocarbon preignition is critical for the operation and design of internal combustion engines. The pre-ignition behavior of DME mixtures observed in our previous study [22] inspired this study. An in-depth study of pre-ignition using an HPST was used to supplement more comprehensive experimental data. Because of the occurrence of pre-ignition, the IDTs of the PHI0.5, PHI1.0, PHI2.0, and PHI3.0 DME mixtures decreased significantly in the temperature transition zone (~1000 K). The experimental results indicated that the pre-ignition behavior was strongly dependent on the equivalence ratio and pressure. DME mixtures with lower pressures (1 and 3 atm) and smaller equivalence ratios were more prone to pre-ignition. To investigate the tendency of pre-ignition in DME mixtures, four criteria (Stp, α, Da*, and Sap) were investigated. The temperature perturbation sensitivity Stp was discovered to be a better criterion for interpreting the experimental pre-ignition behavior. Furthermore, Sap, which describes the competition between laminar flame propagation velocity and spontaneous front velocity, could efficiently reproduce the equivalence ratio and pressure dependence of the pre-ignition tendency. The theoretical prediction parameters Stp = 75 μs/K and Sap = 1 could be used to help identify the conditions under which inhomogeneous ignition may prevail. The results can also provide experimentalists with information to avoid specific regimes when designing experiments.
It should be noted that only the fuel combustion characteristics were examined in this study, regardless of the source of the hot spots. The mechanism for generating hot spots is still unknown and requires further research. Furthermore, the auto-ignition experiments below 1000 K at 1 atm could not be conducted in this study because of the limited test time of the shock tube. In addition, the currently existing DME mechanism has a large uncertainty at low temperatures and low pressures. Therefore, additional experimental research and mechanistic investigations are required to identify whether NTC fuel pre-ignition takes place at low temperatures and low pressure.

Author Contributions

Conceptualization, Y.Z. and W.H.; methodology, H.W.; software, W.S.; validation, W.H. and C.H.; formal analysis, W.H.; investigation, W.H.; resources, Y.Z.; data curation, W.H.; writing—original draft preparation, W.H.; writing—review and editing, Z.T. and Y.Y.; supervision, Y.Z.; project administration, Z.H.; funding acquisition, Y.Z. All authors have read and agreed to the published version of the manuscript.

Funding

This research was funded by [National Natural Science Foundation of China] grant number [U2141203], [National Science and Technology Major Project] grant number [J2019-III-0004-0047] and [2021-JCJQ-ZD-062-12].

Data Availability Statement

Not applicable.

Acknowledgments

Thanks for the suggestion from Zheng Chen on the pre-ignition analysis.

Conflicts of Interest

The authors declare no conflict of interest.

References

  1. Withrow, L.; Bowditch, F. Flame Photographs of Autoignition Induced by Combustion-Chamber Deposits; SAE International: Warrendale, PA, USA, 1952. [Google Scholar] [CrossRef]
  2. Wang, Z.; Qi, Y.; He, X.; Wang, J.; Shuai, S.; Law, C.K. Analysis of pre-ignition to super-knock: Hotspot-induced deflagration to detonation. Fuel 2014, 144, 222–227. [Google Scholar] [CrossRef]
  3. Kalghatgi, G.; Bradley, D. Pre-ignition and ‘super-knock’ in turbo-charged spark-ignition engines. Int. J. Engine Res. 2012, 13, 399–414. [Google Scholar] [CrossRef]
  4. Rönn, K.; Swarts, A.; Kalaskar, V.; Alger, T.; Tripathi, R.; Keskiväli, J.; Kaario, O.; Santasalo-Aarnio, A.; Reitz, R.; Larmi, M. Low-speed pre-ignition and super-knock in boosted spark-ignition engines: A review. Prog. Energy Combust. Sci. 2023, 95, 101064. [Google Scholar] [CrossRef]
  5. Sparrow, S. Preignition and Spark-plugs. SAE Int. 1920, 15, 412–427. [Google Scholar]
  6. Wang, S.; Davidson, D.F.; Hanson, R.K. Shock tube techniques for kinetic target data to improve reaction models. Comput. Aided Chem. Eng. 2019, 45, 169–202. [Google Scholar] [CrossRef]
  7. Hong, Z.; Davidson, D.F.; Hanson, R.K. Contact surface tailoring condition for shock tubes with different driver and driven section diameters. Shock Waves 2009, 19, 331–336. [Google Scholar] [CrossRef]
  8. Campbell, M.F.; Parise, T.; Tulgestke, A.M.; Spearrin, R.M.; Davidson, D.F.; Hanson, R.K. Strategies for obtaining long constant-pressure test times in shock tubes. Shock Waves 2015, 25, 651–665. [Google Scholar] [CrossRef]
  9. Dahnz, C.; Han, K.-M.; Spicher, U.; Magar, M.; Schiessl, R.; Maas, U. Investigations on Pre-Ignition in Highly Supercharged SI Engines. SAE Int. J. Engines 2010, 3, 214–224. [Google Scholar] [CrossRef]
  10. Menrad, H. Preignition and knock behavior of alcohol fuels. Sae Pap. 1982, 91, 3738–3752. [Google Scholar]
  11. Akram, Z.; Peter, R.; Wai, N.; Muniappan, A.; Simon, S.; Jorg, S.; Thomas, G. Fundamental approach to investigate pre-ignition in boosted si engines. SAE Int. J. Engines 2011, 4, 246–273. [Google Scholar]
  12. Zöbinger, N.; Schweizer, T.; Lauer, T.; Kubach, H.; Koch, T. Experimental and Numerical Analysis on Two-Phase Induced Low-Speed Pre-Ignition. Energies 2021, 14, 5063. [Google Scholar] [CrossRef]
  13. Hamilton, L.J.; Rostedt, M.G.; Caton, P.A.; Cowart, J.S. Pre-Ignition Characteristics of Ethanol and E85 in a Spark Ignition Engine. SAE Int. J. Fuels Lubr. 2008, 1, 145–154. [Google Scholar] [CrossRef]
  14. Ninnemann, E.; Koroglu, B.; Pryor, O.; Barak, S.; Nash, L.; Loparo, Z.; Sosa, J.; Ahmed, K.; Vasu, S. New insights into the shock tube ignition of H2/O2 at low to moderate temperatures using high-speed end-wall imaging, Combust. Flame 2018, 187, 11–21. [Google Scholar] [CrossRef]
  15. Fei, S.; Qi, Y.; Liu, W.; Wang, Y.; Wang, Z.; Zhang, H. Combustion Modes Induced by Oil-Droplet Gas-Phase Pre-ignition in the Chamber under Different Environmental Conditions. Combust. Sci. Technol. 2021, 195, 379–397. [Google Scholar] [CrossRef]
  16. Pryor, O.; Barak, S.; Koroglu, B.; Ninnemann, E.; Vasu, S.S. Measurements and interpretation of shock tube ignition delay times in highly CO2 diluted mixtures using multiple diagnostics. Combust. Flame 2017, 180, 63–76. [Google Scholar] [CrossRef] [Green Version]
  17. Santner, J.; Goldsborough, S.S. Hot-spot induced mild ignition: Numerical simulation and scaling analysis. Combust. Flame 2019, 209, 41–62. [Google Scholar] [CrossRef]
  18. Gao, Y.; Dai, P.; Chen, Z. Numerical studies on autoignition and detonation development from a hot spot in hydrogen/air mixtures. Combust. Theory Model. 2019, 24, 245–261. [Google Scholar] [CrossRef]
  19. Figueroa-Labastida, M.; Badra, J.; Elbaz, A.M.; Farooq, A. Shock tube studies of ethanol preignition. Combust. Flame 2018, 198, 176–185. [Google Scholar] [CrossRef]
  20. Figueroa-Labastida, M.; Luong, M.B.; Badra, J.; Im, H.G.; Farooq, A. Experimental and computational studies of methanol and ethanol preignition behind reflected shock waves. Combust. Flame 2021, 234, 111621. [Google Scholar] [CrossRef]
  21. Nativel, D.; Niegemann, P.; Herzler, J.; Fikri, M.; Schulz, C. Ethanol ignition in a high-pressure shock tube: Ignition delay time and high-repetition-rate imaging measurements. Proc. Combust. Inst. 2020, 38, 901–909. [Google Scholar] [CrossRef]
  22. Huang, W.; Zhao, Q.; Huang, Z.; Curran, H.J.; Zhang, Y. A kinetics and dynamics study on the auto-ignition of dimethyl ether at low temperatures and low pressures. Proc. Combust. Inst. 2020, 38, 601–609. [Google Scholar] [CrossRef]
  23. Javed, T.; Badra, J.; Jaasim, M.; Es-Sebbar, E.; Labastida, M.F.; Chung, S.H.; Im, H.G.; Farooq, A. Shock Tube Ignition Delay Data Affected by Localized Ignition Phenomena. Combust. Sci. Technol. 2016, 189, 1138–1161. [Google Scholar] [CrossRef]
  24. Walton, S.; He, X.; Zigler, B.; Wooldridge, M.; Atreya, A. An experimental investigation of iso-octane ignition phenomena. Combust. Flame 2007, 150, 246–262. [Google Scholar] [CrossRef]
  25. Huang, C.; Wang, Y.; Deiterding, R.; Yu, D.; Chen, Z. Numerical studies on weak and strong ignition induced by reflected shock and boundary layer interaction. Acta Mech. Sin. 2022, 38, 121466. [Google Scholar] [CrossRef]
  26. Yu, D.; Chen, Z. Theoretical analysis on the ignition of a combustible mixture by a hot particle. J. Fluid Mech. 2022, 936, A22. [Google Scholar] [CrossRef]
  27. Burke, U.; Somers, K.P.; O’Toole, P.; Zinner, C.M.; Marquet, N.; Bourque, G.; Petersen, E.L.; Metcalfe, W.K.; Serinyel, Z.; Curran, H.J. An ignition delay and kinetic modeling study of methane, dimethyl ether, and their mixtures at high pressures. Combust. Flame 2015, 162, 315–330. [Google Scholar] [CrossRef] [Green Version]
  28. Sun, W.; Huang, W.; Qin, X.; Deng, Y.; Kang, Y.; Peng, W.; Zhang, Y.; Huang, Z. Water impact on the auto-ignition of kerosene/air mixtures under combustor relevant conditions. Fuel 2020, 267, 117184. [Google Scholar] [CrossRef]
  29. Petersen, E.; Rickard, M.J.A.; Crofton, M.W.; Abbey, E.D.; Traum, M.J.; Kalitan, D.M. A facility for gas- and condensed-phase measurements behind shock waves. Meas. Sci. Technol. 2005, 16, 1716–1729. [Google Scholar] [CrossRef]
  30. CHEMKIN-PRO 18.2; Reaction Design: San Diego, CA, USA, 2018.
  31. Wang, Z.; Zhang, X.; Xing, L.; Zhang, L.; Herrmann, F.; Moshammer, K.; Qi, F.; Kohse-Höinghaus, K. Experimental and kinetic modeling study of the low- and intermediate-temperature oxidation of dimethyl ether. Combust. Flame 2014, 162, 1113–1125. [Google Scholar] [CrossRef]
  32. Zhou, C.-W.; Li, Y.; Burke, U.; Banyon, C.; Somers, K.P.; Ding, S.; Khan, S.; Hargis, J.W.; Sikes, T.; Mathieu, O.; et al. An experimental and chemical kinetic modeling study of 1,3-butadiene combustion: Ignition delay time and laminar flame speed measurements. Combust. Flame 2018, 197, 423–438. [Google Scholar] [CrossRef]
  33. Reuter, C.B.; Zhang, R.; Yehia, O.R.; Rezgui, Y.; Ju, Y. Counterflow flame experiments and chemical kinetic modeling of dimethyl ether/methane mixtures. Combust. Flame 2018, 196, 1–10. [Google Scholar] [CrossRef]
  34. Yan, C.; Zhao, H.; Wang, Z.; Song, G.; Lin, Y.; Mulvihill, C.R.; Jasper, A.W.; Klippenstein, S.J.; Ju, Y. Low- and intermediate-temperature oxidation of dimethyl ether up to 100 atm in a supercritical pressure jet-stirred reactor. Combust. Flame 2022, 243, 112059. [Google Scholar] [CrossRef]
  35. Zhao, H.; Yang, X.; Ju, Y. Kinetic studies of ozone assisted low temperature oxidation of dimethyl ether in a flow reactor using molecular-beam mass spectrometry. Combust. Flame 2016, 173, 187–194. [Google Scholar] [CrossRef]
  36. Kurimoto, N.; Brumfield, B.; Yang, X.; Wada, T.; Diévart, P.; Wysocki, G.; Ju, Y. Quantitative measurements of HO2/H2O2 and intermediate species in low and intermediate temperature oxidation of dimethyl ether. Proc. Combust. Inst. 2015, 35, 457–464. [Google Scholar] [CrossRef]
  37. Moshammer, K.; Jasper, A.W.; Popolan-Vaida, D.M.; Lucassen, A.; Diévart, P.; Selim, H.; Eskola, A.J.; Taatjes, C.A.; Leone, S.R.; Sarathy, S.M.; et al. Detection and Identification of the Keto-Hydroperoxide (HOOCH2OCHO) and Other Intermediates during Low-Temperature Oxidation of Dimethyl Ether. J. Phys. Chem. A 2015, 119, 7361–7374. [Google Scholar] [CrossRef] [Green Version]
  38. Meyer, J.; Oppenheim, A. On the shock-induced ignition of explosive gases. Symp. (Int.) Combust. 1971, 13, 1153–1164. [Google Scholar] [CrossRef]
  39. Mathieu, O.; Pinzón, L.T.; Atherley, T.M.; Mulvihill, C.R.; Schoel, I.; Petersen, E.L. Experimental study of ethanol oxidation behind reflected shock waves: Ignition delay time and H2O laser-absorption measurements. Combust. Flame 2019, 208, 313–326. [Google Scholar] [CrossRef]
  40. Im, H.G.; Pal, P.; Wooldridge, M.S.; Mansfield, A.B. A Regime Diagram for Autoignition of Homogeneous Reactant Mixtures with Turbulent Velocity and Temperature Fluctuations. Combust. Sci. Technol. 2015, 187, 1263–1275. [Google Scholar] [CrossRef] [Green Version]
  41. Sankaran, R.; Im, H.G.; Hawkes, E.R.; Chen, J.H. The effects of non-uniform temperature distribution on the ignition of a lean homogeneous hydrogen–air mixture. Proc. Combust. Inst. 2005, 30, 875–882. [Google Scholar] [CrossRef]
  42. Strozzi, C.; Mura, A.; Sotton, J.; Bellenoue, M. Experimental analysis of propagation regimes during the autoignition of a fully premixed methane–air mixture in the presence of temperature inhomogeneities. Combust. Flame 2012, 159, 3323–3341. [Google Scholar] [CrossRef]
Figure 1. Diagram of the high-pressure shock tube facility.
Energies 16 02118 g001
Figure 2. Simulated ignition delay times of PHI1.0 DME/‘air’ mixtures with various kinetic models [27,31,32,33] at pressures of 3 atm and 40 atm.
Energies 16 02118 g002
Figure 3. Measured and simulated ignition delay times of DME/‘air’ mixtures with different equivalence ratios at a pressure of 3.0 atm. Symbols represent experimental data from [22]. Lines represent model predictions using AramcoMech 3.0 with constant U and V assumptions. (a) φ = 0.5, 1.0, and 2.0. (b) φ = 3.0 and 5.0.
Energies 16 02118 g003
Figure 4. Measured and simulated ignition delay times of PHI2.0 DME/‘air’ mixture at different pressures. Symbols represent experimental data in this study. Lines represent model predictions using AramcoMech 3.0 with constant U and V assumptions.
Energies 16 02118 g004
Figure 5. Typical time histories of reflected shock pressure and OH* chemiluminescence in the ignition process of PHI2.0 DME/‘air’ mixture with and without pre-ignition at 3 atm.
Energies 16 02118 g005
Figure 6. Temperature perturbation sensitivity coefficient Stp of DME/‘air’ mixtures with equivalence ratios ranging from 0.5 to 5.0 and pressures of 1–9 atm. (a) Equivalence ratio dependence. (b) Pressure dependence.
Energies 16 02118 g006
Figure 7. Thermal diffusivity of DME/‘air’ mixtures with varying equivalence ratios at different pressures.
Energies 16 02118 g007
Figure 8. Flame thickness of DME/‘air’ mixtures at various equivalence ratios and different pressures.
Energies 16 02118 g008
Figure 9. Da* of DME/‘air’ mixtures at various pressures and equivalence ratios.
Energies 16 02118 g009
Figure 10. Sankaran number of DME/‘air’ mixtures with different equivalence ratios at different pressures. (a) Equivalence ratio dependence. (b) Pressure dependence.
Energies 16 02118 g010
Table 1. Summary of experimental conditions.
Mix.φp (atm)XDMEXO2XAr
PHI0.50.533.38%20.29%76.33%
PHI1.01.036.54%19.63%73.83%
PHI2.02.01, 3, 912.28%18.42%69.30%
PHI3.03.0317.36%17.36%65.28%
PHI5.05.0325.93%15.56%58.51%
Disclaimer/Publisher’s Note: The statements, opinions and data contained in all publications are solely those of the individual author(s) and contributor(s) and not of MDPI and/or the editor(s). MDPI and/or the editor(s) disclaim responsibility for any injury to people or property resulting from any ideas, methods, instructions or products referred to in the content.

