Abstract
In the last few years, the integration of renewable distributed generation (RDG) in the electrical distribution network (EDN) has become a favorable solution that guarantees and keeps a satisfying balance between electrical production and consumption of energy. In this work, various metaheuristic algorithms were implemented to perform the validation of their efficiency in delivering the optimal allocation of both RDGs based on multiple photovoltaic distributed generation (PVDG) and wind turbine distributed generation (WTDG) to the EDN while considering the uncertainties of their electrical energy output as well as the load demand’s variation during all the year’s seasons. The convergence characteristics and the results reveal that the marine predator algorithm was effectively the quickest and best technique to attain the best solutions after a small number of iterations compared to the rest of the utilized algorithms, including particle swarm optimization, the whale optimization algorithm, moth flame optimizer algorithms, and the slime mold algorithm. Meanwhile, as an example, the marine predator algorithm minimized the seasonal active losses down to 56.56% and 56.09% for both applied networks of IEEE 33 and 69-bus, respectively. To reach those results, a multi-objective function (MOF) was developed to simultaneously minimize the technical indices of the total active power loss index (APLI) and reactive power loss index (RPLI), voltage deviation index (VDI), operating time index (OTI), and coordination time interval index (CTII) of overcurrent relay in the test system EDNs, in order to approach the practical case, in which there are too many parameters to be optimized, considering different constraints, during the uncertain time and variable data of load and energy production.
1. Introduction
1.1. Motivation
The quick advancement in the technologies of renewable distributed generations in various categories and capacities is the reconfiguration of the electrical distribution network in significant ways. The DG-based renewable sources coupled directly to the EDN deliver energy to the customer and support and supply the EDN, although they show diverse economic and technological challenges and advantages of sustainable RDG technologies when integrating into the EDN [1]. The presence of the sources of photovoltaic (PV) and wind turbines (WT) is getting a good purchase on the EDN’s future roadmap [2].
If the mentioned energy sources show neither pollution nor exhaustion, they are also meant to be nearly the only source for the long-term infrastructure’s energy supplies [3]. Added to that, the RDGs reveal plenty of advantages that may be considered in addition to the clean energy provided; they can contribute to the mitigation of either active and reactive losses, additionally enhancing the system’s voltage and protection. Otherwise, the biggest part of DG-based renewable sources comprises infrequent output power.
The planning of EDN is obstructed by the unpredictable power generation of non-transmitted renewable distributed generation (RDG), the load fluctuations, the growth in demand, and the prices of the electricity market. An efficient model of the uncertainties is requested to guarantee the optimal presence of the RDGs in the EDN [4]. Linking the RDG units to existing electrical distribution networks could create plenty of trouble, such as raising the system’s power fluctuations and losses, under the condition of bad sizing and location [5]. According to the uncertain characteristics of power generation, the integration of DG units-based renewable sources may pose different challenges. The planning feature of RDGs aims to determine the proper allocation of favorable products including the smallest quantity of environmental effects [6].
1.2. Literature Review
Plenty of optimization algorithms were used optimally allocate RDG into the EDN when considering the charge power demand and output power generation uncertain-ty, based on many objective functions. Among them are: applying the particle swarm optimization (PSO) algorithm to minimize power loss and enhance the voltage profiles considering a new voltage stability index [7]; an improved PSO algorithm for maximizing the RDG allocation project’s net profit [8]; a coefficient PSO for minimizing the total losses of energy [9]; applying the algorithm of hybrid tabu search PSO for minimizing the cost [10]; the adaptive genetic algorithm to mitigate the network loss of power and to maximize the bus voltage deviation [11]; the phasor PSO algorithm to reduce yearly economic loss in the practical distribution system in Portuguese [12]; and the embedded genetic algorithm to minimize the prices of electricity [13]. Others include the algorithm of adaptive differential evolution for minimizing voltage deviation and the active losses [14]; the water cycle algorithm for reducing the multi-objective function based on techno-economic parameters [15]; applying the algorithm of heuristic moment matching for maximizing the objective of present net value [16]; the imperialist competitive algorithm to minimize active power loss and ameliorate voltage stability [17]; applying the algorithm of lightning attachment procedure optimization for reduction of power losses [18]; the algorithm of decentralized energy market trading to maximize the surplus of RDG [19]; the grasshopper optimization algorithm to improve reliability, voltage profiles, and economic interests [20]; the algorithm of big bang–big crunch for minimizing different parameters [21]; the strength pareto evolutionary algorithm 2 to reduce the active losses, operation annual costs, and emissions of pollutant gas [22]; and applied teaching learning based optimization for the aim of reducing the losses in power and voltage deviation index [23].
Recently, the application of the following algorithms have been used: the stochastic ranking algorithm to reduce power loss, voltage deviation, and cost, and also to maximize the rate of RDG penetration [24]; applied the equilibrium optimizer algorithm for mitigating the active power losses, the voltage deviation of system, and the total cost and emissions [25]; the non-dominated sorting genetic algorithm-2 to per-form the optimization of the system operation, reliability, and emission costs [26]; using the spring search algorithm to perform the optimization of total emissions, voltage deviation, energy costs, and active losses [27]; applying the grey wolf optimizer to optimize the multiple objective functions represented as the total of various technical in-dices [28]; the algorithm of affine arithmetic optimization for minimizing power losses [29]; the Harris hawks optimizer to mitigate active loss, ameliorate system stability, voltage, and savings on the yearly costs [30]; the artificial hummingbird algorithm, to mitigate the power losses, enhance voltage stability, voltage deviation reduction, and yearly economic savings [31].
1.3. Contributions of This Article
In this work, the problem of RDG’s allocation was solved when utilizing the recent metaheuristic technique of the marine predator algorithm (MPA), which is one of the newest optimization techniques that simulates the foraging behavior and movement of marine predators [32]. Recently, various researchers applied the MPA algorithm to different power system problems: solving the combined heat and power economic dispatch problem in [33], solving single- and multi-objective optimal power flow problems in [34], the optimal reactive power dispatch problem with high penetration of RDGs in [35], the process of optimizing the simultaneous network reconfiguration and DG allocation in EDS in [36,37], frequency regulation for automatic generation control in the multi-microgrid system in [38], stability of frequency in power systems integrated with wind energy in [39], and extracting the optimized parameters of three-photovoltaic solar cell models based on the three-diode model in [40].
Otherwise, the MPA has been compared with these algorithms: the whale optimization algorithm (WOA) [41], particle swarm optimization (PSO) [42], the moth flame optimizer (MFO) algorithm [43], and the slime mould algorithm (SMA) [44], to optimally locate and size many types of DG units-based PV and WT sources to obtain in the EDN when taking into consideration the uncertainties of output power from RDGs, as well as the load demand during all the year’s seasons.
The new proposed multi-objective function (MOF) was devoted to simultaneously minimizing the various technical indices: APLI, RPLI, VDI, OTI, and CTII of the primary and backup relays located in the distribution network. The main contributions of this study can be summarized as follows:
- -
- Application of several recent optimization algorithms for solving the multi-dimension-based allocation problem of RDG;
- -
- Assessing the performance of the tested algorithm based on technical multi-objective functions;
- -
- The validation is carried out on two test systems;
- -
- The uncertainty of RDG output is modeled for different operating conditions;
- -
- The load uncertainty is modeled under different operating seasons to clarify the contribution.
1.4. Organization of the Article
The remaining parts of this paper are organized as follows: Section 2 describes the uncertainty modelling of RDG sources; Section 3 represents the multi-dimensional framework for operating requirements of EDN; Section 4 contains the application and obtained results; and Section 5 presents the main findings and conclusions.
2. Uncertainty Models of Load and RDG Sources
2.1. Load Demand Uncertainties
The generic mathematical modeling of the active and reactive power demand uncertainty is represented with Equations (1) and (2), respectively [45,46] as:
Figure 1 illustrates the seasonal variation of load demand represented as 96 h [45,46]. Based on Figure 1, the load demand records its high level during the summer season in which it reaches almost 100% by mid-day hours and also around 22h00. Meanwhile, in the fall season, the smallest variation in load demand is recorded, which is less than 55% around 22h00.
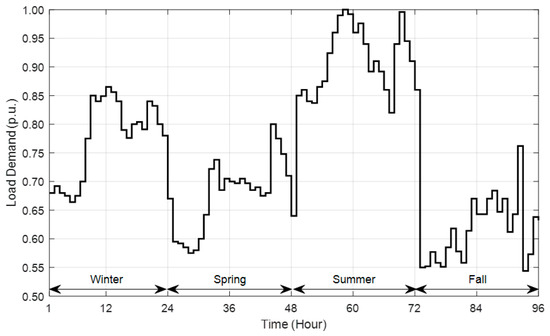
Figure 1.
Seasonal load demand variation.
2.2. Modeling of DG-Based PV Uncertainty
The irradiance from solar in each of the day’s hours is modeled with the beta probability density function (PDF), which is extracted from historical data [47]. For every period (in this study: 1 h), the PDF solar irradiance is expressed as [48]:
where, A and B are calculated as [49,50]:
The state’s solar irradiance (s) probability in each hour is calculated as:
The PV modules ‘s output power module is calculated as [47,48,49,50]:
Figure 2 exposes the seasonal power output from the PVDG represented as 96 h. In Figure 2, the PV output is high in the summer season, especially at the hours around mid-day, and it also varies proportionally with the irradiation of solar throughout the year, and remains at zero whenever irradiation is absent, in general between 18h00 and 6h00.
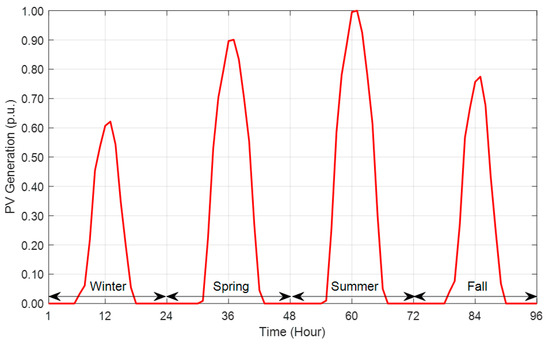
Figure 2.
The seasonal variation of PVDG output power.
2.3. Modeling of DG Based Wind Turbine Uncertainty
WT generation power is related to wind speed and parameters of the power performance curve. Once the Rayleigh PDF is produced in a specified period segment, the output power in each state is calculated thus [51,52]:
Figure 3 represents the WTDG’s seasonal power generation, represented in 96 h. The weakest electrical power generated from WTDG is recorded in the summer season, whereas the highest power generation is granted in the winter season. Additionally, WTDG output power generation is proportionally related to the speed of wind; hence, when the season is windy, the generated power is at maximum.
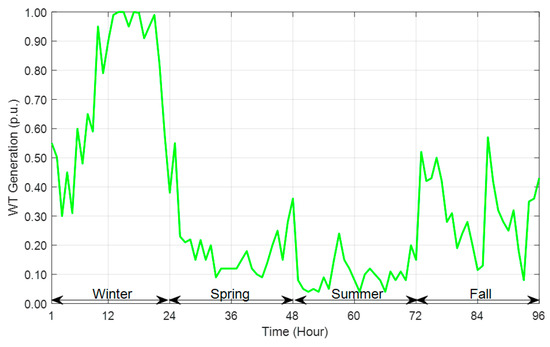
Figure 3.
The seasonal variation of WTDG output power.
Figure 4 represents the distribution line k that is represented with an impedance that is connected between buses i and j, with the installation of PV and based RDG.
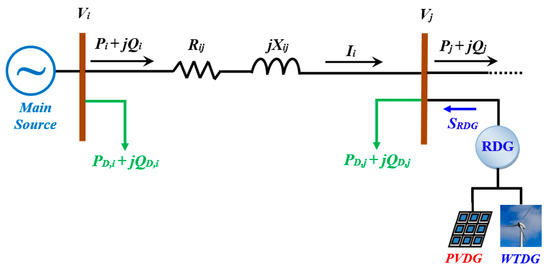
Figure 4.
Modeling the distribution line with the presence of RDG sources.
3. Multi-Dimension Framework for Operating Requirements of EDN
3.1. Multi-Objective Functions
The proposed multi-objective functions (MOF) for this work are devoted to searching the optimal location and size of multiple DGs based on the PV and WT units in both test systems’ EDNs, to simultaneously minimize the target indices: APLI, RPLI, VDI, OTI, and CTII. The next equation represents its formulation:
The active power loss index (APLI) can be formulated as [53,54]:
The reactive power loss index (RPLI) is formulated as [55]:
where RPLBefore RDG/AfterRDG symbolize reactive power losses before and after RDG, and APLBefore RDG/AfterRDG symbolize active power losses before and after RDG.
The voltage deviation index (VDI) is represented as [56,57]:
where VDBefore RDG/AfterRDG is the voltage deviation before and after RDG.
The overcurrent relays’ operation time index (OTI) is expressed as [55]:
The coordination time interval index (CTII) of primary and backup OCRs is written as [55]:
where OTBefore RDG/AfterRDG is the operation time before and after RDG, OTBackup is the backup relay’s operation time, and CTIBefore RDG/After RDG represents the coordination time interval before and after RDG.
3.2. Equality Constraints
Equations (30) and (31) represent the active and reactive power balance of the tested power system. In these equations, all those supplied by active/reactive power from the grid, plus those generated with RDG units, equal the requested active/reactive power demand plus the active/reactive power losses:
3.3. Distribution Line Constraints
Equation (32) shows the voltage at bus i is preserved between the upper and lower limits. The voltage deviation between the target voltage at load buses (1.0) and the voltage Vr is kept below the maximum allowable voltage deviation ΔVmax as shown in Equation (33). Security constraint of the distribution line is represented in Equation (34).
3.4. RDG Units’ Inequality Constraints
The following equations show inequality constraints in RDG units:
3.5. Overview of MPA Algorithm
The MPA algorithm is a new optimization algorithm that is conceptualized from the foraging behavior and interactions between aquatic predators and prey. This algorithm is dependent on finding the global optima to an optimization by mimicking the foraging strategies of marine predators [32]. The MPA initializes a solution set randomly, which is distributed across the space of search. Its pseudocode is presented as follows (Algorithm 1):
| Algorithm 1. Pseudocode of applied MPA algorithm. |
| Initialize the search argent population (Prey) While termination criteria are not met Calculate the fitness and construct the matrix Elite If Update Prey based in Else If For the first half of the populations ( Update Prey based in For the other half of populations Update Prey based in Else If Update Prey based in End If Realize memory saving and update Elite Apply FADs effect and update accordingly End While |
4. Applications and Results
4.1. Test Systems
The proposed algorithm in this work is validated based on two standard EDNs of IEEE 33-bus, and 69-bus [57,58], that are mentioned in Figure 5a,b and are represented by their single lone diagrams. Both of these test systems operate under a base voltage of 12.66 kV. Meanwhile, the total active load is 3715.00 kW, and the reactive load is 2300.00 kVar for the first standard EDN, and 3790.00 kW and 2690.00 kVar for the second standard EDN.
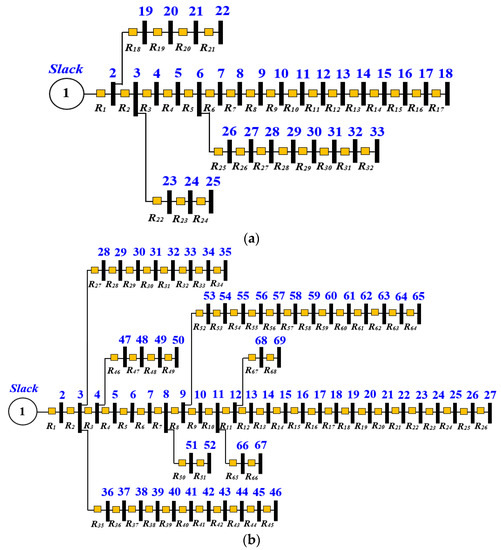
Figure 5.
Test systems’ single diagram: (a) IEEE 33-bus; (b) IEEE 69-bus.
Each bus of both systems would be protected by an overcurrent relay (OCR) and covered by a backup OCR, with a coordination time interval (CTI) that been set over 0.2 s. It is calculated for the first standard as 32 OCRs and 31 CTIs. Meanwhile, for the second test standard, it is calculated as 68 OCRs and 67 CTIs.
4.2. Analysis Results and Comparison
Table 1 gathers the principal parameters and characteristics of the two distribution networks before the presence of RDG units.

Table 1.
The main parameters and characteristics of the EDN test systems.
Table 2 and Table 3 summarize the results after the optimization when using the various recent algorithms, while comparing the cases before and after installation of PVDG and WTDG units into IEEE 33 and 69-bus EDNs, respectively. The chosen algorithms were implemented in MATLAB Software (version 2017.b). The PC consists of a processor of Intel Core i5/3.4 GHz including a RAM of 8 GB.
Table 2.
The results after optimization for IEEE 33-bus.
Table 3.
The results after optimization for IEEE 69-bus.
The optimization results shown in Table 2 and Table 3 reveal the superiority and effectiveness of the MPA technique in delivering the best results represented as the minimum of MOF for all studied cases of RDG optimal integration. Furthermore, the case of hybrid PVDG-WTDG units was the best choice that provided the minimum of all results simultaneously for EDNs.
The hybrid PVDG-WTDG units case minimized the MOF to the rate of 232.78% for the first test system, which was less than 10.90% in the case of WTDG units and 104.51% in the case of PVDG units, while minimizing the MOF to the rate of 238.12% for the second test system, which was 22.88% less than in the case of WTDG units and 94.82% less than in the case of PVDG units.
The other algorithms also showed good efficiency by delivering best and minimum results, but for each index on its own, as mentioned, for the first EDN, the SMA reduced the APL to 79.38% in the case of PVDG units, and the PSO algorithm minimized the VD to 66.90% in the case of WTDG units. For the second EDN, the SMA minimized the APL to 76.12% in the case of PVDG units and the PSO algorithm minimized the VD to 73.90% in the case of WTDG units, while the MFO algorithm minimized the OT of the overcurrent relays to 99.83% in the case of hybrid PVDG-WTDG units.
Figure 6 and Figure 7 represent the boxplot of the applied algorithms for 20 executions for the optimal integration of all studied cases into the test system EDNs. To ameliorate the comparison between all the applied optimization algorithms, the MOF boxplot minimization has been implemented and is shown in Figure 6 and Figure 7. After 20 independent runs, all the applied algorithms revealed good performance and reliability in providing very favorable results, with MOF providing the best minimization, and the MPA technique exhibiting superior behavior among all of them. The results also confirm the capability of the MPA in finding the best results for MOF minimization, even with the minimum median for all the cases studied. Furthermore, it is obvious that the best MOF results of minimization for the 20 runs recorded when using the MPA technique were delivered based on the case hybrid PVDG-WTDG units for both test system EDNs.
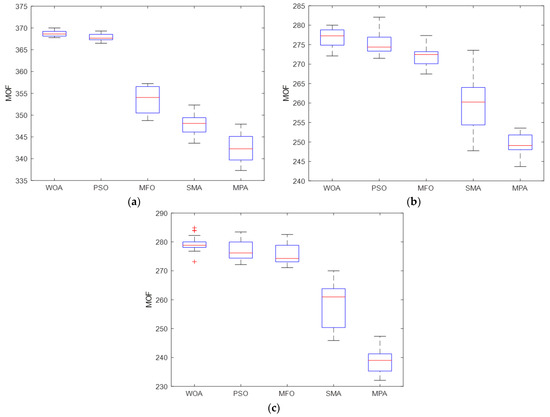
Figure 6.
The MOF boxplot after applying the algorithms for the IEEE 33-bus: (a) PVDG case; (b) WTDG case; (c) Hybrid PVDG-WTDG case.
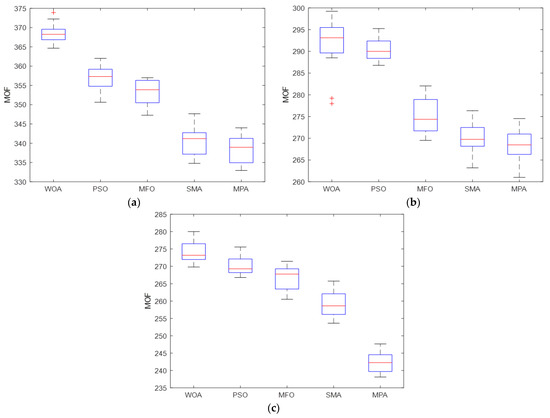
Figure 7.
The MOF boxplot after applying the algorithms for the IEEE 69-bus: (a) PVDG case; (b) WTDG case; (c) Hybrid PVDG-WTDG case.
Figure 8 and Figure 9 depict the convergence curves for the minimization of MOF when applying the algorithms for the optimal setting of all the studied cases in the two test system EDNs.
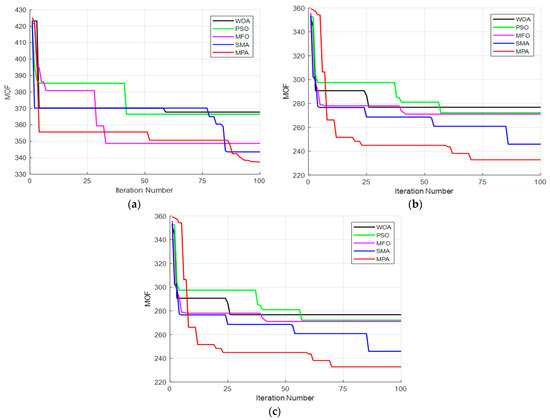
Figure 8.
Characteristics of convergence of the algorithms for the IEEE 33-bus: (a) PVDG case; (b) WTDG case; (c) Hybrid PVDG-WTDG case.
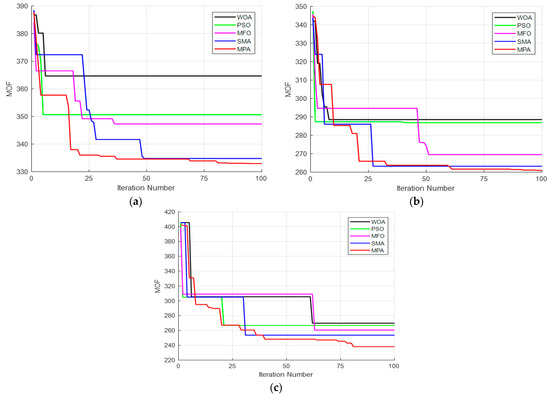
Figure 9.
Characteristics of convergence of the algorithms for the IEEE 69-bus: (a) PVDG case; (b) WTDG case; (c) Hybrid PVDG-WTDG case.
The analysis of the convergence characteristics in Figure 8 and Figure 9, after the application of the algorithms for all cases’ presence into both test system EDNs, and for a maximum number of iterations set to 100, including a population size equal to 10, reveals the superiority of the MPA in producing the best results and solutions for the aforementioned formulated problem.
When compared to all the applied algorithms, the MPA provided the minimum of MOF for all the studied cases for the optimal presence in both test system EDNs, including much better results when installing the hybrid PVDG-WTDG units, meanwhile minimizing the MOF to the rate of 232.78% for the first EDN, and to the rate 238.12% for the second EDN. The MPA had a slow convergence characteristic to reach the optimal solutions; it also settles down late, mostly after 70 iterations for all the studied cases in both test system EDNs. Figure 10 comprises the seasonal total active power losses variation represented as 96 h, for all cases of optimal presence in the two EDN systems.
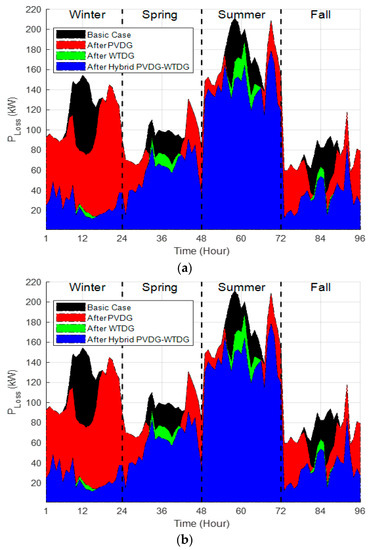
Figure 10.
The seasonal total active power losses variation: (a) IEEE 33-bus; (b) IEEE 69-bus.
Figure 10 shows that the optimal presence of all studied cases based on using the technique of MPA had clear and strong effects on the technical characteristics and parameters of the two test system EDNs, as the mentioned seasonal total active power losses.
The seasonal total active power losses were significantly minimized for both test system EDNs and demonstrated optimal installation of all the studied cases, with superior effects and minimization provided in the case of hybrid PVDG-WTDG units from a total value of 11.151 MWh down to 7.32 MWh for the first system EDN with a minimization rate of 56.56%, and from a total value of 11.845 MWh down to 6.64 MWh with a minimization rate of 56.09%; as long as the hybrid PVDG-WTDG units combine two renewable sources that generate both active and reactive powers, their generation is guaranteed continuously throughout the year’s seasons and almost without interruption.
Figure 11 and Figure 12 show the seasonal branch active power loss variation of both test system EDNs represented in 96 h for all the studied cases of optimal RDG presence.
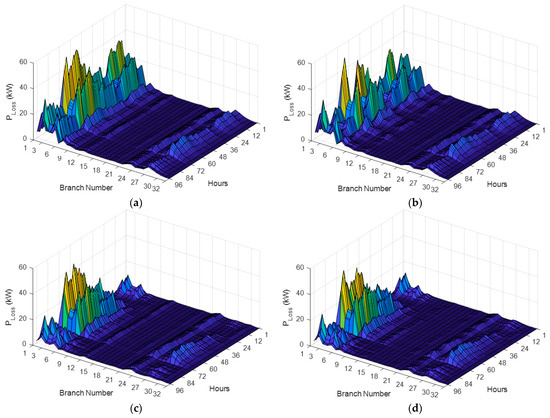
Figure 11.
Seasonal branch active power loss variation for the IEEE 33-bus: (a) Basic case; (b) PVDG case; (c) WTDG case; (d) Hybrid PVDG-WTDG case.
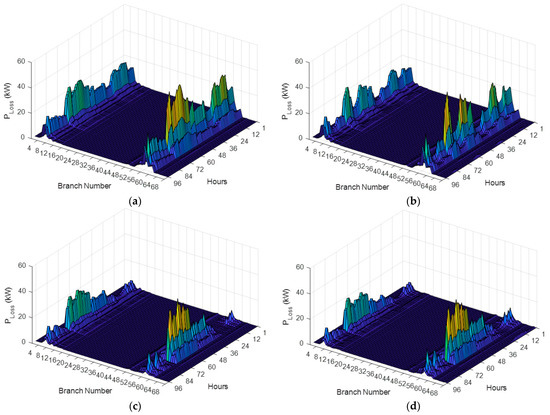
Figure 12.
Seasonal branch active power loss variation for the IEEE 69-bus: (a) Basic case; (b) PVDG case; (c) WTDG case; (d) Hybrid PVDG-WTDG case.
The optimal installation of the studied cases using the MPA technique had an obvious impact on seasonal active loss in every branch of test system EDNs as represented in the 3D graphics shown in Figure 11 and Figure 12.
It is proven that: the case of hybrid PVDG-WTDG units was the best choice that revealed a strong impact of minimization in every branch of the two test system EDNs throughout the year’s seasons and especially in the winter season, for the reason that the WTDG units provide huge and maximum generation of both reactive and active powers and also are compensated and have the PVDG units as a backup and an additional source of energy even if it is not the best season for the PVDG to generate its maximum output power, but it is considered an essential element that contributed to those best results. Figure 13 illustrates the seasonal total voltage deviation variation of both test system EDN represented in 96 h for all cases of optimal RDG presence. The results shown in Figure 13 confirm that the optimal presence of all the studied cases, based on using the MPA technique, excellently affected and minimized the total seasonal voltage deviation in both test system EDNs.
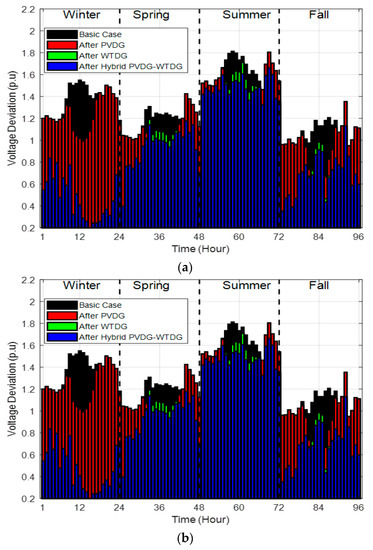
Figure 13.
The seasonal total voltage derivation variation: (a) IEEE 33-bus; (b) IEEE 69-bus.
The hybrid PVDG-WTDG units’ case was considered the best choice among the studied cases since it clearly guaranteed the minimum and best results of the seasonal voltage deviation, from a total value of 126.87 p.u. down to 97.43 p.u. with a minimization rate of 67.79% for the first test system EDN, and from a total value of 131.20 p.u. down to 93.71 p.u. with a minimization rate of 71.46% for the second test system EDN.
It was noticed that the best effect of that minimization was recorded in the winter season, while the worst impact and effect of the hybrid PVDG-WTDG units was recorded in the season of summer, for reasons that the WTDG units provided their minimum generation of active and reactive powers in that season, and even PVDG units provided maximum generation but could not keep up with the impact and the results that could be provided from WTDG units’ presence.
Figure 14 and Figure 15 depict the seasonal voltage profiles variation of the two test system EDNs represented in 96 h for all the studied cases of optimal RDG presence.
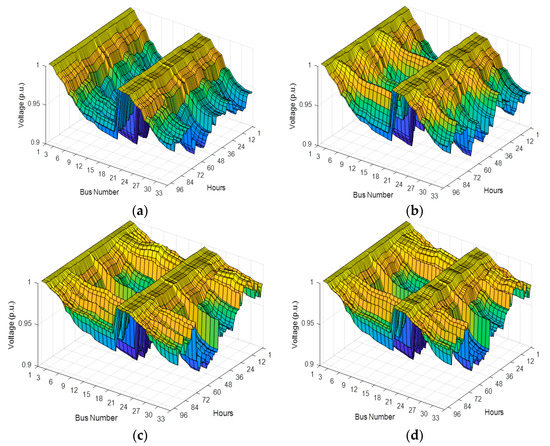
Figure 14.
Seasonal voltage profiles variation for the IEEE 33-bus: (a) Basic case; (b) PVDG case; (c) WTDG case; (d) Hybrid PVDG-WTDG case.
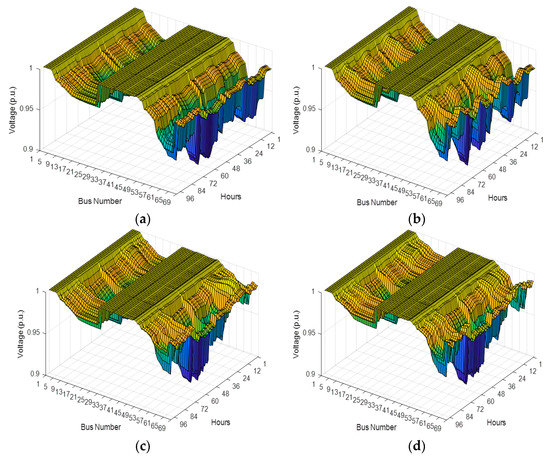
Figure 15.
Seasonal voltage profiles variation for the IEEE 69-bus: (a) Basic case; (b) PVDG case; (c) WTDG case; (d) Hybrid PVDG-WTDG case.
It was proven that the hybrid PVDG-WTDG units’ case was the best choice from among other cases. In addition, it provides a guarantee of the voltage profiles’ enhancement in each bus of both tests system EDNs throughout all the year’s seasons. Furthermore, the season of winter was the best season, in which the highest amelioration of voltage profiles was recorded, and because of the addition of the PVDG units, the WTDG units generated their maximum output represented in active and reactive powers if it was the windiest season of the year.
While the worst results were carried out in the case of only PVDG units, where some bettering in the voltage profiles is recorded, but with different levels in the case of simultaneous hybrid sources of PV and WT.
Figure 16 illustrates the seasonal variation of the relays’ operating time in both test system EDNs, represented in 96 h for all the studied cases of optimal RDG presence.
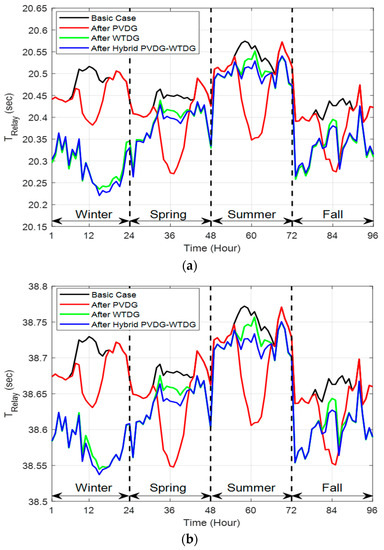
Figure 16.
The seasonal variation of the overcurrent relay’s total operation time: (a) IEEE 33-bus; (b) IEEE 69-bus.
The principal function of overcurrent relays is to sense, identify, and remove the fault current, which occurs in the lines for protecting the system’s targeted parts. Minimizing the operation time of the OCRs is very beneficial in many ways and includes aspects such as protecting the system, maintaining the service continuity, and avoiding any unfavorable interruptions, as well as extending the equipment lifetime.
The results based on the use of the MPA technique for the optimal presence of the studied cases of RDG units in both test system EDNs clearly minimized seasonal operating time of the overcurrent relays included in both EDNs.
The hybrid PVDG-WTDG case is obviously the superior and best case that achieved the lowest values of total operating time, where it was reduced from a total value of 1964.90 s until 1957.05 s for the first EDN with a minimization rate of 99.55% and from a total value of 3714.57 s until 3708.62 s with a minimization rate of 99.84% for the second EDN.
Furthermore, the huge effect of that minimization was recorded in the winter season as long in addition to the PVDG units, the WTDG units generated their maximum output powers; also, the minimization impact is directly related to the voltage profiles ameliorating, where the OCR’s operation time is proportionally related to the voltage profiles.
5. Conclusions
This paper has been devoted to applying a new metaheuristic optimization algorithm, which used the MPA to determine the optimal location and sizing of multiple renewable DGs based on PV and WT sources when taking into consideration the seasonal uncertainty of RDG output power and load demand variation. The optimization was implemented to improve the performances of distribution networks by minimizing several MOFs, which are the total of APLI, RPLI, VDI, OTI, and CTII. The study was performed with the test systems IEEE 33-bus and 69-bus EDNs.
The MPA showed good behavior and strong reliability in providing the best results for all the studied cases, even when compared to many other recent algorithms such as SMA and MFO. The results also revealed the efficiency of the optimal presence of RDGs units, which obviously guarantee huge achievements and improvements to the performances of both test system EDNs performances, with superiority for the hybrid PVDG-WTDG units’ case throughout all the year’s seasons.
The optimal installation of the hybrid PVDG-WTDG units made a significant improvement to the EDNs by leading to the minimization of the active and reactive losses down to 56.56% and 57.16%, respectively, for the first EDN, and also down to 56.09% and 57.74%, respectively, for the second EDN; enhanced the voltage profiles and obviously ameliorated the protection system against overcurrent, for the reason that it was capable of simultaneously delivering active and reactive powers all throughout the year’s seasons without any interruptions as long as one source compensated for the others’ absence or weakness. Other deduced conclusions achieved from the current study are as follows:
- -
- It is technically beneficial that hybrid PVDG-WTDG units would be applied on a practical distribution network in many aspects;
- -
- Using the multi-objectives functions considering various constraints is also recommended to meet and get close to the practical studies;
- -
- The optimization considering the seasonal variation of load-source powers takes the study toward reality and makes it more efficient.
Future work will focus on developing more complex MOF frameworks, which include various technical and economic issues. In addition, adding the trendy topic of load for charge stations for electric vehicles to extremely improve the performance of the electrical distribution networks.
Author Contributions
Conceptualization, N.B., M.Z. and S.S.; Methodology, M.Z.; Software, N.B. and S.S.; Validation, M.Z. and R.A.E.-S.; Visualization, S.S.; Formal analysis, R.A.E.-S.; Investigation, C.Z.E.-B. and R.A.E.-S.; Resources, N.B. and C.Z.E.-B.; Data curation, N.B. and M.Z.; Writing—original draft, N.B. and R.A.E.-S.; Writing—review & editing, M.Z. and R.A.E.-S.; Supervision, R.A.E.-S.; Project administration, M.Z.; Funding acquisition, M.Z. All authors have read and agreed to the published version of the manuscript.
Funding
This research received no external funding.
Data Availability Statement
No new data were created or analyzed in this study. Data sharing is not applicable to this article.
Conflicts of Interest
The authors declare no conflict of interest.
Nomenclature
| PVDG | Photovoltaic distributed generation |
| WTDG | Wind turbine distributed generation |
| RDG | Renewable distributed generation |
| EDN | Electrical distribution network |
| MPA | Marine predator algorithm |
| MOF | Multi-objective functions |
| APLI | Active power loss index |
| RPLI | Reactive power loss index |
| VDI | Voltage deviation index |
| OTI | Operating time index |
| CTII | Coordination time interval index |
| λ | Load demand’s parameter |
| Pk, Qk | Active and reactive powers injected at bus k |
| Qok, Pok | Reactive and active powers at bus k |
| Probability density function | |
| N | Modules’ number |
| Tcy, TA | Cell and ambient temperatures (°C) |
| NOT | Cell nominal operation temperature (°C) |
| FF | Fill factor |
| Voc | Open-circuit voltage (V) |
| Isc | Short-circuit current (A) |
| VMPP, IMPP | Maximum power point’s voltage and current |
| s | Solar irradiance’s random variable (kW/m2) |
| Kv, Ki | Current and voltage temperature coefficients (A/°C and V/°C) |
| fb (s) | Beta distribution function of s |
| s1, s2 | Solar irradiance limits of states |
| A, B | Parameters of fb (s) |
| μ, σ | Mean and standard deviation |
| PWT | WT generator output power |
| vci, vcr, vco | Cut-in speed, rated speed, and cut-off speed of the WT |
| v | Average wind speed in every period (hour) |
| Pij, Qij | Line’s active and reactive powers |
| Rij, Xij | Resistance and reactance of line |
| Vi, Vj | Voltage at bus i, and j |
| δi, δj | Angles at buses i, j |
| Nbus | Bus number |
| PRDGmin, PRDGmax | Active powers limits of RDG |
| QRDGmin, QRDGmax | Reactive powers limits of RDG |
| RDGPosition | RDG units’ position |
| NRDG | Number of RDG units |
| NRDG.max | Maximal number of RDG units |
| nRDG,i | Location of RDG units at bus i |
| Vbus | Bus voltage |
| Vmin, Vmax | Specified voltages limits |
| ΔV | Voltage drops |
| ΔVmax | Maximum voltage drops |
| Rij, Xij | Resistance and reactance of distribution line |
| Sij | Apparent power. |
| Smax | Maximum of apparent power of the distribution line |
| OTi | Operating time of primary relay |
| A, B | Constants equal to 0.14 and 0.02 |
| TDS | Time dial setting |
| IF, IP | Fault and pickup current |
| NPR, NBR | Number of primary and backup relays |
| PG, QG | Generator’s active and reactive powers |
| PRDG, QRDG | Active and reactive power from RDG |
| PD, QD | Active and reactive powers of demand load |
References
- Ehsan, A.; Yang, Q. Optimal Integration and Planning of Renewable Distributed Generation in the Power Distribution Networks: A Review of Analytical Techniques. Appl. Energy 2018, 210, 44–59. [Google Scholar] [CrossRef]
- Atwa, Y.M.; El-Saadany, E.F.; Salama, M.M.A.; Seethapathy, R. Optimal Renewable Resources Mix for Distribution System Energy Loss Minimization. IEEE Trans. Power Syst. 2009, 25, 360–370. [Google Scholar] [CrossRef]
- Theo, W.L.; Lim, J.S.; Ho, W.S.; Hashim, H.; Lee, C.T. Review of Distributed Generation (DG) System Planning and Optimisation Techniques: Comparison of Numerical and Mathematical Modelling Methods. Renew. Sustain. Energy Rev. 2017, 67, 531–573. [Google Scholar] [CrossRef]
- Ehsan, A.; Yang, Q. State-of-the-art Techniques for Modelling of Uncertainties in Active Distribution Network Planning: A Review. Appl. Energy 2019, 239, 1509–1523. [Google Scholar] [CrossRef]
- Yuan, Z.; Wang, W.; Wang, H.; Yildizbasi, A. A New Methodology for Optimal Location and Sizing of Battery Energy Storage System in Distribution Networks for Loss Reduction. J. Energy Storage 2020, 29, e101368. [Google Scholar] [CrossRef]
- Radosavljevic, J.; Arsic, N.; Milovanovic, M.; Ktena, A. Optimal Placement and Sizing of Renewable Distributed Generation Using Hybrid Metaheuristic Algorithm. J. Mod. Power Syst. Clean Energy 2020, 8, 499–510. [Google Scholar] [CrossRef]
- Parihar, S.S.; Malik, N. Optimal Allocation of Renewable DGs in a Radial Distribution System Based on New Voltage Stability Index. Int. Trans. Electr. Energy Syst. 2020, 30, e12295. [Google Scholar] [CrossRef]
- Kanwar, N.; Gupta, N.; Niazi, K.; Swarnkar, A. Optimal Distributed Resource Planning for Microgrids Under Uncertain Environment. IET Renew. Power Gener. 2017, 12, 244–251. [Google Scholar] [CrossRef]
- Samala, R.K.; Kotapuri, M.R. Optimal Allocation of Distributed Generations using Hybrid Technique with Fuzzy Logic Controller Radial Distribution System. SN Appl. Sci. 2020, 2, 191. [Google Scholar] [CrossRef]
- Sedghi, M.; Ahmadian, A.; Aliakbar-Golkar, M. Optimal Storage Planning in Active Distribution Network Considering Uncertainty of Wind Power Distributed Generation. IEEE Trans. Power Syst. 2015, 31, 304–316. [Google Scholar] [CrossRef]
- Ganguly, S.; Samajpati, D. Distributed Generation Allocation on Radial Distribution Networks Under Uncertainties of Load and Generation Using Genetic Algorithm. IEEE Trans. Sustain. Energy 2015, 6, 688–697. [Google Scholar] [CrossRef]
- Ullah, Z.; Elkadeem, M.; Wang, S.; Akber, S.M.A. Optimal Planning of RDS Considering PV Uncertainty with Different Load Models using Artificial Intelligence Techniques. Int. J. Web Grid Serv. 2020, 16, 63. [Google Scholar] [CrossRef]
- Evangelopoulos, V.A.; Georgilakis, P.S. Optimal Distributed Generation Placement Under Uncertainties Based on Point Estimate Method Embedded Genetic Algorithm. IET Gener. Transm. Distrib. 2014, 8, 389–400. [Google Scholar] [CrossRef]
- Biswas, P.P.; Suganthan, P.; Mallipeddi, R.; Amaratunga, G.A. Optimal Reactive Power Dispatch with Uncertainties in Load Demand and Renewable Energy Sources Adopting Scenario-based Approach. Appl. Soft Comput. 2018, 75, 616–632. [Google Scholar] [CrossRef]
- Saleh, A.; Senjyu, T.; Alkhalaf, S.; Alotaibi, M.; Hemeida, A. Water Cycle Algorithm for Probabilistic Planning of Renewable Energy Resource, Considering Different Load Models. Energies 2020, 13, 5800. [Google Scholar] [CrossRef]
- Ehsan, A.; Yang, Q.; Cheng, M. A Scenario-based Robust Investment Planning Model for Multi-type Distributed Generation Under Uncertainties. IET Gener. Transm. Distrib. 2018, 12, 4426–4434. [Google Scholar] [CrossRef]
- Poornazaryan, B.; Karimyan, P.; Gharehpetian, G.; Abedi, M. Optimal Allocation and Sizing of DG Units Considering Voltage Stability, Losses and Load Variations. Int. J. Electr. Power Energy Syst. 2016, 79, 42–52. [Google Scholar] [CrossRef]
- Ramadan, A.; Ebeed, M.; Kamel, S.; Nasrat, L. Optimal Allocation of Renewable Energy Resources Considering Uncertainty in Load Demand and Generation. In Proceedings of the Conference on Power Electronics and Renewable Energy (CPERE), Aswan, Egypt, 23–25 October 2019; pp. 124–128. [Google Scholar] [CrossRef]
- Bahrami, S.; Amini, M.H.; Shafie-Khah, M.; Catalao, J.P.S. A Decentralized Renewable Generation Management and Demand Response in Power Distribution Networks. IEEE Trans. Sustain. Energy 2018, 9, 1783–1797. [Google Scholar] [CrossRef]
- Rani, K.S.; Saw, B.K.; Achargee, P.; Bohre, A.K. Optimal Sizing and Placement of Renewable DGs using GOA Considering Seasonal Variation of Load and DGs. In Proceedings of the International Conference on Computational Intelligence for Smart Power System and Sustainable Energy (CISPSSE), Keonjhar, Odisha, India, 29–31 July 2020; pp. 1–6. [Google Scholar] [CrossRef]
- Esmaeili, M.; Sedighizadeh, M.; Esmaili, M. Multi-objective Optimal Reconfiguration and DG (Distributed Generation) Power Allocation in Distribution Networks using Big Bang-Big Crunch Algorithm Considering Load Uncertainty. Energy 2016, 103, 86–99. [Google Scholar] [CrossRef]
- Ben Hamida, I.; Salah, S.B.; Msahli, F.; Mimouni, M.F. Optimal Network Reconfiguration and Renewable DG Integration Considering Time Sequence Variation in Load and DGs. Renew. Energy 2018, 121, 66–80. [Google Scholar] [CrossRef]
- Barik, S.; Das, D. Determining the Sizes of Renewable DGs Considering Seasonal Variation of Generation and Load and their Impact on System Load Growth. IET Renew. Power Gener. 2018, 12, 1101–1110. [Google Scholar] [CrossRef]
- Srinivasan, T.; Wang, X.; Kim, H.-J.; Ra, I.-H. Performance Enhancement for Microgrids Under the Demand Uncertainties with the Presence of Multiple DGs Through Stochastic Ranking Algorithm. J. Electr. Eng. Technol. 2020, 16, 223–238. [Google Scholar] [CrossRef]
- Ramadan, A.; Ebeed, M.; Kamel, S.; Abdelaziz, A.; Alhelou, H.H. Scenario-Based Stochastic Framework for Optimal Planning of Distribution Systems Including Renewable-Based DG Units. Sustainability 2021, 13, 3566. [Google Scholar] [CrossRef]
- Salkuti, S.R.; Sandeep, V.; Babu, B.C.; Jung, C.-M. Multi-Objective based Optimal Generation Scheduling Considering Wind and Solar Energy Systems. Int. J. Emerg. Electr. Power Syst. 2018, 19, 20. [Google Scholar] [CrossRef]
- Dehghani, M.; Montazeri, Z.; Malik, O.P. Optimal Sizing and Placement of Capacitor Banks and Distributed Generation in Distribution Systems Using Spring Search Algorithm. Int. J. Emerg. Electr. Power Syst. 2020, 21, 20190217. [Google Scholar] [CrossRef]
- Zellagui, M.; Belbachir, N.; El-Bayeh, C.Z. Optimal Allocation of RDG in Distribution System Considering the Seasonal Uncertainties of Load Demand and Solar-Wind Generation Systems. In Proceedings of the 19th International Conference on Smart Technologies (EUROCON), Lviv, Ukraine, 6–8 July 2021; pp. 471–477. [Google Scholar] [CrossRef]
- Raj, V.; Kumar, B.K. An Improved Affine Arithmetic-Based Optimal DG Sizing and Placement Algorithm Using PSO for Radial Distribution Networks with Uncertainty. In Proceedings of the 21st National Power Systems Conference (NPSC), Gandhinagar, India, 17–19 December 2020; pp. 1–6. [Google Scholar] [CrossRef]
- Elkadeem, M.R.; Elaziz, M.A.; Ullah, Z.; Wang, S.; Sharshir, S.W. Optimal Planning of Renewable Energy-Integrated Distribution System Considering Uncertainties. IEEE Access 2019, 7, 164887–164907. [Google Scholar] [CrossRef]
- Abid, S.; Apon, H.J.; Morshed, K.A.; Ahmed, A. Optimal Planning of Multiple Renewable Energy-Integrated Distribution System with Uncertainties Using Artificial Hummingbird Algorithm. IEEE Access 2022, 10, 40716–40730. [Google Scholar] [CrossRef]
- Faramarzi, A.; Heidarinejad, M.; Mirjalili, S.; Gandomi, A.H. Marine Predators Algorithm: A Nature-inspired Metaheuristic. Expert Syst. Appl. 2020, 152, 113377. [Google Scholar] [CrossRef]
- Shaheen, A.M.; Elsayed, A.M.; Ginidi, A.R.; El-Sehiemy, R.A.; Alharthi, M.M.; Ghoneim, S.S. A Novel Improved Marine Predators Algorithm for Combined Heat and Power Economic Dispatch Problem. Alex. Eng. J. 2021, 61, 1834–1851. [Google Scholar] [CrossRef]
- Khunkitti, S.; Siritaratiwat, A.; Premrudeepreechacharn, S. A Many-Objective Marine Predators Algorithm for Solving Many-Objective Optimal Power Flow Problem. Appl. Sci. 2022, 12, 11829. [Google Scholar] [CrossRef]
- Ebeed, M.; Alhejji, A.; Kamel, S.; Jurado, F. Solving the Optimal Reactive Power Dispatch Using Marine Predators Algorithm Considering the Uncertainties in Load and Wind-Solar Generation Systems. Energies 2020, 13, 4316. [Google Scholar] [CrossRef]
- Shaheen, A.M.; Elsayed, A.M.; El-Sehiemy, R.A.; Kamel, S.; Ghoneim, S.S.M. A Modified Marine Predators Optimization Algorithm for Simultaneous Network Reconfiguration and Distributed Generator Allocation in Distribution Systems Under Different Loading Conditions. Eng. Optim. 2021, 54, 687–708. [Google Scholar] [CrossRef]
- Shaheen, A.; Elsayed, A.; Ginidi, A.; El-Sehiemy, R.; Elattar, E. A Heap-Based Algorithm with Deeper Exploitative Feature for Optimal Allocations of Distributed Generations with Feeder Reconfiguration In Power Distribution Networks. Knowl.-Based Syst. 2022, 241, 108269. [Google Scholar] [CrossRef]
- Padhy, S.; Sahu, P.R.; Panda, S.; Padmanaban, S.; Guerrero, J.M.; Khan, B. Marine Predator Algorithm based PD-(1+PI) Controller for Frequency Regulation in Multi-microgrid System. IET Renew. Power Gener. 2022, 16, 2136–2151. [Google Scholar] [CrossRef]
- Yakout, A.; Sabry, W.; Hasanien, H.M. Enhancing Rotor Angle Stability of Power Systems using Marine Predator Algorithm based Cascaded PID Control. Ain Shams Eng. J. 2021, 12, 1849–1857. [Google Scholar] [CrossRef]
- Bayoumi, A.S.A.; El-Sehiemy, R.A.; Abaza, A. Effective PV Parameter Estimation Algorithm Based on Marine Predators Optimizer Considering Normal and Low Radiation Operating Conditions. Arab. J. Sci. Eng. 2021, 47, 3089–3104. [Google Scholar] [CrossRef]
- Mirjalili, S.; Lewis, A. The Whale Optimization Algorithm. Adv. Eng. Softw. 2016, 95, 51–67. [Google Scholar] [CrossRef]
- Kennedy, J.; Eberhart, R. Particle swarm optimization. In Proceedings of the International Conference on Neural Networks (ICNN), Perth, WA, Australia, 27 November–1 December 1995; Volume 4, pp. 1942–1948. [Google Scholar] [CrossRef]
- Mirjalili, S. Moth-flame optimization algorithm: A Novel Nature-inspired Heuristic Paradigm. Knowl. Based Syst. 2015, 89, 228–249. [Google Scholar] [CrossRef]
- Li, S.; Chen, H.; Wang, M.; Heidari, A.A.; Mirjalili, S. Slime Mould Algorithm: A New Method for Stochastic Optimization. Future Gener. Comput. Syst. 2020, 111, 300–323. [Google Scholar] [CrossRef]
- Maleki, A.; Khajeh, M.G.; Ameri, M. Optimal Sizing of A Grid Independent Hybrid Renewable Energy System Incorporating Resource Uncertainty, and Load Uncertainty. Int. J. Electr. Power Energy Syst. 2016, 83, 514–524. [Google Scholar] [CrossRef]
- Maya, K.N.; Jasmin, E.A. Optimal Integration of Distributed Generation (DG) Resources in Unbalanced Distribution System Considering Uncertainty Modelling. Int. Trans. Electr. Energy Syst. 2016, 27, e2248. [Google Scholar] [CrossRef]
- Hung, D.Q.; Mithulananthan, N.; Lee, K.Y. Determining PV Penetration for Distribution Systems with Time-Varying Load Models. IEEE Trans. Power Syst. 2014, 29, 3048–3057. [Google Scholar] [CrossRef]
- Khatod, D.K.; Pant, V.; Sharma, J. Evolutionary Programming based Optimal Placement of Renewable Distributed Generators. IEEE Trans. Power Syst. 2012, 28, 683–695. [Google Scholar] [CrossRef]
- Soroudi, A.; Aien, M.; Ehsan, M. A Probabilistic Modeling of Photo Voltaic Modules and Wind Power Generation Impact on Distribution Networks. IEEE Syst. J. 2011, 6, 254–259. [Google Scholar] [CrossRef]
- Kianmehr, E.; Nikkhah, S.; Rabiee, A. Multi-objective Stochastic Model for Joint Optimal Allocation of DG units and Network Reconfiguration from DG owner’s and DisCo’s perspectives. Renew. Energy 2018, 132, 471–485. [Google Scholar] [CrossRef]
- Shin, J.; Lee, J.H.; Realff, M.J. Operational Planning and Optimal Sizing of Microgrid Considering Multi-Scale Wind Uncertainty. Appl. Energy 2017, 195, 616–633. [Google Scholar] [CrossRef]
- Belbachir, N.; Zellagui, M.; Lasmari, A.; El-Bayeh, C.Z.; Bekkouche, B. Optimal PV Sources Integration in Distribution System and Its Impacts on Overcurrent Relay Based Time-Current-Voltage Tripping Characteristic. In Proceedings of the 12th International Symposium on Advanced Topics in Electrical Engineering (ATEE), Bucharest, Romania, 25–27 March 2021. [Google Scholar] [CrossRef]
- Belbachir, N.; Zellagui, M.; Settoul, S.; El-Bayeh, C.Z.; Bekkouche, B. Simultaneous Optimal Integration of Photovoltaic Distributed Generation and Battery Energy Storage System in Active Distribution Network using Chaotic Grey Wolf Optimization. Electr. Eng. Electromechanics 2021, 3, 52–61. [Google Scholar] [CrossRef]
- Onlam, A.; Yodphet, D.; Chatthaworn, R.; Surawanitkun, C.; Siritaratiwat, A.; Khunkitti, P. Power Loss Minimization and Voltage Stability Improvement in Electrical Distribution System via Network Reconfiguration and Distributed Generation Placement Using Novel Adaptive Shuffled Frogs Leaping Algorithm. Energies 2019, 12, 553. [Google Scholar] [CrossRef]
- Zellagui, M.; Lasmari, A.; Settoul, S.; El-Bayeh, C.Z.; Chenni, R.; Belbachir, N. Arithmetic Optimization Algorithm for Optimal Installation of DSTATCOM into Distribution System based on Various Voltage Stability Indices. In Proceedings of the 9th International Conference on Modern Power Systems (MPS), Cluj, Romania, 16–17 June 2021. [Google Scholar] [CrossRef]
- Belbachir, N.; Zellagui, M.; Bekkouche, B. Optimal Location and Sizing of Multiple Distributed Generators in Radial Distribution Network using Metaheuristic Optimization Algorithms. Facta Univ. Ser. Electron. Energetics 2022, 35, 229–242. [Google Scholar] [CrossRef]
- Reddy, P.; Reddy, V.V.; Manohar, T.G. Ant Lion Optimization Algorithm for Optimal Sizing of Renewable Energy Resources for Loss Reduction in Distribution Systems. J. Electr. Syst. Inf. Technol. 2018, 5, 663–680. [Google Scholar] [CrossRef]
- Zellagui, M.; Belbachir, N.; Lasmari, A.; Bekkouche, B.; El-Bayeh, C.Z. Application Hybrid Chaotic Maps and Adaptive Acceleration Coefficients PSO Algorithm for Optimal Integration Photovoltaic Distributed Generation Problem in Distribution Energy Network. In Control Applications in Modern Power Systems; Springer: Berlin/Heidelberg, Germany, 2022; pp. 27–39. [Google Scholar] [CrossRef]
Disclaimer/Publisher’s Note: The statements, opinions and data contained in all publications are solely those of the individual author(s) and contributor(s) and not of MDPI and/or the editor(s). MDPI and/or the editor(s) disclaim responsibility for any injury to people or property resulting from any ideas, methods, instructions or products referred to in the content. |
© 2023 by the authors. Licensee MDPI, Basel, Switzerland. This article is an open access article distributed under the terms and conditions of the Creative Commons Attribution (CC BY) license (https://creativecommons.org/licenses/by/4.0/).