Abstract
Hydrogen is regarded as a flexible energy carrier with multiple applications across several sectors. For instance, it can be used in industrial processes, transports, heating, and electrical power generation. Green hydrogen, produced from renewable sources, can have a crucial role in the pathway towards global decarbonization. However, the success of green hydrogen production ultimately depends on its economic sustainability. In this context, this work evaluates the economic performance of a hydrogen power plant participating in the electricity market and supplying multiple hydrogen consumers. The analysis includes technical and economical details of the main components of the hydrogen power plant. Its operation is simulated using six different scenarios, which admit the production of either grey or green hydrogen. The scenarios used for the analysis include data from the Iberian electricity market for the Portuguese hub. An important conclusion is that the combination of multiple services in a hydrogen power plant has a positive effect on its economic performance. However, as of today, consumers who would wish to acquire green hydrogen would have to be willing to pay higher prices to compensate for the shorter periods of operation of hydrogen power plants and for their intrinsic losses. Nonetheless, an increase in green hydrogen demand based on a greater environmental awareness can lead to the need to not only build more of these facilities, but also to integrate more services into them. This could promote the investment in hydrogen-related technologies and result in changes in capital and operating costs of key components of these plants, which are necessary to bring down production costs.
1. Introduction
1.1. Motivation and Background
The production and consumption of green hydrogen () are expected to contribute to the decarbonization of multiple sectors and, as such, it is part of the European Commission’s pathway to a more sustainable and self-reliant Europe [1].
Portugal, as a member state of the European Union, presented its National Strategy for Hydrogen (EN-) in 2020, which intends to promote the gradual introduction of in multiple sectors of the economy and is regarded as a strategic opportunity for the country to diversify and increase its security of energy supply [2]. Among the goals set in EN- through 2030 is the creation of 50 to 100 hydrogen refueling stations (HRS) in the national territory, reaching 2 GW to 2.5 GW of installed capacity in electrolysers and achieving an admixture of 10% to 15% of to natural gas (NG) in the NG network by volume [3]. This roadmap is in line with pursued environmental goals and decarbonization strategy, which also assumes the decommissioning of several thermal power plants in Portugal and Spain [4].
Currently, one of the main challenges faced by green hydrogen is its high production cost, making it noncompetitive with produced from fossil fuels, commercialized at around 1.5 EUR/kg, even if highly dependent on the price of NG. At the same time, the costs of grey with carbon capture and storage (CCS), less polluting, are around 2 EUR/kg [1]. However, due to technological development and a continuous decrease in the cost of renewable energy sources (RES), the price of green is expected to keep dropping and reach cost parity with grey within the next decade [5].
In this context, the penetration of hydrogen power plants (PP) in the energy system capable of producing green hydrogen is expected to grow in the coming years [6]. They may be able to participate in multi-energy services, for instance, in selling green to different industries and customers. In addition, they might be able to participate in the energy and ancillary services markets, when required by the network operator or profitable. Therefore, techno and economic analysis for the strategic participation of PP in the electricity market must be pursued.
1.2. Literature Review
Numerous studies and initiatives are being conducted to assess the technical and economic viability of hydrogen-based solutions.
The authors in [7] studied the cost of production and its impact on the Iberian electricity market (MIBEL). Different scenarios, based on the Portuguese and Spanish energy and climate plans, were assessed. The CEVESA simulator was used, analysing pessimistic and optimistic scenarios under the MIBEL. It was concluded that production can contribute to reducing spillages by raising demand in periods of higher non-dispatchable generation.
Alternatively, the authors in [8] performed multiple Monte Carlo simulations to estimate the costs of producing green in Poland as part of the Polish Hydrogen Strategy. Using large-scale production systems powered by onshore wind turbines and solar photovoltaic (PV) panels, current production costs were estimated to be between 6.37 EUR/kg and 13.48 EUR/kg. production costs for the next 30 years were also projected, resulting in estimated costs for 2030 between 2.33 EUR/kg and 4.30 EUR/kg, and between 1.23 EUR/kg and 2.03 EUR/kg for 2050.
In Mexico, the viability of a power-to-gas-to-power solution in a rural microgrid to replace diesel generators was examined [9]. The system was modelled using the Homer software, aiming to analyse the hydrogen storage strategy on a seasonal basis. More precisely, the strategy was to produce through an electrolyser from excess distributed energy resources (DER) during winter months, supplying it back to the grid via a fuel cell when the demand grows in summer. For the economic sensitivity analysis, multiple capital expenditure (CAPEX) and operational expenditure (OPEX) values were considered for the electrolyser, storage tank, and fuel cell. However, the use of for end uses other than electricity generation was not considered.
In Slovenia, the possibility of producing green in a hydropower station was studied, comparing its price with that of other sources of production [10], adding the possibility for the PP to provide ancillary services, which leads to a higher profit. In addition, the competitiveness of green hydrogen within different sectors (industry, heat generation, transport, and mobility) was also analysed.
The authors in [11] focused on the assessment of an PP with multiple clients. The electrolyser was powered by a wind farm and/or a PV power plant, supplying a stationary fuel cell, an HRS for fuel cell electric vehicles (FCEV), a biological hydrogen methanation (BHM) process, and the injection in the natural gas grid. It was assumed that the owner of the HRS oversees the compression system needed to supply the station and, as such, it was not included in the analysis. The influence of the energy source (a wind farm or PV plant) was examined, and it was concluded that the replacement of the wind farm by the PV plant leads to a reduction in production and a reduction in the surplus. Moreover, the economic feasibility was analysed through the levelized cost of hydrogen (LCOH). Before the inclusion of the BHM process, an LCOH lower than 7 EUR/kg was accomplished, and, with the introduction of the BHM, the LCOH was reduced to 5 EUR/kg. Subsequently, the LCOH was assessed in [12] for a decentralized HRS, used by forklifts, with on-site production. A sensitivity analysis of several aspects, such as electricity costs, investment expenses, and electrolyser’s stack replacement costs, was conducted. The main results pointed out that an LCOH of 10.3 EUR/kg can be accomplished over a 20 year lifetime. It was added that, if capital costs were reduced by 80%, the LCOH would drop to 6.7 EUR/kg.
A techno-economic analysis of green production across multiple Italian regions was performed in [13]. The electrolysers were powered by electricity bought from the grid or by RES (wind, solar, and geothermal) through a power purchase agreement (PPA), with a price ranging from 50 EUR/MWh to 100 EUR/MWh. The produced was used in the mobility sector or injected into the natural gas grid. It was concluded that, depending on electricity prices, the LCOH would range from 6.90 EUR/kg to 9.85 EUR/kg.
In northern Denmark, there is an PP project that exploits wind power surpluses to produce and balance grid demand [14]. The produced is supplied to a nearby industrial complex by pipeline or, alternatively, it is delivered by tube trailers to other industries and for clean transportation.
Finally, in [15], a multi-state model for electrolysers was presented that considers three states of operation (production, hot standby, and idle) instead of just two (production and idle). The produced supplies an HRS, which includes a compression stage and a dispenser. The multi-state model was tested with data from an existing installation, being compared with the two states model. The assessed scenarios considered different demands, multiple prices, different wholesale market electricity prices, and distinct efficiencies for the electrolyser. The results show that the multi-state model leads to a reduction in production costs.
One of the common conclusions derived from these studies is that a reduction in the components’ cost is still necessary for these plants to be competitive [12]. Table 1 presents an overview and comparison of the main characteristics and services provided by different PP studies in the literature. It is noteworthy that most studies focus on providing a single service for the produced, which significantly constrains the flexibility of this energy vector in multi-energy systems.
Table 1.
Summary of the services found in the literature review and in the present paper.
1.3. Main Contributions
The present work studies the economic feasibility of a megawatt-scale PP participating in the MIBEL and supplying different customers, combining the main services described in the literature review. To the best of our knowledge, the present work is one of the most complete works regarding the multi-service criteria for the operation of an PP. To provide meaningful analysis, the economic operation of the PP is simulated across multiple scenarios, considering the actual and futuristic (green) generation conditions of the power system. Furthermore, factors such as maintenance and operating costs, depreciation rate, and corporate taxes are included in the calculation of the financial indicators used. It was also assumed that the construction of the facility is financed by a loan with a certain interest rate. The main contributions of this paper are threefold:
- Propose a mathematical energy model for an PP, including all the main components;
- Simulate the participation of an PP in the Iberian electricity market—Portuguese pole—under different scenarios while selling to multiple customers;
- Analyse the economic viability of an investment in an PP and the achieved prices in different scenarios.
1.4. Paper Organization
In addition to this introductory section, the paper is structured as follows. The PP framework for multi-service provision is presented in Section 2, and its operating model is mathematically formulated in Section 3. Constraints related to customer demand are also included in the model. Next, in Section 4, the main technical characteristics of the plant are described, the customers are detailed, the simulation scenarios are presented, and the economic analysis for each case is performed. Finally, Section 5 assembles the main conclusions drawn from this work.
2. Hydrogen Power Plant Framework
2.1. Design of a Hydrogen Power Plant
Typically, an PP is composed of several components, such as: (i) the electrolyser to extract from water, (ii) storage tanks to store the produced hydrogen, and (iii) stationary fuel cells to generate electricity from . In addition to being used to produce electricity, hydrogen has other uses. For instance, it can be (i) mixed and burned with natural gas to decrease emissions, (ii) consumed by vehicles ( cars, buses, forklifts, etc.), or (iii) used in industrial processes [16].
In this perspective, the PP envisioned for this study is equipped with an electrolyser, a storage tank, a fuel cell, and two different compressors, needed to supply specific customers, as depicted in Figure 1.
Figure 1.
Diagram of a hydrogen power plant and its related provided services.
The expected customers are a nearby facility using a combined heat and power (CHP) microturbine fed with a mix of and natural gas, an HRS used by a forklift fleet, and a tube trailer that transports hydrogen to a customer farther away. The to be supplied to the forklift fleet and to the tube trailer is compressed using the two available compressors.
2.2. Operation and Management Modelling
The operation and management of the PP consist of a day-ahead dispatch for assessing when the PP is producing, storing, and selling to the different customers, according to the prices they are willing to pay for the different services. In this scope, the proposed PP operation and management model, as well as the economic analysis, consists of three main steps, represented in Figure 2.
Figure 2.
Overview of the PP’s technical and economic analysis.
First, it starts by gathering the prices of the energy market and information related to renewable and non-renewable generation for each hour of the day, while the technical details of the PP and the demand of its customers are also specified. Next, in the second step, the day-ahead optimization problem is solved, yielding the results regarding the energy consumed, stored, and produced by the PP, the amount of sold to the customers, and the expected revenue for each day. In this step, the goal is to maximize the profit of the PP, as described in Section 3. Finally, in the last step, the economic analysis is performed for the expected lifetime of the PP, with several financial metrics being computed. An economic analysis is performed to assess the economic viability of the PP.
3. Mathematical Formulation
The optimization model proposed aims to emulate the strategic operation of an PP considering its participation in multi-services on a day-ahead basis. The problem aims to maximize the profit of the PP operator under strategic participation in different services.
The PP operation problem is modelled as a mixed-integer linear programming optimization problem. Objective function (1) includes:
where, for each interval , is the electricity consumed by the electrolyser and is the price at which the PP buys electricity from the market, is the electricity produced by the fuel cell and is the price at which it sells electricity to the market, is the mass of consumed by the CHP and is the price it pays per unit of to the PP operator. In addition, is the mass of sold to the forklift fleet and is the price the fleet pays per unit of ; is the mass of loaded into the tube trailer in each period and is the price the trailer operator pays per unit of ; is the electricity consumed by the forklift fleet compressor and is the electricity consumed by the trailer compressor; is the amount of in the tank above a pre-determined set point at the last interval and is the penalty factor for being above the set point; and is the amount of in the tank below the same set point at the last interval and is the penalty factor by being below it.
The produced by the electrolyser in each period [17], in kilograms, is given by (2):
where is the electricity it consumes, is its efficiency, and is the higher heating value (HHV) of (39.4 kWh/kg [18]). The electrolyser has to operate between a minimum and maximum power, defined by:
where and are the minimum and maximum power and is a binary variable that indicates whether it is turned on or off (on: =1, off: =0).
The consumed by the fuel cell, in kilograms, is given by [17]:
where is the fuel cell efficiency. Similarly to the electrolyser, the fuel cell also has to operate between a minimum and maximum power:
where and are the minimum and maximum power and is a binary variable that indicates whether the device is turned on or off. Equation (8) ensures the electrolyser and fuel cell are not turned on simultaneously:
Regarding the customers of the PP, for each period, the CHP microturbine has a certain maximum demand, meaning it can be supplied with a mass between 0 and an upper limit:
where is the maximum required by the CHP. Likewise, the forklift fleet also has a certain maximum demand for each period t:
where is the maximum required by the fleet.
Regarding the corresponding compressor, (11) specifies the amount of energy consumed by the device in each interval, and (12) restricts the gas flow rate:
where is the energy consumed by this compressor for each unit of mass of and is its maximum compression rate.
The process of supplying to the tube trailer follows additional constraints. This happens because this trailer must either be completely filled or not filled at all. In addition, the filling procedure must take place in consecutive hours. Equation (13) is the trailer’s balance equation, which ensures whether the trailer is filled up to its maximum capacity.
where is a binary variable indicating whether is loaded to the tube trailer in that period or not, is the total capacity of the trailer, and is a binary variable indicating whether it is to be completely refilled or not at all.
Equation (14) ensures the trailer refilling process does not exceed the acceptable time.
where is the acceptable refilling time. Equations (15) and (16), adapted from [19], assure the refilling process is done across consecutive periods.
Again, the compressor is modelled by two expressions given by
where is the energy consumed by this compressor for each unit of mass of and is its maximum compression rate.
For each period of time, the mass inside the PP storage tank is given by
where is the mass in the tank at the end of the interval t and is the mass in the tank at the end of the previous interval.
In order to avoid an irrational depletion of the stored at the last period of each day (t = 24), another constraint is added:
where is a predefined set point and and are non-negative variables that represent, respectively, the amount of in the tank above and below that set point. The penalty factors and noted in (1) are calculated according to
where is the average of on that day and is the expected average of for the next day. Hence, the penalty factors are defined as the difference between today’s and tomorrow’s price of the electricity consumed by the electrolyser. Combined with these factors, constraint (20) acts upon the optimization process, ensuring the tank is either above the set point if the price of the electricity will rise the next day or below the set point if the price of electricity will drop. Note that the daily revenue is determined post-optimization using the objective function without penalties.
4. Case Study
This section presents a case study illustrating the application of the developed model for the multi-service participation of an PP. The simulations were carried out with the programming environment MATLAB [20] and with the mathematical modelling system GAMS [21]. MATLAB was used as an interface for handling data with GAMS, while GAMS performed and solved the mixed integer non-linear programming model using the DICOPT (DIscrete and Continuous OPTimizer) solver [22].
4.1. Case Characterization
The PP has a 1.5 MW electrolyser, a 65 m3 tank, a 240 kW fuel cell, and two compressors. Their main technical and economic details are provided in Table 2 and Table 3, respectively.
Table 2.
Technical characteristics of the PP equipment.
Table 3.
Economic characteristics of the PP equipment.
This PP is expected to be built over 2 years [29] and operate for 20 years, as in [11]. In addition, it is assumed that 80% of the initial necessary capital is borrowed. Investment details used in the economic analysis are provided in Table 4.
Because the project has a time horizon of 22 years, a payback period of 13 years is expected in the economic analysis, a value that is cited in other works involving hydrogen production and RES [30,31].
Table 4.
Parameters used in the economic analysis.
Table 4.
Parameters used in the economic analysis.
| Parameter | Value |
|---|---|
| Project lifetime | 22 years |
| Plant lifetime | 20 years |
| Construction time | 2 years [29] |
| Inflation | 2% [32] |
| Depreciation rate | 5% [29] |
| Discount rate | 10% [33] |
| Corporate income tax | 21% [34] |
| Own capital | 20% |
| Borrowed capital | 80% |
| Interest rate | 2% [35] |
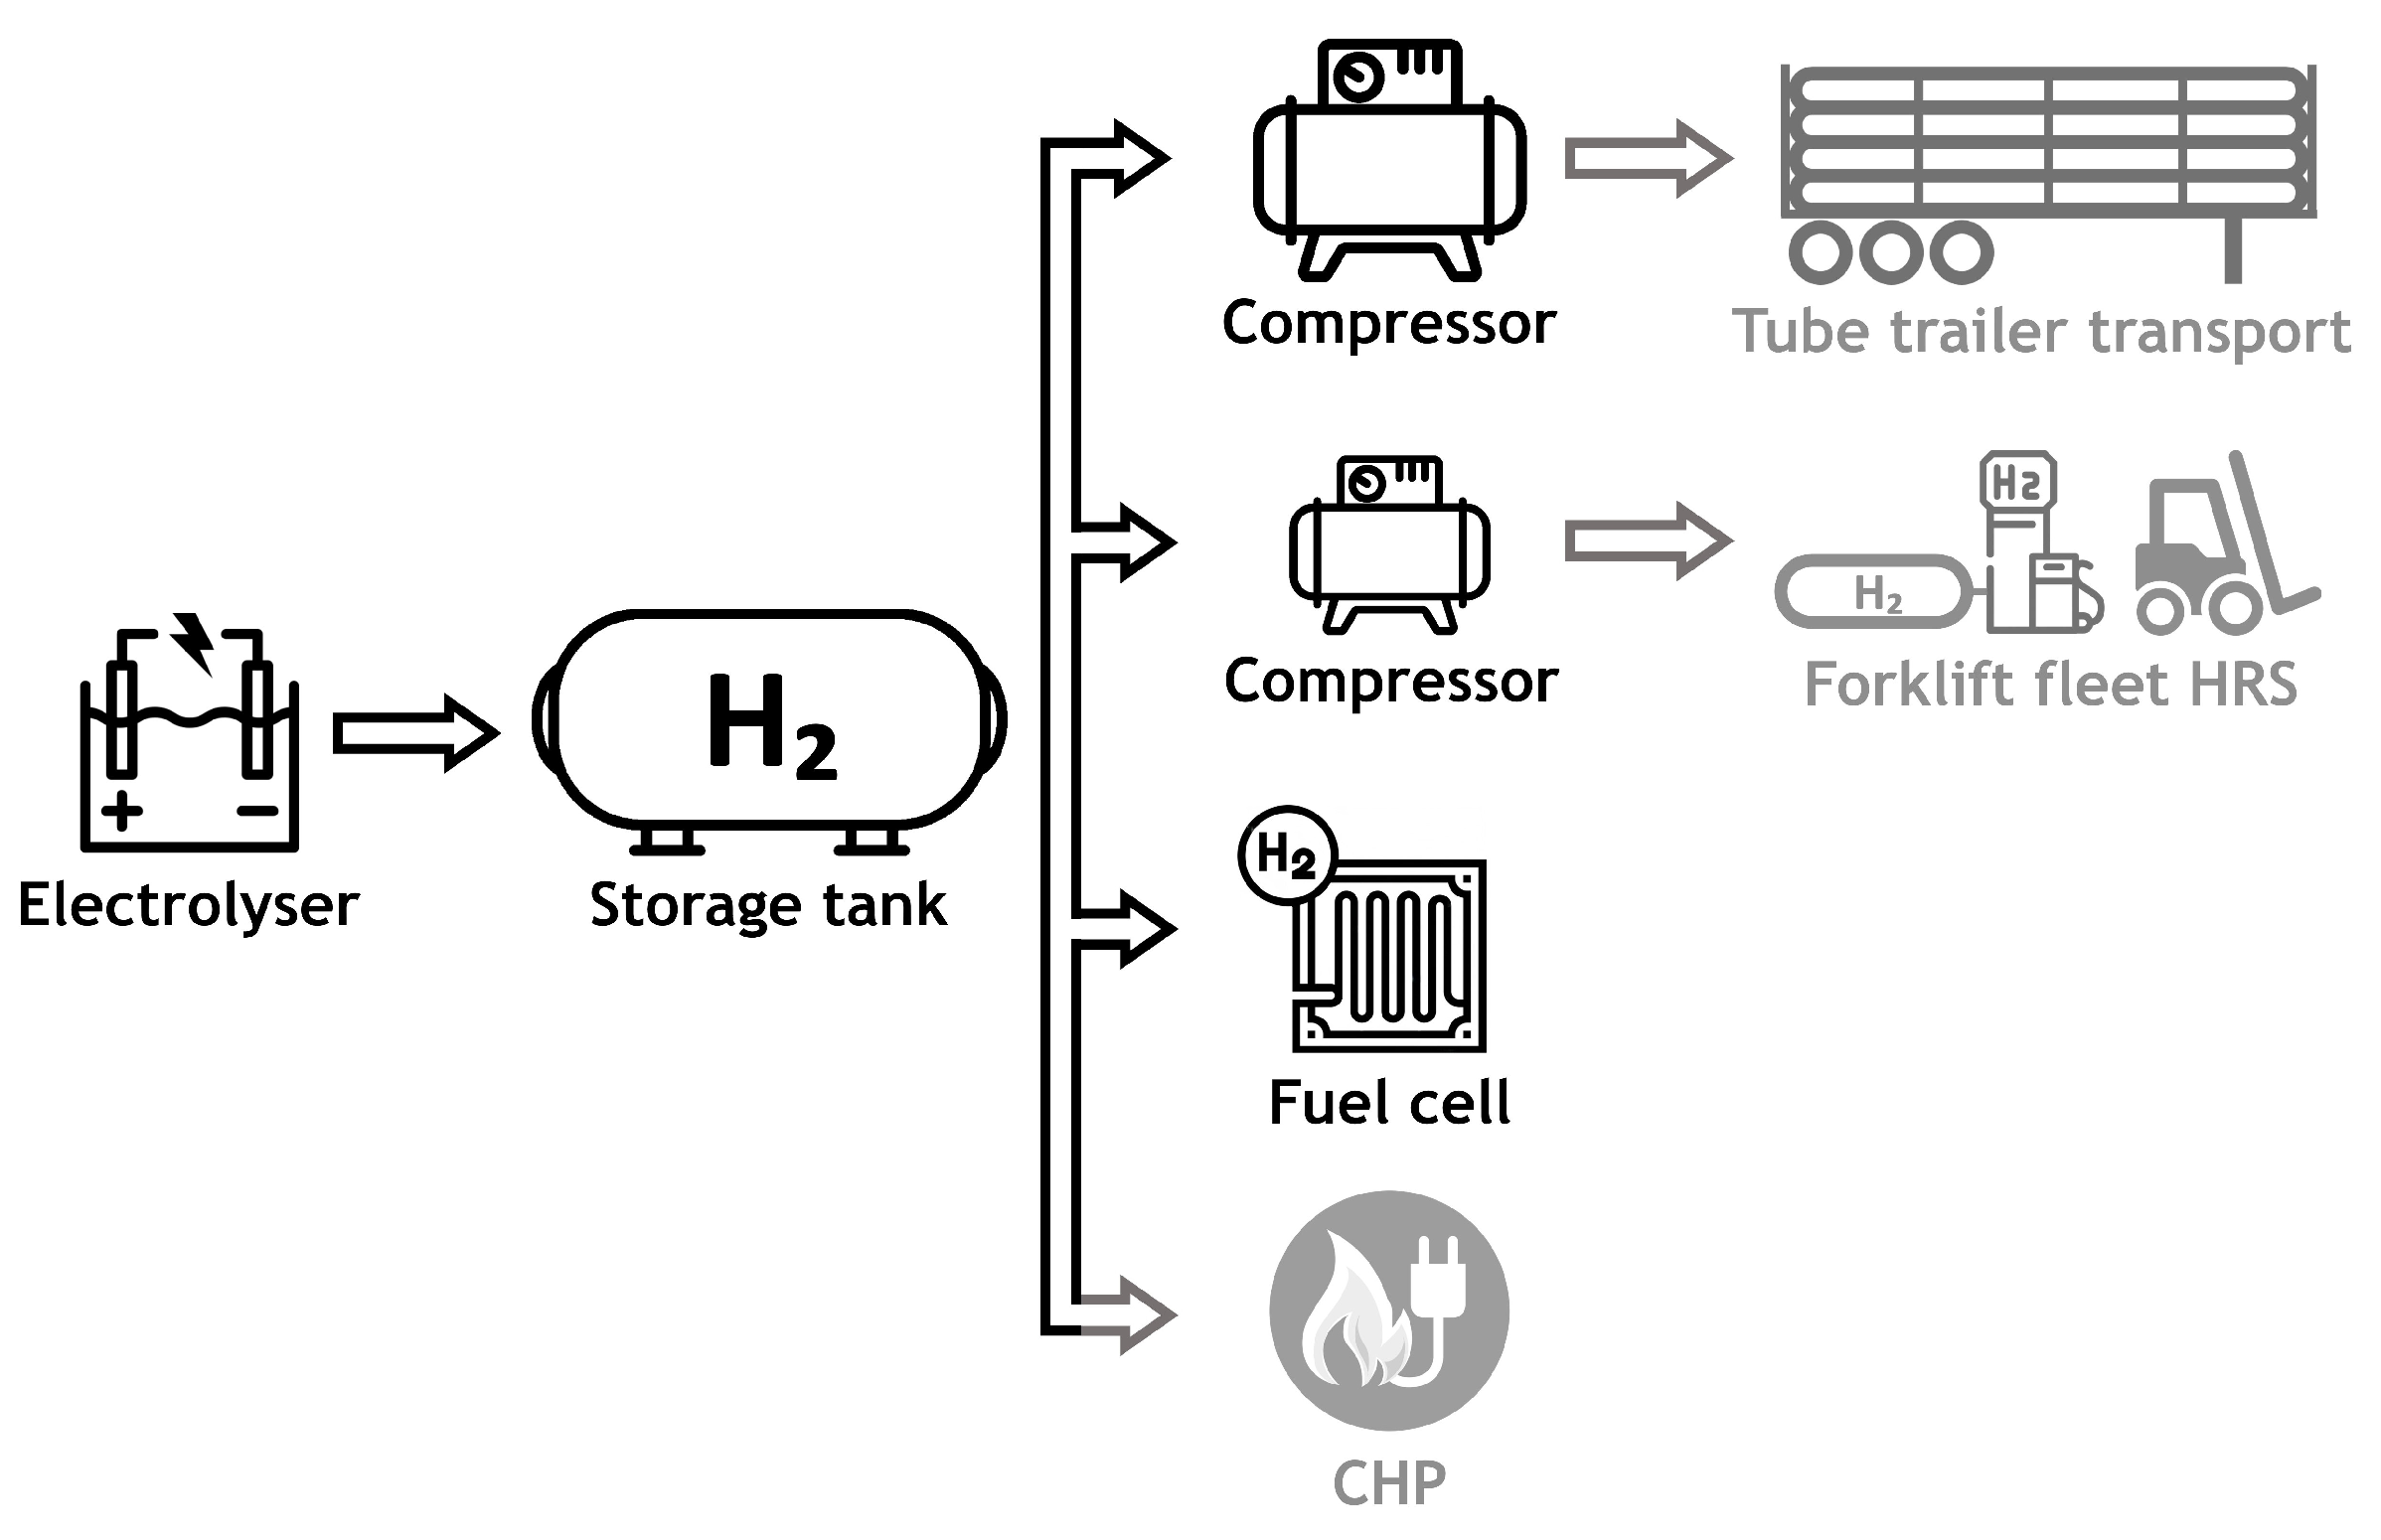
Regarding the different services/customers that the PP can provide, the following are detailed. The first customer has a 600 kW CHP microturbine, based on the one presented in [36]. This equipment, usually powered by natural gas, can operate on an /NG mix, with a total volume of up to 10%. Its load curve (based on [37]) and maximum and natural gas demand are given in Table 5.
Table 5.
CHP hourly electrical output and fuel intake for a volumetric percentage of 10%.
The second customer owns a fleet of hydrogen-powered forklifts that operates in a large logistics centre. The is supplied to their refueling station using a pipeline and a 30/500 bar compressor. In this case, their maximum demand is 5 kg/h (120 kg/day), enough to power around 120 of these vehicles for a full working day [23].
Finally, the third customer is a distribution company, responsible for shipping fuel between producers and end users. Among other vehicles, this company operates a hydrogen tube trailer. It is assumed that the customer intends to buy 300 kg of each day to fill a 200 bar tube trailer, to be loaded in 6 h [38], meaning the compressor must have a flow rate of at least 50 kg/h.
The price at which is sold to these customers shall cover, at least, energy expenses related to production and compression. In this way, the minimum prices for each customer are given by
where is the average price of electricity. However, to cover other expenses (cost of equipment, maintenance, depreciation, loan interest, etc.) and make the plant profitable, the prices obtained using (22)–(24) must be further increased, as shown below.
In this analysis, in each period, the fuel cell is set to sell energy to the grid at a price equal to MIBEL’s price for the same hour, meaning that = .
For the economic analysis, the operation of the PP is simulated using six different scenarios: Grey17–20, Green17–20, PPA17–20, Grey21, Green21, and PPA21. When the designation Grey is used, it is accepted to have the production of grey . In the Green scenarios, the electrolyser can only be turned on when no fossil-fuel power plants are producing energy in the Portuguese system. Furthermore, for these scenarios, the PP buys electricity from the Iberian energy market (MIBEL), paying the corresponding hourly market clearing price. Note that it is assumed that the PP follows a price-taker behaviour. The PPA scenarios assume the power plant obtains its energy from a large wind farm, with which it signed a long-term PPA for a price of 86 EUR/MWh. As only wind energy is used, exclusively green is produced.
The scenarios are also split in accordance with time spans. When the suffix 17–20 is used, the operation of the PP is simulated in the years between 2017 and 2020. The result of those 4 years is then combined, creating an “average year” to be replicated 20 times, covering the plant’s lifetime.
Conversely, when the suffix 21 is used, the operation of the power plant is simulated for the year 2021, using the corresponding data regarding energy prices and usage of renewable and non-renewable sources (needed for the Green scenarios). To cover the project’s lifetime this year is, as before, replicated twenty times.
There are two main reasons to separate the year 2021 from the others. First, due to the ongoing global energy crisis, the price of electricity in the MIBEL suffered a significant increase [39]. And second, with the decommissioning of a large coal-fired power plant in January 2021 in Portugal [40], the number of hours available to generate green has significantly increased in the Portuguese power system.
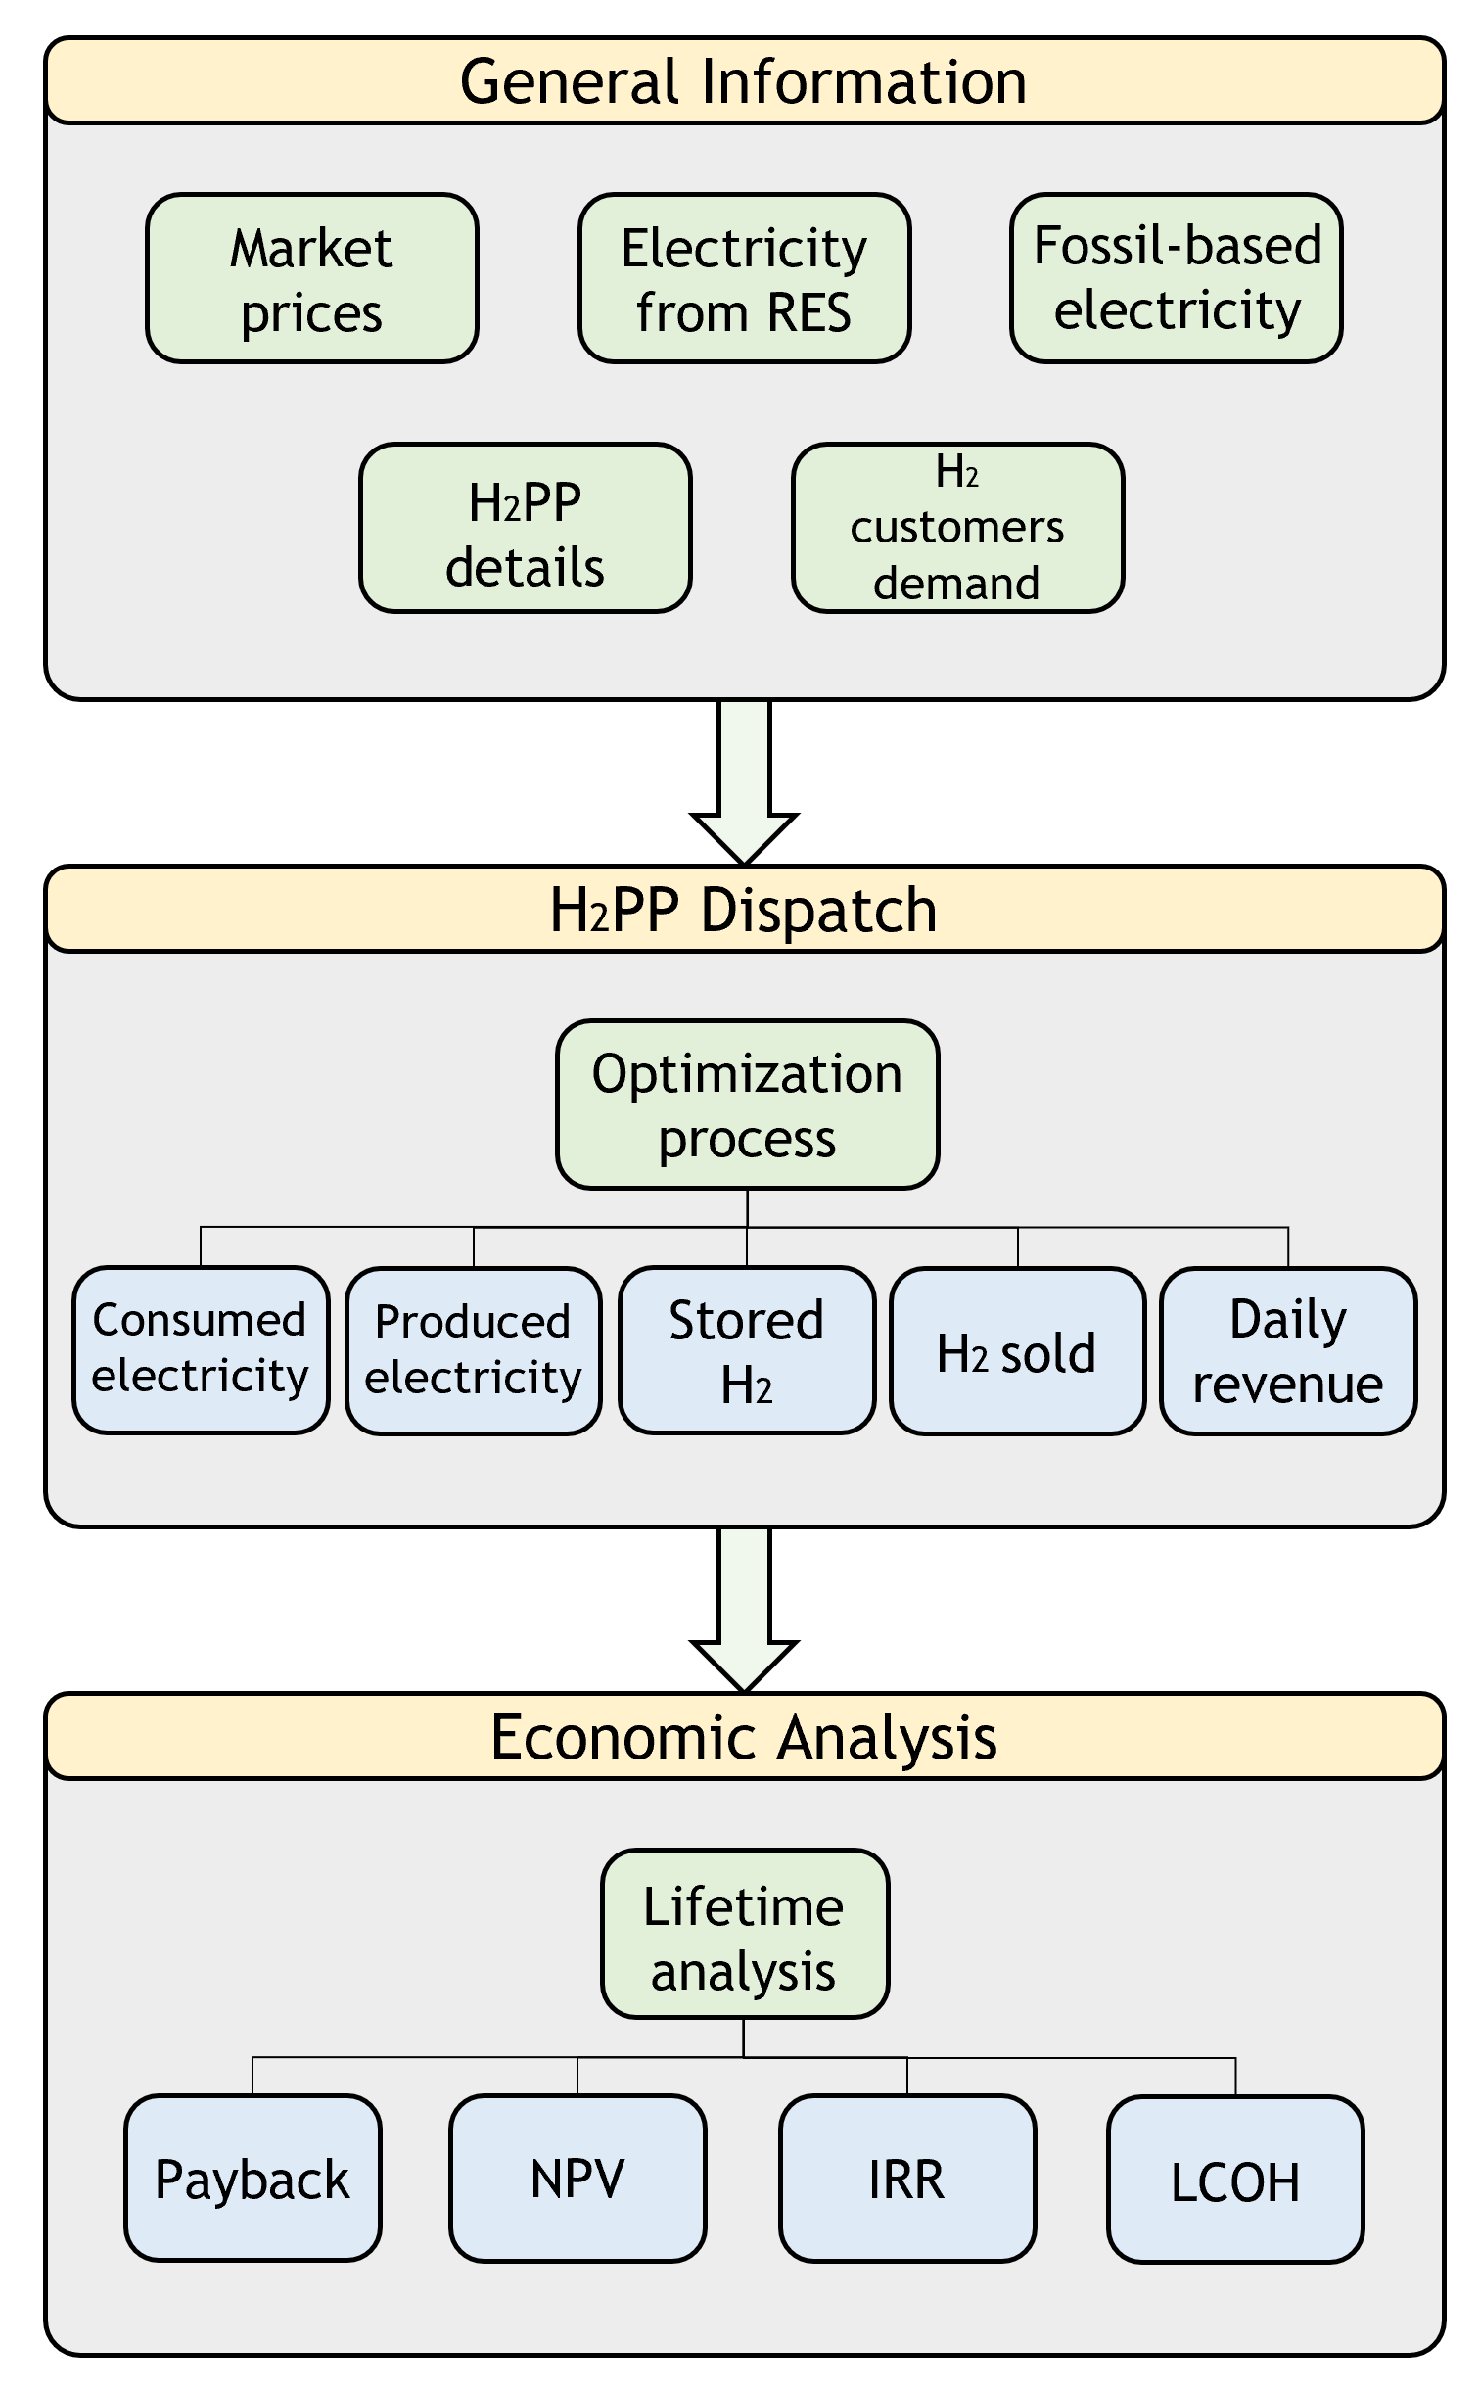
4.2. Results
The described scenarios were simulated, and an economic analysis was carried out for each one. The required prices to reach a payback period of 13 years are shown in Table 6.
Table 6.
prices for each client, to reach a 13-year payback.
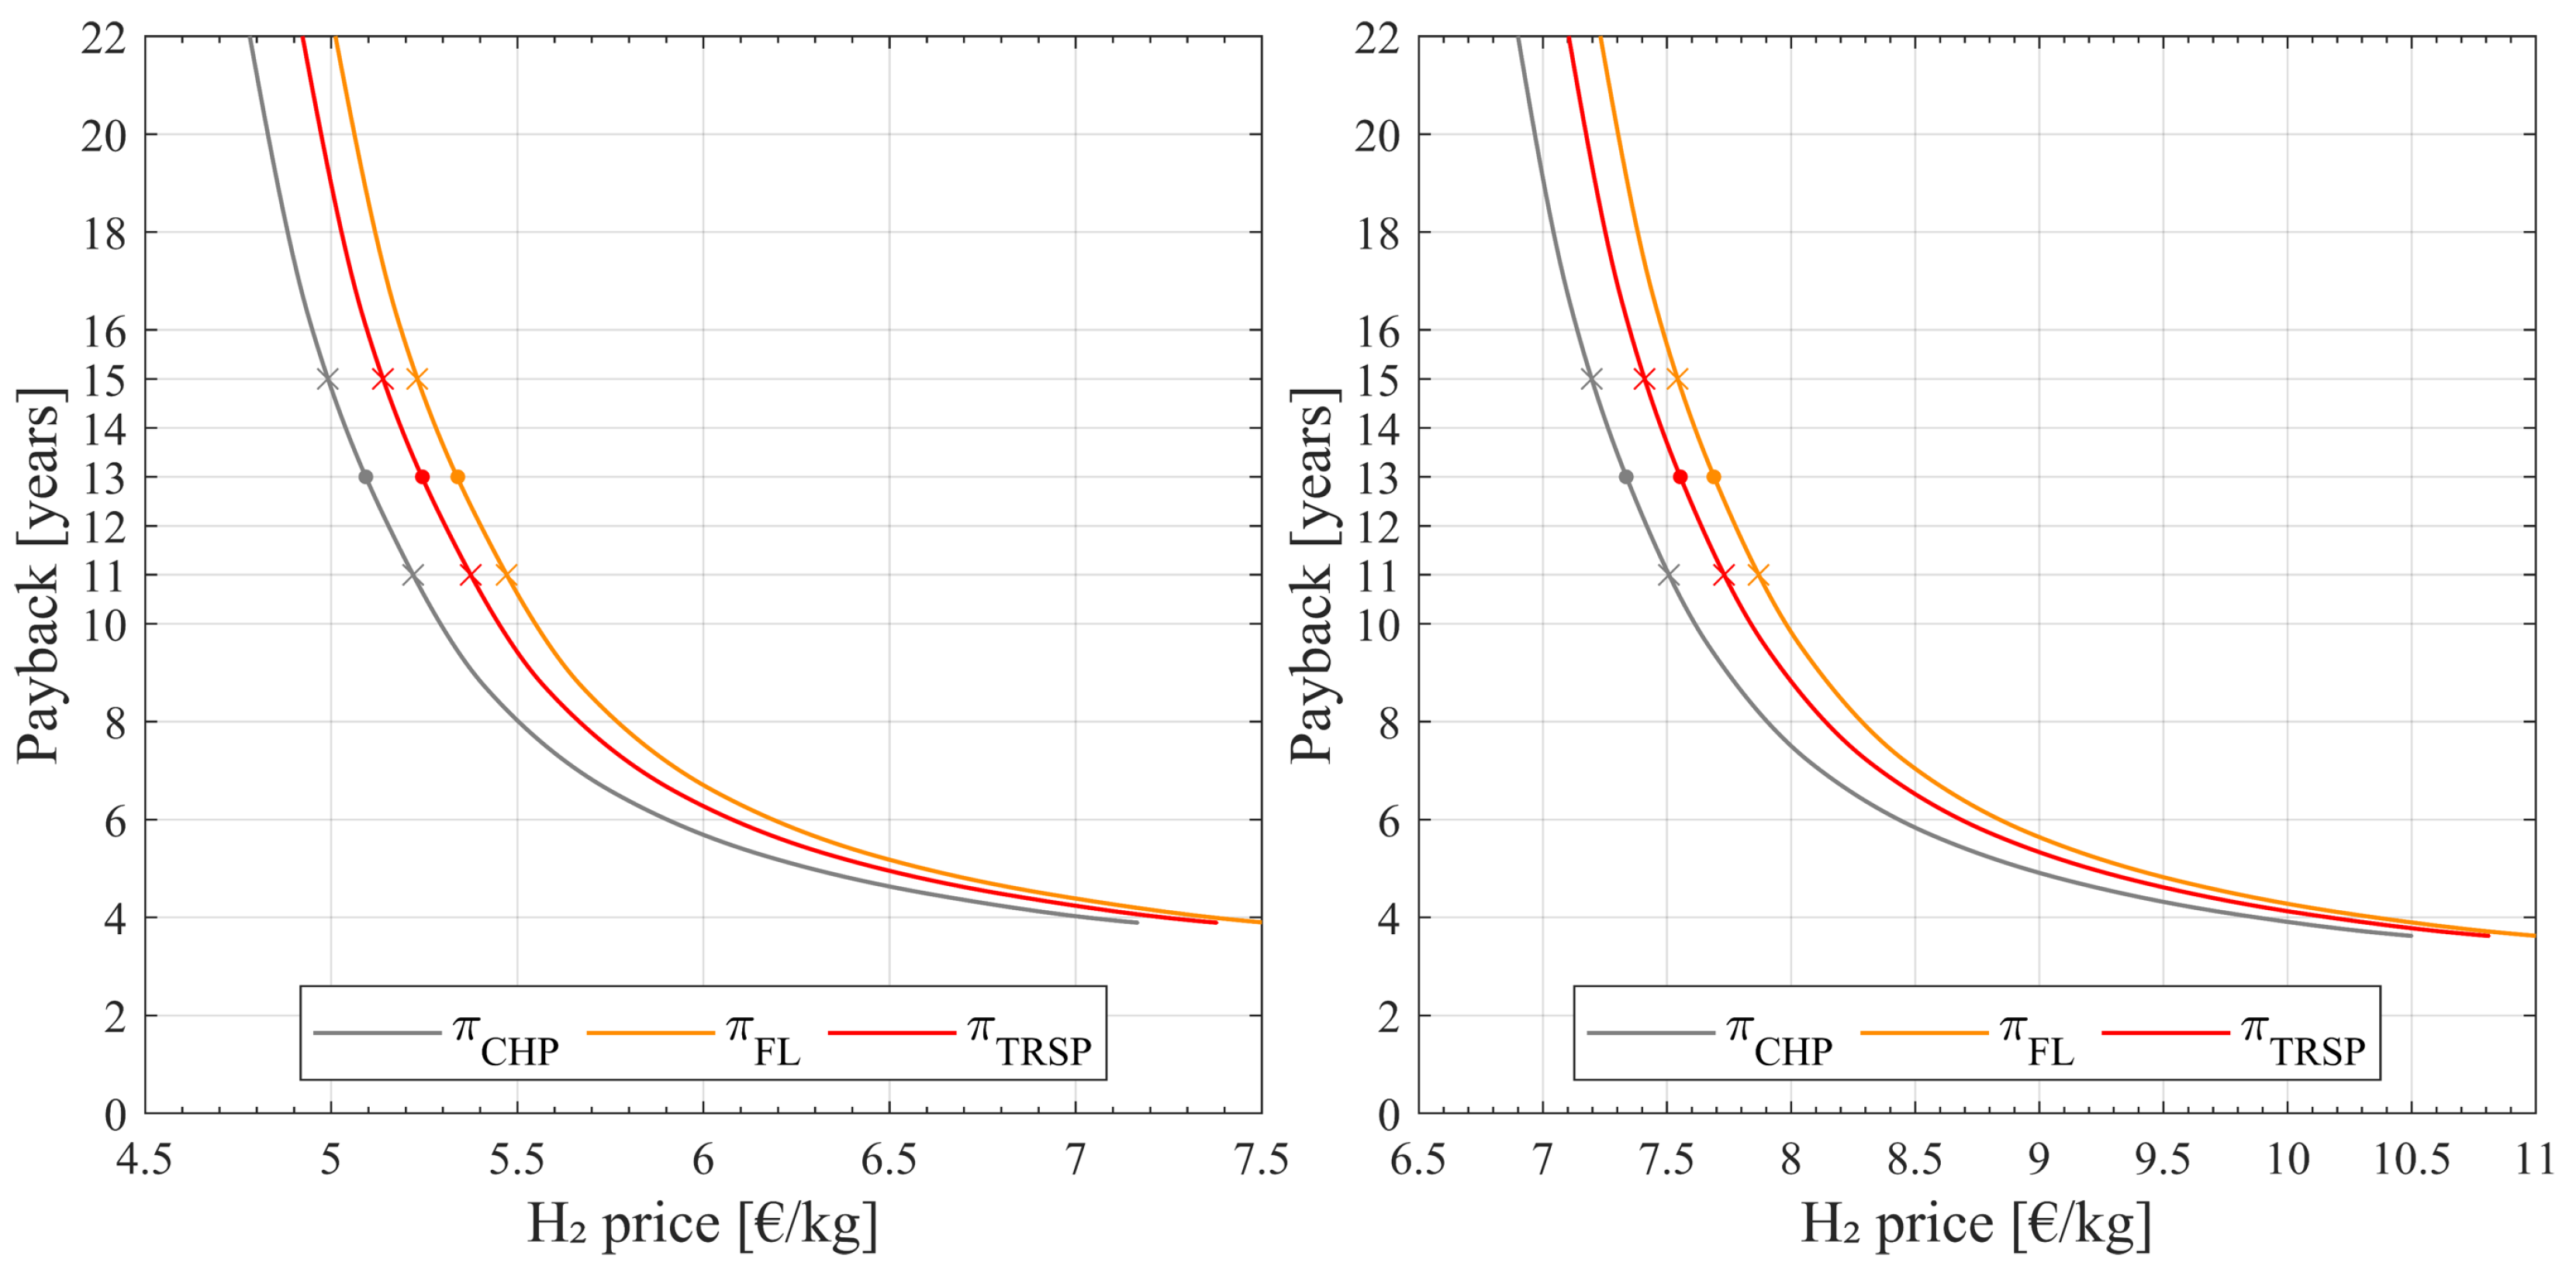
Regarding the 17–20 scenarios, the most favourable is Grey17–20, with prices around 5.0 to 5.4 EUR/kg. This result was expected because, in this situation, energy costs are low (when compared to 2021), and the electrolyser is not just limited to hours of RES generation. However, in Green17–20, hydrogen prices are substantially higher, surpassing 30 EUR/kg, as the hours available for the plant to produce are quite limited. In PPA17–20, the prices are closer to those of Grey17–20, between 7 and 8 EUR/kg.
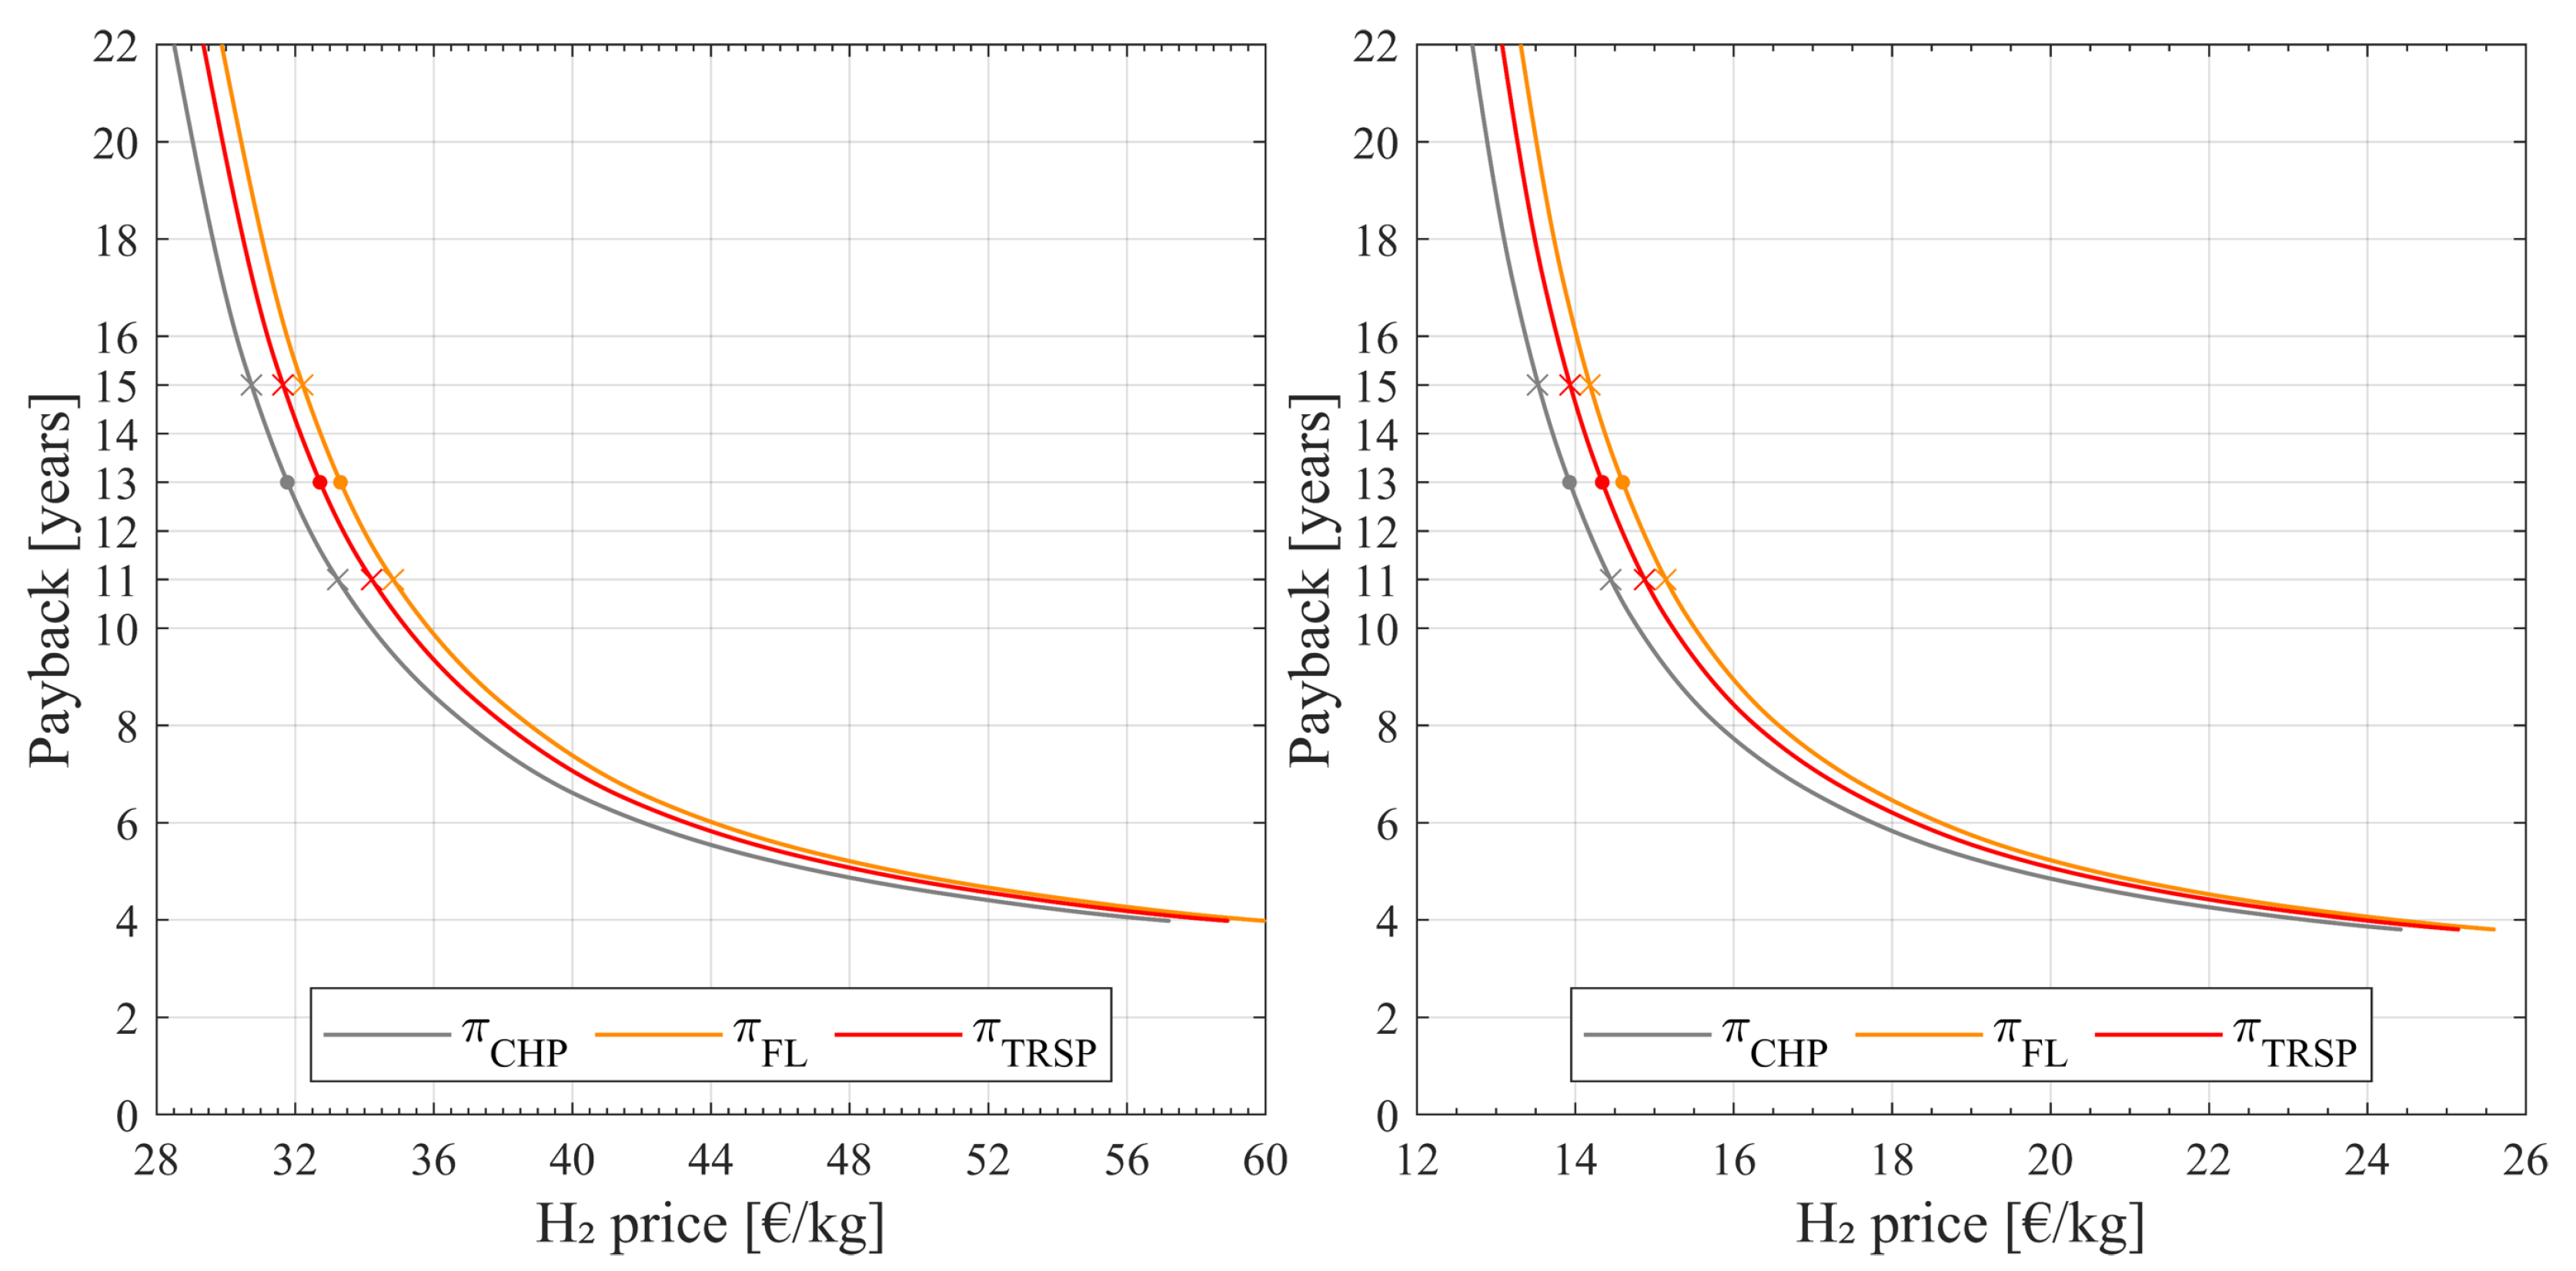
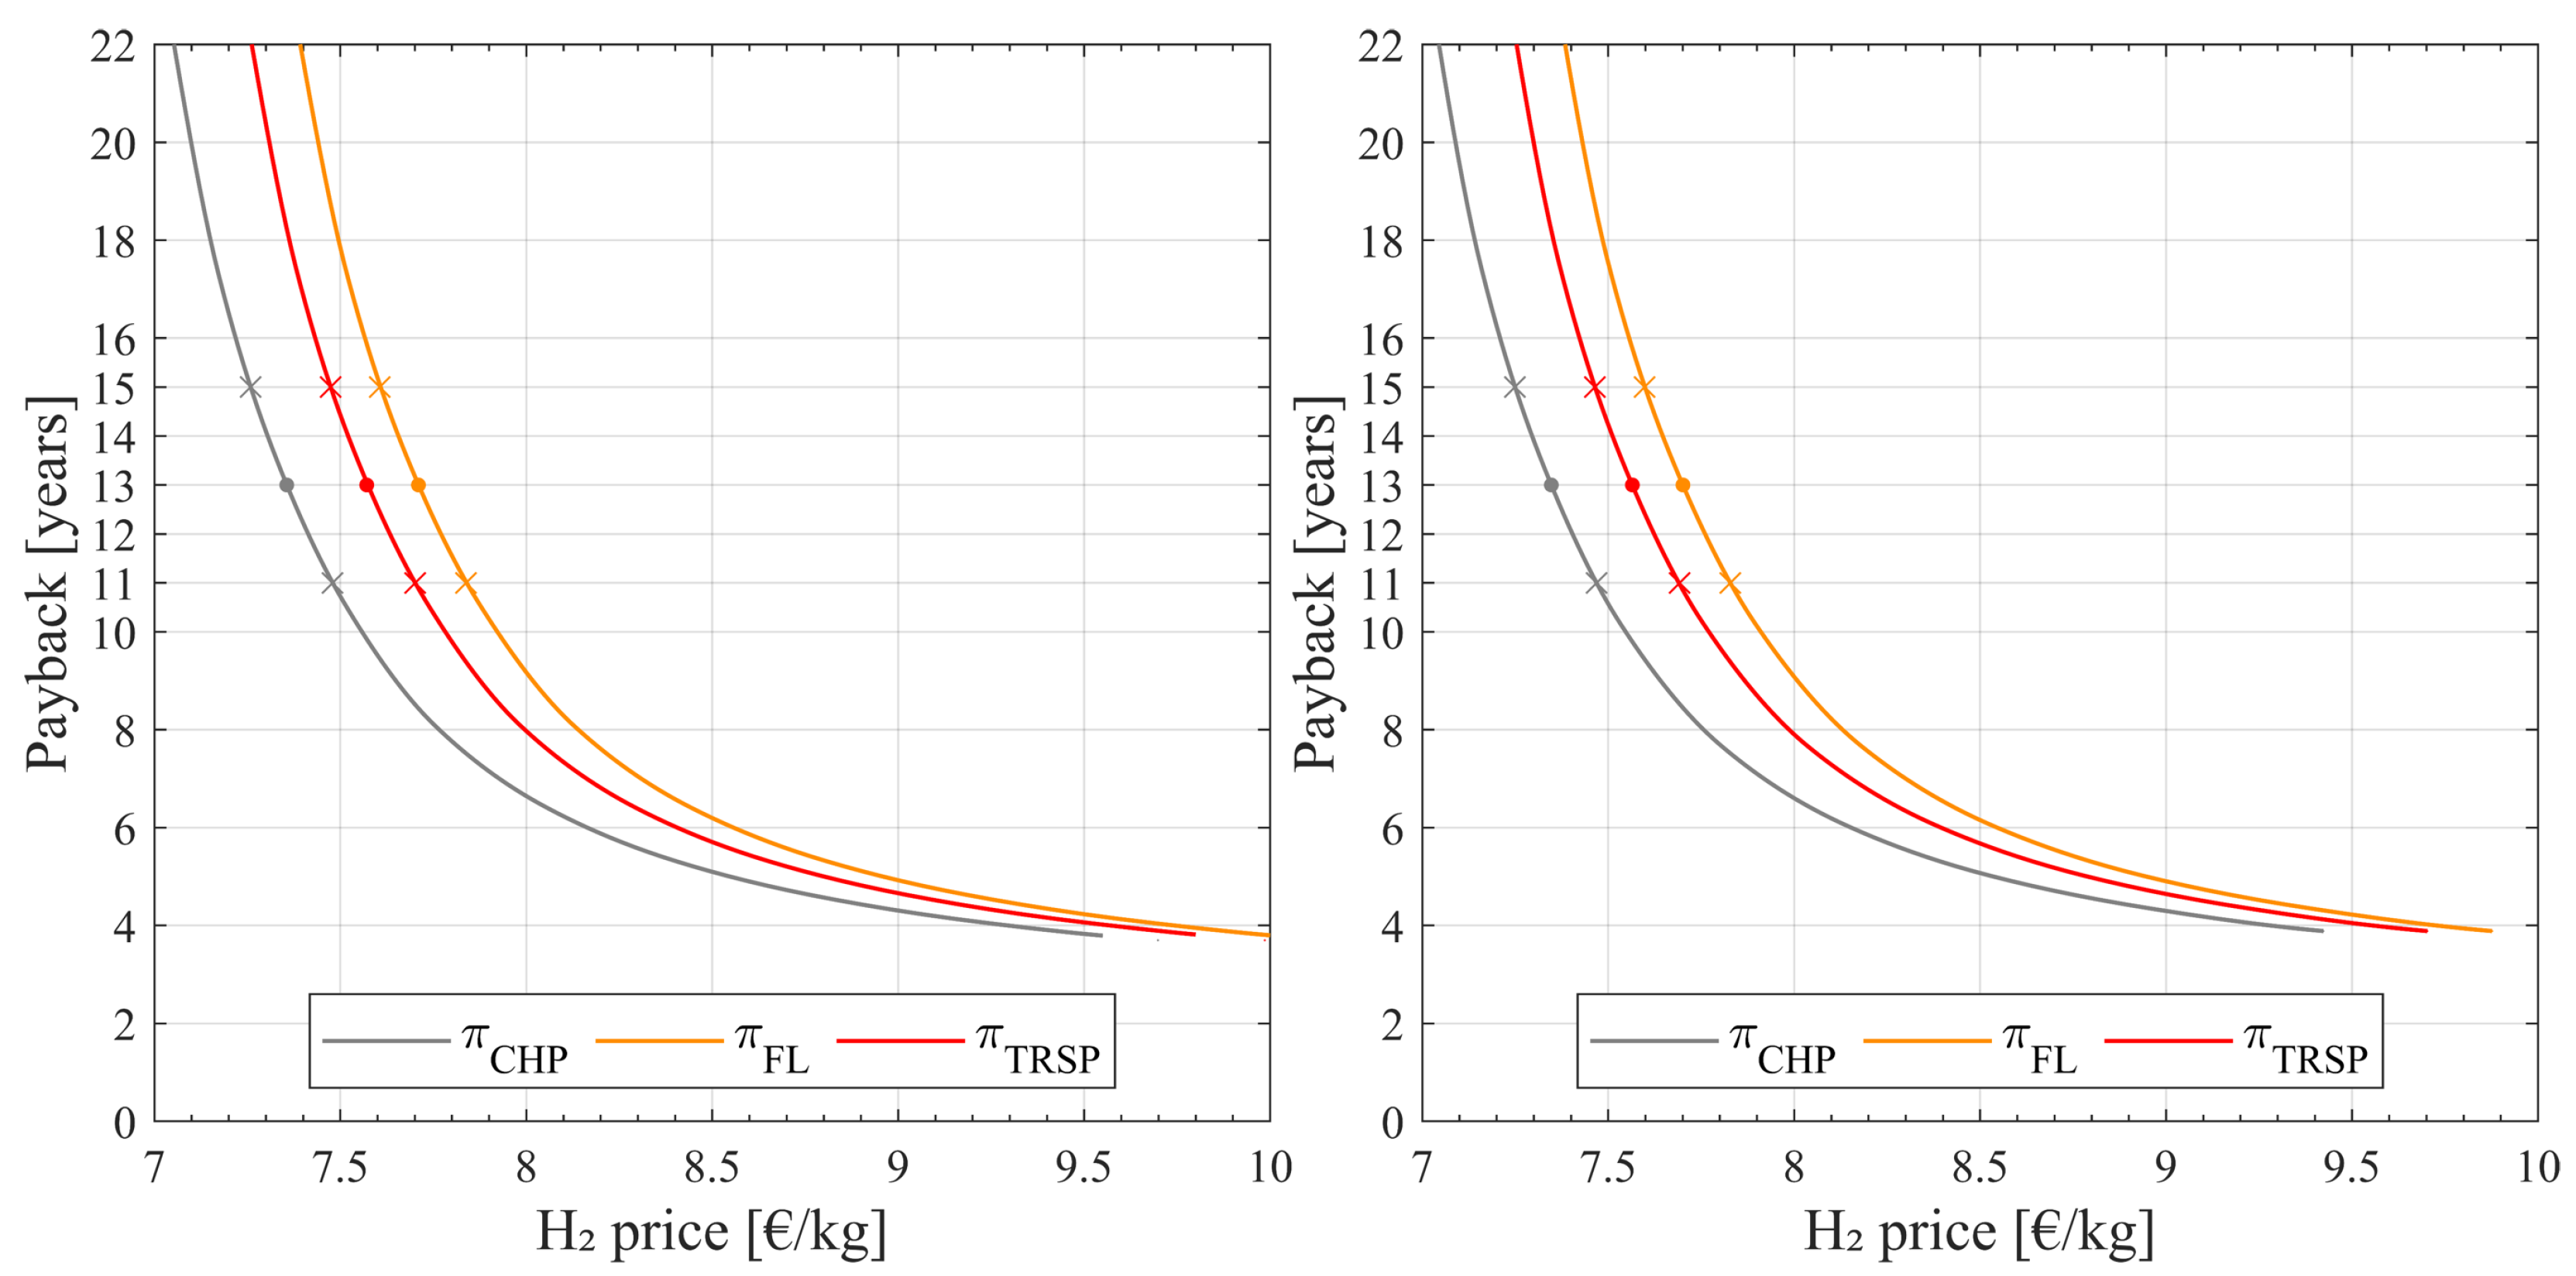
For the 2021 scenarios, as before, production of grey leads to lower prices in Grey21, between 7 and 8 EUR/kg, but higher than those of Grey17–20 due to the rise in electricity costs. In contrast, the RES scenario experienced a positive evolution due to the decrease in non-renewable sources, with Green21 presenting prices in the range of 13–15 EUR/kg. In the PPA scenario, production is not affected by energy costs, meaning that prices do not face major changes, remaining between 7 and 8 EUR/kg.
The variation of the payback period with the price of for each client, across these six different settings, is presented in Figure 3, Figure 4 and Figure 5. It can be seen how, in all the given scenarios, as the prices increase, the payback period drops at a decreasing rate.
Figure 3.
Grey scenarios—relation between payback period and price for each customer for scenario Grey17–20 (left) and Grey21 (right).
Figure 4.
Green scenarios—relation between payback period and price for each customer for scenario Green17–20 (left) and Green21 (right).
Figure 5.
PPA scenarios—relation between payback period and price for each customer for scenario PPA17–20 (left) and PPA21 (right).
To complement the price analysis, the possibility of a more uncertain payback period is considered, varying between 11 and 15 years, that is, 13 ± 2 years. A situation such as this could arise from uncertain factors, such as sudden changes in a hypothetical hydrogen market, which would lead to a need to adjust prices to ensure this PP remains competitive. The prices leading to a payback of 11 and 15 years are marked in Figure 3, Figure 4 and Figure 5 and listed in Table 7.
Table 7.
prices for each client to reach a payback period of 11 years and 15 years.
For the prices leading to a payback of 13 years, a set of economic metrics used to assess the performance of the investment were computed, namely: net present value (NPV), internal return rate (IRR), and levelised cost of hydrogen (LCOH). The LCOH is calculated following Equation (25), in EUR/kg [17]. It results from adding all energy expenses, capital expenses, and operational expenses, and dividing by the amount of produced.
where i is the year, d is the discount rate, and e is the annual inflation rate.
The results, given in Table 8, line up with the aforesaid analysis. As before, Grey17–20 is the most beneficial setting and Green17–20 is the least promising. The main differences are in the LCOH, which varies substantially between scenarios. The NPV reaches similar values, close to 315,000 EUR in all scenarios but the Green ones, where it is lower. The difference in return rates is negligible.
Table 8.
Economic metrics (NPV, IRR, and LCOH) corresponding to a 13-year payback.
The average yearly values of hydrogen produced by the electrolyser and consumed by the fuel cell and the customers are provided in Table 9. The results show how the increase in energy prices from Grey17–20 to Grey21 led to a decrease in generation and commercialization. In addition, the lack of production in Green17–20 and its significant boost in Green21 are evidenced. The PPA scenarios show similar results, with the difference that, as the production costs do not change, but the price at which the fuel cell sells energy increases from PPA17–20 to PPA21, it injects more energy into the grid.
Table 9.
Average yearly production and consumption, for a 13-year payback.
Table 9 shows how the fuel cell, which was set to sell energy to the grid at market price, is barely activated. This situation, worsened by its low efficiency (50%), can be solved by increasing the energy selling price. This solution, which was not implemented in this work, can be triggered by the PP operator, who shall control this price to boost the competitiveness of the fuel cell in the energy market.
5. Conclusions
This work performed a techno-economic analysis of an PP considering its participation in the electricity market, as well as the possibility of providing to different services/customers. The strategic operation on the use of the produced was also analysed.
The results show that the production of electrolytic grey is the most economic so far, resulting in an LCOH between 4.72 EUR/kg and 6.88 EUR/kg, for a payback of 13 years. However, those scenarios are not the most pertinent, as the hydrogen economy of the future must be centred on RES. Regarding the production of green , when the renewable energy to power the PP was purchased at market price, the LCOH varied from 10.6 EUR/kg to 21.7 EUR/kg. When the energy was obtained through a PPA, the LCOH was lower and more stable, ranging from 7.57 EUR/kg to 7.59 EUR/kg. Still, even in the most beneficial scenarios, the achieved prices for green are very high when compared to grey . Furthermore, these prices are far too high when compared to the costs of grey obtained from fossil sources, with a price between 1.5 EUR/kg and 2 EUR/kg.
In line with the literature, it can be concluded that PP based on RES is not yet cost-competitive, but its environmental benefits are clear. In addition, the fuel cell did not prove to be of significant use to the PP. Nevertheless, it is clear that green has the potential to contribute to the decarbonization of power systems in the coming years.
Future work will focus on: (i) studying a more detailed model of the PP capabilities, for instance, the electrolyser; (ii) assessing the impact of PP in the power grid, and (iii) studying the strategic participation of the PP in the energy and ancillary services market.
Author Contributions
Conceptualization, L.M.R., T.S., I.R., J.P.F. and V.M.; methodology, L.M.R., T.S., I.R. and J.P.F.; validation, L.M.R., T.S., I.R. and J.P.F.; formal analysis, L.M.R., T.S., I.R. and J.P.F.; investigation, L.M.R., T.S. and I.R.; data curation, L.M.R., T.S., I.R. and J.P.F.; writing—original draft preparation, L.M.R., T.S. and I.R.; writing—review and editing, L.M.R., T.S., I.R., J.P.F. and V.M.; supervision, T.S., I.R. and V.M. All authors have read and agreed to the published version of the manuscript.
Funding
This research was supported by Norte Portugal Regional Operational Programme (NORTE 2020), under the PORTUGAL 2020 Partnership Agreement, through the European Regional Development Fund (ERDF), within the DECARBONIZE project under agreement NORTE-01-0145-FEDER-000065 and by the Scientific Employment Stimulus Programme from the Fundação para a Ciência e a Tecnologia (FCT) under the agreement 2021.01353.CEECIND.
Data Availability Statement
Not applicable.
Conflicts of Interest
The authors declare no conflict of interest.
Abbreviations and Nomenclature
Abbreviations
The following abbreviations are used in this manuscript.
| BHM | Biological Hydrogen Methanation |
| CAPEX | Capital Expenditure |
| CCS | Carbon Capture and Storage |
| CHP | Combined Heat and Power |
| DER | Distributed Energy Resources |
| DICOPT | DIscrete and Continuous OPTimizer |
| FC | Fuel Cell |
| FCEV | Fuel Cell Electric Vehicles |
| GAMS | General Algebraic Modelling Language |
| Hydrogen | |
| PP | Hydrogen Power Plant |
| HRS | Hydrogen Refuelling Station |
| IRR | Internal Rate of Return |
| LCOH | Levelized Cost of Hydrogen |
| MDPI | Multidisciplinary Digital Publishing Institute |
| MIBEL | Mercado Ibérico de Eletricidade |
| NG | Natural Gas |
| NPV | Net Present Value |
| OPEX | Operational Expenditure |
| PPA | Power Purchase Agreement |
| PV | Photovoltaic |
| RES | Renewable Energy Source |
Nomenclature
The main notation used in this paper is stated here for quick reference.
| Sets | |
| T | Set of time periods |
| Indexes | |
| t | Index for time periods (e.g., 60 min (1.0)) |
| Parameters | |
| Efficiency | |
| Price | |
| Higher Heating Value | |
| Decision variables | |
| B | Binary Variable |
| m | Mass |
| P | Active Power |
| Subscripts and Superscripts | |
| Charge Process | |
| Combined Heat and Power | |
| Compressor | |
| Discharge Process | |
| Electrolyser | |
| Fuel Cell | |
| Forklift | |
| Hydrogen | |
| Upper Bound Limit | |
| Lower Bound Limit | |
| Natural Gas | |
| Transport | |
| Tube Trailer |
References
- European Commission. 2050 Long-Term Strategy. Available online: https://ec.europa.eu/clima/eu-action/climate-strategies-targets/2050-long-term-strategy_en (accessed on 6 November 2022).
- Direção-Geral de Energia e Geologia (DGEG). National Strategy for Hydrogen. Available online: https://www.dgeg.gov.pt/en/transversal-areas/international-affairs/energy-policy/national-strategy-for-hydrogen/ (accessed on 5 November 2022).
- Presidência do Conselho de Ministros. Resolução do Conselho de Ministros n.º 63/2020. Diário da República. Available online: https://files.dre.pt/1s/2020/08/15800/0000700088.pdf (accessed on 5 November 2022). (In Portuguese).
- Direção-Geral de Energia e Geologia (DGEG). Relatório de monitorização da segurança de abastecimento do sistema nacional de gás 2020, Período 2021–2040 (RMSA-G 2020). Technical Report. Available online: https://www.erse.pt/media/xtym4zdt/anexo-1-do-pdirg-pressupostos-do-rmsa-g-2020-dgeg.pdf (accessed on 26 November 2022). (In Portuguese)
- IRENA. Global Hydrogen Trade to Meet the 1.5 °C Climate Goal: Part III—Green Hydrogen Cost and Potential; Technical Report; IRENA: Abu Dhabi, UAE, 2022; Available online: https://www.irena.org/publications/2022/May/Global-hydrogen-trade-Cost (accessed on 7 November 2022).
- Hydrogen Central. Market for Green Hydrogen Will Grow Explosively. Available online: https://hydrogen-central.com/market-for-green-hydrogen-grow-explosively/ (accessed on 23 December 2022).
- de Oliveira, A.R.; Collado, J.V.; Saraiva, J.T.; Doménech, S.; Campos, F.A. Electricity cost of green hydrogen generation in the Iberian electricity market. In Proceedings of the 2021 IEEE Madrid PowerTech, Madrid, Spain, 28 June–2 July 2021; pp. 1–6. [Google Scholar] [CrossRef]
- Benalcazar, P.; Komorowska, A. Prospects of green hydrogen in Poland: A techno-economic analysis using a Monte Carlo approach. Int. J. Hydrogen Energy 2022, 47, 5779–5796. [Google Scholar] [CrossRef]
- de la Cruz-Soto, J.; Azkona-Bedia, I.; Velazquez-Limon, N.; Romero-Castanon, T. A techno-economic study for a hydrogen storage system in a microgrid located in baja California, Mexico. Levelized cost of energy for power to gas to power scenarios. Int. J. Hydrogen Energy 2022, 47, 30050–30061. [Google Scholar] [CrossRef]
- Jovan, D.J.; Dolanc, G. Can green hydrogen production be economically viable under current market conditions. Energies 2020, 13, 6599. [Google Scholar] [CrossRef]
- Petrollese, M.; Concas, G.; Lonis, F.; Cocco, D. Techno-economic assessment of green hydrogen valley providing multiple end-users. Int. J. Hydrogen Energy 2022, 47, 24121–24135. [Google Scholar] [CrossRef]
- Viktorsson, L.; Heinonen, J.T.; Skulason, J.B.; Unnthorsson, R. A step towards the hydrogen economy—A life cycle cost analysis of a hydrogen refueling station. Energies 2017, 10, 763. [Google Scholar] [CrossRef]
- Fragiacomo, P.; Genovese, M. Technical-economic analysis of a hydrogen production facility for power-to-gas and hydrogen mobility under different renewable sources in southern Italy. Energy Convers. Manag. 2020, 223, 113332. [Google Scholar] [CrossRef]
- HyBalance. From Wind Power to Green Hydrogen. Technical Report. 2020. Available online: https://hybalance.eu/wp-content/uploads/2020/10/HyBalance_Brochure_Sep2020_Final.pdf (accessed on 25 January 2023).
- Matute, G.; Yusta, J.; Beyza, J.; Correas, L. Multi-state techno-economic model for optimal dispatch of grid connected hydrogen electrolysis systems operating under dynamic conditions. Int. J. Hydrogen Energy 2021, 46, 1449–1460. [Google Scholar] [CrossRef]
- U.S. Energy Information Administration (EIA). Hydrogen Explained: Use of Hydrogen. Available online: https://www.eia.gov/energyexplained/hydrogen/use-of-hydrogen.php (accessed on 12 November 2022).
- García, E.; Santos, M.; Mariani, V. D8.2: Protocols for Demonstration of Mini-Grid Strategy. Technical Report, HAEOLUS Project. 2020. Available online: https://www.haeolus.eu/wp-content/uploads/2020/09/D8.2.pdf (accessed on 5 November 2022).
- National Research Council and National Academy of Engineering. The Hydrogen Economy: Opportunities, Costs, Barriers, and R&D Needs; The National Academies Press: Washington, DC, USA, 2004. [Google Scholar] [CrossRef]
- Carrion, M.; Arroyo, J.M. A computationally efficient mixed-integer linear formulation for the thermal unit commitment problem. IEEE Trans. Power Syst. 2006, 21, 1371–1378. [Google Scholar] [CrossRef]
- MathWorks. MATLAB. Available online: https://www.mathworks.com/products/matlab.html (accessed on 23 January 2023).
- GAMS. GAMS: System Overview. Available online: https://www.gams.com/products/gams/gams-language/ (accessed on 24 January 2023).
- Vecchietti, A.; Grossmann, I.; Raman, R.; Kalvelagen, E. DICOPT solver. In Gams Development Corporation; Technical Report; Carnegie Mellon University: Pittsburgh, PA, USA, 2008. [Google Scholar]
- Tractebel and Hinicio. Study on Early Business Cases for H2 in Energy Storage and More Broadly Power to H2 Applications. Available online: https://hsweb.hs.uni-hamburg.de/projects/star-formation/hydrogen/P2H_Full_Study_FCHJU.pdf (accessed on 5 November 2022).
- González-Rivera, E.; García-Triviño, P.; Sarrias-Mena, R.; Torreglosa, J.P.; Jurado, F.; Fernández-Ramírez, L.M. Model predictive control-based optimized operation of a hybrid charging station for electric vehicles. IEEE Access 2021, 9, 115766–115776. [Google Scholar] [CrossRef]
- Deloitte. Fueling the Future of Mobility: Hydrogen Electrolyzers. Technical Report. 2021. Available online: https://www2.deloitte.fr/formulaire/pdf/fueling-the-future-of-mobility-hydrogen-electrolyzers.pdf (accessed on 7 November 2022).
- Clean Hydrogen Partnership. Strategic Research and Innovation: Agenda 2021–2027. Available online: https://www.clean-hydrogen.europa.eu/system/files/2022-02/Clean%20Hydrogen%20JU%20SRIA%20-%20approved%20by%20GB%20-%20clean%20for%20publication%20(ID%2013246486).pdf (accessed on 7 November 2022).
- SuperP2G. Internal Report M1: Data Collection and Management—Product Specifications. Available online: https://superp2g.wvgw-kunden.de/wp-content/uploads/2022/09/SUPERP2G_ITALY_Internal_Report_M1.pdf (accessed on 8 November 2022).
- Scottish Government. Scottish Offshore Wind to Green Hydrogen Opportunity Assessment. Available online: https://www.gov.scot/binaries/content/documents/govscot/publications/research-and-analysis/2020/12/scottish-offshore-wind-green-hydrogen-opportunity-assessment2/documents/scottish-offshore-wind-green-hydrogen-opportunity-assessment/scottish-offshore-wind-green-hydrogen-opportunity-assessment/govscot%3Adocument/scottish-offshore-wind-green-hydrogen-opportunity-assessment.pdf (accessed on 5 November 2022).
- Christensen, A. Assessment of Hydrogen Production Costs from Electrolysis: United States and Europe. Available online: https://theicct.org/wp-content/uploads/2021/06/final_icct2020_assessment_of-_hydrogen_production_costs-v2.pdf (accessed on 13 November 2022).
- Ebaid, M.; Hammad, M.; Alghamdi, T. THERMO economic analysis OF PV and hydrogen gas turbine hybrid power plant of 100 MW power output. Int. J. Hydrogen Energy 2015, 40, 12120–12143. [Google Scholar] [CrossRef]
- da Costa Coelho, B.A. Study of a Hybrid Concentrating Solar Power Plant for Portuguese Conditions. Master’s Thesis, Faculdade de Engenharia da Universidade do Porto, Porto, Portugal, 2014. Available online: https://www.google.com/url?sa=t&rct=j&q=&esrc=s&source=web&cd=&ved=2ahUKEwjP3pnDx8_7AhW8TKQEHaROA04QFnoECBgQAQ&url=https%3A%2F%2Fsigarra.up.pt%2Ffep%2Fpt%2Fpub_geral.show_file%3Fpi_doc_id%3D26531&usg=AOvVaw3o4ImA1kWoqL6fedIBmRJT (accessed on 14 November 2022).
- Baptista, J.; Vargas, P.; Ferreira, J.R. A techno-economic analysis of floating photovoltaic systems, for southern European countries. Renew. Energy Power Qual. J. 2021, 19, 57–62. [Google Scholar] [CrossRef]
- Lucas, T.J.R. Feasibility of Wind Energy for Hydrogen Production: The WindFloat Atlantic Case-Study. Master’s Thesis, Instituto Superior Técnico, Lisboa, Portugal, 2021. Available online: https://fenix.tecnico.ulisboa.pt/downloadFile/1126295043838523/Thesis_Tiago_84351.pdf (accessed on 15 November 2022).
- Vendus. Taxas de IRC em Portugal. Available online: https://www.vendus.pt/blog/taxas-irc/ (accessed on 9 November 2022).
- Banco de Portugal. Interest Rates and Amounts of New Loans and Deposits. Available online: https://bpstat.bportugal.pt/conteudos/noticias/1569/ (accessed on 9 November 2022).
- Capstone. C600S Capstone Microturbine. Available online: https://www.pureworldenergy.com/technology/capstone-products/c600s-capstone-microturbine/ (accessed on 10 November 2022).
- Marocco, P.; Ferrero, D.; Gandiglio, M.; Satarelli, M. D2.2: Technical Specification of the Technological Demonstrators. Technical Report, REMOTE Project. 2018. Available online: https://ec.europa.eu/research/participants/documents/downloadPublic?documentIds=080166e5c3fb71d9&appId=PPGMS (accessed on 12 December 2022).
- Stefanie, A.O. Analysis of Hydrogen Transportation Cost in China. Available online: https://www.integralnewenergy.com/?p=30642 (accessed on 16 November 2022).
- CaixaBank Research. The Iberian Electricity Market and the Price Rally in Spain. Available online: https://www.caixabankresearch.com/en/economics-markets/commodities/iberian-electricity-market-and-price-rally-spain (accessed on 19 November 2022).
- Observador. Central de Sines encerra esta sexta-feira, antes do previsto devido a evolução do mercado. Available online: https://observador.pt/2021/01/15/central-de-sines-encerra-esta-sexta-feira-antes-do-previsto-devido-a-evolucao-do-mercado/ (accessed on 18 November 2022).
Disclaimer/Publisher’s Note: The statements, opinions and data contained in all publications are solely those of the individual author(s) and contributor(s) and not of MDPI and/or the editor(s). MDPI and/or the editor(s) disclaim responsibility for any injury to people or property resulting from any ideas, methods, instructions or products referred to in the content. |
© 2023 by the authors. Licensee MDPI, Basel, Switzerland. This article is an open access article distributed under the terms and conditions of the Creative Commons Attribution (CC BY) license (https://creativecommons.org/licenses/by/4.0/).