Abstract
The replacement of hydrocarbon fuels by ammonia in industrial systems is challenging due to its low burning velocity, its narrow flammability range, and a large production of nitric oxide and nitrogen dioxide when burned close to stoichiometric conditions. Cracking a fraction of ammonia into hydrogen and nitrogen prior to injection in the combustion chamber is considered a promising strategy to overcome these issues. This paper focuses on evaluating how different levels of ammonia cracking affect the overall burning velocity, the lean blow-off limit, the concentration of nitric oxide and nitrogen dioxide, and the flame response to acoustic perturbations. Swirl stabilized premixed flames of pure ammonia–air and ammonia–hydrogen–nitrogen–air mixtures mimicking 10%, 20%, and 28% of cracking are experimentally investigated. The results show that even though ammonia cracking is beneficial for enhancing the lean blow-off limit and the overall burning velocity, its impact on pollutant emissions and flame stability is detrimental for a percentage of cracking as low as 20%. Based on an analysis of the flame dynamics, reasons for these results are proposed.
1. Introduction
In the global context of mitigation of greenhouse gas emissions, carbon-free fuels such as ammonia (NH3) and hydrogen (H2) are considered alternative solutions to hydrocarbon fuels in combustion-based energy conversion systems [1,2,3]. Despite a low higher heating value of 22.5 MJ/kg, NH3 has the advantage of a high density at ambient temperature and relatively low pressures, as it liquefies at 8.88 bar for a temperature of 294 K. Therefore, storage and transportation of ammonia are key advantages compared to other carbon-free fuels. However, the combustion of ammonia has numerous challenges, such as a narrow range of flammability [4], a low burning velocity, and large pollutant emissions such as nitrogen oxides (NOx), nitrous oxide (N2O), and unburned NH3 [1,5,6,7]. To increase the flammability range and accelerate the burning velocity, previous studies have demonstrated that cracking a fraction of ammonia into H2 and nitrogen (N2) prior to combustion could be very efficient [4,5,6,8,9,10,11].
For example, a significant improvement in stability limits has been observed in [4] for turbulent ammonia–hydrogen flames by increasing the hydrogen ratio in the fuel composition. However, in the case of pure ammonia flames, it has been concluded that adopting a high-swirl flow of premixed pure ammonia–air flame achieved stabilization without the need for fuel blends [12]. Unfortunately, increasing the swirl number tends to narrow the operational range [13]. For NOx emissions, rich ammonia–hydrogen blends were tested, and a notable NOx reduction could be obtained, but at the expense of lowering combustion efficiency [14]. Recently, a numerical study also showed that hydrogen addition could significantly lower the NO concentration of the burned gases in a domestic burner [15]. As for lean ammonia–hydrogen flames, a promising NOx performance was observed for very lean ammonia–hydrogen-air flames, with NO mole fractions limited to ~100 ppm [4,16]. In [17], it was shown that the relative concentration of NH3 and H2 in blends of these fuels could have a dramatic impact on the NO2 concentration in the burned gases. The best blend for lean combustion was found to be 95% of NH3 and 5% of H2 (in volume). Another strategy studied for the reduction of NOx emissions was to burn ammonia in a two-stage, rich-lean combustor [18,19]. Note that premixed flames of hydrogen and blends of hydrogens with other fuels are known to be susceptible to thermo-diffusive instabilities [20,21,22].
Another important aspect to consider, especially for gas turbine applications, is the flame dynamics and, more specifically, the susceptibility to thermoacoustic instabilities. Thermoacoustic instabilities can happen if a flame is strongly responsive to acoustic perturbation of the incoming flow. The response of premixed hydrocarbon-air swirl flames to acoustic modulation of the flow has been extensively studied, and it is relatively well understood [23,24,25,26,27,28,29,30]. The flame roll-up around a vortex shed in the shear layer at the exit of the injection tube (flame vortex roll-up), and the swirl number fluctuation controls the flame response to perturbations. Recently, Wiseman et al. [30] compared partly cracked ammonia flames with methane flames. They showed that the cut-off frequency for partly cracked ammonia flames was higher than for methane flames and that the phase gradient was lower. In other words, they demonstrated that partly cracked ammonia-premixed flames could be susceptible to thermoacoustic instabilities for a larger range of acoustic frequencies than methane flames. However, as in their study, only large fractions of ammonia cracking were considered, and the critical level of hydrogen addition to having a responsive flame was not investigated.
The objective of the present study is to provide a comprehensive assessment of the effect of cracking on the lean blow-off, overall burning velocity, pollutant emissions, and flame susceptibility to the thermoacoustic coupling of ammonia flames. This study is performed in an atmospheric pressure swirl burner of a few kilowatts of thermal power. The results show that even though ammonia cracking can enhance the lean blow-off limit and the overall burning velocity, its impact on pollutant emissions and flame stability is detrimental for a percentage of cracking as low as 20%.
2. Materials and Methods
In this section, first, the experimental setup and the diagnostics utilized are described. Then the methodology followed is detailed. Uncertainties and limitations of this study are also discussed.
2.1. Experimental Setup
The experimental setup utilized in this study has been presented in detail in [28,31]. It consists of an atmospheric pressure swirl stabilized burner equipped with an acoustic forcing system. The flames are stabilized over a rod 10 mm in diameter using a swirling flow produced by a radial swirler of 1.67 swirl number (calculated based on [32]). The flames are confined in a quartz tube of 70 mm in inner diameter and 200 mm in length, except otherwise specified. Four different fuels were studied: pure ammonia and three mixtures of NH3, H2, and N2, mimicking the thermal cracking of ammonia upstream of the burner. The percentage of cracking, α, is defined as:
with , the mass fraction of hydrogen, , the mass fraction of nitrogen, and , the mass fraction of ammonia. With this definition, the balance equation for the stoichiometric combustion of partly cracked ammonia is:
The three blends of NH3, H2, and N2 studied in this work correspond to 10% cracking, 20% cracking, and 28% cracking. This maximal cracking of 28% was chosen because, at this condition, the flammability limits approach those of methane–air flames [8]. Table 1 summarizes the mass flow rates of the gases for each of the conditions studied during the investigation of the flame response to acoustic modulation of the flow. For all conditions, the equivalence ratio was 0.95, the bulk flow velocity was 7 m/s, and the flame thermal power (calculated for adiabatic combustion) was about 3.4 kW. The corresponding Reynolds number was around 4500.

Table 1.
Mass flow rates for the four fuel–air blends utilized for the measurements of the flame transfer functions. The equivalence ratio was 0.95, the bulk flow velocity was 7 m/s, and the corresponding thermal power released during adiabatic combustion was about 3.4 kW.
A perfect mixture of all gases was injected into the burner; therefore, the flames could be classified as perfectly premixed. Figure 1 presents examples of direct visualization of these four flames obtained with a DSLR camera with an exposure time of 67 ms. Both the color and the shape of the flames are different. This will be discussed in Section 3.1.
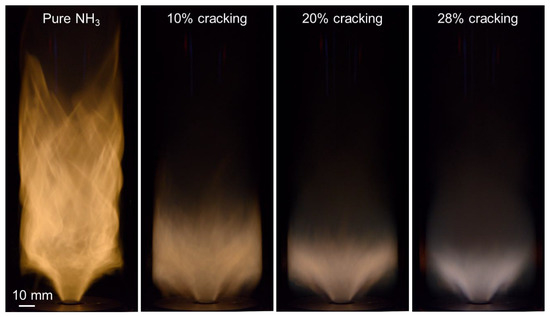
Figure 1.
Direct visualization of ammonia, ammonia at 10% cracking, ammonia at 20% cracking, and ammonia at 28% cracking flames, with a thermal power of 3.4 kW, a bulk flow velocity of 7 m/s, an equivalence ratio of 0.95, and a swirl number of 1.67.
The acoustic forcing was obtained with the help of a loudspeaker located at the bottom part of the burner (see Figure 2). A function generator was used to generate the sine signals at the targeted frequencies, sent to an audio amplifier connected to the loudspeaker. More details can be found in [28,31].
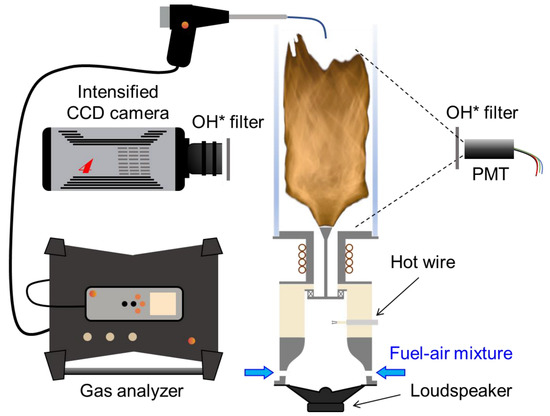
Figure 2.
Schematic representation of the experimental setup with diagnostics.
2.2. Diagnostics
Figure 2 presents a schematic representation of the experimental setup with the diagnostics utilized in this study. Measurements of velocity, heat release rate (HRR), average concentrations of NO and NO2 in the burned gases, as well as chemiluminescence imaging of the flames were performed.
A hot wire anemometer (Dantec miniCTA) was located 1.5 cm upstream of the swirler and utilized to characterize the acoustic forcing of the incoming flow. Due to the large difference between the thermal conductivity and density of the gases, a calibration of the hot wire for each of the four flammable mixtures was necessary. Figure 3 presents the calibration plots obtained for velocities up to 10 m/s. The overall uncertainty of the velocity measurements is estimated to be about 10%. It is mainly induced by the calibration procedure and apparatus. In Figure 3, the error bars correspond to the maximal discrepancy between two measurements at the same condition.
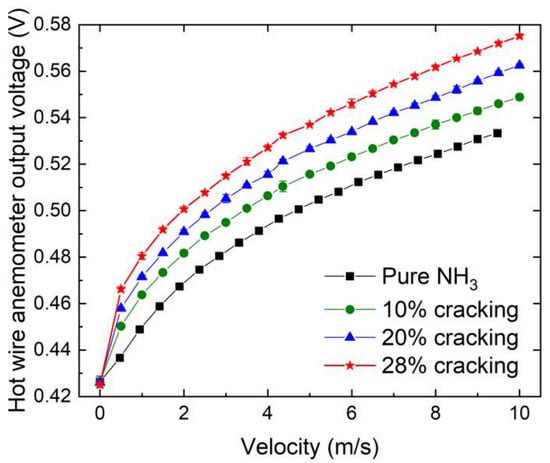
Figure 3.
Output voltage of the hot-wire anemometer as a function of the flow velocity for the four mixtures used in this study. Error bars correspond to the maximal discrepancy between two measurements at the same condition.
The determination of HRR fluctuation was necessary to quantify the response of the flame to acoustic modulation of the flow. As the gases were perfectly premixed, OH* chemiluminescence was used as a tracer of HRR [30,33,34]. The light emitted by the flames was focused with a convex length (75-mm focal length) on a photomultiplier tube (PMT, Hamamatsu Model H10721) equipped with a bandpass filter centered at 310 nm, with an FWHM of 10 nm (ASAHI model ZBPA310).
The dynamics of the flame were analyzed based on phase-locked imaging of OH* chemiluminescence. An intensified CCD camera (Princeton Instrument, Pimax 4) equipped with a bandpass filter centered at 310 nm, with an FWHM of 10 nm (ASAHI model ZBPA310), was utilized. The synchronization between the acoustic forcing and the camera was obtained with the help of a function generator (NF WF1973).
Finally, the composition of the exhaust gases was analyzed using a commercial gas analyzer (Testo 350) equipped with NO, NO2, and O2 sensors. The uncertainty in the concentration measured was about ±5 ppm for measured values between 0 and 99 ppm, ±5% for measured values between 100 and 1999 ppm, and ±10% for measured values between 2000 and 4000 ppm for NO; ±5 ppm for measured values between 0 and 99 ppm and ±5% of measured value between 100 and 500 ppm for NO2, and ±0.8% for O2.
2.3. Methods
The lean blow-off limit of a flame was determined, starting from a stable flame, by gradually increasing the airflow at a slow speed of 1 SLPM per minute. Each measurement was repeated four times. The equivalence ratio at blow-off was reached when no more flame was visible in the combustion chamber. At this point, the corresponding bulk flow velocity was calculated. It was slightly higher than the initial bulk flow velocity due to the increase in airflow.
The flame transfer functions (FTFs) quantify the response of a flame to acoustic modulation of the incoming flow for a large range of acoustic frequencies. For relatively small amplitudes of these fluctuations (typically less than 15% of the mean flow velocity), the response of the flame is linear. The FTF can be defined as the ratio of HRR relative fluctuation to velocity relative fluctuation in the frequency domain:
where is the HRR, is the axial velocity of the incoming flow, and is the frequency. The symbol denotes the Fourier transform of , and is its average value. The FTF can also be expressed in terms of a gain, , and a phase, , such as:
In Equation (4), reflects the magnitude of the flame response, while corresponds to the delay between the global HRR fluctuations and the velocity fluctuations, measured by the hot wire. For the entire range of frequencies, i.e., between 16 and 670 Hz, the amplitude of the velocity fluctuation was kept constant at 10% of the mean flow velocity. For each forcing frequency, the acoustic forcing signal (sinusoidal wave produced by a function generator, sent to the audio amplifier connected to a loudspeaker installed at the bottom of the burner), the hot wire signal, and the PMT signal were recorded for 10 s by an oscilloscope (Agilent Technologies Infiniium, 2.5 GHz, Santa Clara, California, United States), with a sampling rate of 20 kHz. For each forcing frequency, the amplitude of the acoustic forcing was adjusted by changing the amplitude of the sine wave generated by the function generator until the hot wire measured a velocity oscillation of 10% of the bulk flow velocity. Then the measurements were recorded.
The average concentration of NO and NO2 was measured in the quartz tube, 4 cm below its upper end. For these measurements, the length of the quartz tube was 40 cm to ensure good mixing of the burned gases at the location of sampling. A scan over the diameter of the tube (70 mm) was performed, and the results obtained were averaged. For a given combustion condition, the root mean square (RMS) error of the concentrations obtained during a scan was negligible compared to the measurement uncertainty. Therefore, the error bars in the figure correspond to the measurement uncertainties.
Flame dynamics were studied for a unique forcing frequency of 192 Hz. This frequency has been chosen because it corresponds to a local maximum of flames of ammonia at 20% and 28% cracking, as will be shown in Section 3.4. The period was split into 10 phase intervals of 36°. For each phase interval, 2000 snapshots at a 250 μs exposure time were recorded and averaged. Since the mean flames were symmetric, Abel deconvolution could be applied to obtain the spatial distribution of OH* chemiluminescence in the central plane. Phase 0° in the figures corresponds to and at the location of velocity measurements, i.e., 6 cm upstream of the top of the central rod.
3. Results
In this section, first, the effect of ammonia cracking on the overall burning velocity is presented. Then the lean blow-off limits for the four mixtures investigated are summarized. The third subsection focuses on the average concentrations of NO and NO2 in the burned gases. Finally, the FTFs of the flames presented in Figure 1 are reported (Supplementary).
3.1. Effect of Ammonia Cracking on the Overall Burning Velocity
The overall burning velocity can be determined from the mass conservation across the flame front:
where is the mass flow rate of the unburned mixture, is the density of the unburned mixture, is the flame surface area, and is the flame velocity. In this study, the flames are turbulent; therefore, is a function of time, , which is extremely difficult to measure. From the time-integrated OH* chemiluminescence images, after Abel transform, it is possible to determine an overall burning area, , as the integration over of the average flame front. This average flame front is defined as the maximal intensity of the flame brush. Thus, is a constant allowing the determination of an overall burning velocity, , defined as:
With this definition, it is not possible to determine a flame velocity because the corrugation of the flame front is not known, and the four mixtures have different Lewis numbers. However, the comparison of the overall burning velocities for the four mixtures investigated allows the assessment of the effect of ammonia cracking. Another relevant parameter to illustrate the effect of cracking is the overall flame length, , defined as the vertical distance between the top of the rod and the top of the flame. Figure 4 presents the overall flame length, , and the overall burning velocity, , for the four mixtures detailed in Table 1, i.e., ammonia–air, and partly cracked ammonia–air flames, with an equivalence ratio of 0.95 and a bulk flow velocity of 7 m/s.
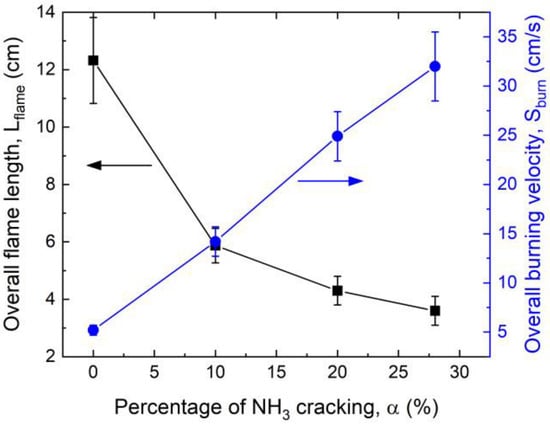
Figure 4.
Overall flame length and overall burning velocity of the four NH3–H2–N2–air blends with a global equivalence ratio of , a bulk flow velocity of 7 m/s, and a corresponding flame thermal power of about 3.4 kW. Error bars represent uncertainties in the flame dimension measurements.
As expected, cracking of ammonia monotonically decreases the flame length, from more than 12 cm for pure ammonia to less than 4 cm for 28% cracking. This decrease by a factor of three is accompanied by an increase in the overall burning velocity by a factor of six, i.e., from 5.2 cm/s to 32.0 cm/s. These results illustrate the effect of cracking on the reactivity of the mixture but do not allow for the inference of any quantitative increase in the laminar burning velocity. In any event, these results are in adequation with the effect of cracking on the laminar burning velocity of ammonia flames reported in [5], with a laminar burning velocity of 5–7 cm/s for stoichiometric pure ammonia flames and a laminar burning velocity of 16–19 cm/s for stoichiometric ammonia at 28% cracking flames.
3.2. Lean Blow-Off Limits
The effect of ammonia cracking on the lean blow-off limit was investigated for a range of bulk velocities from 4 to 13 m/s. Figure 5a presents the equivalence ratio at blow-off as a function of the bulk flow velocity for the four NH3–H2–N2–air blends considered in this study.
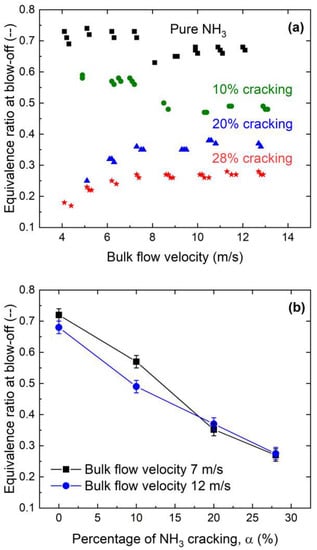
Figure 5.
(a) Equivalence ratio at blow-off as a function of the bulk flow velocity for pure ammonia flames (black squares), 10% cracking (green circles), 20% cracking (blue triangles), and 28% cracking (red stars). Each condition was repeated four times. (b) Equivalence ratio at blow-off as a function of ammonia cracking for two bulk flow velocities, 7 m/s and 12 m/s. Error bars correspond to uncertainties in the measurements.
As expected, the flames with the largest fraction of hydrogen were more difficult to blow off than those with low or no hydrogen content. For 20% and 28% cracking, the equivalence ratio at blow-off is monotonically increasing with the bulk flow velocity, in agreement with what has been reported in [4]. For example, at 28% cracking, for a bulk flow velocity of 4 m/s, the equivalence ratio at blow-off is about 0.17. It increases up to 0.27 at about 7 m/s and stabilizes around this value for higher bulk flow velocities. However, for pure ammonia and ammonia at 10% cracking flames, for bulk flow velocities in the range of 4–7 m/s, the equivalence ratio at blow-off is almost constant. At around 8 m/s, there was a sharp decrease in the equivalence ratio at blow-off, followed by a slow increase when the bulk velocity was increased. This non-monotonic behavior suggests different stabilization mechanisms at low and high bulk flow velocities. This will be discussed in Section 4.1.
The equivalence ratios at blow-off obtained for bulk flow velocities around 7 m/s and 12 m/s are also plotted in Figure 5b as a function of the percentage of ammonia cracking. For both bulk flow velocities, the equivalence ratio at blow-off almost linearly decreases with the percentage of ammonia cracking, from about 0.7 for pure ammonia flames, to about 0.27 for ammonia at 28% cracking flames. These values are slightly lower than those obtained in [4] for ammonia–hydrogen–air swirl flames at ambient conditions. For pure ammonia flames, they obtained an equivalence ratio at blow-off of 0.8, and for the flames of ammonia with 28% of hydrogen, the equivalence ratio at blow-off was 0.38. This small difference might be due to a different thermalization of their experimental setup, as both the size of the combustion chamber and the cooling system were different from those used in the current study.
3.3. NO and NO2 Emissions
Figure 6 presents the average concentration of NOx, including both NO and NO2, in the burned gases of the four flames presented in Figure 1, i.e., for a percentage of ammonia cracking, , varying from 0 to 28%. The equivalence ratio was 0.95, and the bulk flow velocity was 7 m/s. Each data point corresponds to an average of four measurements. The repeatability of the measurements was good compared to the accuracy of the gas analyzer; therefore, the error bars correspond to the uncertainty of the measurements (see Section 2.2). For pure ammonia, the average concentration of NOx of about 2900 ppm agrees with what was reported in other studies for an equivalence ratio close to stoichiometry [4]. At 10% of ammonia cracking, the effect on the NOx concentration was negligible, with an increase of less than 2%. However, for a larger percentage of ammonia cracking, the concentration of NOx in the burned gases increased significantly, up to 6700 ppm for .
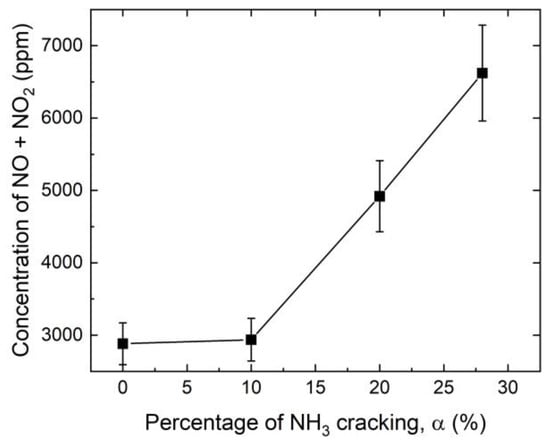
Figure 6.
Concentration of NOx (i.e., NO + NO2) as a function of ammonia cracking. For all flames, the equivalence ratio was 0.95, and the bulk flow velocity was 7 m/s.
Figure 7 presents the corrected concentration of NOx, including both NO and NO2, as a function of the equivalence ratio, Φ, for pure ammonia (black squares), ammonia at 10% cracking (green circles), ammonia at 20% cracking (blue triangles), and ammonia at 28% cracking (red stars) flames. A correction was performed to avoid underestimating the amount of NOx produced per unit of fuel burned in lean cases due to dilution by air. The corrected concentration [NOx]corr, was obtained from Equation (7) [35]:
with , the NOx concentration measured in the burned gases, the concentration of oxygen in the percentage of volume for the reference case, and the measured concentration of oxygen in the burned gases in the percentage of volume. The reference oxygen concentration was taken at 15% as a representative concentration in burned gases of gas turbine engines [35]. For all fuel mixtures, the corrected concentration of NOx started to decrease at about 0.8 equivalence ratio. For pure ammonia and 10% cracking, [NOx]corr dropped below 500 ppm at Φ ≈ 0.8. For 20% cracking, [NOx]corr = 500 ppm was achieved for Φ ≈ 0.67, and for 28% cracking, Φ ≈ 0.6 should be reached to obtain this corrected concentration. Again, these results agree well with what was found in previous studies [4], and this will be one of the main challenges of the ammonia cracking strategy in industrial systems subjected to regulations on NOx emissions. Note that strategies such as a two-stage, rich-lean combustor [18,19] have shown promising results in addressing this issue. Furthermore, a study on the effect of non-equilibrium plasma produced by nanosecond repetitively-pulsed discharges showed that non-equilibrium plasma could be used to decrease the NOx production of ammonia flames [36]. The development of plasma actuators could be a potential solution for industrial systems such as gas turbine engines.
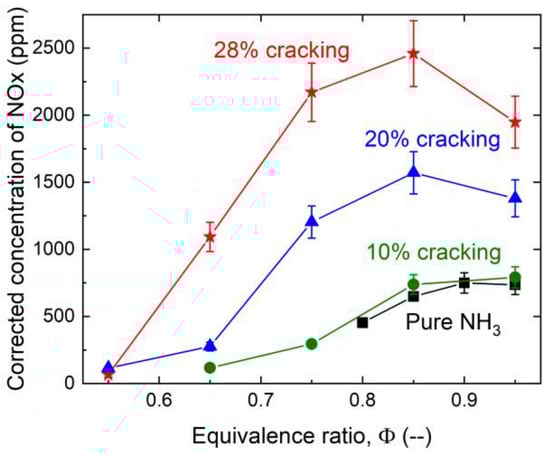
Figure 7.
Corrected concentration of NOx (NO + NO2), [NOx]corr, as a function of the equivalence ratio, Φ, for pure ammonia, ammonia at 10% cracking, ammonia at 20% cracking, and ammonia at 28% cracking flames.
3.4. Flame Transfer Functions
Figure 8 presents the gain and the phase of the FTFs for pure ammonia and partly cracked ammonia flames of 0.95 equivalence ratio for a bulk flow velocity of 7 m/s, corresponding to the conditions summarized in Table 1. The range of frequencies considered was 16 to 670 Hz. Experiments were conducted at least four times, and no variability in the results could be observed.
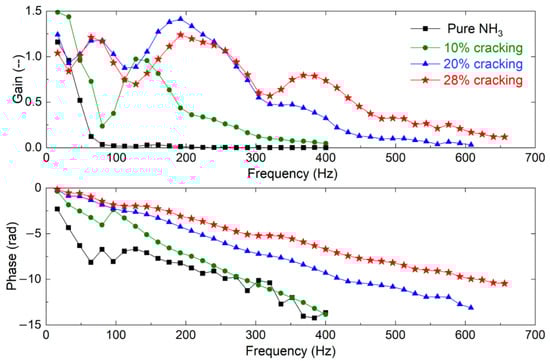
Figure 8.
Transfer functions of a pure ammonia flame (black squares) and flames of ammonia at 10% cracking (green circles), 20% cracking (blue triangles), and 28% cracking (red stars). For all flames, the equivalence ratio was 0.95, and the bulk flow velocity was 7 m/s.
Pure ammonia flames were marginally responsive to acoustic modulation of the flow (black squares), with a gain higher than unity only for frequencies below 50 Hz. On the other hand, partly cracked ammonia flames were significantly more responsive to acoustic forcing. For 10% cracking (green circles), two local maxima at 32 and 128 Hz and a local minimum at 80 Hz were obtained, with an almost linear decrease in the phase. This is typical of the transfer functions of methane-air swirl flames, such as those studied in [28,29]. For a larger proportion of ammonia cracking, multiple local maxima and minima can be observed, while the phase remained linear with a decreasing angle when the percentage of cracking increased. The reasons behind these different results will be discussed in Section 4.2.
4. Discussion
In this section, the results presented in Section 3.2 and Section 3.4 are further discussed. This discussion is supported by imaging the flames, providing additional insight into flame morphology and dynamics.
4.1. Stabilization Mechanisms
As presented in Section 3.2, for pure ammonia and ammonia at 10% cracking, the equivalence ratio at blow-off, as a function of the bulk flow velocity, did not follow a monotonic trend. For flow velocity below 8 m/s, corresponding to a Re < 5120, the blow-off happened at relatively large equivalence ratios, while for bulk flow velocities higher than 8 m/s, the blow-off happened at significantly lower equivalence ratios. This behavior could be explained by different flame stabilization mechanisms.
Figure 9 presents direct visualizations of pure ammonia flames at (a) an equivalence ratio of 0.78 and a bulk flow velocity of 6.8 m/s and (b) an equivalence ratio of 0.70 and a bulk flow velocity of 8.5 m/s. The shapes of the two flames are very different. For low velocity (a), the flame is aerodynamically stabilized by the swirling flow. The flame is compact with the typical shape of a turbulent swirl flame. For high velocity (b), the flame is stabilized in the recirculation zone over the bluff body for about 8 cm, and then it develops into a long laminar swirling flame. These two stabilization mechanisms can also be observed for flames of ammonia at 10% cracking, as shown in Figure 9c,d. Different stabilization mechanisms had been previously reported for swirl flames in [37]. Even though it allows the burning of leaner mixtures, the stabilization mechanism obtained for fast flows is not suitable for practical systems. The flame is then too long, and the heat loss to the walls is enhanced, lowering the overall efficiency of the engine.
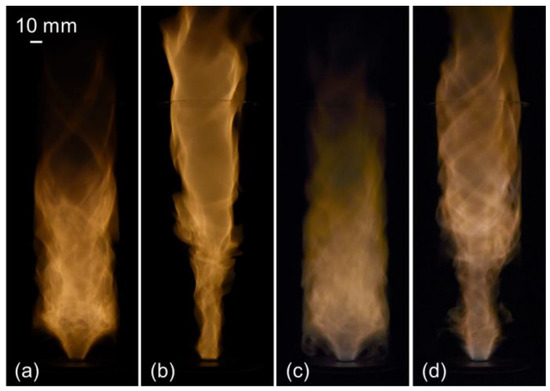
Figure 9.
Direct visualization of (a) a pure ammonia flame at and a bulk velocity of 6.8 m/s, (b) a pure ammonia flame at and a bulk velocity of 8.5 m/s, (c) a 10% ammonia cracking flame at and a bulk velocity of 6.8 m/s, and (d) a 10% ammonia cracking flame at and a bulk velocity of 8.5 m/s.
4.2. Flame Dynamics
The response of the flame to acoustic modulation of the flow was maximal at 192 Hz for 20% and 28% cracking, while for 10% cracking, the gain was low (0.45) and almost zero for the pure ammonia flame. While the flow and acoustic forcing conditions were similar for these four flames, phase-locked OH* chemiluminescence imaging was performed to better understand the flame dynamics. The Abel-deconvoluted images obtained for a 10% velocity forcing at 192 Hz are presented in Figure 10.
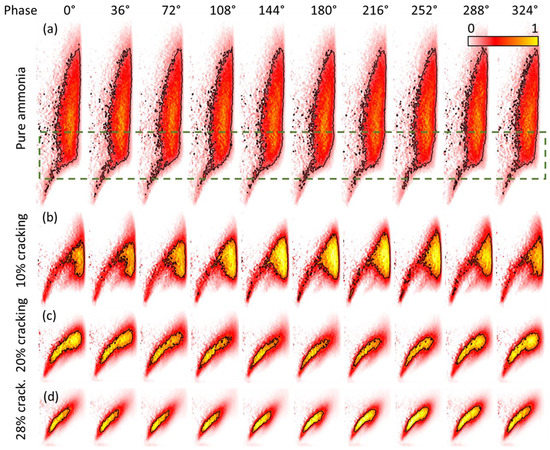
Figure 10.
Phase-locked Abel-deconvoluted images of the OH* chemiluminescence for the four flames of Figure 1 ((a) pure ammonia flame, (b) flame of ammonia at 10% cracking, (c) flame of ammonia at 20% cracking, and (d) flame of ammonia at 28% cracking), subjected to acoustic forcing at 192 Hz, with a forcing amplitude of 10%. The black isolines correspond to 25% intensity for the pure ammonia flame and 50% intensity for the partly cracked ammonia flames.
For the pure ammonia flame (Figure 10a), the flame is very long, and even though a change in the flame geometry can be noticed over a cycle in the area confined in the dashed green rectangle, this fluctuation is not sufficient to induce a noticeable gain. This is interesting because it shows that the pure ammonia flame is responsive to the flow perturbation generated by the acoustic wave, i.e., the vortex propagating in the shear layer [25,28,38,39,40], but due to the overall flame length, this response remains marginal for the fluctuation in the heat release rate.
The flame of ammonia at 10% cracking is more compact than the pure ammonia flame (Figure 10b), and a fluctuation of its top can be noticed. This fluctuation is responsible for a gain of 0.45 in the FTF. For flames at 20% and 28% cracking (Figure 10c,d, respectively), the flames are even more compact, and the vortex roll-up at the top of the flames features significant changes over a cycle, in agreement with a gain of the FTF larger than unity. This strong fluctuation in the flame vortex roll-up can easily be explained by the fact that lean hydrogen flames are very resistant to strain rate [41]. Thus, the hydrogen content of the mixture helps the flame in burning the vortex generated in the shear layer at the outlet of the injection tube.
5. Conclusions
The effect of ammonia cracking on the overall burning velocity, lean blow-off limit, NOx emissions, and the response of the flame to acoustic modulation of the incoming flow was investigated at atmospheric pressure. The main findings were:
- For a swirl flame of about 3.4 kW, with an equivalence ratio of 0.95 and a bulk flow velocity of 7 m/s, cracking of ammonia in the range of 0–28% in mass linearly increased the overall burning velocity.
- For pure ammonia and ammonia at 10% cracking, the equivalence ratio at blow-off did not follow a monotonic trend when the bulk flow velocity was increased from 4 to 13 m/s. A step at about 8 m/s was observed, corresponding to a change in the stabilization mechanism.
- While cracking of ammonia was very efficient in enhancing the lean stability limit, the concentration of NOx in the burned gases was increased by about a factor of two for 28% cracking. In parallel, the response of the flame to acoustic modulation was also enhanced for a large range of frequencies, making these flames more prone to thermoacoustic problems than pure ammonia flames.
- The strong response of ammonia–hydrogen–nitrogen–air flames to acoustic perturbation of the incoming flow can be explained by the strong fluctuation of the top of the flame, i.e., the flame vortex roll-up, which can be explained by the strong resistance of hydrogen flames to strain rate.
Supplementary Materials
The following supporting information can be downloaded at: https://www.mdpi.com/article/10.3390/en16031323/s1, Table S1: Hot-wire calibration; Table S2: Burning velocities and flame lengths; Table S3: Lean blow-off limits; Table S4: NOx concentrations; Table S5: Flame transfer functions.
Author Contributions
Conceptualization, N.N.S. and D.A.L.; methodology, N.N.S., M.A. and D.A.L.; data acquisition, N.N.S. and M.A.; formal analysis, N.N.S. and D.A.L.; data processing, N.N.S., M.A. and D.A.L.; writing—original draft preparation, D.A.L.; writing—review and editing, N.N.S. and M.A.; funding acquisition, D.A.L. All authors have read and agreed to the published version of the manuscript.
Funding
This research was funded by the King Abdullah University of Science and Technology through the CRG project “Tailoring Flame Dynamics in Carbon Free Combustors,” grant number URF/1/4051-01-01.
Data Availability Statement
The data are available in Supplementary Material.
Acknowledgments
The authors would like to thank Thibault Guiberti for the interesting discussions on ammonia swirling flames and the technical staff of the Clean Combustion Research Center, more specifically Et-touhami Es-sebbar. The authors also sincerely thank Amit Katoch, Samir Rojas Chavez, Daniel Vigarinho de Campos, and Vigneshwaran Sankar for their help during the measurement campaign.
Conflicts of Interest
The authors declare no conflict of interest. The funders had no role in the design of the study; in the collection, analyses, or interpretation of data; in the writing of the manuscript; or in the decision to publish the results.
References
- Kobayashi, H.; Hayakawa, A.; Somarathne, K.D.K.A.; Okafor, E.C. Science and Technology of Ammonia Combustion. Proc. Combust. Inst. 2019, 37, 109–133. [Google Scholar] [CrossRef]
- Aziz, M.; Wijayanta, A.T.; Nandiyanto, A.B.D. Ammonia as Effective Hydrogen Storage: A Review on Production, Storage and Utilization. Energies 2020, 13, 3062. [Google Scholar] [CrossRef]
- Valera-Medina, A.; Xiao, H.; Owen-Jones, M.; David, W.I.F.; Bowen, P.J. Ammonia for Power. Prog. Energy Combust. Sci. 2018, 69, 63–102. [Google Scholar] [CrossRef]
- Khateeb, A.A.; Guiberti, T.F.; Zhu, X.; Younes, M.; Jamal, A.; Roberts, W.L. Stability Limits and NO Emissions of Technically-Premixed Ammonia-Hydrogen-Nitrogen-Air Swirl Flames. Int. J. Hydrog. Energy 2020, 45, 22008–22018. [Google Scholar] [CrossRef]
- Ji, C.; Wang, Z.; Wang, D.; Hou, R.; Zhang, T.; Wang, S. Experimental and Numerical Study on Premixed Partially Dissociated Ammonia Mixtures. Part I: Laminar Burning Velocity of NH3/H2/N2/Air Mixtures. Int. J. Hydrog. Energy 2022, 47, 4171–4184. [Google Scholar] [CrossRef]
- Kang, L.; Pan, W.; Zhang, J.; Wang, W.; Tang, C. A Review on Ammonia Blends Combustion for Industrial Applications. Fuel 2023, 332, 126150. [Google Scholar] [CrossRef]
- Elbaz, A.M.; Wang, S.; Guiberti, T.F.; Roberts, W.L. Review on the Recent Advances on Ammonia Combustion from the Fundamentals to the Applications. Fuel Commun. 2022, 10, 100053. [Google Scholar] [CrossRef]
- Verkamp, F.J.; Hardin, M.C.; Williams, J.R. Ammonia Combustion Properties and Performance in Gas-Turbine Burners. Symp. Combust. 1967, 11, 985–992. [Google Scholar] [CrossRef]
- Khateeb, A.A.; Guiberti, T.F.; Wang, G.; Boyette, W.R.; Younes, M.; Jamal, A.; Roberts, W.L. Stability Limits and NO Emissions of Premixed Swirl Ammonia-Air Flames Enriched with Hydrogen or Methane at Elevated Pressures. Int. J. Hydrog. Energy 2021, 46, 11969–11981. [Google Scholar] [CrossRef]
- Mei, B.; Zhang, J.; Shi, X.; Xi, Z.; Li, Y. Enhancement of Ammonia Combustion with Partial Fuel Cracking Strategy: Laminar Flame Propagation and Kinetic Modeling Investigation of NH3/H2/N2/Air Mixtures up to 10 Atm. Combust. Flame 2021, 231, 111472. [Google Scholar] [CrossRef]
- Wang, Z.; Ji, C.; Wang, D.; Hou, R.; Zhang, T.; Wang, S. Experimental and Numerical Study on Premixed Partially Dissociated Ammonia Mixtures. Part II: Numerical Study of Premixed Combustion Characteristics. Fuel 2021, 306, 121660. [Google Scholar] [CrossRef]
- Hayakawa, A.; Arakawa, Y.; Mimoto, R.; Somarathne, K.D.K.A.; Kudo, T.; Kobayashi, H. Experimental Investigation of Stabilization and Emission Characteristics of Ammonia/Air Premixed Flames in a Swirl Combustor. Int. J. Hydrog. Energy 2017, 42, 14010–14018. [Google Scholar] [CrossRef]
- Valera-Medina, A.; Pugh, D.G.; Marsh, P.; Bulat, G.; Bowen, P. Preliminary Study on Lean Premixed Combustion of Ammonia-Hydrogen for Swirling Gas Turbine Combustors. Int. J. Hydrog. Energy 2017, 42, 24495–24503. [Google Scholar] [CrossRef]
- Valera-Medina, A.; Gutesa, M.; Xiao, H.; Pugh, D.; Giles, A.; Goktepe, B.; Marsh, R.; Bowen, P. Premixed Ammonia/Hydrogen Swirl Combustion under Rich Fuel Conditions for Gas Turbines Operation. Int. J. Hydrog. Energy 2019, 44, 8615–8626. [Google Scholar] [CrossRef]
- Lamioni, R.; Bronzoni, C.; Folli, M.; Tognotti, L.; Galletti, C. Feeding H2-Admixtures to Domestic Condensing Boilers: Numerical Simulations of Combustion and Pollutant Formation in Multi-Hole Burners. Appl. Energy 2022, 309, 118379. [Google Scholar] [CrossRef]
- Zhang, M.; An, Z.; Wang, L.; Wei, X.; Jianayihan, B.; Wang, J.; Huang, Z.; Tan, H. The Regulation Effect of Methane and Hydrogen on the Emission Characteristics of Ammonia/Air Combustion in a Model Combustor. Int. J. Hydrog. Energy 2021, 46, 21013–21025. [Google Scholar] [CrossRef]
- Mashruk, S.; Kovaleva, M.; Alnasif, A.; Chong, C.T.; Hayakawa, A.; Okafor, E.C.; Valera-Medina, A. Nitrogen Oxide Emissions Analyses in Ammonia/Hydrogen/Air Premixed Swirling Flames. Energy 2022, 260, 125183. [Google Scholar] [CrossRef]
- Okafor, E.C.; Somarathne, K.D.K.A.; Hayakawa, A.; Kudo, T.; Kurata, O.; Iki, N.; Kobayashi, H. Towards the Development of an Efficient Low-NOx Ammonia Combustor for a Micro Gas Turbine. Proc. Combust. Inst. 2019, 37, 4597–4606. [Google Scholar] [CrossRef]
- Okafor, E.C.; Somarathne, K.D.K.A.; Ratthanan, R.; Hayakawa, A.; Kudo, T.; Kurata, O.; Iki, N.; Tsujimura, T.; Furutani, H.; Kobayashi, H. Control of NOx and Other Emissions in Micro Gas Turbine Combustors Fuelled with Mixtures of Methane and Ammonia. Combust. Flame 2020, 211, 406–416. [Google Scholar] [CrossRef]
- Okafor, E.C.; Nagano, Y.; Kitagawa, T. Experimental and Theoretical Analysis of Cellular Instability in Lean H2-CH4-Air Flames at Elevated Pressures. Int. J. Hydrog. Energy 2016, 41, 6581–6592. [Google Scholar] [CrossRef]
- Dinesh, K.K.J.R.; Shalaby, H.; Luo, K.H.; van Oijen, J.A.; Thévenin, D. High Hydrogen Content Syngas Fuel Burning in Lean Premixed Spherical Flames at Elevated Pressures: Effects of Preferential Diffusion. Int. J. Hydrog. Energy 2016, 41, 18231–18249. [Google Scholar] [CrossRef]
- Lapenna, P.E.; Berger, L.; Attili, A.; Lamioni, R.; Fogla, N.; Pitsch, H.; Creta, F. Data-Driven Subfilter Modelling of Thermo-Diffusively Unstable Hydrogen–Air Premixed Flames. Combust. Theory Model 2021, 25, 1064–1085. [Google Scholar] [CrossRef]
- Candel, S. Combustion Dynamics and Control: Progress and Challenges. Proc. Combust. Inst. 2002, 29, 1–28. [Google Scholar] [CrossRef]
- Lieuwen, T.C.; Yang, V. Combustion Instabilities in Gas Turbine Engines; American Institute of Aeronautics and Astronautics: Reston, VA, USA, 2006; Volume 210, ISBN 978-1-56347-669-3. [Google Scholar]
- Palies, P.; Durox, D.; Schuller, T.; Candel, S. The Combined Dynamics of Swirler and Turbulent Premixed Swirling Flames. Combust. Flame 2010, 157, 1698–1717. [Google Scholar] [CrossRef]
- Palies, P.; Durox, D.; Schuller, T.; Candel, S. Experimental Study on the Effect of Swirler Geometry and Swirl Number on Flame Describing Functions. Combust. Sci. Tech. 2011, 183, 704–717. [Google Scholar] [CrossRef]
- Poinsot, T. Prediction and Control of Combustion Instabilities in Real Engines. Proc. Combust. Inst. 2017, 36, 1–28. [Google Scholar] [CrossRef]
- Di Sabatino, F.; Guiberti, T.F.; Boyette, W.R.; Roberts, W.L.; Moeck, J.P.; Lacoste, D.A. Effect of Pressure on the Transfer Functions of Premixed Methane and Propane Swirl Flames. Combust. Flame 2018, 193, 272–282. [Google Scholar] [CrossRef]
- Di Sabatino, F.; Guiberti, T.F.; Moeck, J.P.; Roberts, W.L.; Lacoste, D.A. Fuel and Equivalence Ratio Effects on Transfer Functions of Premixed Swirl Flames. J. Propuls. Power 2020, 36, 271–284. [Google Scholar] [CrossRef]
- Wiseman, S.; Gruber, A.; Dawson, J. Flame Transfer Functions for Turbulent, Premixed, Ammonia-Hydrogen-Nitrogen-Air Flames. J. Eng. Gas Turbines Power 2022, 145, 031015. [Google Scholar] [CrossRef]
- Lacoste, D.A.; Moeck, J.P.; Durox, D.; Laux, C.O.; Schuller, T. Effect of Nanosecond Repetitively Pulsed Discharges on the Dynamics of a Swirl-Stabilized Lean Premixed Flame. J. Eng. Gas Turbines Power 2013, 135, 101501. [Google Scholar] [CrossRef]
- Lefebvre, A.H.; Ballal, D.R. Gas Turbine Combustion; CRC Press: Amsterdam, The Netherlands, 2010; ISBN 9781420086058. [Google Scholar]
- Price, R.B.; Hurle, I.R.; Sugden, T.M. Optical Studies of the Generation of Noise in Turbulent Flames. Symp. Combust. 1969, 12, 1093–1102. [Google Scholar] [CrossRef]
- Hurle, I.R.; Price, R.B.; Sugden, T.M.; Thomas, A. Sound Emission from Open Turbulent Premixed Flames. Proc. R. Soc. Lond. A 1968, 303, 409–427. [Google Scholar] [CrossRef]
- Baukal, C.E.; Eleazer, P.B. Quantifying NOx for Industrial Combustion Processes. J. Air Waste Manag. Assoc. 1998, 48, 52–58. [Google Scholar] [CrossRef] [PubMed]
- Choe, J.; Sun, W.; Ombrello, T.; Carter, C. Plasma Assisted Ammonia Combustion: Simultaneous NOx Reduction and Flame Enhancement. Combust. Flame 2021, 228, 430–432. [Google Scholar] [CrossRef]
- Skiba, A.W.; Guiberti, T.F.; Boyette, W.R.; Roberts, W.L.; Mastorakos, E. On the Bi-Stable Nature of Turbulent Premixed Bluff-Body Stabilized Flames at Elevated Pressure and near Lean Blow-Off. Proc. Combust. Inst. 2021, 38, 2853–2860. [Google Scholar] [CrossRef]
- Kang, D.M.; Culick, F.E.C.; Ratner, A. Combustion Dynamics of a Low-Swirl Combustor. Combust. Flame 2007, 151, 412–425. [Google Scholar] [CrossRef]
- Külsheimer, C.; Büchner, H. Combustion Dynamics of Turbulent Swirling Flames. Combust. Flame 2002, 131, 70–84. [Google Scholar] [CrossRef]
- Bellows, B.D.; Bobba, M.K.; Forte, A.; Seitzman, J.M.; Lieuwen, T. Flame Transfer Function Saturation Mechanisms in a Swirl-Stabilized Combustor. Proc. Combust. Inst. 2007, 31, 3181–3188. [Google Scholar] [CrossRef]
- Ren, J.Y.; Qin, W.; Egolfopoulos, F.N.; Tsotsis, T.T. Strain-Rate Effects on Hydrogen-Enhanced Lean Premixed Combustion. Combust. Flame 2001, 124, 717–720. [Google Scholar] [CrossRef]
Disclaimer/Publisher’s Note: The statements, opinions and data contained in all publications are solely those of the individual author(s) and contributor(s) and not of MDPI and/or the editor(s). MDPI and/or the editor(s) disclaim responsibility for any injury to people or property resulting from any ideas, methods, instructions or products referred to in the content. |
© 2023 by the authors. Licensee MDPI, Basel, Switzerland. This article is an open access article distributed under the terms and conditions of the Creative Commons Attribution (CC BY) license (https://creativecommons.org/licenses/by/4.0/).